
Abstract
Scholars have long debated whether welfare policymaking in industrialized democracies is responsive to citizen preferences and whether such policymaking is more responsive to rich than to poor citizens. Debate has been hampered, however, by difficulties in matching data on attitudes toward particular policies to data on changes in the generosity of actual policies. This article uses better, more targeted measures of policy change that allow more valid exploration of responsiveness for a significant range of democracies. It does so by linking multicountry and multiwave survey data on attitudes toward health, pension, and unemployment policies and data on actual policy generosity, not just spending, in these domains. The analysis reveals that attitudes correlate strongly with subsequent changes in welfare generosity in the three policy areas and that such responsiveness is much stronger for richer than for poorer citizens. Representation is likely real but also vastly unequal in the welfare politics of industrialized democracies.
The quality of democratic representation in policymaking, including in welfare state policy, remains a source of enduring and fundamental controversy in developed democracies. A key debate involves the extent to which attitudes of citizens on issues of welfare state reform actually constrain or impel policymakers to alter existing social policies in line with citizens’ wants. Some studies find solid links between opinion and policy; 1 others have found links either to be unclear, because data limitations constrain causal inference about such links, or to be weak, because real politics block any simple aggregation of citizen preferences into policy change. 2 A second, related debate concerns inequality in political representation. Recent studies, particularly of the United States, find that the average voter and certainly poorer citizens have much less influence on subsequent policy changes than wealthier citizens do. 3 The principal controversy, here, is whether such unequal democracy applies to key features of the welfare state and extends to settings outside the United States, where traditions and more inclusive institutions of governance might yield more equitable political representation.
Both debates about representation in welfare policymaking remain unresolved, in part because of serious empirical constraints. Among the most significant has been the difficulty of matching valid and systematic measures of citizen attitudes toward particular social policy reforms to measures of downstream change in social policy regulations sufficient to support meaningful causal inferences about representation. The most careful existing studies have linked attitudinal patterns of particular groups to change or incidence of policy in subsequent years. 4 But even those studies work with very rough measures of policy change, such as changes in government spending. Such measures are likely to suffer from what is known as the “dependent variable problem,” where spending metrics do not fully coincide with regulatory and legislative changes in social policies about which citizens actually express preferences. Large shifts in spending per capita can and do swing free of actual policy changes—for instance, when entitlement spending rises with higher take-up during economic downturns.
In this article we partially overcome such empirical challenges by matching the attitudes regarding social policy of (various) segments of a population to better estimates of change in the actual generosity of such policy. The former we accomplish by focusing on several waves of the multicountry International Social Science Program (ISSP) and its questions about the provision of social policy with respect to unemployment, pensions, and healthcare. The data provide leverage to measure support for these features of the welfare state validly and reliably, across respondents’ household incomes, for a considerable cross-section of countries and period of time. Equally important, we match these data to measures of changes in the programmatic generosity of the same policy areas, relying on generosity measures from the Comparative Welfare Entitlements Database (CWED). 5
On the basis of such empirical improvements, our principal expectations are twofold. First, we expect that attitudes, on average, are associated with measures of subsequent policy generosity, even if such attitudes are less associated with subsequent spending. Second, we expect that wealthier citizens influence actual social policy development more strongly than do poorer citizens, on the grounds that wealthier citizens find both formal and informal footholds for pressuring policy change. Our study supports these hypotheses in a range of models, specifications, and estimators linking individual attitudes to subsequent changes in generosity related to unemployment, pensions, and healthcare. We provide evidence that citizen preferences are not expressed in vain but tend to show up in subsequent shifts in the policy provisions of welfare states. However, not all citizens are equal in political expression. The poorest tend to have no statistically significant influence on subsequent policy changes, whereas the wealthiest do. The political economy of welfare state reform in industrialized democracies can thus best be characterized as manifesting real but unequal representation for its citizens.
(Unequal) Representation in Welfare State Policymaking?
Long-standing debate among policymakers, activists, and academics of all disciplinary and methodological stripes concerns the degree and character of political representation of broad publics and citizen attitudes in the actual development of the welfare state. The debate involves two related controversies.
One controversy questions the extent to which policymaking is responsive to the political demands of citizens. 6 In developed democracies, some modicum of representation should be broadly present, but in welfare state policymaking and elsewhere that presence is far from obvious. On the one hand, plenty of research supports the intuition that public opinion tends to translate into policy change. James Stimson, Michael Mackuen, and Robert Erikson, for instance, highlight two electoral mechanisms linking citizen preferences and policy outcomes: electoral turnover, an indirect pathway flowing from citizen preferences to election outcomes and from election outcomes to policy; and political actors anticipating electoral defeat and adapting to public preferences so as to avoid it. 7 Beyond the electoral arena, organized interests such as unions, employer associations, nongovernmental organizations, and civic associations can serve as channels by which public attitudes influence policy outcomes. 8 These mechanisms can give life to the role of the median voter in spatial theories of voting 9 or to various strains of pluralism in policymaking. 10 Empirically, many scholars have found evidence of such representation. For many polities and policy areas, studies have unearthed (causal or associational) links between public opinion and aggregate policy outputs in democracies. 11
On the other hand, much scholarship questions these findings. Some scholars have judged citizen attitudes to be so diffuse and vague, or vaguely known, as to be very blunt instruments in policymaking. 12 Important critiques of pluralism, further, have articulated why popular positions are blocked, where politics is the province of organized special-interest groups, lobbies, and elites in areas including social policymaking. 13 A related view emphasizes the relative autonomy of the state, where the prerogatives of state actors and institutions eclipse the pressure of citizen-voters for welfare state policies. 14 Consistent with these critiques is empirical skepticism that views any association between citizen attitudes and aggregate policy outcomes as (spurious) correlation rather than causation. 15
A second and related debate concerns whether there is income inequality in representation. A long tradition of Marxian and other left-wing critiques of pluralism, for instance, has explored the extent to which wealth confers political privilege. 16 Welfare state scholars have studied how economic privilege can increase political influence, a view that sits comfortably with the power-resources tradition of welfare state research. 17 Most important, perhaps, has been work on disfunctions of democracy in the United States. Pioneering studies by Martin Gilens, Larry Bartels, and others find evidence that the attitudes of the wealthiest citizens are more reflected in subsequent policy shifts than the attitudes of median or poorer citizens. 18 Here we see that the rich (e.g., the ninetieth percentile of the income distribution) get their way more than the poor (e.g., the tenth percentile) or middle-class citizens (e.g., the fiftieth percentile) in many policy areas, including social policy. The sources of such inequality can be structural or instrumental. 19 They include money in electoral politics; 20 the breakdown of organized public interests, particularly unions; 21 and underrepresentation of lower-class interests in political office and elite positions. 22 Other scholars have found income-based inequalities in representation in cross-national contexts, although the evidence is still scarce. 23 Recent work has explored how attitudes across the income spectrum relate to subsequent changes in welfare state spending, revealing in a cross-section of countries modest skews in favor of the wealthiest citizens. 24
Some scholars, however, contend that the wealthiest citizens are not necessarily better represented in social policymaking than their poorer counterparts. The pluralist perspective expects that policy can be influenced by almost any segment of the income spectrum, by virtue of political engagement through groupings such as religious organizations, unions, or poor people’s movements. 25 Recent empirical research suggesting that middle-class, median-income citizens often agree with their richest counterparts paints a portrait of less unequal representation. 26
Progress or partial resolution of both debates is constrained by important limits on the empirical work informing these debates. A first problem is that the research designs linking survey data to data on policy outcomes have limited degrees of freedom and variation over time, which severely hampers causal inferences. An attractive strategy has been to pool many surveys within a single country, linking variation in opinions across time and issues to subsequent policy changes. But this strategy limits variation in welfare state policymaking and between polities—beyond the United States, for example, with its distinctive institutions and historical legacies. Yet cross-national comparisons have focused on (at most) country-year observations and policy output in levels, in very limited pairings that lack sufficient control for inferential threats such as endogeneity and omitted-variable bias.
Endogeneity is particularly problematic in such research. 27 There are strong theoretical and empirical reasons to expect welfare policy outcomes to influence attitudes toward welfare states and not just the other way around. 28 Specifying the dependent variable in levels allows only very summary techniques to redress possible reverse causation (e.g., Hausman tests, as in Brooks and Manza, 29 and modeling some lag between attitudes and subsequent policy output). By this logic, a few scholars have provided significant improvements by focusing on multicountry survey material matched to subsequent spending changes, 30 including welfare spending. 31 But that does constrain the observations available to estimate within and between correlation between attitudes and policy change.
A second empirical shortcoming involves the weak concordance between the substance of attitudes and of political outcomes. Some studies look for correlation between attitudes about broadly described welfare provisions and policy efforts—say, total social expenditures and transfers. Given the differences in politics governing different welfare state policies (e.g., pensions versus unemployment insurance), such combinations are very rough.
A bigger problem, however, is that even the best studies matching attitudes to particular social policy efforts have focused on spending measures of such efforts. This allows substantial coverage over time, countries, and social policy dimensions, but it suffers from what the social policy literature has dubbed the “dependent variable problem.” 32 This problem is “a noticeable absence of reflection on how to conceptualize, operationalize and measure change within welfare states.” 33 As Gøsta Esping-Andersen bluntly put it, “It’s difficult to imagine that anyone struggled for spending per se.” 34 Indeed, even citizens saying they want to increase spending on social policy protections are in all likelihood saying they want to improve the level of social protection. Changes in spending reflect many developments other than the generosity of such protection, for instance higher unemployment in downturns that can increase spending even if actual protection and insurance stay the same or drop. As James Allan and Lyle Scruggs point out, “As long as the percentage growth of dependents in a program (e.g., the unemployed) exceeds the percentage per capita reduction in benefits, aggregate social spending will be higher.” 35 The problem is doubly perverse in studies that look at spending as a share of GDP, where macroeconomic downturns mean a drop in the denominator of measures of welfare effort. 36
More direct measures of benefit generosity would make much more sense. One might focus on net replacement rates, as in data gathered by the OECD and elsewhere, 37 or composites that also gauge other aspects of generosity, such as eligibility, waiting times, and duration. Such measures in fact exist, such as Esping-Andersen’s “decommodification” measures or the more refined composites developed by Scruggs and colleagues in the CWED. 38 To date, however, such measures have not been explored in relation to political representation. 39
Approach and Hypotheses
We address major shortcomings in the study of policy responsiveness by matching high-quality survey data gauging support for particular welfare policies to high-quality country-year data on such policies in subsequent years. These data improve our leverage in addressing controversies about both general representation and unequal representation in social policy spending and generosity. To guide our analysis, we focus on four hypotheses.
Our first two hypotheses concern whether citizen attitudes in the aggregate influence welfare policymaking. Although changes in public sentiments may require significant time to play out in political life, the many mechanisms linking citizen wants to legislative and executive functions in any democratic party-system ought to yield a positive connection between public opinions and subsequent policy changes.
The focus here is on subsequent change in policy effort, as opposed to levels of policy outcomes, since we want to gauge whether citizen support for more or less protection yields subsequent retrenchment or expansion in policy provisions. What “subsequent” means is an uncertain empirical issue concerning how long it takes for citizen sentiments expressed in a given year to percolate into political pressure and policy change. Note also that the hypothesis encompasses all democratic settings and all social policy dimensions. One might expect public attitudes to correlate with policy developments more strongly in some countries than others or with respect to some faces of social policy more than others. But we do not have strong theoretical priors on these issues and treat differences across countries and aspects of social policy as empirical questions.
What is crucial to this hypothesis (and those below) is that we compare attitudes on a given policy and country to subsequent changes within that same policy and country. Indeed, attitudes might vary across faces of social policy in any given country and at any given time. For instance, in a given country and year, citizens might support increased or more generous unemployment-related social benefits but the opposite with respect to pension benefits. Our first hypothesis then would imply policy expansion with respect to unemployment-related benefits and the opposite with respect to pension benefits. These results can also be pooled across policy areas, such that Hypothesis 1a predicts a general pattern of (net) representation.
Our second expectation is that a distinction should be made between subsequent change in social policy spending as opposed to change in measures of generosity. Citizen attitudes are likely to be more vague and less strongly felt with respect to broad spending measures than to actual generosity in policy-program benefits; recall Esping-Andersen’s quip that no one agitates for spending per se. In any event, changes in spending reflect economic and conjuncture-related developments and circumstances separate from the substance of social policy benefits; as noted above, in many macroeconomic conditions, spending on a program will rise or fall even if the substantive benefits provided do not change or are altered in the opposite direction to spending shifts. In contrast, changes in substantive policy generosity directly capture provisions and benefits that can be accessed (or not) by citizens and should reflect, in a way less muddied by background economic developments, citizen attitudes about and policy choices toward social policy. Such reasoning supports a second hypothesis:
The remaining hypotheses concern our second controversy about inequality in political representation. We take seriously the unresolved character of this controversy, but we expect some inequality in representation in line with earlier scholarship on the best-studied patterns in US experience. Differences in representation in non-US political systems might dampen the kinds of income-based differences in representation that have been unearthed in the US context. But even in more inclusive democratic systems, with better representation in social policymaking, wealthier citizens have more information, cognitive advantages in engaging politics, ties to elite networks, and structural power as investors and employers. 40 These considerations underlie our main expectation of income inequality of representation in social policymaking:
This hypothesis does not specify “high income” and “low income.” We treat these also as empirical questions, focusing on various measurements as explained below. The hypothesis also does not specify a priori that high- and low-income citizens should take different positions. Of course, high-income citizens are usually disproportionate net contributors to social policy, and low-income citizens disproportionate net beneficiaries, such that wealthier individuals likely prefer less expansion and more contraction in welfare generosity than do their poorer counterparts. 41 But that the attitudes of the rich should have more policy traction than the attitudes of the poor is orthogonal to our focus on actual representation. More relevant is that differences in representation may show up only when rich and poor attitudes clearly diverge, a possibility we explore empirically below.
As with Hypotheses 1a and 1b, we expect that representation of high- and of low-income citizens does not play out for spending in the same way as for benefit generosity. We expect some inequality in political representation, however welfare effort is measured. But for the reasons articulated above—that attitudes focus more on the substance of benefits than on spending per se and that spending reflects macroeconomic shifts as much as the substance of benefits—inequalities in representation should show up more strongly in subsequent changes in social benefit generosity than in spending. Hence our final hypothesis:
Hypotheses 2a and 2b are, like Hypotheses 1a and 1b, general with respect to the timing of subsequent change or the countries or aspects of welfare state policy where unequal representation is hypothesized to emerge. Differences across time-lags in policy change, between countries, or across faces of social policy are empirical questions for our analysis.
Data and Methods
To analyze the hypotheses above, we combine multiple data sets on citizen attitudes with multiple data sets on policy changes. The combination reveals matched empirical variation in both attitudes toward welfare state development and in closely related policy outputs with respect to spending and generosity—all across distinct topics or aspects of welfare policy, across a substantial cross-section of countries, and across multiple time periods. Such data allow us to explore the association between a particular group’s expressed preference for more or less of a particular aspect of welfare policy in a given country and year, on the one hand, and the subsequent change in policy generosity for that same aspect of policy within the same country-year, on the other hand.
Independent Variables: Citizen Support for Welfare State Provisions
Citizen attitudes are gathered from a single multicountry, multiwave data set, the International Social Survey Program (ISSP) time-series cross-section data, in particular the ISSP’s repeated Role of Government modules, included in four waves so far (in 1985, 1990, 1996, and 2006). These modules contain questions on social policy preferences. The most useful repeated questions ask respondents whether they want to see more or less government spending in areas of welfare policy protection, 42 and we then use the questions about three areas in particular: pensions, unemployment, and healthcare.
The repeated questions have several benefits for our exploration. They yield broad coverage spanning a relatively long time period, substantial trends in welfare state policymaking, and a range of democratic polities in North America, Europe, and Asia. In addition, they address well-defined arenas of social policy about which citizens can be expected to have opinions, and they are phrased in terms of changes relative to a status quo: whether respondents want more or less spending on unemployment, pension programs, or health. Although a nominal focus on spending is ambiguous, it connotes level of generosity (even if actual changes in spending need not covary with actual policy generosity in terms of accessibility or benefits provided). For lay citizens confronted with such a survey question, more complicated fiscal calculation is much less likely than a simple judgment of whether the substantive program should be more or less generous in its benefits and conditionality relative to the existing generosity of benefits. The survey questions gauge support for generosity or program size relative to the status quo ante and can be matched to subsequent changes in actual spending or metrics of generosity.
To gauge preferences for increased or decreased welfare provisions at different levels of the income distribution, we first recoded the answer categories such that strongly agreeing to an increase in spending was given a score of 100; agreeing was scored 50; neither agreeing nor disagreeing was scored 0; disagreeing was scored −50; and strongly disagreeing was given a score of −100. 43 Since the precise position of low and high incomes is somewhat arbitrary, we focus on four different but common conceptions of “low versus high” income: the first versus third terciles, the first versus fifth quintiles, the tenth versus ninetieth percentiles, and the fifth versus ninety-fifth percentiles.
Our measurement of attitudes across levels of income relies on ISSP measures of household income. These income measures are not without their problems, mainly arising from variation in question wording across participating countries. Some countries ask for gross income and others ask for net income; some ask for monthly income and others ask for annual income; and some describe sources of income in the question whereas others do not. 44 This diversity complicates comparisons of the same income groups across countries. For the study of inequalities in representation, however, the obstacle is modest, because we compare rich and poor within the same country in a standardized way—a comparison that should not be biased by differences in the income question. We expect the measure systematically and meaningfully to capture how different income segments in a country-year perceive social policy relative to one another. 45
To gauge general spending preferences, we focus on two measures: the preference of respondents at the fiftieth income percentile and the average preference of all respondents combined; the latter is not dependent on the survey’s income measures. For our measures across the income spread of the ISSP samples, we calculate scores at the various percentiles by regressing the recoded questions on household income and its squared term (using probability weights) and taking the resulting predicted scores at the indicated points in the income distribution. This approach follows Gilens 46 and addresses the fact that different ISSP countries have different income categorizations.
To give a descriptive overview of our opinion measures, Figure 1 presents the sample means for the tenth, fiftieth, and ninetieth income percentiles pooled across all sampled countries. Clear and expected differences are revealed between low and high incomes: low-income respondents want more generous social policies than high-income respondents. Also, general demand for increased welfare effort is most pronounced for healthcare and pensions. In the case of unemployment, high-income respondents wish to see slightly less spending or welfare effort, low incomes wish to see slightly more, and the mean for the fiftieth percentile (as well as the overall mean) is close to zero. Comparing the different policy areas also shows that the differences between low and high incomes are largest for unemployment (twenty-eight percentage points between the tenth and ninetieth percentiles) and pensions (twenty-three percentage points) and smaller for healthcare (thirteen percentage points).
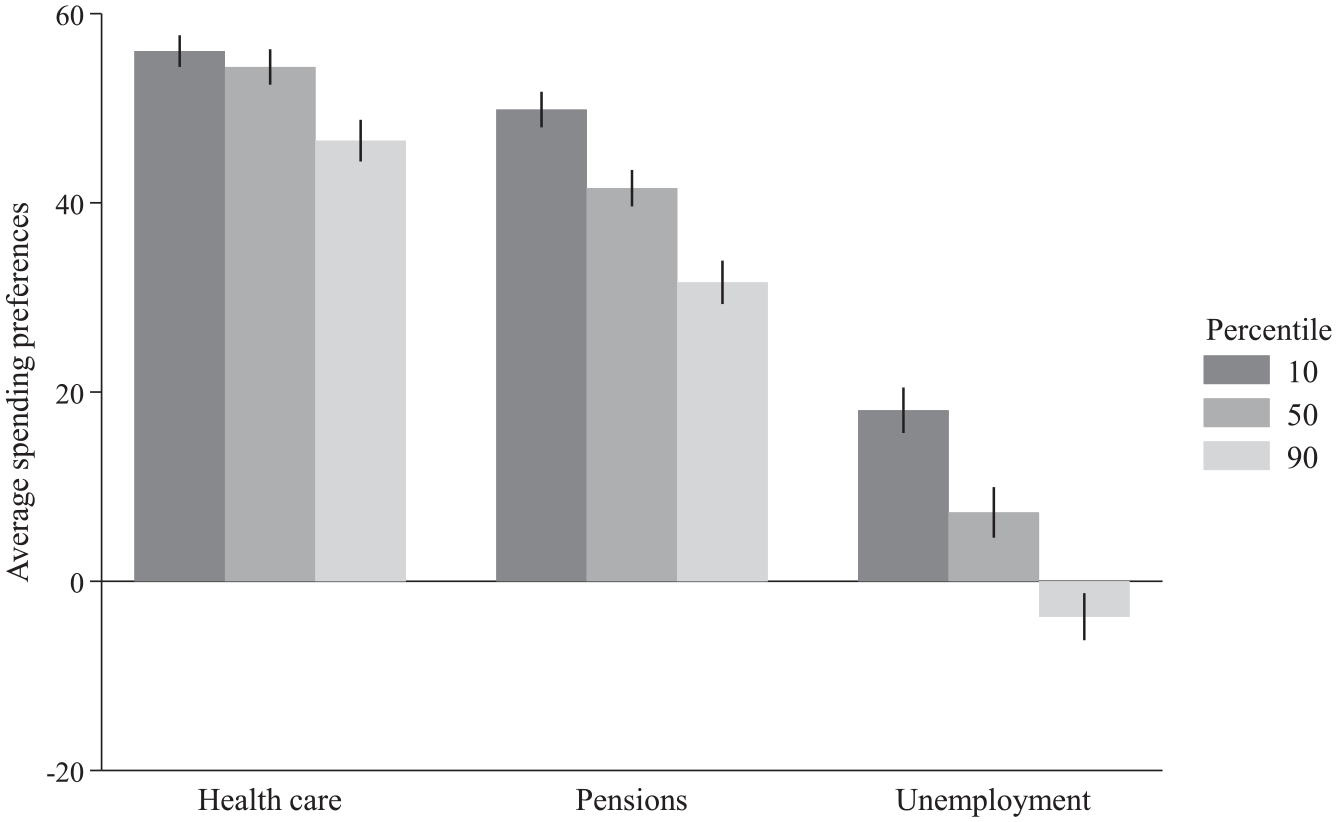
Mean Spending Preferences of Low and High Incomes by Policy Area.
Dependent Variables: Changes in Spending and in Generosity Outcomes
Our dependent variables consist of policy changes regarding the welfare state. One set of measures involves changes in government spending on healthcare, pensions, and unemployment—measured separately so as to be matched to the specific breakdown of the ISSP questions—and with the spending measures taken per capita. 47 We focus on public and mandatory private spending in 2010 US dollars and purchasing power parity. Our second set of measures is based on the CWED and addresses substantive policy generosity. 48 The CWED contains several measures of welfare state replacement rates, benefit duration, benefit eligibility, and coverage or take-up rates with regard to sickness, pensions, and unemployment. Improving on Esping-Andersen’s concept of decommodification, the CWED combines these measures into indices of welfare state generosity for each of three policy areas: pensions, unemployment, and sickness. We look at precisely these policy-specific measures of generosity because they parallel the spending measures and can be matched to the ISSP questions about pensions, unemployment, and healthcare. The fit between the ISSP survey topics and the CWED generosity topics is one-to-one for pensions and unemployment assistance. But the overlap is less than one-to-one for healthcare and sickness: the ISSP questions address healthcare, whereas the CWED focuses on sickness provisions—the former being a broader palette of provisions. Still, sickness benefits are an important component of healthcare and can plausibly proxy for the broader realm of health policy. But our analysis, both pooled and disaggregated by topic, allows us to explore these issues empirically.
We operationalize policy outcomes by focusing on changes in spending and in generosity, in these particular areas, that can then be paired to the ISSP questions about healthcare, pensions, and unemployment. We focus on changes rather than levels because we are interested in how attitudes about reform relate to subsequent reform, both of which involve changes, not levels. In particular, we are exploring whether the political system responds to attitudes about welfare policy change (our explanatory variable of interest), not about a general level or kind of social policy form. And whether there is responsiveness to such attitudes should be gauged not in terms of the status quo ante level of policy but in terms of reform, expansion, or retrenchment relative to a status quo ante—hence, a change.
Therefore, if respondents express a preference for increased spending, and in the years after the survey was conducted the policy becomes more generous, we take this change as evidence of representation for that group or person. Equally, we see representation in situations where a group expresses preference for decreases and policy becomes less generous in subsequent years. We have no strong a priori reasons to presume that it takes a particular time for public positioning to translate (or not) into actual policy or political changes. The baseline models look at the average change in the four years following the survey for each feature of social policy. For unemployment insurance (UI), for instance, the baseline measure of average change is [(UI(t + 1) − UIt ) + (UI(t + 2) − UIt ) + (UI(t + 3) − UIt ) + (UI(t + 4) − UIt )] / 4. 49 As robustness checks, we consider other time periods.
The correlation between changes in spending per capita and changes in generosity is not strong—unsurprising, given that spending patterns reflect not just substantive policy orientation but also macroeconomic developments with no clear relation to such orientation. The overall correlation is 0.20, varying from 0.08 for healthcare to 0.50 for pensions. The correlation between levels of spending and levels of generosity is not much higher (r = 0.26). 50 According to the CWED-based measures, the most generous countries in terms of benefit levels are those known to have an extensive welfare state: Norway and Sweden, followed by the Netherlands and Finland. The Anglo-Saxon and Asian countries are at the bottom. On the other hand, the Scandinavian countries are in the middle of the pack in spending per capita, joined by the United States and Japan. For any judgment of representation over modest periods of time, however, it is changes in generosity or spending that matter, not simple background levels.
Figure 2 provides a snapshot of the country-means of the average change in generosity in the four years following the survey. 51 All variation across time and issue areas (unemployment, pensions, healthcare/sickness) is smoothed over, but the substantial variation between countries is summarized. The welfare state clearly becomes more generous in some countries (South Korea, Portugal) and less generous in others (Sweden) by the CWED benefit-generosity metric. The trends broken out by policy area (not shown) vary somewhat, underscoring the importance of estimating not just the pooled composite but also area-specific models.
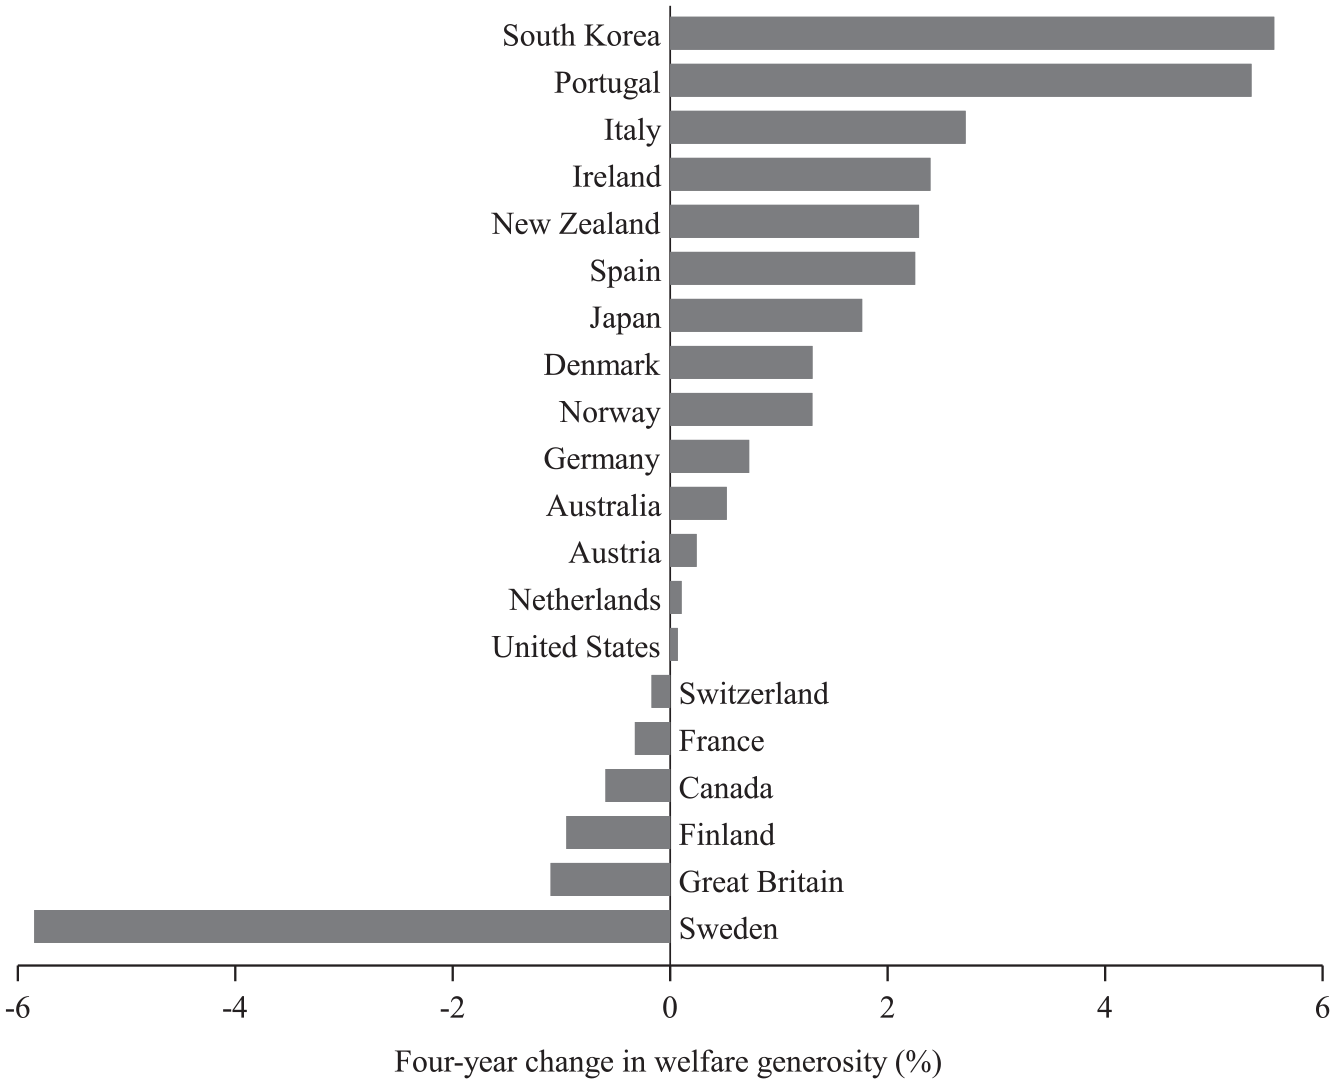
Average Change in Welfare State Generosity in the Years following the ISSP.
Bringing these data together to match measures on attitudes to measures on policy changes allows one to judge the extent to which citizen support for welfare expansion (retrenchment) is translated into actual policy expansion (or rollbacks). This exercise can be imagined in terms of broad country-level differences in a given policy area, where one looks at, say, the attitudes of the wealthiest ninetieth percentile toward unemployment protection in relation to subsequent policy change in such protection. 52 For our full exploration, however, we want to exploit the more fine-grained character of our data: valid measures of attitudes toward welfare policy change and actual subsequent policy change for a given country-topic-year. Thus we can measure policy attitudes and subsequent policy change for a citizen group (e.g., median-income group vs. poorest vs. richest) in a given country with respect to a given welfare-policy topic for a given year. Substantial leverage is provided to gauge the responsiveness of policy to group demands on issues of welfare policymaking.
To get the most out of this leverage, our baseline analysis focuses on a pooling of all the information for a given country-topic-year. Pooling is possible so long as we focus on how the expressed attitudes for a given country-topic-year relate to subsequent policy change for that same country-topic-year. And such pooling is meaningful because the policy measures are based on standardized measures of group attitudes and of subsequent policy development. The attitudes are gauged by standardized survey answers within a single survey instrument (ISSP), and the outcomes focus on standardized changes in spending or generosity: for spending, we look at changes in expenditures per capita; and for generosity, we look at changes in z-score composites of generosity. Hence, one can compare an association (or lack of association) between group attitudes and subsequent policy for a given group-country-topic-year with the association (or lack of association) between group attitudes and policy for another group-country-topic-year. The principal advantage of such pooling is twofold: it allows us to paint a broad portrait of responsiveness in the welfare state, and it yields sufficient degrees of freedom to include substantial country-year controls without excessive collinearity, thereby facilitating more valid econometric estimation of responsiveness.
Although the full pooling of observations provides the most complete view of representation in social policymaking, one can also look at particular subsets of the data. Doing so is meaningful, however, only to the extent that the data include sufficient variation on a given dimension to allow comparisons and statistical control without excessive multicollinearity between parameters estimated. Within such constraints, our data provide sufficient country-year variation to allow meaningful analysis of responsiveness with respect to individual topics or aspects of social policy—that is, judging the extent of representation for either UI, or pension provisions, or health/sickness (where the unit of analysis is country-year for each of these policy areas). The downside of focusing on a single policy realm is that the data are more constrained in degrees of freedom, but there is enough variation for meaningful analysis to clarify how responsiveness might vary by aspect of social policy. Unfortunately, the data are more constrained for exploring variation within a particular country. Ideally, one could also focus on topic-year variation within a given country—but such variation is modest enough to generate prohibitively high multicollinearity between variables. In other words, in the currently available comparable data, the “between” variation across countries and topics is much more substantial than the “within” data across time (or across topics within a given country). One can say less than one would like about the role of institutions where most variation is between rather than within countries. Nonetheless, our analyses below do consider and discuss such specifications focused on institutional and other possible country-level factors. And what is more fundamental, all the models presented below consider country-level clustering—for example, through country-level random intercepts.
Looking at either the full country-topic-year variation or the country-year variation for a given topic, hence, we follow an estimation strategy to generate valid inferences about how attitudes relate to subsequent policy reform. The strategy involves estimation of representation that controls for possible confounding factors, those that correlate with both the measured citizen attitudes and changes in welfare state effort. To control for the “thermostat-model” possibility that past policy may influence subsequent attitudes, we include the ex ante level of social policy generosity (matched to each country-topic-year). 53 Other controls include GDP per capita (measured in constant 2010 US dollars) in a country, annual growth in GDP per capita per country, unemployment rate, and dummies for both the policy area and survey wave. To address omitted-variable bias, our baseline focuses on these controls measured at time t rather than later periods. 54
Equally important, our specifications of estimators and clustering support meaningful causal inferences about general and unequal representation in the light of common threats to such inference. To highlight such inferences, we look at three sets of specifications. The first set pools the three areas of policy (unemployment, pensions, and healthcare), focusing in our baseline on two-level random intercept models—country-topic-year (level 1) and country (level 2)—thereby explicitly taking account of the possible country-level clustering of policymaking experience. For these models, we include dummies for survey waves and the policy topics (health policy as excluded dummy).
The second set of baseline specifications disaggregates the three policy topics, focusing on two-level random intercept models—country-year (level 1) and, again to address the country-level clustering, country (level 2) for each policy area. For both the pooled and disaggregated models, we test for general representation by focusing on the median or overall opinion (in separate models). And we test for unequal representation by focusing in our baseline estimations on the roles of low- and of high-income attitudes in a single model, so as to consider their relative correlation with subsequent policy change. This is the simplest way to address how rich and poor might have distinct effects, the one having an association controlling for the influence of the other. 55 For all these models, further, the coefficients are ordinary least squares, with robust-cluster standard errors (clustered by country, the level 2 variable) to address remaining country-specific correlation of errors and heteroscedasticity of errors.
Finally, a third set of specifications focuses on important alternatives to these pooled and disaggregated baseline models. These alternative specifications include different measures of unequal representation, such as direct measures of arithmetic differences between the attitudes of the rich and the poor. But the alternative models also include different specifications with respect to controls, embedding of the multilevel data, and alternative estimators.
Findings: Real and Unequal Representation
We present our findings taking each of the three sets of estimations in turn. We shall devote the most attention to our first set of estimates, the baseline pooled results. We lay out in our discussion not only the basic quantitative results, in the next subsection, but also some historical examples drawn from those results in the following subsection. In view of the space constraints, the remaining two estimation steps involve minimal discussion in text of the policy-specific subsamples (“Disaggregated Results,” below) and of various alternative specifications, such as addressing additional country-level controls (“Alternative Specifications,” below). We hence signal the basics and relegate the fuller results to supporting material.
Baseline Pooled Results
Table 1 presents the results of pooled estimation (country-topic-year) of changes in CWED generosity of unemployment, pensions, and health/sickness provisions. The random intercept models use as the dependent variable the average change in welfare generosity in the four years following the survey—allowing direct testing of Hypotheses 1a and 2a. Before turning to the variables of interest, note that most control variables have little discernible effect on changes in welfare state generosity, although such controls do perform in expected directions and are close to significance in some specifications (e.g., looking at unemployment and pensions, as opposed to healthcare). The most significant controls are the dummies for the different policy areas (unemployment and, to a lesser extent, pensions), suggesting that the four-year change in generosity was more positive in those areas than in healthcare. The dummy for the second wave of the ISSP (around 1990) also has a significant, positive effect, while the generosity level has a slightly negative effect.
Random Intercept Models of Changes in Welfare State Generosity (Average Change from T + 1 to T + 4 relative to T).
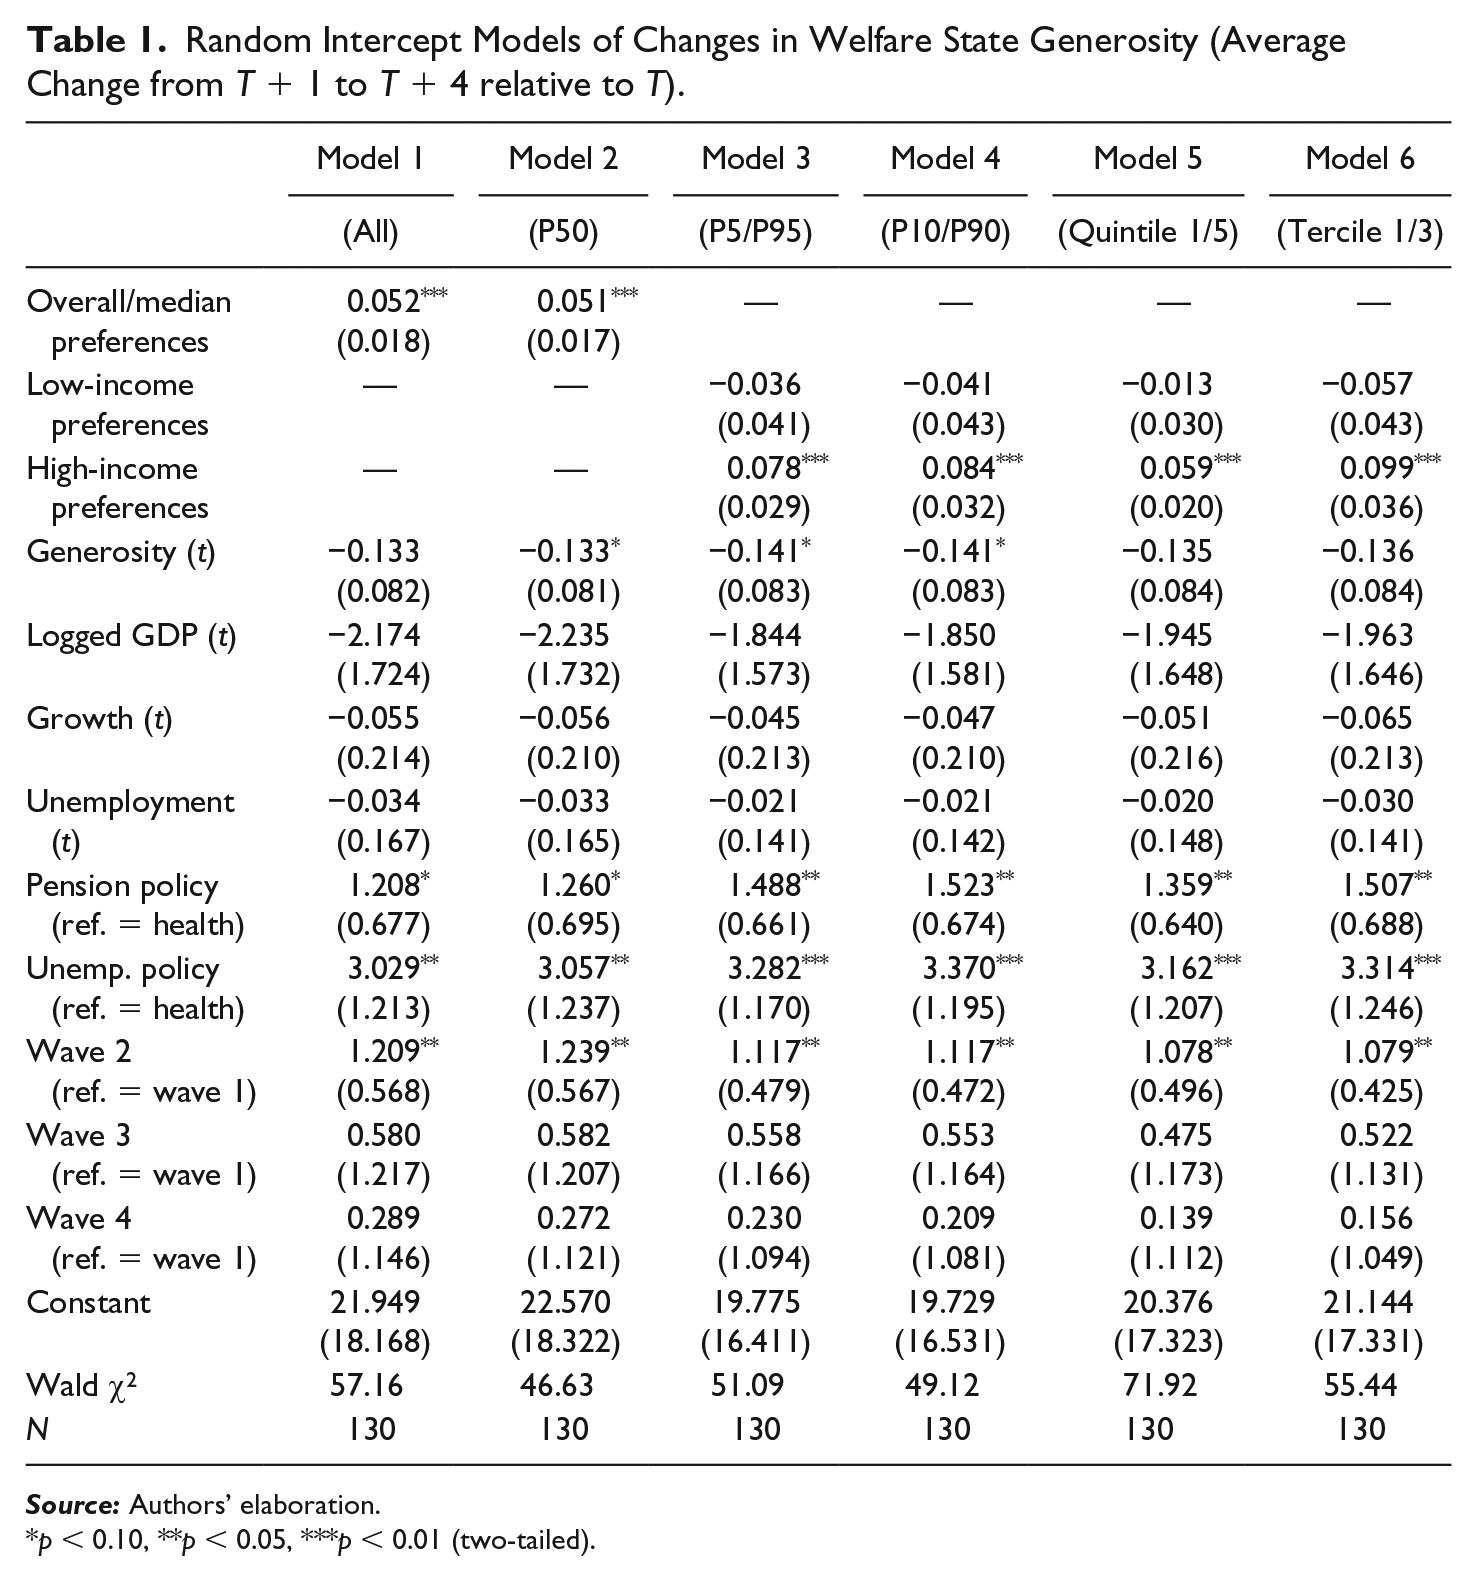
p < 0.10, **p < 0.05, ***p < 0.01 (two-tailed).
Most important, the main results corroborate Hypotheses 1a and 2a. With respect to Hypothesis 1a on general representation, both measures of overall preferences—the median and full-sample mean—have substantial and significant positive effects on changes in welfare state generosity. For instance, an increase in overall spending preferences of one standard deviation (24.27) increases the change in generosity by 1.27 points, about a third of its standard deviation. Welfare reform is clearly, by this reckoning, anchored in citizen demands.
With respect to Hypothesis 2a, Models 3–6 suggest a clear pattern of unequal representation: each low-income measurement (the fifth percentile, the tenth percentile, the lowest quintile, and the lowest tercile) has a negative but generally insignificant association with changes in generosity, while each high-income measurement (the ninety-fifth percentile, the ninetieth percentile, the highest quintile, and the highest tercile) has a positive and significant effect. For instance, an increase in the spending preferences of the ninetieth income percentile by one standard deviation (26.63) increases the change in generosity by 1.44 points, about 40 percent of its standard deviation.
Figure 3 displays the predicted values of our dependent variable by spending preferences of the tenth, fiftieth, and ninetieth income percentiles, corresponding to Models 2 and 4 in Table 1. 56 Other variables are held at their means. Preferences of low-income respondents are thus shown to have no discernable effect on the dependent variable, while the preferences of median and high-income respondents do have an effect. Figure 3 illustrates that the standard errors are substantial where the limited number of observations yields large confidence intervals. While this highlights the need to consider other specifications before drawing conclusions, it is clear that the most general baseline estimates focused on generosity support the view from Hypotheses 1a and 2a that welfare policymaking entails real but unequal representation.
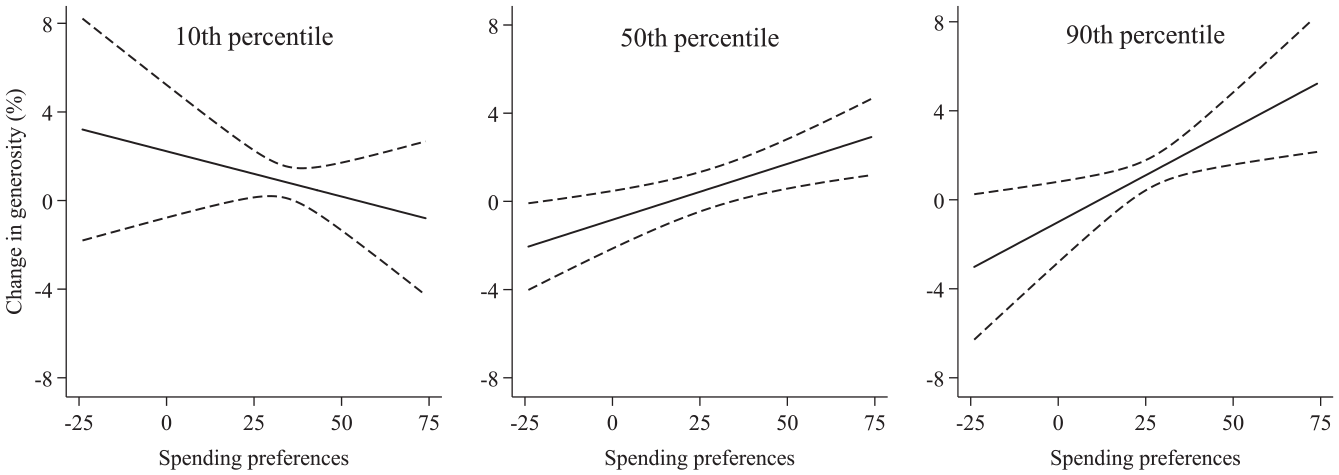
Predicted Values of Changes in Welfare State Generosity by Preferences of Low-, Median-, and High-Income Respondents.
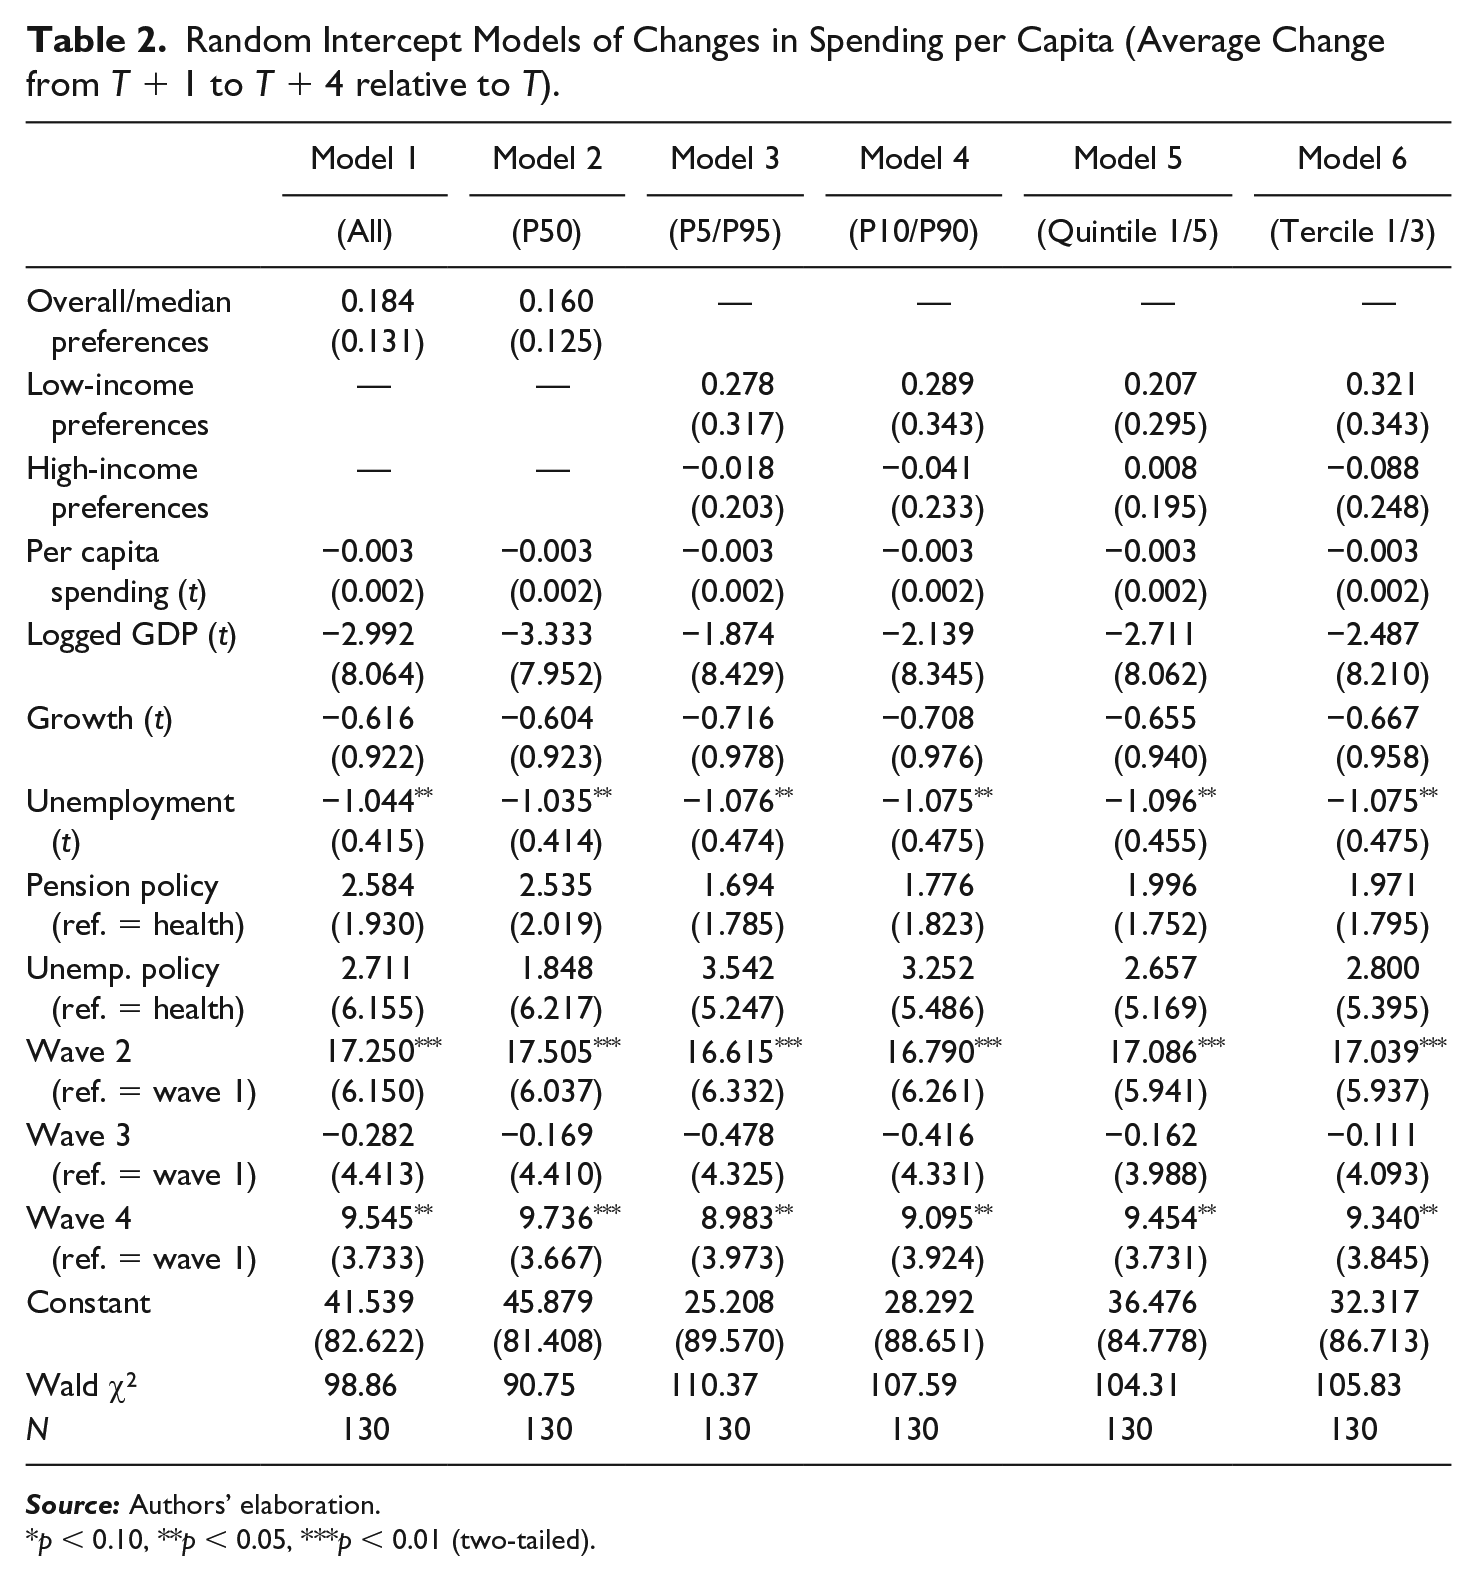
This support for Hypotheses 1a and 2a contrasts with what we see if we turn to spending patterns. Table 2 presents how attitudes correlate with our second measure of policy change: spending per capita. We run random intercept models using as the dependent variable the average change in spending in the four years following the survey. The first two models again contain measurements of overall opinion, first via the average preferences of all respondents and the second via preferences at the fiftieth income percentile. Models 3–6 then focus on the various measures of low and high income.
Random Intercept Models of Changes in Spending per Capita (Average Change from T + 1 to T + 4 relative to T).
p < 0.10, **p < 0.05, ***p < 0.01 (two-tailed).
Overall, low-, median-, and high-income preferences never have a clear or significant effect on changes in spending. The implication is that income groups are equally ignored in their views toward the welfare state. These patterns go against Hypotheses 1a and 2a, and they tell a different story from that of the generosity measures, even when conditions that might underlie the biasing effects of the spending-based measure (e.g., unemployment rates) are controlled. But of course this contrast with the results focused on generosity measures is very much in line with the expectations captured by Hypotheses 1b and 2b. We expect macroeconomic conditions and the substantive policy interests of citizens to render a weaker link between citizen attitudes and spending than between citizen attitudes and substantive policy generosity. The contrasting patterns in Tables 1 and 2 support this view.
A final point based on the baseline results: they harbor an important pattern of (unequal) representation as being symmetrical, relevant to not only welfare state expansion but also retrenchment. Supplemental analysis shows, more generally, that in the cases where the positions of wealthy and poorer respondents differ significantly, the wealthy tend to win out. In the twenty-seven country-years of UI cases in which the ninetieth income percentile mostly favors less unemployment protection, the average change in generosity is −0.63 percent. And in the sixteen country-years of UI observations where the ninetieth percentile mostly favors more unemployment protection, generosity increases on average by 3.64 percent. 57 The full picture from our data, hence, suggests real but unequal representation in social policy generosity, although not manifested so much in spending patterns.
Historical Examples Drawn from the Baseline Statistics
These various baseline results can be made more concrete by looking briefly at particular historical examples from our data. In view of space constraints, we look at only three examples; they illustrate unequal representation across countries (the United Kingdom, South Korea, and Sweden), across social policy areas (UI and pensions), and across directions of substantial reform (policy retrenchment and expansion).
The first example from our data set is the highly salient and major retrenchment of UI in Great Britain in the 1980s. Remember our data set’s coding of attitudes toward increased UI: “strongly supporting” scored as 100; “agreeing” scored as 50; “neither agreeing nor disagreeing” scored as 0; “disagreeing” scored as −50; and “strongly disagreeing” scored as −100. With such coding, the 1985 ISSP survey for British respondents revealed big differences in the attitudes of poor, median, and rich respondents: the tenth percentile scored 36.7 (constituting substantial support for increased UI); the fiftieth percentile scored a mere 13.9 (on balance wanting more UI, although less than poorer counterparts did); and the ninetieth percentile scored −5.2 (wanting on average a decrease in UI). As for actual policy change in Great Britain, our data set shows that the subsequent four-year period was marked by a 3.1 percent decrease in UI, among the three biggest single-period decreases in unemployment generosity in our data.
To put a bit of historical flesh on these bones, recall that this quantitative pattern describes an important episode in Thatcher-era British welfare retrenchment. Building on reforms that started in 1980 but continued throughout the 1980s, the Thatcher government took advantage of what Paul Pierson called “a considerable gap between the lowest and top income groups in support for unemployment benefits,” in which wealthy party backers and Tory elites widely embraced the idea that UI “produced a ‘why work?’ question” and needed to be scaled back. 58 The Thatcher government used its substantial parliamentary majority and executive authority to retrench benefits repeatedly—among other rollbacks phasing out earnings-related supplements in 1980 and 1988, lowering replacement rates in 1986, extending disqualification periods in 1986, tightening contribution conditions in 1988, and shifting the long-term unemployed to the means-tested Supplementary Benefit by 1989. As Anthony Atkinson and John Micklewright noted, by the late 1980s the Conservative government had adopted no fewer than seventeen significant changes in the Unemployment Benefit, almost all unfavorable to benefit recipients. 59 Linking this historical interpretation to our statistical analysis, we have a stark case where the rich, in their clear preference for UI retrenchment, enjoyed a level of representation in the Thatcher government not afforded the median and especially not the poorer electorate who wanted continued or expanded UI benefits. As regards generosity, hence, British unemployment policymaking was marked in the 1980s by clearly unequal representation. Interesting for our analysis, and in line with our statistical support for Hypotheses 1b and 2b, the pattern in spending in the early to mid-1980s suggests a different story. As Allan and Scruggs note, increasing reliance by growing legions of unemployed citizens on whatever UI was available in the period meant that “social spending grew during the British recession of the early 1980s, even though the Conservative government slashed entitlements.” 60
A second historical snapshot from our data set concerns UI expansion in South Korea in the 2000s. The 2006-South Korea-UI data point in our data set reveals support for UI expansion of 29.0 for the lowest tenth percentile, 25.9 for the fiftieth percentile, and 16.5 for the richest ninetieth percentile. Note that although there is clearly a familiar skew across the income spectrum in respondents’ support for UI expansion, even the wealthiest respondents preferred UI expansion rather than retrenchment. As for actual policy development, South Korean UI started even in 2006 from a very low level of benefit generosity, as shown by the CWED data, but experienced no less than an 11.1 percent increase in generosity score for UI in the period between 2007 and 2010 (t + 1 to t + 4 for 2006), among the highest single-period increases in the data set.
Making such policy changes more concrete, the South Korean Ministry of Employment and Labor reports major legislative changes in UI in the period between 2006 and 2011. For instance, after 2006 self-employed persons were allowed to join the Employment Insurance programs for income protection and job skills development, and in 2010–11 premiums were increased from 0.9 percent to 1.1 percent. 61 A distinct South Korean story of representation is revealed, and in this particular case it is not necessarily a highly unequal one. But it is certainly one where the substantial increase in South Korea’s UI generosity was subsequent to support for expansion expressed not only by the median and poorer citizens but also by the wealthiest ninetieth percentile (for that matter, the wealthiest ninety-fifth percentile of the Korean population). This pattern comports with the history of legislative and regulatory reform politics underlying the changes, originating from within the labor and finance ministries and not just from social actors. And the chaebol-based employers associations recognized that their workers’ vulnerabilities might necessitate some government support. Employers, for example, sparked and tolerated calls for expanding UI as, in part, the price of their explicit lobbying for labor-market deregulation. 62
A third and final historical example drawn from our baseline models concerns Swedish pension-system retrenchment in the 1990s. Our data point for 1996 Swedish pensions captures positive citizen support—that is, a preference for expansion in the pension system—across the entire income spectrum of Swedes. But the level and unanimity of support was sharply declining with respondent income, with a score of 40.5 for the poorest tenth percentile and 16.1 for the ninetieth percentile (11.7 for the ninety-fifth percentile). As for outcomes, our baseline estimate shows that the subsequent four years yielded a substantial 7.4 percent decline in CWED-measured generosity of pensions, among the largest retrenchments in our data set. As this retrenchment goes against general citizen support for pension expansion, it rates as policy nonrepresentation, mainly for the poorer Swedes most supportive of expansion.
In actual policy history, however, this episode mainly provides further illustration of a pattern of unequal representation. The policy reforms after 1996 involved a major retrenchment of the Swedish pension system, particularly through the legislated move from a flat benefit system and earnings-related supplement toward a defined-benefit pay-as-you go system. 63 In the details, the reform was regressive beyond what our own data captures: whereas prereform pension contributions were borne by employers, postreform they were evenly divided between employers and employees; and two-thirds of Swedes, particularly those working fewer than forty years, would be losers of the new index rules, yielding a substantial reduction in redistribution. 64 As such, the reform clearly did not go against the (more tepid pro-expansion) wishes of the wealthiest citizens so much as against the (broader and stronger) wishes of the poorest. In Swedish political history, the mobilization behind the pension reform involved a grand coalition among social actors and parties. The Swedish Employers Federation (SAF) had been calling for some years for radical pension reform on grounds that the old system eroded national savings, inflated nonwage labor costs, and reduced incentives to work. 65 And beyond the sustained support from the center-right and (neo-)liberal Moderate Party, Center Party, and Liberals, the center-left Social Democratic Party (SAP) and union federation also accepted the reforms as a painful necessity. With the costs of the pension system becoming onerous—growing from 4.3 percent of GDP in 1965 to more than 12.2 percent in 1992—the SAP saw that “retrenchment was a painful necessity brought on by the economic crisis and an opportunity to preserve the basic structure and scope of the pension system by correcting its perceived weaknesses.” 66 These politics may constitute some nonrepresentation generally, but they are certainly consistent with our hypothesized unequal representation, with the lower support for pension expansion among the wealthy compared to the poor constituting a permissive condition for reforms skewed in favor of the demands and interests of wealthier Swedes.
These three historical examples provide only the briefest illustration of the broader statistical patterns of unequal representation (illustrating Hypotheses 1a and 2a), mainly with respect to generosity rather than spending measures (illustrating further, hence, Hypotheses 1b and 2b). They also highlight the importance of considering details in the specification of the relationships between income and welfare reform—starting with the story of each welfare policy realm separately.
Disaggregated Results by Policy Area
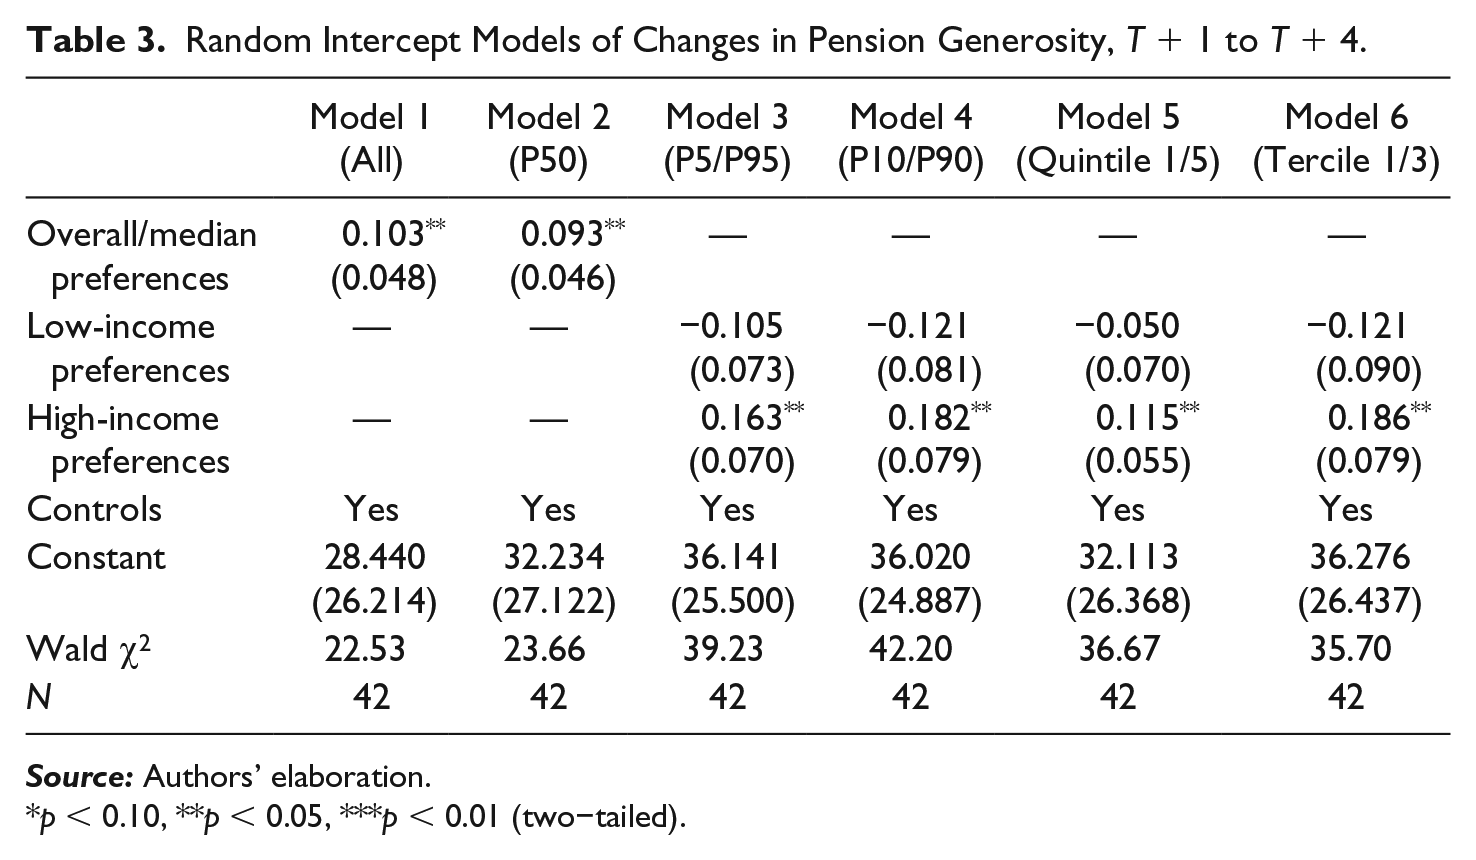
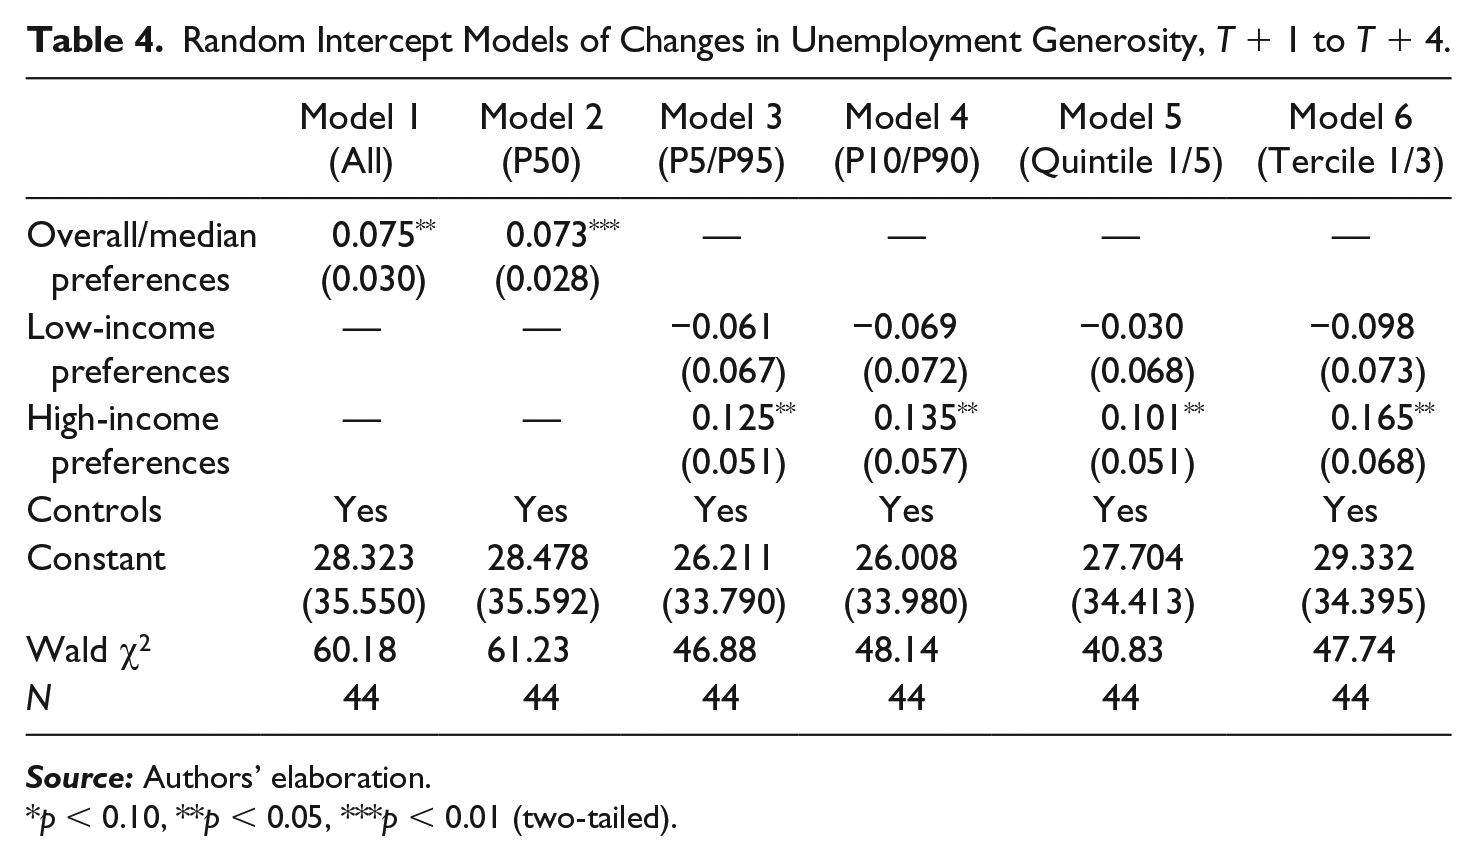
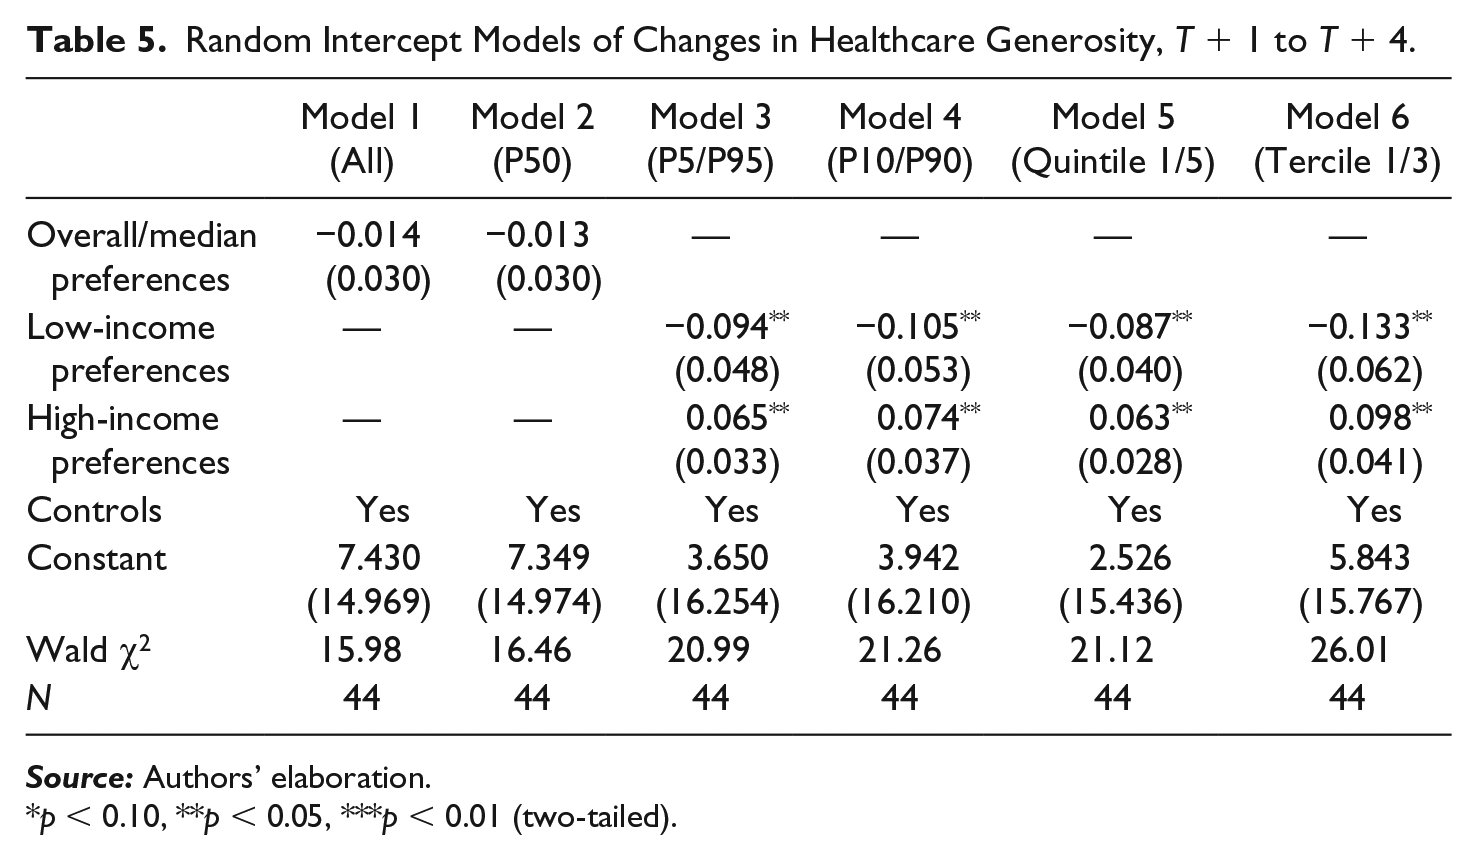
We now turn, hence, to the fuller disaggregation of the three policy realms underlying these pooled results. We look at the generosity-based results, summarized in Tables 3–5: pensions (Table 3), unemployment (Table 4), and healthcare/sickness (Table 5). These are based on the same specifications as in the pooled results of Table 1, although here the data structure is country-year for each issue area, and to conserve space we do not report the results for the controls.
Random Intercept Models of Changes in Pension Generosity, T + 1 to T + 4.
p < 0.10, **p < 0.05, ***p < 0.01 (two−tailed).
Random Intercept Models of Changes in Unemployment Generosity, T + 1 to T + 4.
p < 0.10, **p < 0.05, ***p < 0.01 (two-tailed).
Random Intercept Models of Changes in Healthcare Generosity, T + 1 to T + 4.
p < 0.10, **p < 0.05, ***p < 0.01 (two-tailed).
The disaggregated results broadly corroborate the pooled generosity-based results on the inequality of representation, but they do reveal meaningful cross-issue variation with respect to general representation. The differential in responsiveness to low-income versus high-income groups shows up for each of the three social policy areas. A noteworthy difference is that the coefficient for low-income preferences is significantly negative in some models for sickness/healthcare (Table 5). The modest degrees of freedom demand extra caution in drawing inferences, but such a pattern suggests that policymaking yields healthcare changes in the opposite direction to that embraced by the poorest citizens. Whatever the interpretation, the analysis suggests unequal representation favoring the rich over the poor across the distinct social policy realms of pensions, unemployment, and healthcare.
The disaggregated results also suggest that the effects of overall or median preferences are stronger for pensions and unemployment (Tables 3 and 4, respectively) and weaker or nonexistent for healthcare (Table 5). 67 This may reflect measurement shortcomings discussed above: that our ISSP measure of healthcare attitudes does not match up as fully with the policy-change measure (focused on sickness generosity) as do pension and unemployment measures. However, the weaker correlation between general attitudes and subsequent healthcare-related policy change might reflect substantive differences in politics across the issue areas. For instance, health-benefit politics may be subject to less mass-politics mobilization, aggregating public opinion, or to more interest-group lobbying, dampening the influence of public opinion, than applies to unemployment or pension policymaking. 68 Or perhaps the difference in responsiveness reflects variation in salience across issue-country-years proportionate to how much a political system responds to the pressure of public opinion. 69 Unfortunately, our data set’s coverage is too limited to allow exploration of these and other explanations, something we leave to future research.
We shall not dwell on the spending-based specifications, as they generally yield nonsignificant results for each of the policy areas that are very similar to Table 2’s pooled results. 70 But it is worth reporting that with respect to pensions we do see a pattern of real and unequal representation. Attitudes among those in the fiftieth income percentile correlate with spending changes in pension programs; the ninetieth percentile correlates particularly strongly (statistically and substantively) while the tenth percentile does not. This pattern applies to both spending per capita and spending as a percentage of GDP. Significantly, it reflects that pensions are the policy area where the change in spending is correlated most strongly with the change in generosity. These findings add up to marginally stronger support for Hypotheses 1a and 2a and also additional support for Hypotheses 1b and 2b.
Alternative Specifications
Our last set of results involve the most important robustness and sensitivity checks: (1) alternative measures of policy changes as dependent variables; (2) different measures of support for social policies and inequalities in representation; (3) additional and alternative controls that might distinguish the politics of representation between countries; and (4) alternative estimators and embedding of the analysis of such representation. We summarize only briefly the most important alternatives, relegating fuller discussion and detail to online-only Supplementary Appendices.
A first set of alternative specifications explores different generosity measures and different combinations of years of policy change. Most noteworthy is that the baseline results, both pooled and disaggregated, hold up to specifications of policy generosity looking only at replacement rates of unemployment, pension, and sickness provisions—the components of CWED generosity measures that maximize coverage in terms of country-years matched to the ISSP data waves (yielding 161 country-topic-years, instead of 130 in the pooled baseline). 71 Also, changing the time period of change to three or five years does not substantially change the effects, the former slightly decreasing the effect size of high-income preferences and the latter increasing it. 72
A second set of tests explores alternative approaches to measuring the attitudes of low-income and high-income citizens and the responsiveness of subsequent policy change to such attitudes. One alternative approach to the models above is to look at the share of respondents who support more spending minus the share of respondents who support less spending, for different income groups. The resulting variables correlate strongly with our main independent variables (r = .99) and yield very similar results, which is important in addressing the possibility that our reported models might inappropriately presume equal distances between answer categories. Another measurement approach for our independent variables would estimate separate models for low and high incomes. In these results, high-income preferences have a stronger effect than low-income preferences, although in some specifications low-income attitudes also have significant (if lower) influence. 73 Unlike the baseline, of course, such results take no account of the attitudes of low-income relative to high-income respondents.
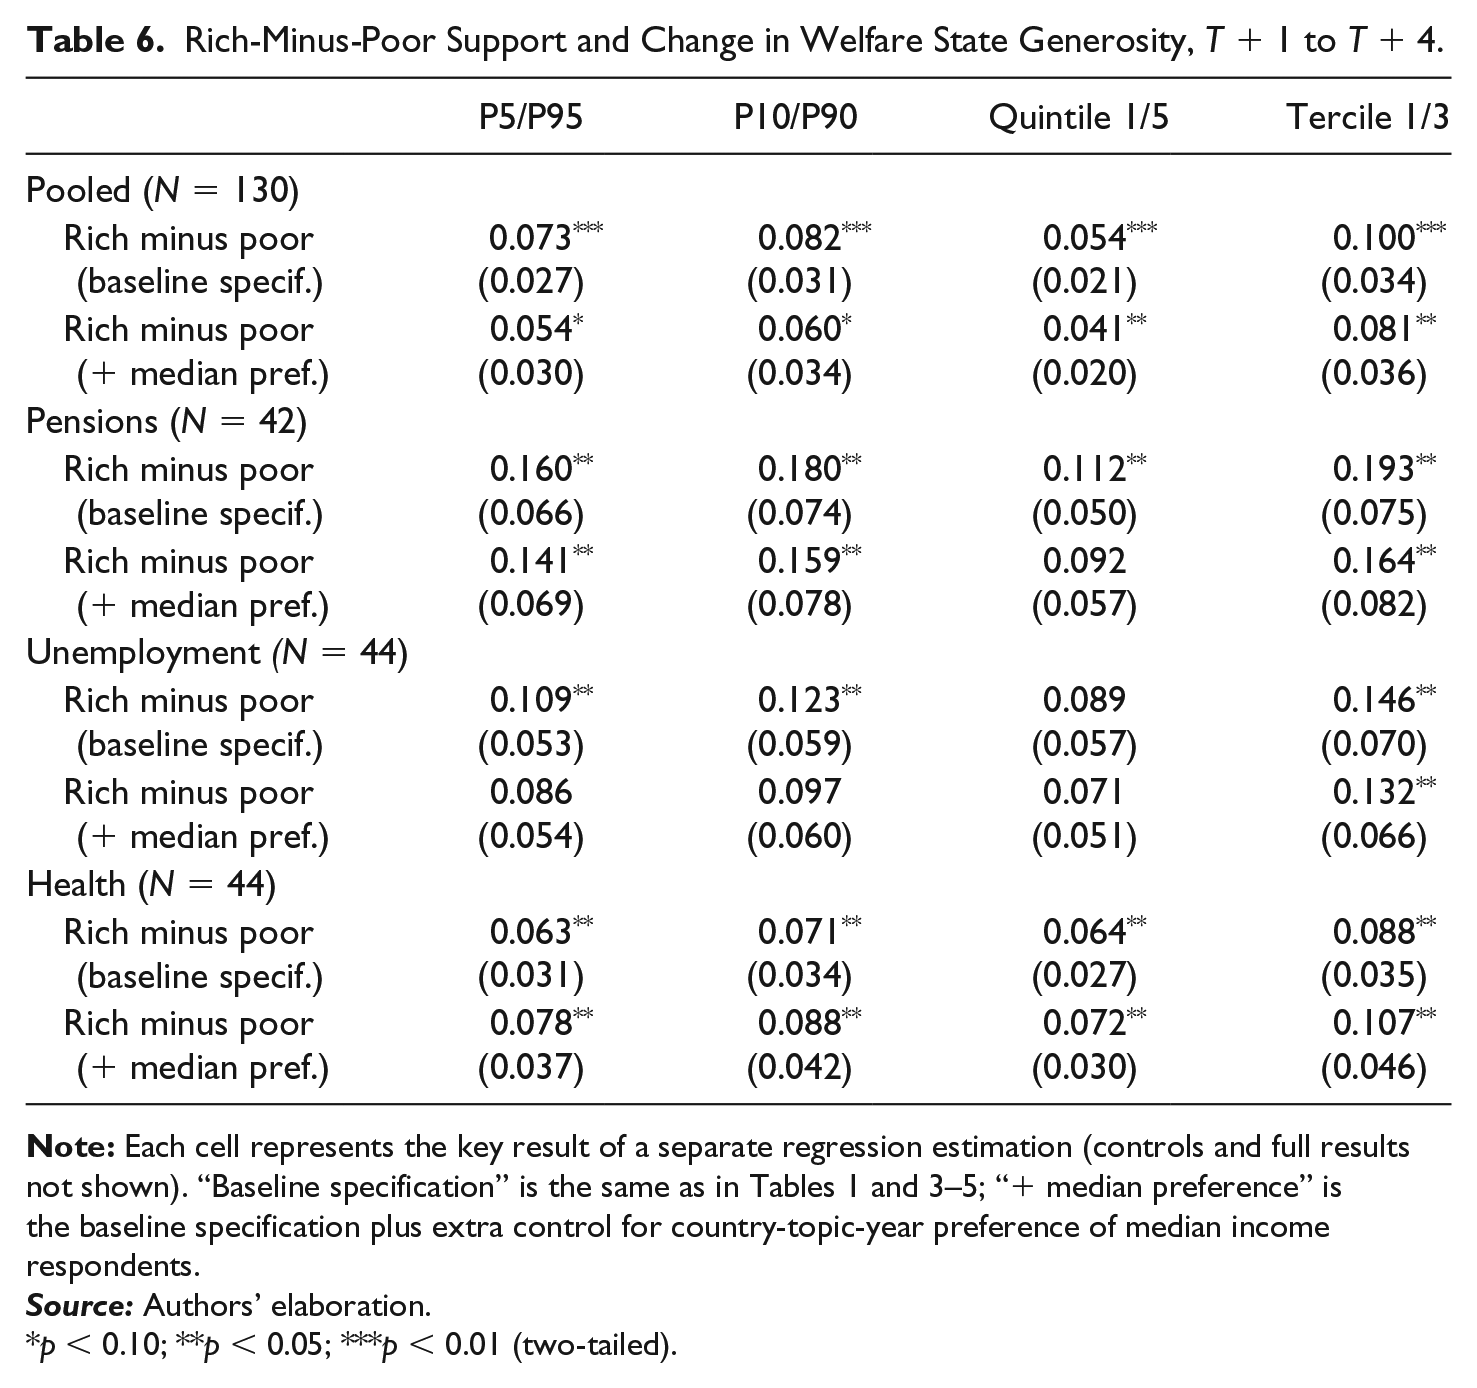
Yet another alternative specification deserves a bit more attention, because it addresses collinearity more fully without throwing away information on low-income respondents relative to high-income respondents: rich minus poor, in a given country-topic-year. Here, more positive (more negative) values capture situations in which high-income voters want more (less) welfare expansion than do low-income voters. The measure provides leverage to test Hypothesis 2a—that the rich are more influential than poor respondents. If they are, higher (lower) values of rich-minus-poor—where wealthier respondents want more increases (lower increases or more decreases) in welfare generosity than do their poorer counterparts—should correlate positively with actual change in generosity. Table 6 summarizes results of testing this possibility. Each cell captures the key result for distinct econometric models (to conserve space, full results are not shown). 74 The odd rows show results of substituting this difference-parameter for the low- and high-income parameters in the otherwise identical specifications from Tables 1 and 3–5. The even rows show results of such substitution plus controlling for median-income voters’ support for increased generosity. The results broadly corroborate our previous findings that unequal representation shows up more for generosity than spending measures. 75
Rich-Minus-Poor Support and Change in Welfare State Generosity, T + 1 to T + 4.
p < 0.10; **p < 0.05; ***p < 0.01 (two-tailed).
A third set of alternative specifications concerns the controls in our analysis. Our baseline controls capture the most theoretically relevant sources of omitted-variable bias. But we have considered other specifications in terms of measures, lags, and timing and also extra controls relevant to such bias—such as share of the population over sixty-five, ex ante level of general spending, and citizen support for the welfare state generally or for austerity. 76 None of these dampen the reported effects of overall and high-income preferences. Another category of controls involves country-level political conditions potentially relevant to representation of citizen attitudes about welfare policymaking—beyond the country-level factors (e.g., GDP per capita) and country-level clustering in all of the specifications discussed in Tables 1–6. These extra controls include age and quality of democracy, institutions regulating electoral representation (e.g., proportional representation), the strength of left or right parties, and the strength of organized social actors (e.g., union density). These conditions often display little variation over time. Nevertheless, we considered them both as extra controls and in interactions to judge whether any of them might alter the degree to which citizen attitudes influence policy change. None of the runs achieved statistical significance. This result can be interpreted as substantive, where our evidence for real but unequal representation holds regardless of political-institutional settings. More likely, however, as discussed above, the modest variation over time per country makes these very weak tests of institutional and political conditions in the politics of representation in welfare policymaking. 77
A fourth and final set of alternative specifications involves alternative estimators. These include random intercept models with alternative embedding; alternative two-level models using country-topic and country-wave as clusters; and three-level models involving country, topic, and year. 78 We also considered random slope models (with attitude variables as the random coefficients) and ordinary least squares models with jackknifed standard errors. Although outlier analysis suggests that outliers are not influential, we also consider jackknife analysis to exclude particular country-topic-years, country-years, or even countries. 79 All these specifications yield stable support for Hypotheses 1a and 2a with respect to generosity-based but not spending-based measures; they also therefore support Hypotheses 1b and 2b.
Conclusion
This article has explored representation and equality of representation in welfare state development. Our analysis has provided somewhat mixed but broadly supportive evidence for our central hypotheses that public opinion guides political outcomes and that the preferences of the rich have more weight in the policy process than the preferences of the poor. Measures of welfare spending show only weak support for our hypotheses, with the support most visible with respect to pension spending. By contrast, our analysis of the benefit-generosity measures unearths a stark pattern of real but unequal representation in welfare state reform. We believe that the results for benefit generosity are likely to be the more inferentially valid, as they better capture the regulatory and legislative program changes citizens have in mind when they express support for more or less welfare state effort. From that point of view our evidence is strong and important. However, spending measures are also relevant gauges of welfare-policy effort, and we take seriously the mixed results in these specifications. We frame our end judgments as qualified support for the view that welfare policymaking in advanced democracies involves real but unequal substantive representation.
Further research can test and extend these findings to clarify the politics of representation. The data’s leverage for exploring (inequalities in) representation between countries, time periods, and policy areas can be improved and expanded. We are particularly interested in differences across institutional and welfare state settings—such as between proportional representation and majoritarian systems, or between liberal and more social-democratic welfare state systems. We are also interested in exploring the mechanisms that produce unequal representation, which our data cannot clarify and which remain hotly contested. 80 Finally, we should investigate unequal representation with respect to inequalities in areas other than income, such as education. 81 In the meantime, our study provides broader and more valid evidence than is found in existing work that we can expect genuine, but also unequal, representation of citizen attitudes in the development of welfare states in industrialized democracies.
Supplemental Material
SBH_PandS_SupplementaryMaterial – Supplemental material for Real but Unequal Representation in Welfare State Reform
Supplemental material, SBH_PandS_SupplementaryMaterial for Real but Unequal Representation in Welfare State Reform by Wouter Schakel, Brian Burgoon and Armen Hakhverdian in Politics & Society
Footnotes
Acknowledgements
Previous versions of this article were presented at the University of Amsterdam, the University of Bergen, the University of Tokyo, WU Vienna, and the annual meetings of the Council for European Studies (2018), the European Political Science Association (2018), and the Midwest Political Science Association (2018). For their criticisms and suggestions, we thank meeting participants, including Wouter van der Brug, Ursula Daxecker, Luc Franssen, Theresa Kuhn, Sijeong Lim, Mike Medeiros, Daphne van der Pas, Thomas Pl�mper, Philipp Rehm, Gijs Schumacher, Seiki Tanaka, and Vera Troeger, as well as the editorial board of Politics & Society.
Declaration of Conflicting Interests
The authors declared no potential conflicts of interest with respect to the research, authorship, and/or publication of this article.
Funding
The author(s) disclosed receipt of the following financial support for the research, authorship, and/or publication of this article: This article was supported by the Netherlands Organisation for Scientific Research, grant number 406-15-089.
Notes
Author Biographies
Supplementary Material
Please find the following supplemental material available below.
For Open Access articles published under a Creative Commons License, all supplemental material carries the same license as the article it is associated with.
For non-Open Access articles published, all supplemental material carries a non-exclusive license, and permission requests for re-use of supplemental material or any part of supplemental material shall be sent directly to the copyright owner as specified in the copyright notice associated with the article.