
Abstract
Devolution is argued to reduce spatial inequalities by improving policymaking, tailoring policies and thus promoting (inclusive) economic growth. To assess this argument in the English context, I study the performance of the six regions that received increased powers via Mayoral Combined Authority status in 2017 under the Cities and Local Government Devolution Act (CLGDA) 2016. Using data spanning from 2011 to 2022 and a difference-in-differences approach with heterogeneous treatment effects, I analyse the influence of the first six years of devolution on economic growth. The findings show that devolved areas did not experience faster than expected growth. Moreover, within devolved areas, the estimated growth effect of devolution was more favourable for already wealthy districts than for poorer ones. In combination, these results paint a negative picture for the influence of the CLGDA 2016 as a tool for reducing between- or within-region economic inequalities, adding to a weight of literature questioning the efficacy of devolution in England.
Introduction
The UK is one of the most regionally unequal developed countries (McCann, 2020), ranking third among OECD members in disparities of Gross Value Added per worker (Institute for Public Policy Research [IPPR], 2023). These inequalities are not only an economic concern, associated with weaker productivity and national growth (Floerkemeier et al., 2021; Marrero and Serven, 2022), but have also been linked to wider political discontent, populism and protest (McCann, 2020; Rodríguez-Pose, 2018; Schoene and Allaway, 2019).
At the same time, the UK remains among the most centralised governance systems in the OECD (Breach and Bridget, 2022). England is particularly centralised, with fewer statutory powers than the devolved nations such as Scotland, which enjoys greater fiscal autonomy (Roy, 2006). This combination of high spatial inequality and centralisation has given rise to devolution as a proposed response to entrenched regional disparities (Morelli and Seaman, 2007).
Devolution is the ‘transfer to a subordinate elected body, on a geographical basis, of functions currently exercised by ministers and Parliament’ (Bogdanor, 2001: 2). Advocates argue that national authorities cannot design effective policy for increasingly diverse regions, and that greater local autonomy can improve responsiveness, accountability and ultimately economic performance (Keating, 1998; Paun et al., 2022). International comparisons lend weight to this view: Germany, for example, combines fiscal decentralisation with relatively low regional inequality (Aughey, 2001). Yet the extent to which such benefits apply in the English context is contested, given powerful path dependencies, agglomeration effects and territorial differences that shape regional development trajectories (Camagni and Capello, 2013; Lee, 2019).
Despite decades of debate (Hambleton, 1992; Rodríguez-Pose and Gill, 2005), systematic evidence on the economic impact of devolution over time remains limited in England and more generally. Earlier assessments were constrained by the insufficient time periods to assess changing reforms and/or by insufficient data (Ezcurra and Rodríguez-Pose, 2013). This has meant that while concerns over design and delivery have been widely noted (Tomaney, 2016), empirical evaluation has lagged (Pope et al., 2023; Raja and Larsson, 2024).
This article addresses this gap by providing a first-look analysis of the first wave of Mayoral Combined Authorities (MCAs) created under the Cities and Local Government Devolution Act (CLGDA) 2016: Cambridgeshire and Peterborough, Greater Manchester, Liverpool City Region, Tees Valley, West Midlands and West of England (Sandford and Dempsey, 2017). Although differing in scope (Local Government Information Unit [LGiU], 2022), these deals shared a common aim to promote economic growth in a way that was ‘inclusive’– that is, more equitably distributed (Sissons et al., 2019).
Using panel data for local authority districts (LADs) (2011–2022) from NOMIS and the Office for National Statistics, I apply a difference-in-differences (DiD) framework (Lechner, 2011), allowing for heterogeneous treatment effects (Xie et al., 2012), to compare growth trajectories in devolved and non-devolved areas. Two questions guide the analysis: first, ‘RQ1: Did the 2016 CLGDA accelerate economic growth in devolved areas relative to non-devolved areas?’; and second, building on the agglomeration literature (Duranton and Puga, 2004), ‘RQ2: How did existing economic activity influence post-devolution growth trajectories within City Regions?’.
The findings show little evidence that devolution accelerated growth overall, with outcomes varying by local context. Wealthier districts within devolved areas tended to grow faster than expected, while poorer districts often fell behind.
These results contribute in three ways: they speak to wider debates on decentralisation and inequality (Hooghe et al., 2016); they highlight the spatial complexities and possible trade-offs between growth and distribution (Caragliu and Nijkamp, 2012); and they add empirical evidence to critiques of devolution in England’s limited economic returns (Democratic Audit UK, 2015).
Background and theoretical context
Regional economic growth
Regional growth is commonly measured through Gross Domestic Product (GDP) per capita, capturing the overall prosperity of a place relative to its population (Fariss et al., 2017; Henley, 2005). While this indicator has limitations (Harvie et al., 2009), it remains the most widely used measure in both policy and academic debates.
Much of the literature emphasises the role of territorial capital– the idea that a region’s unique assets, such as human capital, infrastructure and governance, shape its growth path (Camagni and Capello, 2013; Capello et al., 2009). Within this, agglomeration economies play a central role: benefits from density, connectivity and specialisation can generate self-reinforcing growth in cities and regions (Andersson et al., 2016; Duranton and Puga, 2004). Yet such forces also tend to amplify spatial disparities, privileging areas already endowed with economic and institutional advantages (Perucca, 2014).
A related concept is absorptive capacity, which highlights that places differ in how effectively they can take advantage of new policies or resources. Regions with higher skills, stronger institutions and better governance are more likely to translate interventions into tangible growth (Becker et al., 2013; Caragliu and Nijkamp, 2012). This perspective is critical for understanding why similar policy reforms may produce divergent outcomes across different localities.
Devolution and regional economic growth
The economic rationale for devolution rests on three main arguments.
Tailoring policy
Devolution is expected to improve outcomes by bringing decision making closer to local needs. Local authorities, it is argued, are better placed to design interventions that respond to place-specific challenges and opportunities, from infrastructure to skills (Duranton and Venables, 2018; Rodríıguez-Pose and Gill, 2005). This view, often linked to the “new regionalism” (Keating, 1998), suggests that decentralisation can yield an “economic dividend” (Morgan, 2006). However, international reviews caution that the evidence remains inconclusive (Pope et al., 2023).
Accountability
A second claim is that devolution enhances political accountability. By reducing the distance between leaders and citizens, devolved arrangements may strengthen participation and responsiveness, ensuring policies better reflect local priorities (Hasnain, 2010; Polverari, 2015). This can reinforce effective governance, itself a key driver of growth (Becker et al., 2013). Yet concerns remain over uneven capacity, with some devolved bodies lacking the resources or expertise to deliver meaningful change (Katikireddi et al., 2017).
Spatial inequalities
Finally, critics question whether devolution mitigates or deepens inequalities. Because economic assets are unevenly distributed, new powers may disproportionately benefit already prosperous urban centres, leaving peripheral or weaker areas behind (Morelli and Seaman, 2007; Waite et al., 2017). This risk is reflected in debates around the English “metro mayor” model, where powers have been concentrated in major urban regions, raising concerns that neighbouring areas may be sidelined (Democratic Audit UK, 2015; Rodríıguez-Pose and Gill, 2004). In this view, devolution may shift agglomeration forces to a more local scale, intensifying within-region disparities rather than reducing them.
CLGDA 2016 and growth: Theory of change
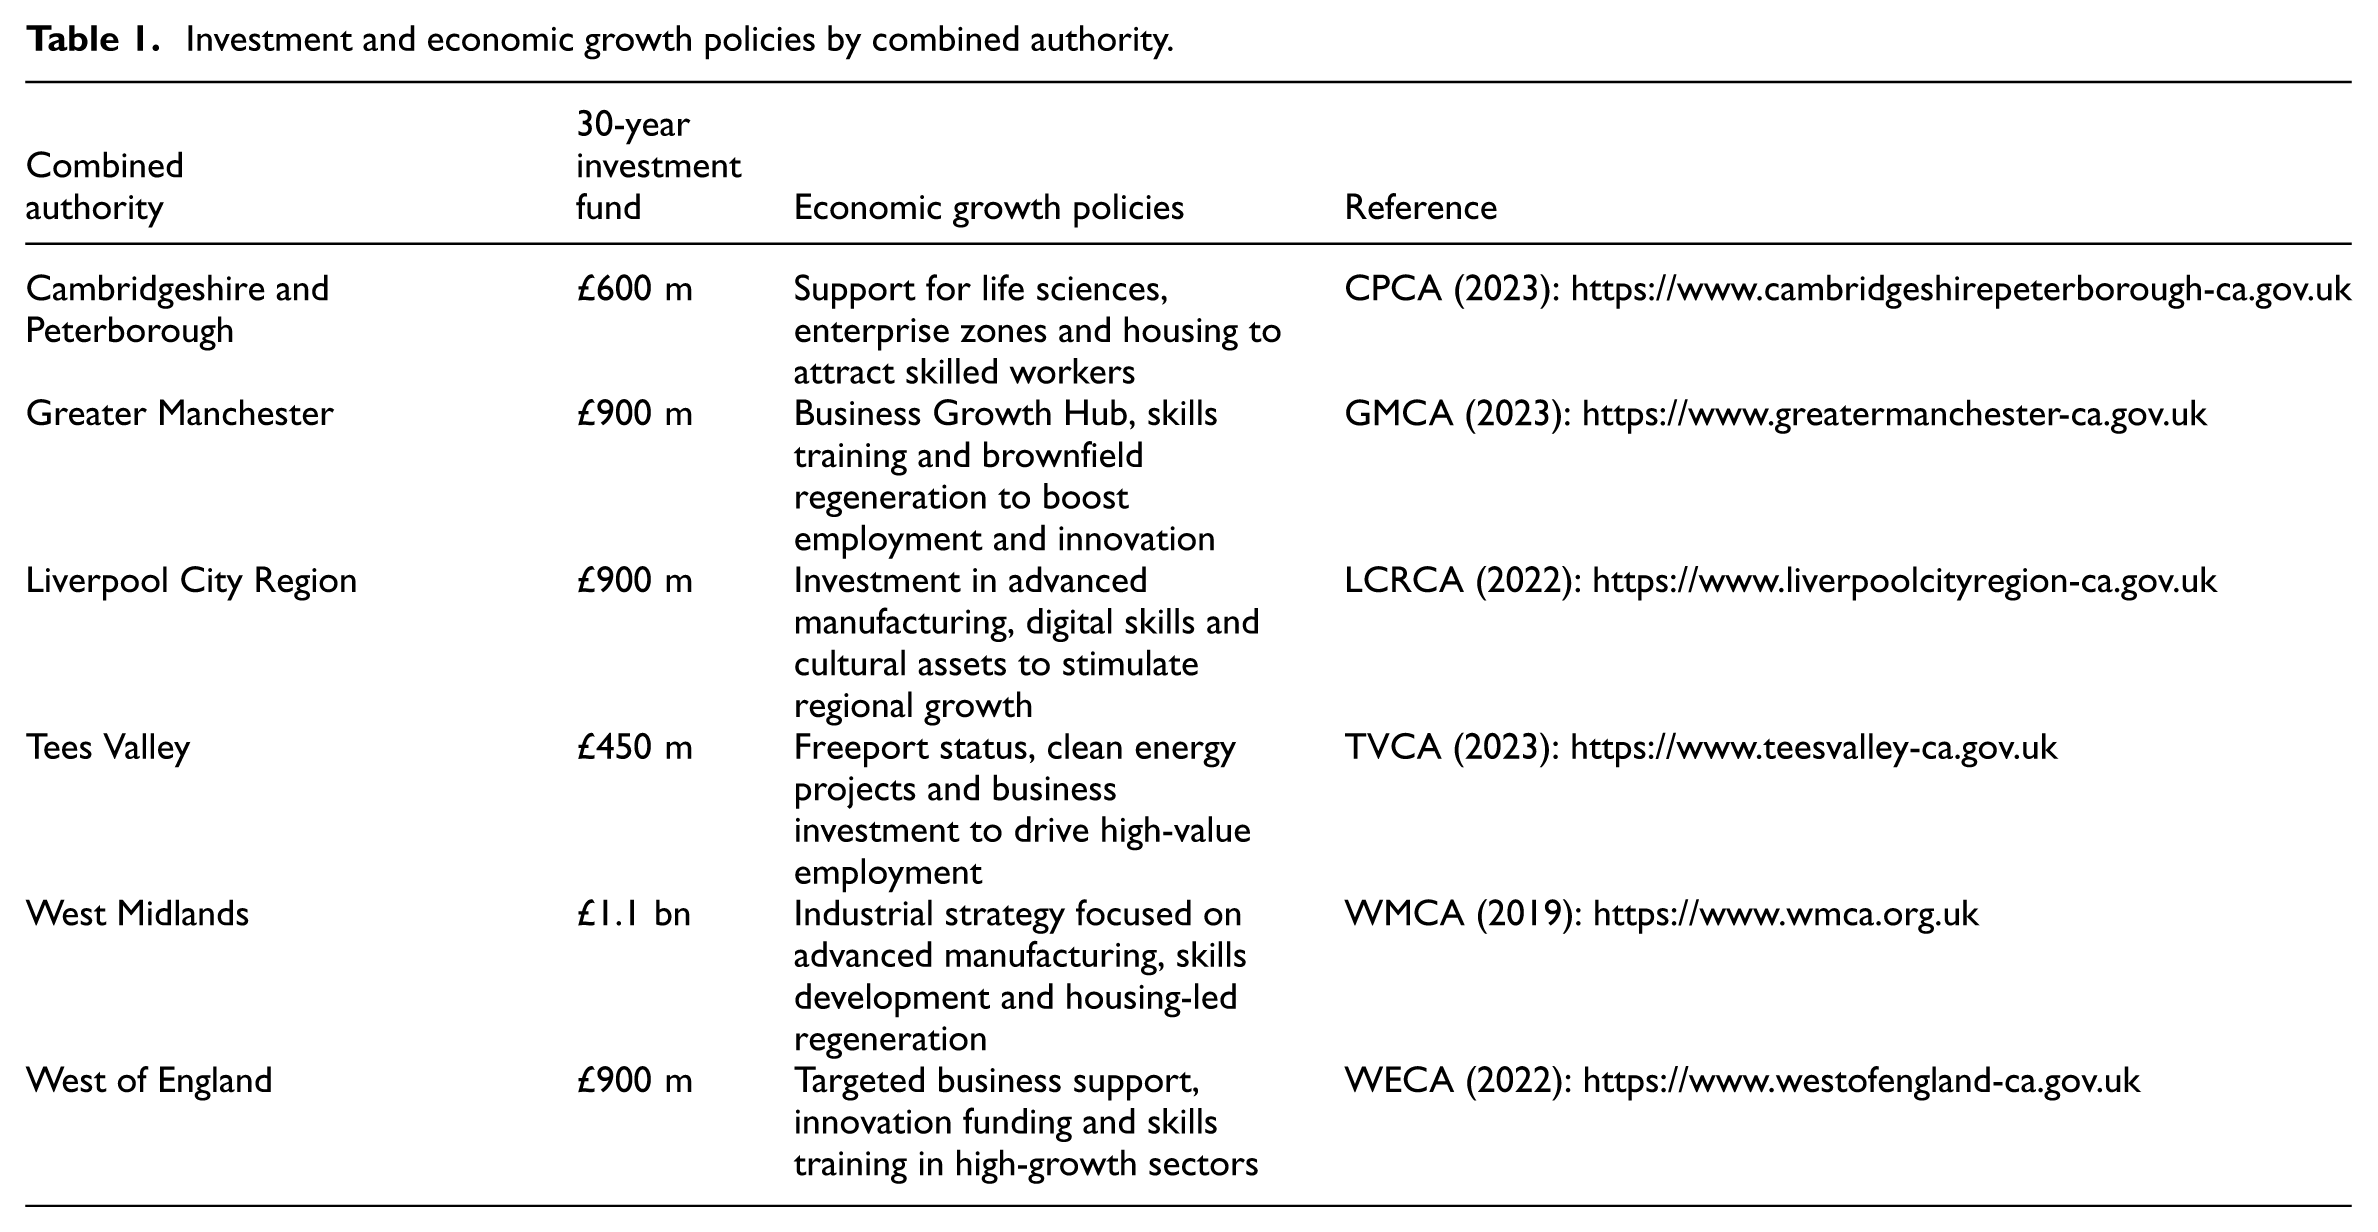
The CLGDA 2016 was explicitly framed around economic growth (Leyland, 2023; Tomaney, 2016). As then-Chancellor George Osborne argued, the new powers were intended to “boost local growth, help attract business and create jobs” (Ministry of Housing, Communities and Local Government [MHCLG], 2016). Each MCA was given responsibilities under the remit of “Enterprise and Growth” (Local Government Association [LGA], 2021), alongside 30-year investment funds and sectoral initiatives ranging from industrial strategies to freeports (Table 1).
Investment and economic growth policies by combined authority.
In theory, such powers should have enabled regions to capitalise on local strengths and tailor growth strategies accordingly (Rodríıguez-Pose and Bwire, 2004). In practice, questions have been raised about whether devolved institutions had sufficient fiscal resources, capacity and autonomy to deliver, or whether the reforms simply reinforced existing disparities (Deng et al., 2022; Morgan, 2006).
Inclusive growth
Beyond growth, the government emphasised a commitment to “inclusive growth” (Sissons et al., 2019). The aim was not only to raise prosperity but also to distribute its benefits more fairly, addressing both the ‘pace and pattern’ of development (Lee, 2019: 424).
Mayors were granted powers across multiple policy areas – including transport, housing, planning and training – creating opportunities for cross-sectoral synergies. Examples include subsidised transport for apprentices in Liverpool (Paun et al., 2022) or the use of mayoral development corporations for regeneration (Lowndes and Lempriere, 2018; Raikes, 2017). These tools underscored the broad remit of English devolution, though the scope of powers varied considerably between MCAs (LGA, 2021).
Nevertheless, “inclusive growth” remains a contested and often vague concept (Hughes and Lupton, 2021; Turok, 2010). In this study, I focus specifically on whether historically less productive districts within devolved regions were able to catch up with their more prosperous counterparts.
Method
Research questions
The analysis is guided by two research questions: RQ1: Did the 2016 CLGDA accelerate economic growth in devolved areas relative to non-devolved areas? and RQ2: How did existing economic activity influence post-devolution growth trajectories within City Regions?
Selection of focus, period and scale
The focus is on the six MCAs created in 2017 under the CLGDA 2016 (Table 1). These function as regional economic units, with populations broadly comparable to NUTS 2 regions used in international studies of growth (Formanek, 2019; Pike et al., 2015).
Within MCAs, the LAD is used as the unit of analysis. This choice reflects both the governance structure – MCA membership was negotiated by constituent local councils, making LADs the relevant administrative unit (UK Government, 2016) – and the analytical advantage of greater spatial detail. LADs allow for more precise control of factors influencing growth and reduce risks of scale-based distortions such as the modifiable areal unit problem (Hewko et al., 2002).
Some areas are excluded. LADs that joined MCAs after 2017 are omitted to avoid biases from staggered treatment effects (De Chaisemartin and d’Haultfoeuille, 2020). London Boroughs are excluded as they fall under the Greater London Authority, established in 2000 (Authority, 2009). Cornwall and the Isles of Scilly are also excluded due to their distinct devolution arrangements (Calkin, 2017; UK Government, 2015).
Data and variables
The dataset covers all English LADs between 2011 and 2022, using sources from NOMIS and the Office for National Statistics. The design builds on Raja and Larsson’s (2024) analysis of an earlier wave of devolution in England under the ‘City Deals’ framework, though here the outcome is economic growth rather than productivity.
Dependent variable
The dependent variable is GDP per capita, capturing output relative to population (Fariss et al., 2017). This indicator is widely used in the growth literature despite recognised limitations (Dedeček and Dudzich, 2022; Geary and Stark, 2018; Maddison, 1983). Results are robust when using GVA per capita as an alternative measure (Henley, 2005).
To aid interpretation, the variable is expressed in logarithmic form so coefficients can be read as percentage changes, smoothing fluctuations across periods of growth and contraction (Oner, 2017; Autor, 2014).
Variable of interest
The treatment variable is an interaction between two dummies. The first, DevDistrict, equals 1 if a district is in one of the six MCAs. The second, PostCLGDA, equals 1 for the years 2017–2022. Their interaction, PostCLGDA × DevDistrict, equals 1 only for MCA districts in the post-devolution period.
Control variables
Control variables are included to account for factors highlighted in the literature on growth and territorial capital. Job density captures the concentration of employment relative to the working-age population (Andersson et al., 2016). Industry structure is represented by the shares of services, manufacturing and public sector GVA, reflecting different growth trajectories (Raja and Larsson, 2024). Investment is measured through gross fixed capital formation per worker, following the standard link between capital intensity and growth (Romer, 1990). Human capital is proxied by the share of the population with NVQ4+ qualifications, reflecting the role of skills in growth (Simon, 1998). Population density is included as a proxy for both agglomeration benefits and congestion costs (Duranton and Puga, 2004). Unemployment is controlled for, given evidence that high unemployment reduces growth through the erosion of skills (Makaringe and Khobai, 2018; Nagel, 2015).
To capture the influence of earlier decentralisation, a measure of participation in City Deals is included, coded as 0 for areas with no deal, 0.5 for Wave 2 agreements (2013) and 1 for Wave 1 agreements (2012) (Raja and Larsson, 2024; Ward, 2024). Finally, to test whether initial economic conditions shaped outcomes, I interact devolution with lagged GDP per capita (2011, the start of my sample, and 1998, the earliest available year in the data).
Models
Ordinary Least Squares
I begin with a simple Ordinary Least Squares (OLS) specification:
Here, GDPpc it is GDP per capita in district i at time t. The variables PostCLGDA and DevDistrict capture, respectively, whether the year is after 2017 and whether the district is part of an MCA. Their interaction, PostCLGDA × DevDistrict, is the main variable of interest, measuring whether MCA districts grew differently after devolution. X it is a vector of controls discussed directly above, and ε it is an error term. Standard errors are clustered at the district level, as there is no suitable alternative grouping for comparison (Hewko et al., 2002).
Difference-in-differences extension
To capture dynamics over time and remove bias from unobserved time-invariant factors, I extend this to a DiD specification using two-way fixed effects. The DiD approach compares changes in GDP per capita between MCA and non-MCA districts before and after 2017, attributing systematic differences to the policy intervention (Lechner, 2011).
Operationally, this adds two sets of fixed effects to the OLS model:
where ν i are district fixed effects, capturing unchanging characteristics such as geography or long-standing institutions (Raja and Larsson, 2024), and τ t are year fixed effects, capturing shocks common to all places, such as the COVID-19 pandemic (Bell and Jones, 2015).
In this set-up, the coefficient on (PostCLGDA t ×DevDistrict i ) is interpreted as the Average Treatment Effect on the Treated (ATT): the additional growth attributable to devolution in districts that received a mayor compared to what would otherwise be expected.
Heterogeneous treatment effects
Finally, I allow for heterogeneous treatment effects. This recognises that MCA deals were negotiated bilaterally and differed in scope, meaning that the effect of devolution is unlikely to be uniform (Bachtrogler et al., 2020; Gabler et al., 2009). The extended specification is:
The additional terms (PostCLGDA t × DevDistrict i ×MCA j ) capture whether the effect of devolution differs systematically by combined authority j, with λ j giving the size of that difference. This allows the model to reflect variation in both the institutional design of each MCA and the local conditions in which it operates.
Results
Descriptive statistics
Trend growth rates
Figure 1 shows indexed GDP per capita across MCAs from 1998 to 2022. There is a general upward trend, with most regions growing relatively faster than the ‘no mayor’ control group.
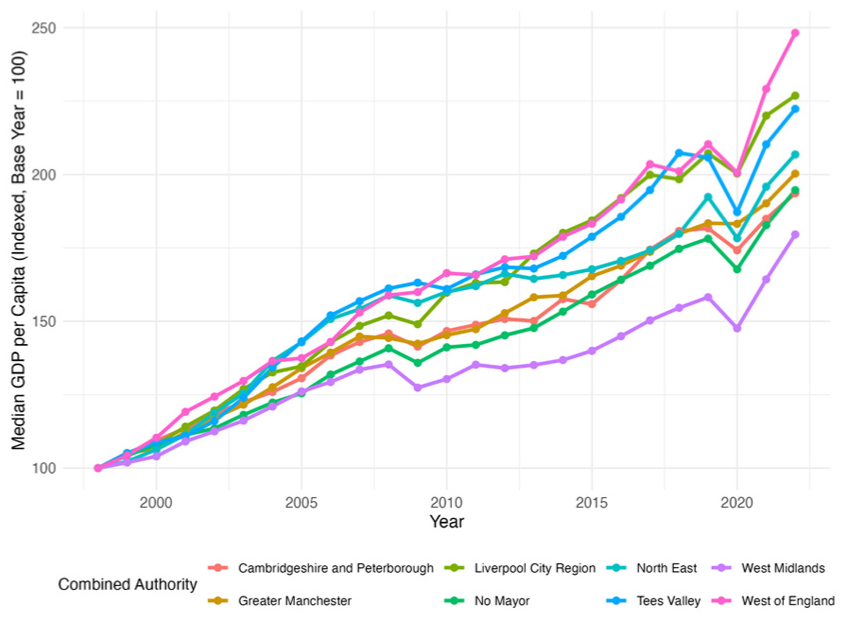
Indexed growth over time by combined authority.
Summary of control variables
Control variables are summarised separately for the 37 treated districts (Table 2) and the 213 controls (Table 3), averaged over 2011–2022.
Descriptive statistics (treatment).
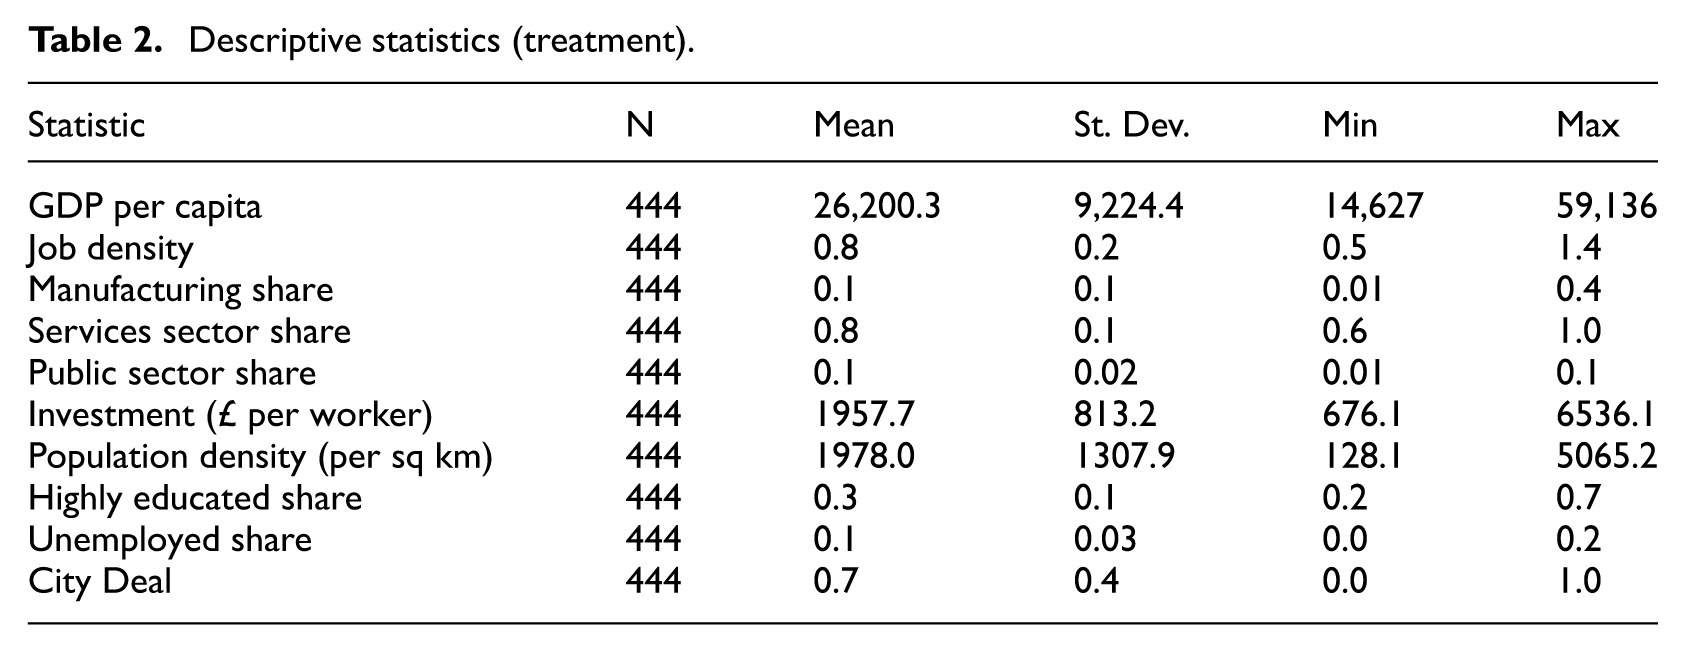
Descriptive statistics (control).
Overall, treatment and control groups are broadly comparable. The main differences are that treated areas are denser in population, while control areas have higher capital per worker.
Regression analysis
Parallel trends test
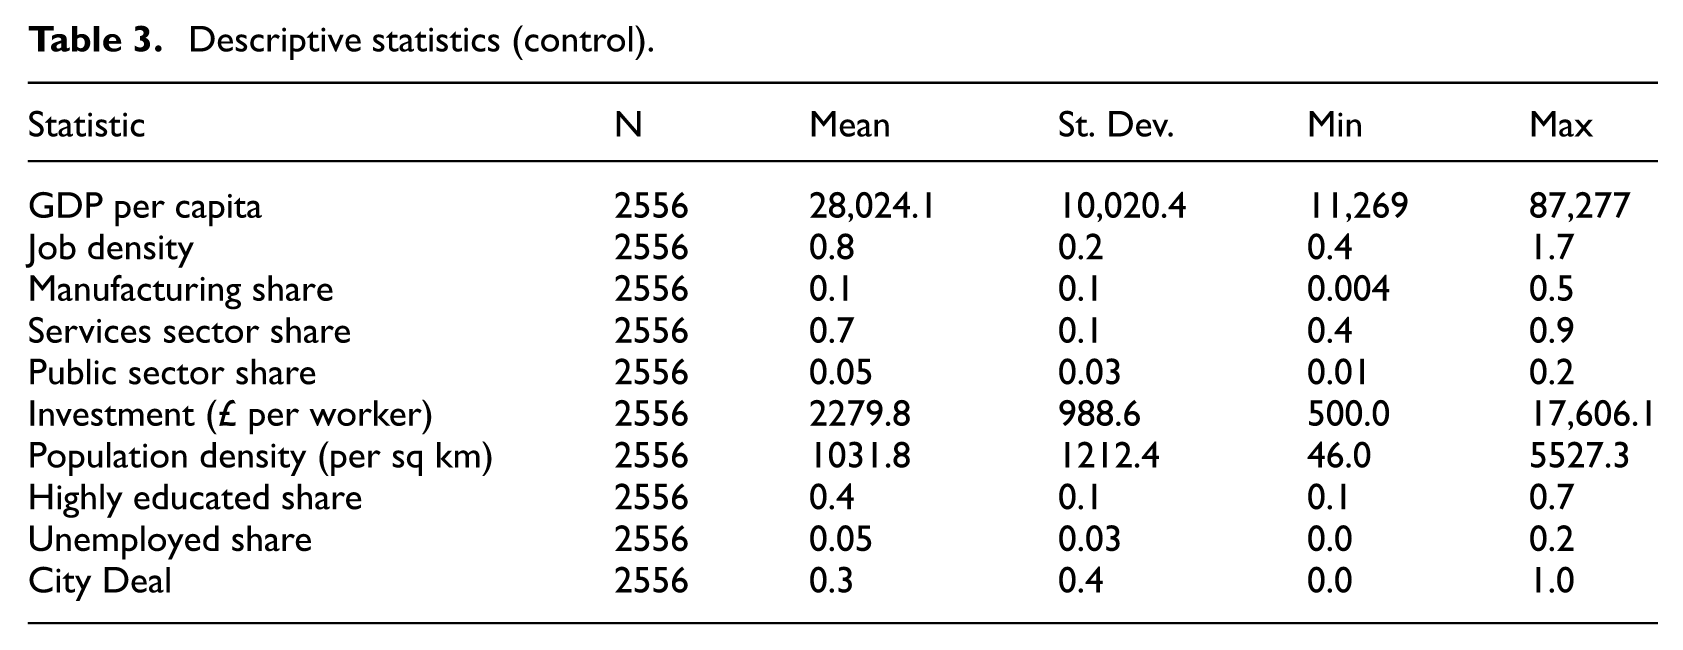
A central assumption of the DiD design is that, absent devolution, treatment and control areas would have followed similar economic trajectories (Marcus and Sant’Anna, 2021). Although this counterfactual cannot be observed directly, it can be evaluated through pre-treatment tests (Rambachan and Roth, 2019).
Figure 2 shows GDP per capita trends for devolved and non-devolved areas prior to 2017. The series move closely together, and formal pre-trends regressions (Table 6 in Appendix A1) confirm this pattern.
Parallel trends – GDP per capita (log).
Together, the graphical and regression evidence indicate that devolved and non-devolved areas shared similar growth paths between 2011 and 2016, strengthening the case that post-2017 divergence reflects the effect of devolution (Dette and Schumann, 2024).
Main regression results
Reg. (1) presents a naive OLS model of the treatment variable and its components. It shows no overall relationship, though GDP per capita is higher after 2016 than before. Reg. (2) adds controls drawn from the growth literature, raising explanatory power to 73.6. Regs. (3) and (4) incorporate time and district fixed effects, so coefficients reflect within-district changes (i.e. growth). Reg. (3) shows no significant impact of devolution. Reg. (4) allows effects to vary across MCAs, slightly increasing explanatory power to 15.8%. Results remain insignificant overall, with five of six MCAs showing no effect; Tees Valley grew marginally below expectations (−0.07%). Reg. (5) interacts devolution with historic economic conditions (2011 GDP per capita). Here, the devolution coefficient turns negative and significant: devolved areas underperformed on average (−0.656). The interaction is positive, implying that richer districts grew faster, with a 1% higher initial GDP linked to 0.0648. Reg. (6) repeats this using a longer lag (1998 GDP per capita). Results are nearly identical, supporting path dependency and confirming that they are not an artefact of the 2011 base year.
Within combined authority regressions
To analyse how existing economic activity influences the relationship between devolution and economic growth in more detail, I focus on each combined authority individually, presenting their successful parallel trends tests in Figure 3 in Appendix A2.
From Table 5, it is clear that between the different MCAs the influence of existing economic activity on post-devolution growth is mixed, although there are some common trends.
In Cambridgeshire and Peterborough (CP), Liverpool City Region (LCR) and Tees Valley (TV), there appears to be no influence of either devolution in general, or devolution depending on initial economic characteristics. This suggests that they performed no differently than is to be expected. However, in Greater Manchester (GM), West Midlands (WM) and West of England (WE), the effect between devolution and economic growth is negative, the greatest magnitude of which is West of England (−3.03%). When analysing the term that accounts for initial economic conditions influencing devolution, these terms are all positive, suggesting that initial economic conditions resulted in greater growth in already successful areas.
Robustness
To test the robustness of these findings, I replicate the analysis using alternative specifications and methods. First, I replace GDP per capita with GVA per capita (Appendix B1). GDP per capita includes net taxes on products, whereas GVA measures output before taxes and subsidies and is considered a useful complementary measure when assessing local economic activity (Henley, 2005). Results remain unchanged, indicating that the findings are not measurement specific. Second, I re-estimate the models on a propensity score matched sample (Appendix B2), ensuring treated and control districts are directly comparable, with results relating to insignificant differences in devolved growth remaining consistent again. Finally, I use an event study design (Appendix B3) to allow effects to vary over time and to further check pre-trends. The results remain largely insignificant or negative, reinforcing confidence in the main conclusions.
Limitations
One limitation is that this approach excludes MCAs not imposed in 2017. However, this decision is informed by recent literature questioning assumptions in the two-way fixed effects framework (De Chaisemartin and d’Haultfoeuille, 2022; Imai and Kim, 2021). The main concern is that heterogeneous treatment effects and varying treatment timings can introduce biases. While solutions are emerging to address these biases in two-way fixed effects estimates within DiD models (De Chaisemartin and d’Haultfoeuille, 2020; Wooldridge, 2021), there is no consensus on the most robust alternative. Therefore, I narrow the focus to specific questions: how did the imposition of a mayor in 2017 affect growth between 2016 and a given year, comparing the treatment group to a statically defined control group.
Additionally, it may be that there has not been enough time for the metro mayors to have had a meaningful effect on the economic growth of their regions. Yet, this is the longest time period over which this can be studied given current data availabilities and timings of institutional changes. This argument is also significantly weakened by the event study design showing no evidence of an increasingly powerful influence of devolution on economic growth, shown in Appendix B3.
Discussion and conclusions
Concerning the first research question, the CLGDA 2016 shows little evidence that mayoral devolution accelerated economic growth in its first six years. Devolved areas performed no differently to non-devolved counterparts, and once initial conditions are considered, the effect turns negative (Table 4). Allowing for variation between MCAs does not change this result, which holds across robustness checks (Appendix B).
Combined authority regression results.
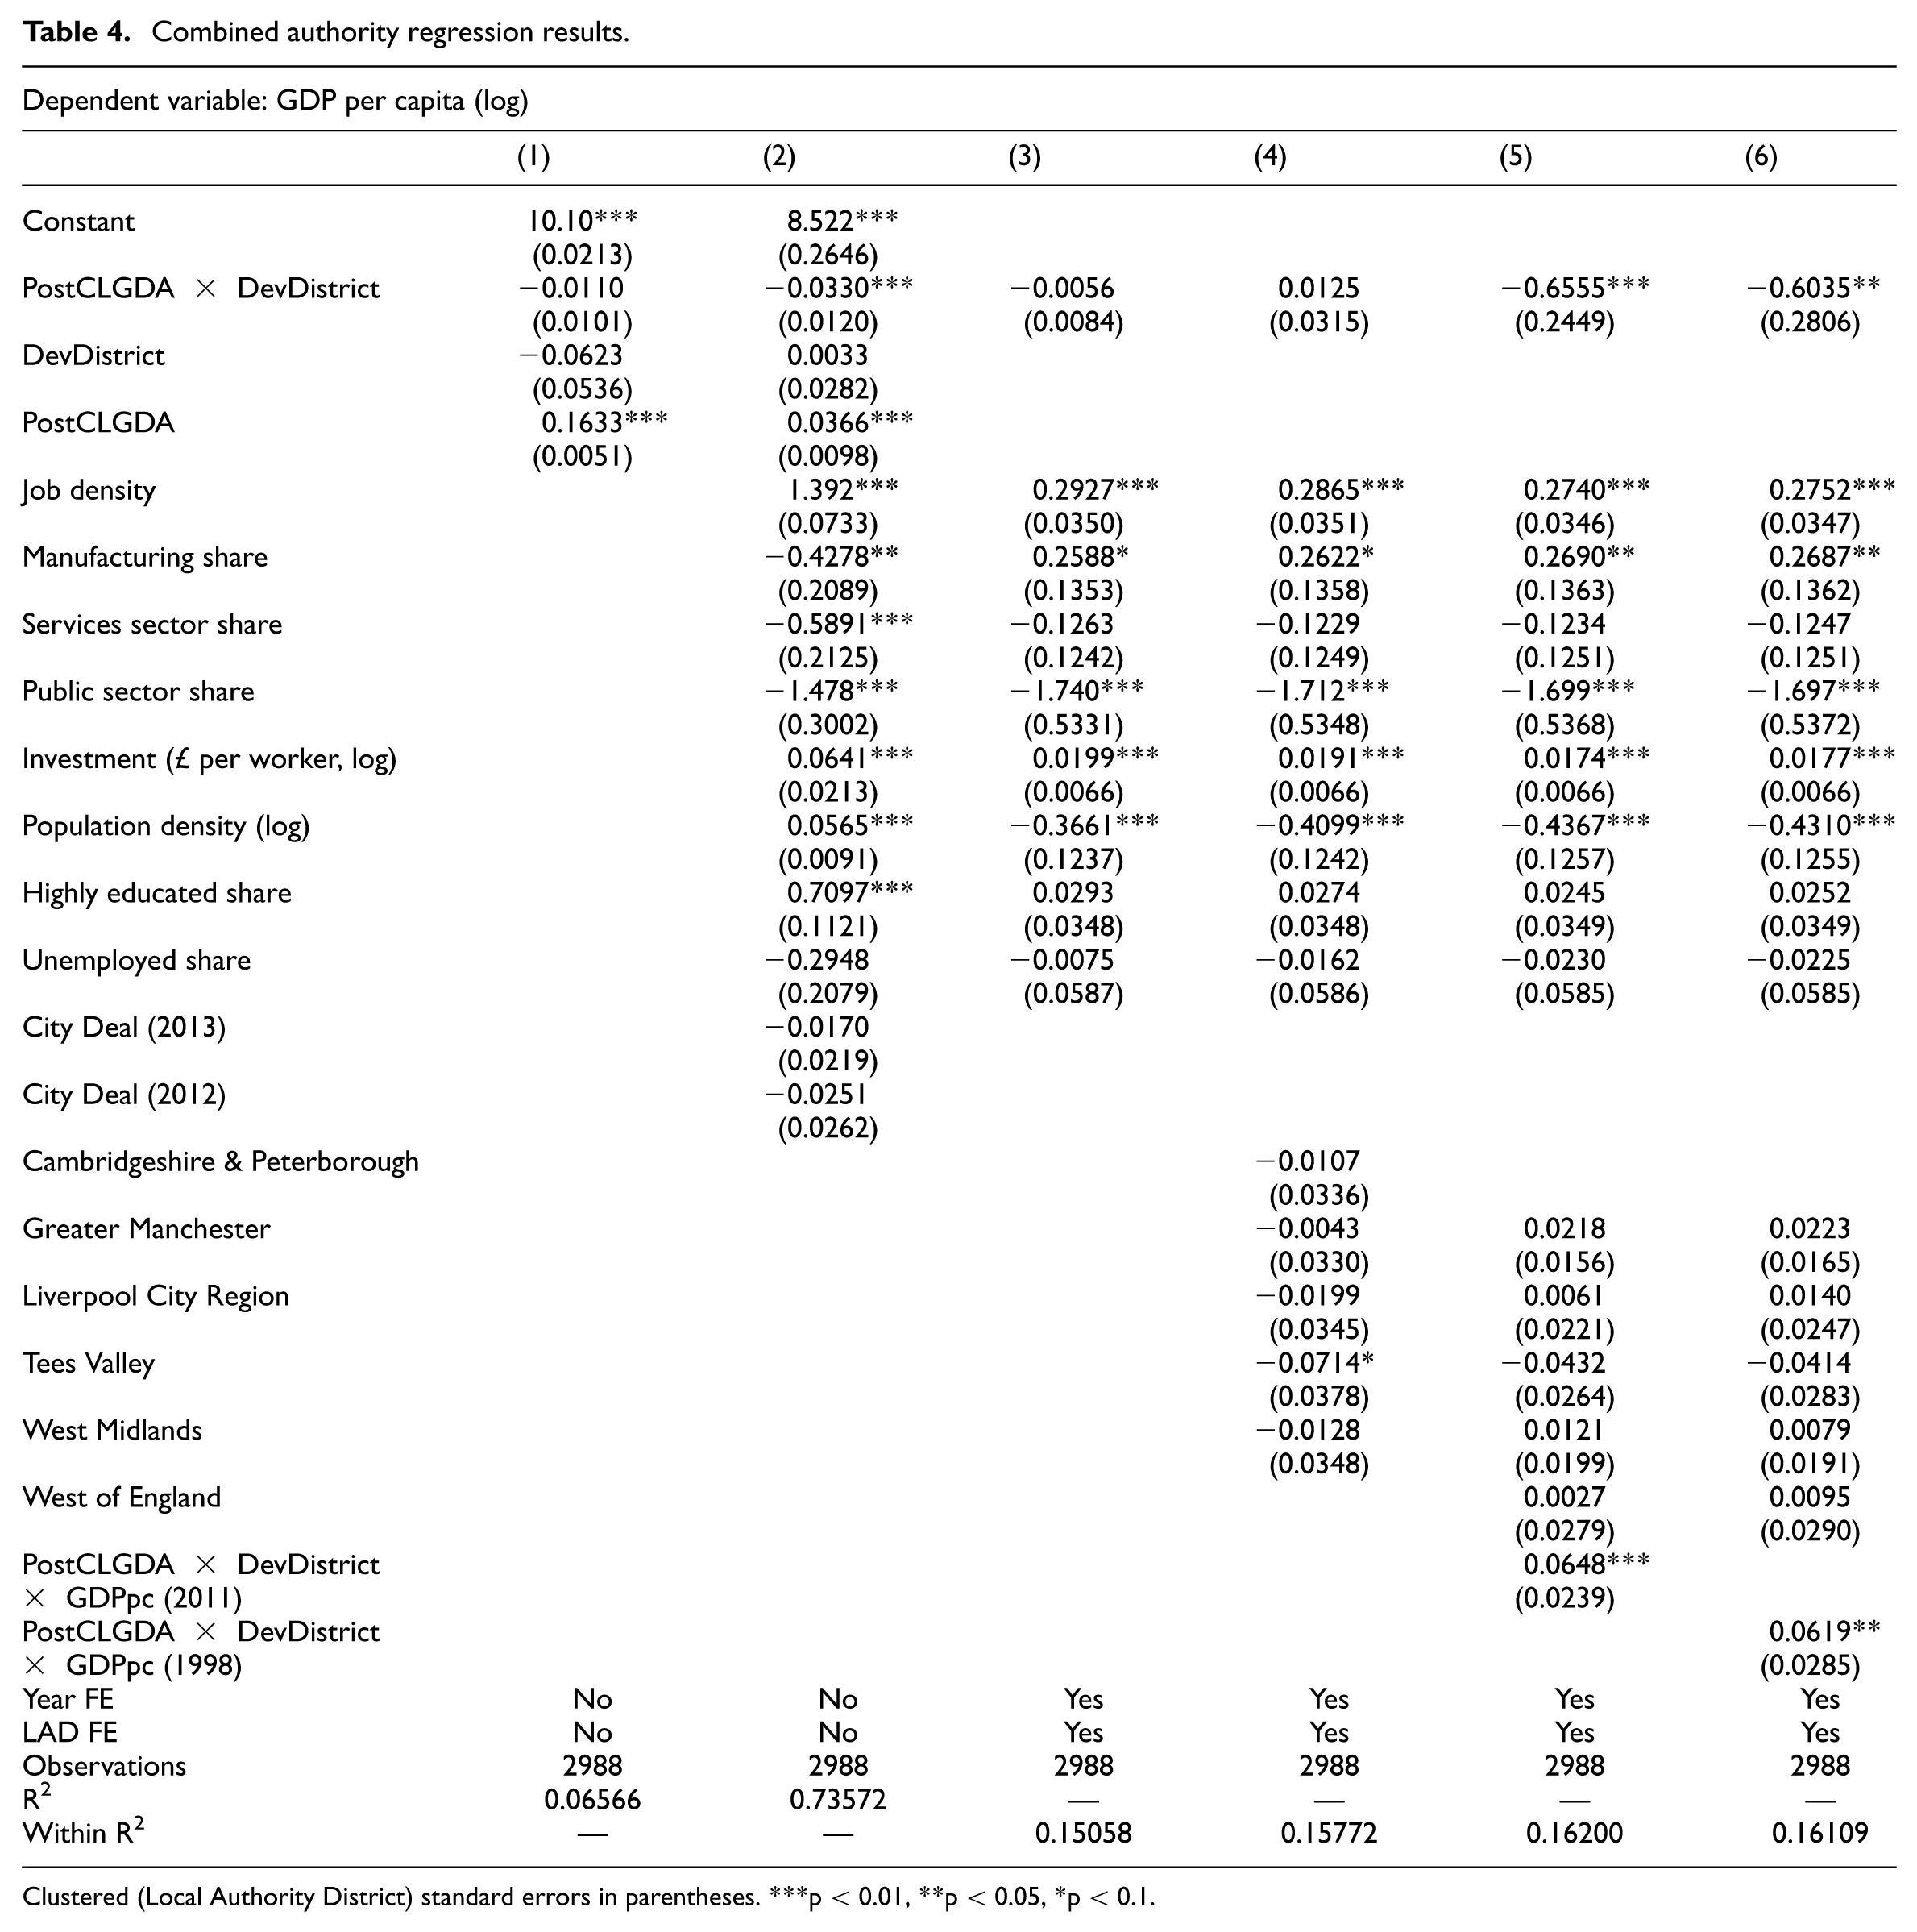
Clustered (Local Authority District) standard errors in parentheses. ***p < 0.01, **p < 0.05, *p < 0.1.
For the second research question, outcomes varied with pre-existing conditions. In some MCAs (Cambridgeshire and Peterborough, Liverpool City Region, Tees Valley), there was no link between devolution and growth once initial GDP per capita was controlled for. In others (Greater Manchester, West Midlands, West of England), richer districts grew faster than expected while poorer districts fell behind (Table 5). Rather than fostering inclusive growth, devolution has reinforced spatial inequalities, most notably in the West Midlands.
Within combined authority regression results (2011).
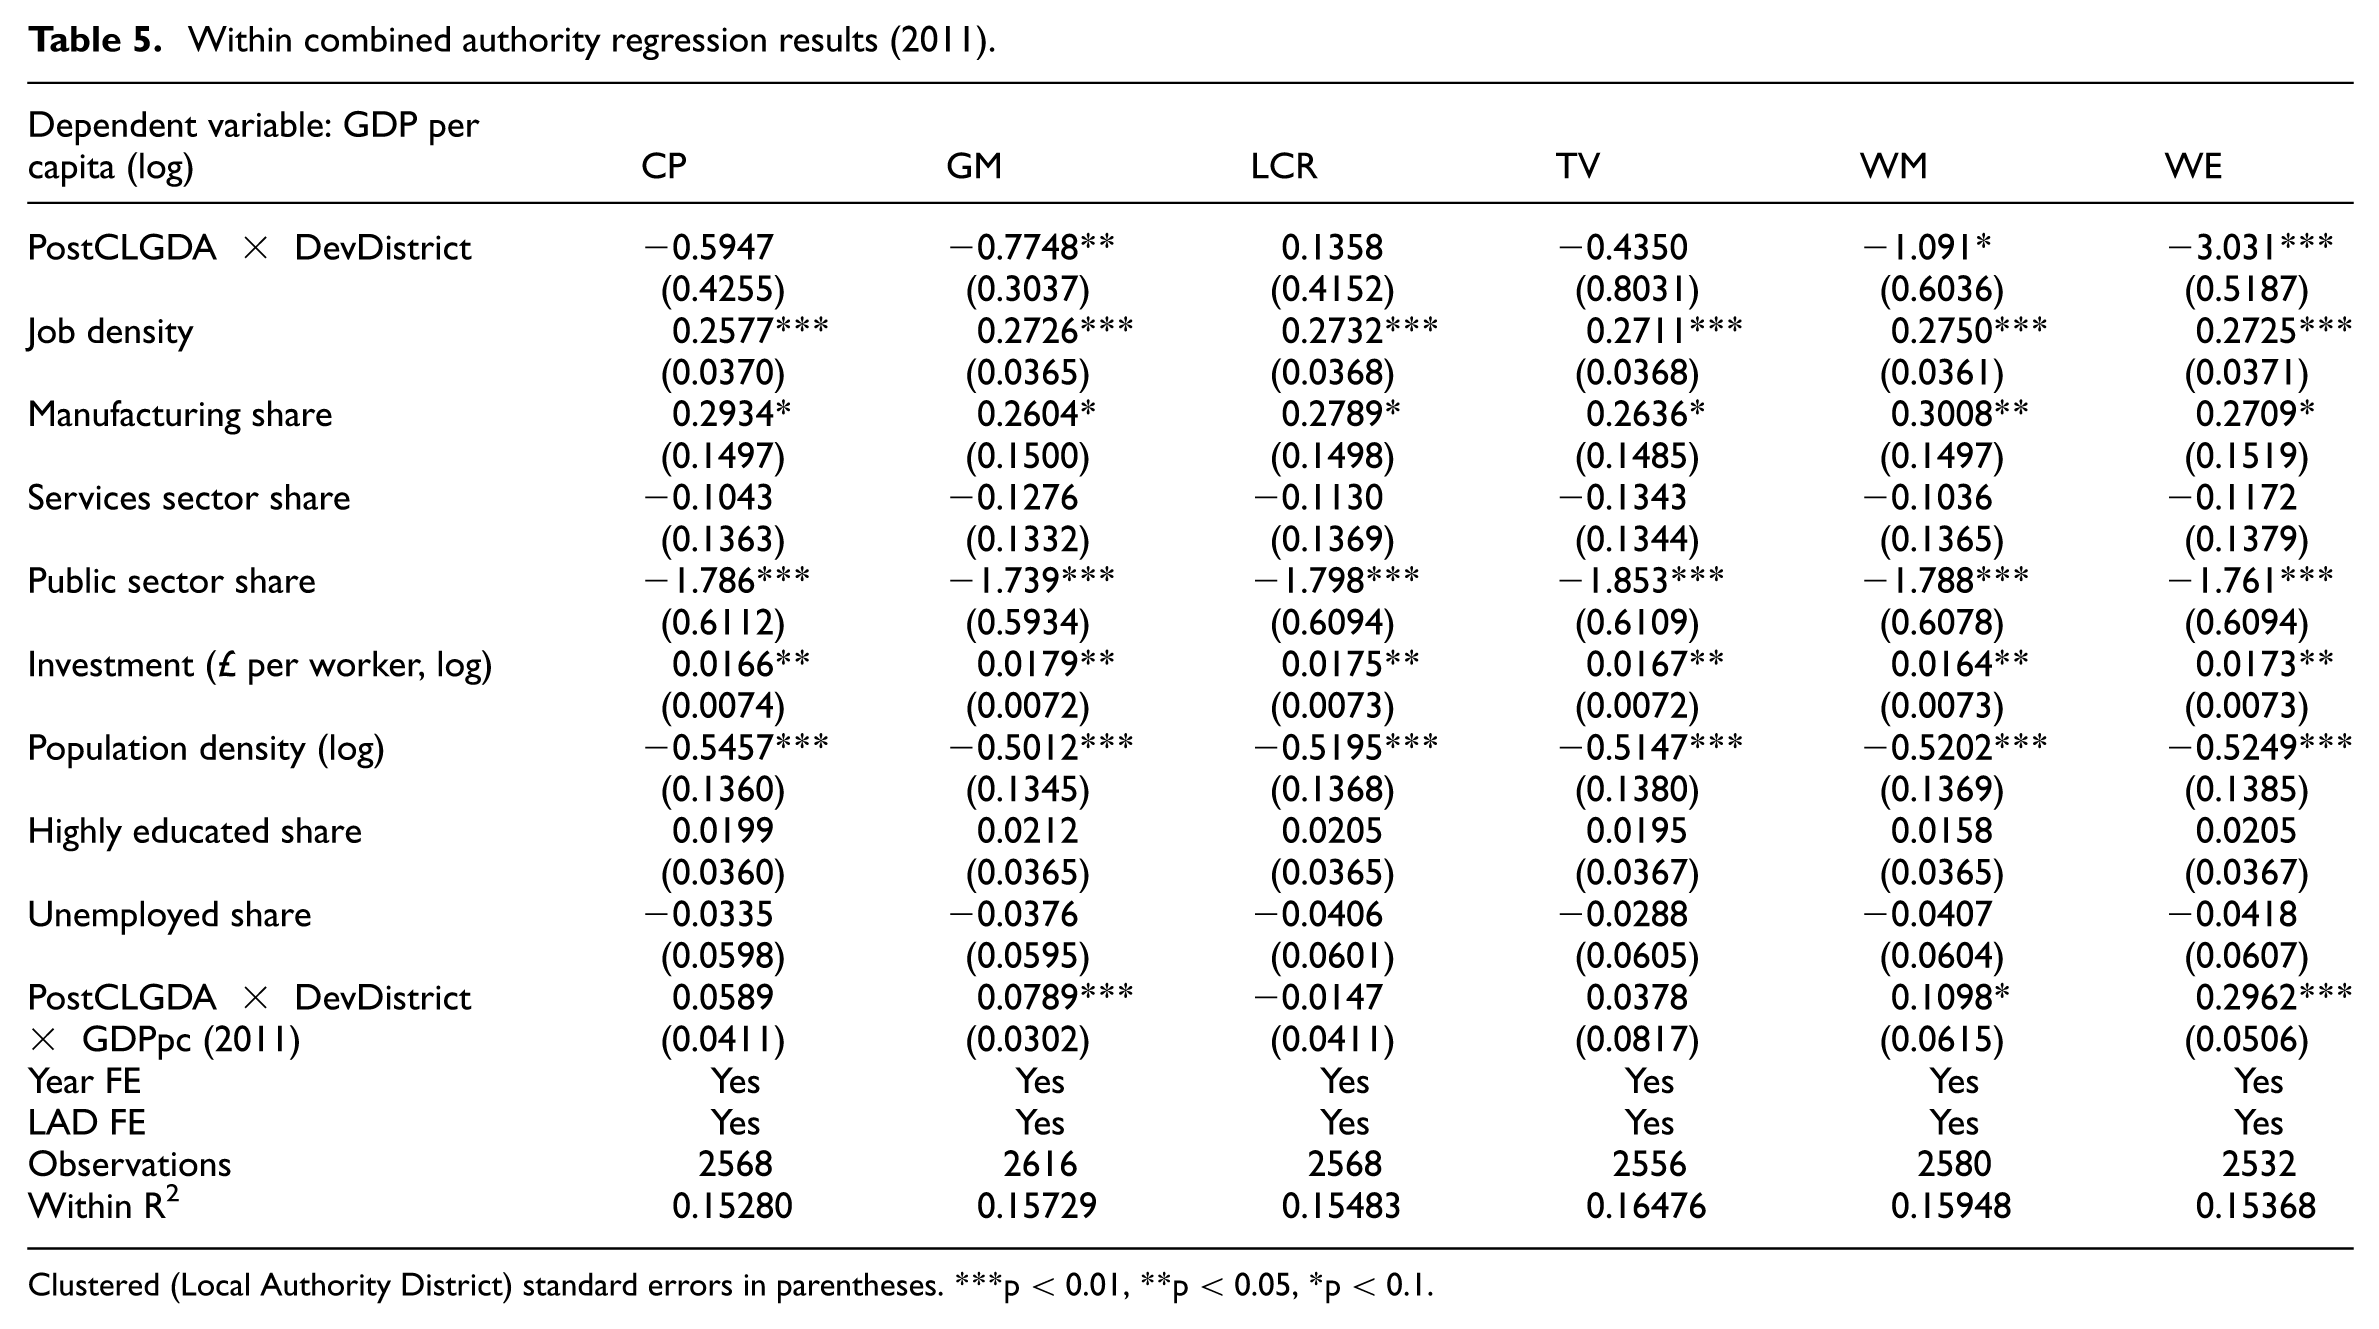
Clustered (Local Authority District) standard errors in parentheses. ***p < 0.01, **p < 0.05, *p < 0.1.
Together, these findings contribute to three wider debates.
Devolution as a solution to regional inequalities
First, they speak to the literature on whether devolution reduces regional inequalities. Evidence across OECD countries is mixed: decentralisation is sometimes associated with convergence (Kyriacou et al., 2017), but can also coincide with widening gaps (Rodríguez-Pose and Gill, 2004). My results fall firmly in the latter camp. Far from promoting convergence, the CLGDA 2016 appears to have either left patterns unchanged or exacerbated inequalities within MCAs. This underscores a broader point: framing the reduction of inequalities primarily as a growth problem overlooks the importance of redistribution. Moreover, where growth has occurred, it has tended to be concentrated in already prosperous areas, consistent with the dynamics of agglomeration (Duranton and Puga, 2004; Rodríguez-Pose and Gill, 2005).
Spatial complexities
Second, the results highlight the complexity of spatial development under devolution. Both the design of the deals and the characteristics of the regions themselves shaped outcomes, reflecting insights from the territorial capital and absorptive capacity literatures (Becker et al., 2013; Camagni and Capello, 2013; Caragliu and Nijkamp, 2012). Areas with stronger human capital or institutional capacity appear better able to benefit from new powers, while weaker areas lag behind – a dynamic echoed in studies of EU Cohesion Policy (Becker et al., 2013) and institutional reforms in Italy (Putnam, 1994). In England, this is compounded by the top-down nature of devolution, which limits attention to building institutional capacity within MCAs themselves (Hoole et al., 2023).
Limited success of CLGDA 2016
Third, the findings add to critical evaluations of the CLGDA 2016. Analysts have highlighted the limits of English devolution, pointing to over-centralisation of finance (Centre for Cities, 2023), administrative bottlenecks (Hughes and Lupton, 2021), vested interests in deal making (Tomaney, 2016) and the legacy of London-focused development (Aalbers, 2020). The fact that devolved areas have not outperformed their peers empirically reinforces these critiques. As Lee (2019) argues, the ability of city governments to transform growth trajectories is necessarily limited relative to wider economic forces. The English experience therefore mirrors findings elsewhere – for instance, the absence of measurable gains from devolved powers in Wales and Scotland (Morelli and Seaman, 2007).
Conclusion
The evidence presented here suggests that the CLGDA 2016 has not yet delivered economic transformation. Growth has not accelerated, and the distribution of its benefits has tended to reinforce rather than reduce within-city inequalities. Taken together, this challenges the idea that devolution can be conceived in simple terms of ‘success or failure’. Instead, outcomes reflect the interaction of fiscal design, institutional capacity and local economic structures. Future policy must therefore grapple not only with the scale of powers devolved but also with the contexts into which they are introduced. Without this, devolution in England risks entrenching rather than alleviating the country’s deep-rooted regional inequalities.
Footnotes
Appendix A. Supporting analysis
Appendix B. Robustness
Funding
The author disclosed receipt of the following financial support for the research, authorship, and/or publication of this article: I am grateful to the Economic & Social Research Council who funded my Doctoral Training Partnership PhD at the University of Cambridge, and to Sir Terry Leahy for the funding of my Fellow position at the Alliance Manchester Business School, University of Manchester, during which this article was finalised.
Declaration of conflicting interests
The author declared no potential conflicts of interest with respect to the research, authorship, and/or publication of this article.
Data availability statement
All data used in the production of this report is available Open Access from the hyperlinks presented in the Data section. The R Code used to analyse the data is available on request.