
Abstract
Parties make hundreds of campaign promises but not all are seen by voters as central to a party’s offering. Studies of government promise fulfillment accept that not all promises are equivalent but in practice treat all promises equally because they lack an appropriate means of measuring promise centrality. To demonstrate the importance of accounting for pledge fulfillment, we develop a conjoint experiment method to measure public opinion about promise centrality which can be used to construct centrality weights. We demonstrate this approach’s utility by examining the 2017 UK Conservative manifesto. Centrality weighting reduces our assessment of Conservative promise keeping by 21 percentage points (1.3 standard deviations of typical promise-completion rates found in comparative studies). Weighting increases the centrality of EU promises sevenfold and immigration promises sixfold, and reduces the centrality of miscellaneous administrative promises by more than half. These results illustrate that pledge centrality cannot be ignored when assessing pledge fulfillment.
Voters can only exert ex ante influence over how they are governed when political parties present meaningful choices at elections that allow voters to predict how a party will govern (American Political Science Association (APSA), 1950; Pomper and Lederman, 1980; Stokes, 2001). This program-to-policy linkage (Thomson, 2001) is key to channeling societal demands into policy outputs. Parties fulfill this obligation through “promissory representation” (Mansbridge, 2003; Thomson et al., 2017): a process by which parties and candidates make promises during election campaigns and keep these promises once in government.
A large literature has assessed how well democratic governments achieve promissory representation in practice. A consistent finding is that parties generally keep their promises at high rates (Artés, 2013; Costello et al., 2016; Kalogeropoulou, 1989; Krukones, 1980; Moury, 2011; Pétry and Collette, 2009; Pomper and Lederman, 1980; Rose, 1984; Royed, 1996; Pétry and Duval, 2018; Thomson et al., 2017), but this varies under different institutional and political circumstances. For instance, pledge fulfillment is higher under one-party government (Thomson et al., 2017) and regional parties fulfill fewer promises (Pétry et al., 2018).
These pledge fulfillment studies face a conceptual and methodological challenge: should all promises be treated equally, or are some promises more important than others? If some promises are more important than others, how should we measure importance? In practice, essentially all existing pledge fulfillment studies treat every promise equally (including Artés, 2013; Costello et al., 2016; Kalogeropoulou, 1989; Krukones, 1980; Moury, 2011; Pétry and Collette, 2009; Pomper and Lederman, 1980; Rose, 1984; Royed, 1996; Thomson et al., 2017).
Equal promise weighting can lead to results which contradict our intuitive understanding of pledge fulfillment. For example, George H. W. Bush is widely cited in the literature (Mansbridge, 2003; Pétry and Collette, 2009; Schedler, 1998) for breaking what was widely perceived as his central campaign promise: “Read my lips: no new taxes.” In Thomson et al.’s (2017) data, Bush has the second highest level of promise keeping among US Presidents. Whether we should consider Bush a notorious promise breaker—or a highly effective promise keeper—depends on how we weigh different promises.
Despite near-universal use of equal promise weighting in quantitative analysis, the literature has long acknowledged there are good reasons to value some promises over others. For example, Krukones (1984: 136) wrote “fulfilling a respectable percentage of campaign pledges may not be as important for presidential success as making good on pledges which are most important to the electorate.” Similarly, Costello et al. (2016), observe that “few people would dispute that the Fine Gael pledge to ‘establish a single state-owned commercial water company—Irish Water’ is more important than its pledge to ‘strike a medal named after General Michael Collins.’” Moury (2011: 38) remarks on the oddity that “a promise to reduce taxes by 10% is weighted in the same way as promises about substituting old civil service computers.” 1 Even studies which do not differentiate between promises in their quantitative analysis almost always motivate the analysis using important promises. 2
Despite recognizing that promises vary in importance, the literature has avoided promise weighting because it is difficult to create weights in a justifiable, consistent, and objective manner (Brouard et al., 2018; Costello et al., 2016; Kalogeropoulou, 1989: 292; Moury, 2011: 38; Naurin, 2011; Rallings, 1987: 3), and instead has treated promises as if they have equal weight.
To demonstrate the importance of accounting for pledge centrality when assessing promise completion, we develop a method to create defensible pledge-importance weights and show the effect that accounting for pledge centrality can have on our assessment of promise completion. Promissory representation is normatively important because it allows voters to make reasonable judgments about how they are likely to be governed. From this perspective, what makes a promise important, or not, are voters’ perceptions of how central it is to a party’s agenda. Voters’ judgments of centrality might arise from the emphasis parties place on different issues, budgetary allocation, or media salience. What matters from a normative perspective, however, is not whether centrality judgments arise from media coverage, or the number of sentences in a manifesto, but what those judgments of centrality are.
We propose a method of measuring the perceived centrality of promises made in an election manifesto. To demonstrate the application of this method—and the empirical importance of accounting for pledge centrality—we examine 257 separate 2017 Conservative party manifesto promises—the (near) universe of testable manifesto promises. 3 To measure which promises were perceived as central to the government’s agenda, we use a conjoint experiment design that allows us to assess the relative centrality (as perceived by the public) of each promise in a survey-time-efficient manner. We then use a Bayesian multi-membership hierarchical linear model (Browne, 2001; Bürkner, 2017; STAN development team, 2018) to estimate each promise’s centrality and create pledge-centrality weights.
The 2017 UK election is a good test case for weighting policy promises by their centrality because it featured one overarching issue: Brexit (Prosser, 2018). The election took place around a year after the UK voted to leave the European Union (EU). Prime Minister Theresa May called an early election because she wanted a larger majority and a mandate for her planned approach to leaving the EU. If the equal promise weighting approach is robust, the Brexit test should be easy to pass. While Brexit is unique to the British case, election campaigns routinely focus on a handful of promises out of hundreds made during a campaign (Krukones, 1980). If equal promise weighting cannot pass an easy test, it is also likely to fail where the answer is less clear cut.
Our results confirm the importance of taking promise centrality into account. The Conservatives’ pledge fulfillment rate falls by 21 percentage points after weighting, equivalent to a 1.3 standard deviation fall in fulfillment (using the Comparative Party Pledge Group (CPPG) data covering 81 manifestos as a benchmark). If we take the standard approach of treating each promise equally, just 5% of Conservative promises related to Brexit—the election’s defining issue (Mellon et al., 2018). If we account for promise centrality, Brexit’s importance increases sevenfold. Conversely, the importance of the many minor pledges related to bureaucratic reorganization—each given equal weight to Brexit by the standard approach—is negligible. Our results are not driven by the sui generis nature of Brexit, as our conclusions hold even excluding Brexit promises.
These results demonstrate that accounting for promise centrality can substantially alter conclusions about the content of a government’s agenda and pledge fulfillment. This is not to suggest that promise completion will always be lower if we take centrality into account. It is also plausible that a government might abandon a large number of less central pledges to focus its attention on its central policy agenda. If this were the case, taking pledge centrality into account would increase the government’s fulfillment rate. Whether these effects will cancel out in comparative analysis is unclear, and at the very least, our results suggest we need to reexamine the factors affecting pledge fulfillment in light of promise centrality.
Why Party Promise Keeping Matters
Democratic government is premised on the idea that people should be able to make decisions about how they are governed for themselves (Gould, 1988; Sen, 1999; Waldron, 1999). While voters can make decisions ex post by voting out governments that fail to follow their wishes, ideally, democracy should allow voters to actively choose policies ex ante (Andeweg and Thomassen, 2005; Stokes, 2001). Promissory representation is a prerequisite for voters to make meaningful ex ante choices in a democracy (Stokes, 2001).
When promissory representation fails, it leaves voters with little ability to influence policy. Examining 42 Latin American presidential elections (1982–1995), Stokes (2001) found 12 cases in which winning candidates proposed expansionist economic policies (emphasizing job creation, growth and government spending above fighting inflation and repaying foreign debt) and then implemented the opposite policies once in office. Stokes argues voters in Latin America lost the ability to know what parties would do if they took power, therefore losing ex ante democratic control. Instead, voters could only rely on ex post punishment at subsequent elections. Although ex post sanctioning is important for democracy (indeed Matthieß (2020) provides strong evidence for retrospective pledge voting), it represents a tenuous link between voter preferences and policy outcomes.
Why Is Some Party Promise Breaking Normatively Worse than Other Promise Breaking?
While democratic norms imply parties should keep campaign promises in general, do some campaign promises matter more than others? Schedler (1998: 198) argues, “all campaign promises are equal” because breaking any promise violates a binding commitment. 4 There are many reasons to dispute this claim including the cost and consequences of particular policy promises. However, since we are interested in the democratic process per se, the normative importance of promises should derive from how they enable voters to make meaningful democratic choices between parties and platforms. 5
Governments face many competing pressures on their ability to implement policy (Brouard et al., 2018; Froio et al., 2017). The reality of policymaking is that governments do not achieve all their goals in office (Thomson et al., 2017), a fact voters are aware of (Naurin and Oscarsson, 2017). In order to make meaningful choices when governments are unlikely to fulfill their entire platform, voters need to know which promises will be prioritized above others—that is, voters must understand which promises are central to a party’s offering. Consequently, breaking promises that are perceived as central to a party’s election platform threatens the democratic process more than breaking promises that are seen as peripheral because voters face a larger gap between their expectations of what will happen if the party is elected and what actually happens.
Promissory Representation as a State of the World
Our conception of promissory representation sees it as an assessment of the state of the world and not necessarily as a statement of moral culpability. Promissory representation on our view is fundamentally about voters being able to make decisions based on a correct set of expectations about the outcomes if different parties gain power. This is normatively good (all else equal) because democracy is about allowing voters to make meaningful choices about how they are governed (i.e. they can exert ex ante control over policy through their decisions).
On this view, it is the voters’ perceptions of a party’s agenda that are normatively important and not the party’s actual priorities. This means that voters can fail to have high promissory representation if the party does not manage to communicate its true priorities to voters and they make their decision on the basis of incorrect information. While the party is obviously a key actor in getting voters to understand its priorities, other actors may play a role in communicating priorities to voters. The media, for instance, may inform or misinform voters about parties’ issue priorities. If the media does misinform voters about a party’s agenda and priorities, this would still represent a failure of promissory representation, but not one that the party would necessarily be responsible for.
It might seem odd then that we would measure a government’s success partially based on a set of priorities they do not perfectly control. However, we measure government success in terms of outcomes that can be affected by outside forces all the time. Unemployment, inflation, and life expectancy are all affected by government decisions but can also be affected by forces beyond the government’s control. Indeed, any assessment of a party’s culpability for high or low promissory representation will always involve an assessment of whether factors beyond the government’s control (e.g. pandemics, recessions or new technologies) made some promises very difficult to fulfill or no longer relevant.
A government that fulfills only some of its promises and does not perfectly align its goals with what voters believed might still be considered to have performed well under the circumstances of a dishonest media environment and a disengaged electorate.
This theory therefore implies that a political system with honest parties, an informative unbiased media and civil society, and an attentive and knowledgeable electorate is good for promissory representation and democracy more generally (these are not the only reasons why these things are desirable in a democracy but aiding promissory representation is one function they can perform). Similarly, our conception of promissory representation also implies that parties have a moral duty to clearly communicate their policies and priorities to voters.
If a party stated its priorities in a manifesto but campaigned publicly on issues it did not plan to prioritize in government, it would be highly culpable for having achieved low promissory representation in government. By contrast, a party which made best efforts to communicate its priorities but failed to do so because the media consistently mischaracterized its position and priorities would be considerably less morally culpable for its failure to achieve promissory representation. In that case, the media would share a large part of the blame for the lack of promissory representation.
It is also worth pointing out, however, that even if we were to take the more limited view of promissory representation as merely the extent to which parties follow through on their priorities (as opposed to voters’ perceptions of their priorities), our approach in this article can simply be interpreted as using voter perceptions as a proxy for a party’s actual priorities.
Should We Expect Pledge Centrality to Matter in Practice?
Where the empirical literature has considered promise importance, it has generally accepted that pledge weighting is normatively justified while maintaining it makes little practical difference. The argument states that because parties make more pledges on important issues, equal weighting accurately reflects different issues’ importance (Mansergh and Thomson, 2007; Moury, 2011: 38), an argument akin to the salience approach to coding party positions from manifesto data (Budge et al., 2001). However, it is unclear whether manifestos do include systematically more promises on important issue areas or that this relationship is stable. The salience approach to manifesto data has been critiqued as a measure of party emphasis (Laver, 2001; Lowe et al., 2011; Prosser, 2014) because it does not necessarily capture what is communicated to the public about the party’s agenda. Håkansson and Naurin (2016) find Swedish parties make more promises in issue areas of importance to the public, but that the proportion of promises devoted to these areas has decreased over time. In addition, even if promises in important issue areas receive more space in manifestos overall, voters care about which specific promises are kept within an issue area. There is no reason to think success within issue areas is so correlated that the content of fulfilled promises can be ignored. For example, in 2008, Barack Obama promised to “sign a universal health care bill” and “invest in electronic health information systems” (PolitiFact, 2012). Universal health care was a key component of his platform; investing in electronic health information systems was not. Obama’s mandate was to deliver universal health care, not generically fulfill health care promises.
How might a promise’s centrality affect its probability of fulfillment? Parties are likely motivated to complete central promises since they will know that the public will pay more attention to their actions regarding these promises. This extra attention would likely lead to greater electoral consequences as a result of breaking a central promise (e.g. Brandenburg et al. (2019) find parties are punished for breaking promises where they have issue ownership) compared to peripheral promises that voters were unaware of. Conversely, promises may be seen as central because they address difficult issue areas, meaning these promises may simply be more difficult to achieve. We lack strong expectations about which factor will be more important in the long run and cannot yet test this proposition. Both factors are relevant for the promise to leave the EU. The government was motivated to achieve Brexit—attempting to pass a withdrawal bill in parliament multiple times—but was unable to overcome the political deadlock. The limited evidence for the influence of similar factors, such as media salience, on promise fulfillment is mixed (Kostadinova, 2018; Vodová, 2020).
By our count, only 3 of the more than 100 pledge fulfillment studies attempt to account for the different normative importance of pledges. Krukones (1980, 1984, 1985) 6 and Costello et al. (2016) both use the media’s judgment of which promises were important, while Royed (1996: 68) relies on a “value judgement” of importance to identify major promises. While these importance measures are—by the authors’ own admission—highly imperfect, they are useful to check the assumption that promise weighting makes no substantive difference.
On multiple measures, the results from these three studies show little similarity between overall promise completion and major-promise completion. To illustrate, we plot the completion rate of major promises against the completion rate for all promises (Figure 1): 14 from Krukones; 2 from Royed; and 2 from Costello, O’Neill, and Thomson. The mean absolute gap between the major-promise-completion rate and the overall completion rate is 28 percentage points, with major promises completed at a 9 percentage points lower rate on average across 18 elections covered by Krukones; Costello, O’Neill, and Thomson; and Royed. Perhaps more importantly, the overall promise-completion rate explains just 7% of the variance in major-promise completion, meaning that unweighted success tells us little about success in major-promise completion. Consequently, if major-promise completion is what normatively matters, unweighted pledge fulfillment studies are not informing us about governments’ performance in this respect.
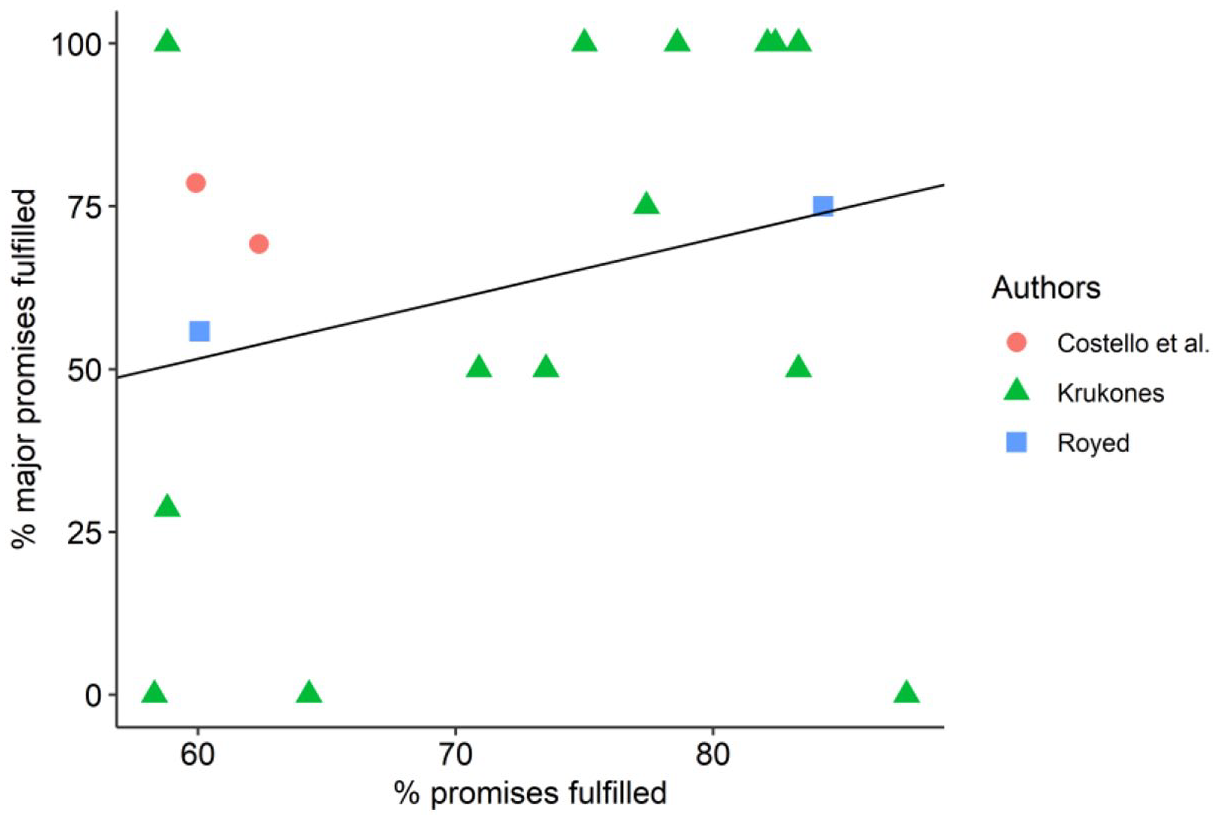
Estimates of Government Party Pledge (Partially/Fully) for All Promises (x-axis) and Major Promises (y-axis) from Costello et al. (2016), Krukones (1980, 1984, 1985), and Royed (1996) (r2 = 0.07).
The gap between major promises and all promises is also clear from qualitative accounts of these elections. For instance, Jimmy Carter failed to deliver his major campaign goals: lower inflation, lower unemployment, and a national health insurance program (Krukones, 1985). However, he delivered a long list of lower profile promises including raising farm prices and cutting revenue sharing to the states. Krukones (1985) observes that public perceptions of Carter’s presidency better resemble his 29% success rate on major promises than his 59% fulfillment rate on all promises. Similarly, when Costello et al. (2016) look only at high-profile pledges in Ireland, Fine Gael completed its promises 8 percentage points more often than Labor, compared to being 2 percentage points worse when looking at all promises. This matches public perceptions that Labor was worse at fulfilling election pledges and that the public’s trust was betrayed by Labor’s governing performance (Costello et al., 2016). In each case, public perceptions more closely resemble the government’s performance on major-promise fulfillment than equally weighted promise fulfillment.
Thus, the limited existing evidence from three studies of major promises suggests more central promises may be less likely to be fulfilled but most clearly shows that there is simply little relationship between overall and high-profile promise fulfillment rates. Most importantly, it suggests that promise centrality is vital to understanding promissory representation.
How Should We Measure Central Promises?
In the previous two sections, we established that we should normatively care about promise centrality when assessing promissory representation and that the available evidence suggests governments’ records look quite different when we focus on their central promises. But how should we measure centrality? As we explained above, if we are interested in the democratic process, we should care about voters’ perceptions of promise centrality. 7 The perceptions themselves are the key normative consideration (rather than the party’s own perceptions of its priorities) because voters decide on the basis of their own perceptions of the party’s priorities. In order to make meaningful choices between the different offerings parties make at elections, voters must know what the parties will prioritize when in government.
Existing studies which distinguish major and minor pledges have done so using media coverage of pledges (Costello et al., 2016; Krukones, 1980, 1984, 1985) or the researcher’s judgment of importance (Royed, 1996). Although these are a step removed from voters’ perceptions, expert judgments are likely to be sensible, and voters’ perceptions of what promises are central to a party’s agenda may well be influenced by media coverage. Both approaches may be correlated with what voters’ perceived as central to the parties’ agenda in the election, but the extent to which they actually are is an empirical question, which we can only answer by first directly measuring voter perceptions.
The other limitation of previous approaches is that they coarsely categorize promises as being either major or minor. Ideally, a measure of promise centrality should measure continuous differences between promises rather than choosing an arbitrary cutoff between central and non-central promises. For example, if we take Obama’s 2008 US election promises (PolitiFact, 2012), it is easy to see that supporting an improved weather prediction program was less central to his agenda than promising to create a foreclosure prevention fund for homeowners. But it is also probably the case that this latter promise was still less central than the promise to sign a universal health care bill.
Our analysis fills this gap by using a conjoint experiment design to measure the perceived centrality of a party’s promises in voters’ minds (allowing centrality to vary continuously). Our approach converts these ratings into promise weights which allow us to assess the government’s overall promise keeping performance accounting for the centrality of fulfilled and unfulfilled promises. This approach provides a novel opportunity to study promissory representation in a way that captures the relative centrality of party promises, allowing us to understand how voters’ perceptions of campaign promises affect our assessment of government pledge fulfillment.
Data
To demonstrate our promise-centrality methodology, we fielded a conjoint survey experiment to gather data on public opinion about the 257 promises made in the 2017 Conservative manifesto. The survey was fielded to 4,908 British YouGov respondents slightly under a year after the 2017 election (2–9 May 2018). While an immediate post-election survey would be ideal, the correlation between our survey results and other (contemporaneous) measures of issue importance at the election suggest the election was recent enough that respondents remembered the campaign and their perceptions of what the party stood for.
With one caveat, 8 we follow the CPPG definition of pledge—“a statement committing a party to one specific action or outcome that can be clearly determined to have occurred or not” (Thomson et al., 2017: 532). We also follow CPPG in distinguishing between pledges to maintain or change the status quo (Mansergh and Thomson, 2007; Thomson et al., 2017). To reduce respondent burden, we streamline the promise descriptions while still communicating the necessary information for respondents. 9 We code promise keeping according to the standard categories: “fully fulfilled,” “partially fulfilled,” and “not fulfilled” (Naurin, 2014; Thomson, 2001). 10
To facilitate comparisons, we coded the promises into issue areas using the schema used by the British Election Study Internet Panel (BESIP) (Fieldhouse et al., 2019) for coding most important issue (MII) responses. Many promises straddled multiple areas, so each coder separately coded up to three issues for each promise, with issue areas ranked by perceived relevance to the promise (the first issue is used for analysis).
Issue coding allows us to summarize how pledge-centrality weighting changes the content balance in the manifesto and enables comparison with other sources of data about the political agenda. We compare the issue emphasis of (1) equally weighted manifesto promises, (2) centrality-weighted promises, (3) the distribution of MII responses in the BESIP 2017 post-election wave, and (4) media coverage of issues during the campaign, using data from the Loughborough media tracking project which tracked 15 media sources across the campaign (Deacon et al., 2017). We recode the manifesto and BESIP MII issue areas (47 categories) into the media tracking schema (12 categories). 11
Measuring Public Perceptions of Promise Centrality
In order to estimate each pledge’s centrality to the government’s platform, we needed to measure which promises voters saw as central. One approach would be for respondents to rate promises individually, but this would have several drawbacks. First, it would place a heavy burden on respondents. Second, voters do not vote for individual promises, but rather bundled promises in election manifestos, and voters make trade-offs between policies. Third, respondents are sometimes unwilling to say anything is unimportant if they are not forced to make trade-offs (Johns, 2010).
Instead, we presented respondents with sets of promises in a manner analogous to a conjoint design survey experiment (Hainmueller et al., 2014)—though in our case, we only vary one factor, which promises a respondent receives—and asked respondents to rate randomly assigned policy bundles according to how central they were to what the government promised to do.
Conjoint designs randomly allocate the specific attributes of a target under consideration (e.g. a car’s color, cost, and size) to estimate each attribute’s effect on the overall assessment of the target. Conjoint designs are widely used within political science (e.g. Bansak et al. (2020) review 124 published since 2014), with previous studies using conjoint designs to examine voters’ attitudes toward policy bundles (Horiuchi et al., 2018) but not which bundles are seen as central to a particular party’s agenda. The conjoint design improves on measuring promises individually in several ways:
Policies are naturally assessed as bundles.
It removes the burden from respondents to have an opinion on each separate policy.
If respondents have little reaction to a policy, conjoint analysis will estimate an effect close to zero.
Previous research has found attributes measured via conjoint experiment more accurately predict decisions than those made with separate rating scales (Neslin, 1981).
Each bundle is a set of four randomly assigned policies (sampled without replacement, so there are no duplicate promises within each bundle). Each bundle is independently sampled (so the same promise might appear in more than one bundle). Each respondent is shown three bundles of four policy promises at a time, with each respondent rating two pages of three bundles (24 promises in total). Consequently, the respondent burden is light, as each respondent sees only 24 promises and gives six centrality ratings (one for each bundle), even though it is a conjoint experiment with 257 conditions. In a conjoint framework, each policy’s presence or absence from a bundle is the equivalent of one attribute under consideration (e.g. a car’s color, cost, etc. in the car example). Respondents saw 9,816 screens, 29,448 policy bundles, and 117,792 promises (~460 evaluations per promise). We estimated our study would have 96% power. 12
Before respondents rated each policy bundle’s centrality, we asked them whether each bundle contains good or bad policies (see Figure 2). This was for two reasons: first, it is important information for understanding how respondents perceive promises, and second, because it makes clear that the follow-up question is asking about something other than the respondent’s personal preferences about the policies, and is instead trying to tap into how central a promise was to the Conservative offer, even if that offer was unattractive to the respondent.
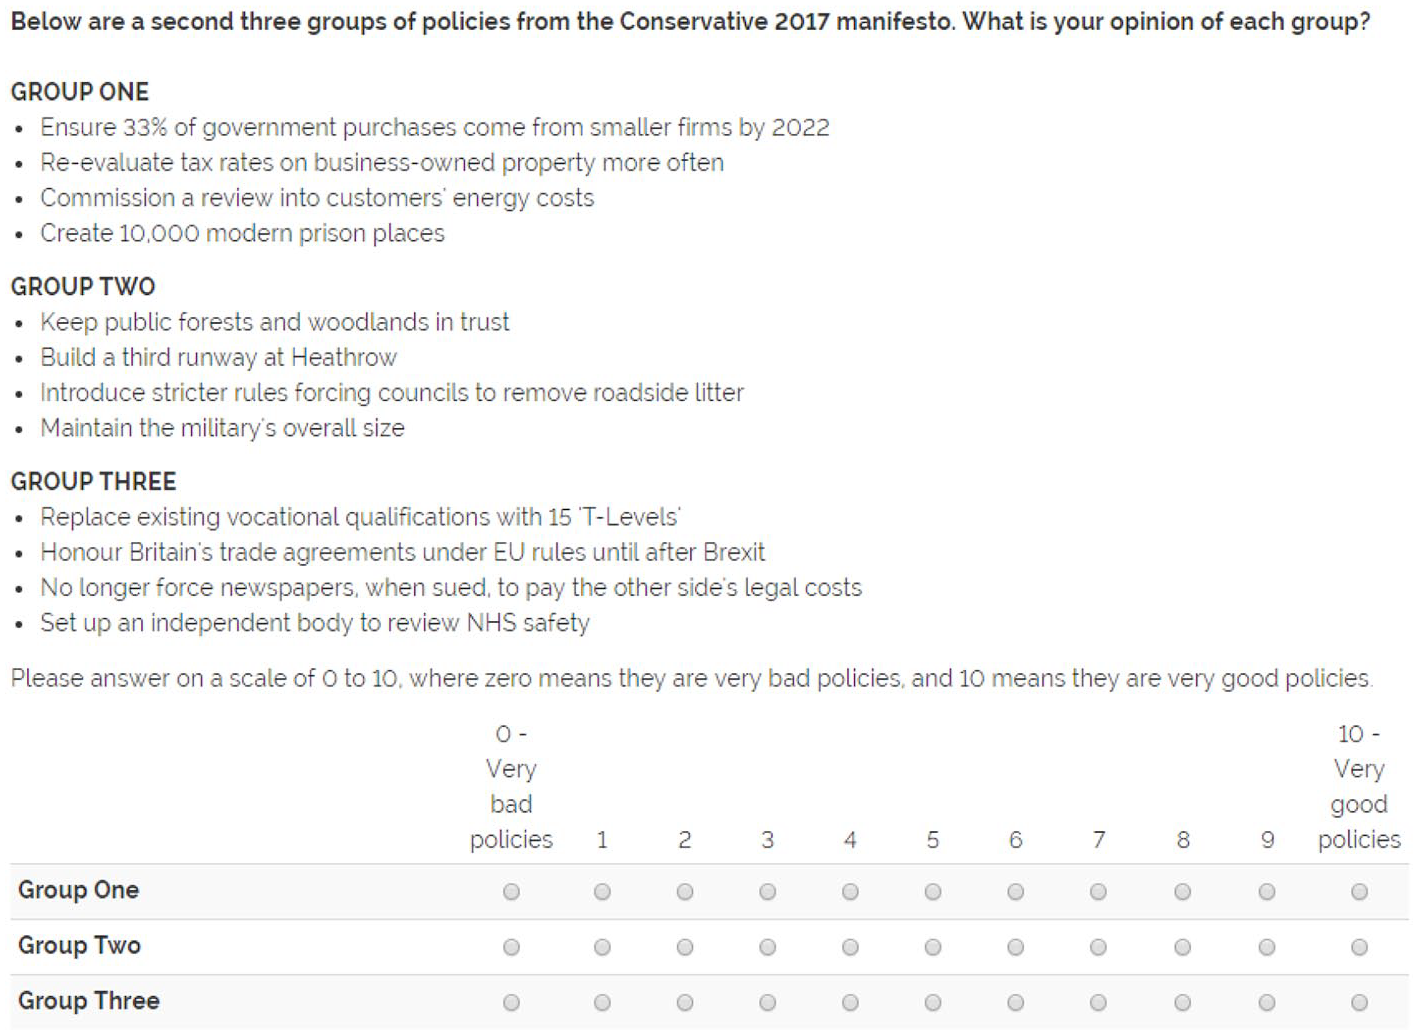
Example of the First Experimental Screen Where Respondent Rates How Good Three Policy Bundles Are.
After respondents rated each bundle’s policies as good or bad, respondents assessed the same three bundles in terms of how central they were to what the Conservatives promised at the 2017 election—our key variable (see Figure 3).
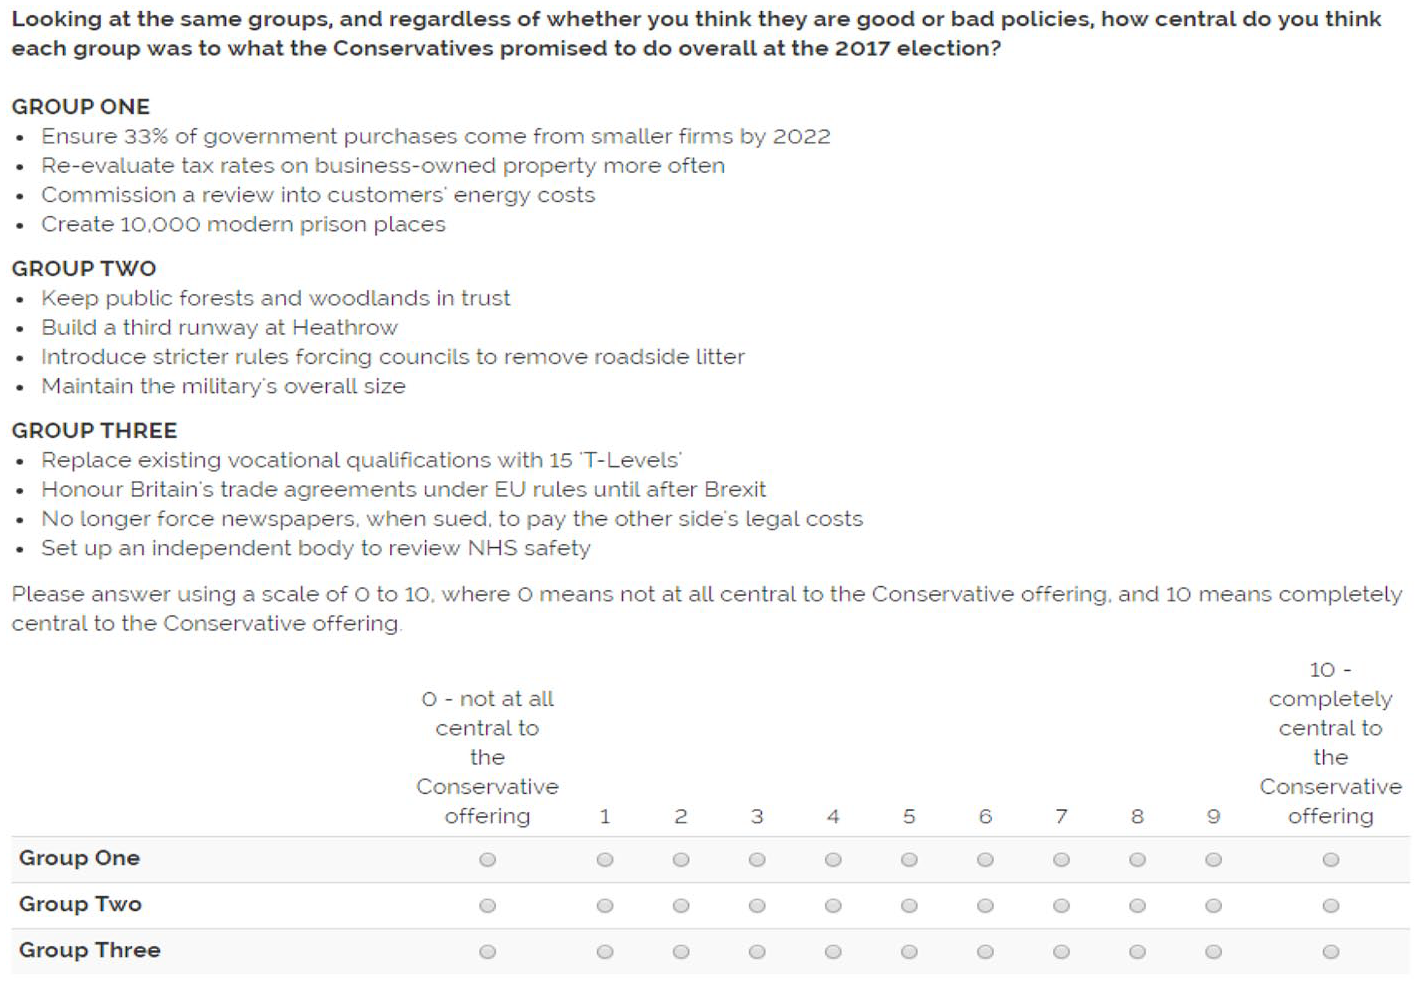
Example of the Second Experimental Screen Where Respondent Rates How Central Each Policy Bundle Was to What the Conservatives Promised to Do.
Modeling Strategy
Our experiment has 257 treatments, where each promise is a separate binary condition. Estimating this many parameters means random error will make some estimates appear large by chance if we used conventional statistical methods (e.g. fixed effects (FEs)). Because we use these estimates to create pledge-centrality weights, the relative size of effects is important. We therefore adopt a Bayesian hierarchical modeling approach which yields more efficient random effect (RE) estimates through partial pooling (Gelman et al., 2012). Because we expect promise centrality may follow an over-dispersed distribution with a few central promises and many less central ones, we develop an approach for combining REs estimation with a finite mixture model (FMM) (we refer to this approach as RE/FMM), which allows random intercepts to be drawn from two or more separate distributions. For details of our approach, see Online Appendix B. 13
Creating the Weights
Estimating each promise’s centrality effect gives us an ordering of promise centrality, but in order to weight promises, we need to go beyond the question of which promises are central, to answer the question of how much more central they are. The answer to this question is necessarily somewhat arbitrary—different transformations will lead to different estimates of relative promise centrality. To create a defensible set of weights, we adopt a two-fold approach. First, we outline the desirable characteristics of the weights, and second, we validate our choice of specific parameters against measures of issue importance from other sources.
Our criteria for promise weights are:
No zero or negative weights: Fulfilling a promise should increase the government’s pledge fulfillment, even if only infinitesimally.
Extreme outliers in terms of low centrality should leave the relative weights of other promises unchanged.
Weights should not be dependent on the scale used to measure centrality (i.e. if all responses were divided by two, we would get the same relative weighting).
The relative centrality of pledges should be constant across the scale (which implies the scale should increase multiplicatively). That is, the relative centrality of two items with the same difference in their ratings should be the same regardless of their specific ratings. For example, a linear scale would violate this criterion because a rating of 10 would only be 1.11 times more central compared to a rating of 9, whereas a rating of 2 would be twice as central as a rating of 1.
Ratings should be comparable across different evaluations of promise sets, that is, how we determine whether a particular centrality rating is “large” or “small” should be constant across studies.
Given these five criteria, we propose to calculate the scores sj for each proposal j using the following formula, where U is the set of proposal coefficients:
The score is calculated by taking the exponent of the coefficients after standardization (according to the standard deviation across U). This means a coefficient that is a standard deviation higher than another coefficient will have a score e (2.718 . . .) times larger. 14
This approach fulfills the first four criteria. The exponential step guarantees all promises increase the total (i.e. no zero or negative weights) and makes the relative weight of two proposals indifferent to a large outlying value (requirements 1 and 2). The approach also fulfills criteria 3 because the standardization step means the results are unaffected by the survey response’s scale. The exponential transformation also means more central promises are multiplicatively more central, fulfilling criteria 4.
We only partially fulfill the fifth criteria. In a perfect world, we would scale our specific ratings according to the distribution of all pledge-centrality ratings of past and future promises across all countries. Given this is the first study using this approach, this is impossible. Instead, we use the pooled set of estimates from both our all-respondent and Conservative-only (Online Appendix F) models as our best guess for the population distribution. This compromise is sufficient for our present study because it allows us to compare results between our two models without imposing an arbitrary denominator. However, further research will produce a different set of U values, which may alter these results.
While the exponential transformation has desirable properties, it magnifies the effect of errors at the scale’s upper end, so the weights will vary more, even if we are confident about which promises are most central.
To aid interpretability, we rescale the weights to sum to 1, so each weight represents the weighted proportion of all promises.
Results
First, we examine the correlation between approval and centrality, and find they are uncorrelated (r = 0.08). 15 This indicates respondents were able to distinguish between the concept of how much they liked policies and how central the policies were to the Conservative offering.
Table 1 shows the 20 most central promises (Online Appendix E shows all 257). These have strong face validity as they are major policy changes relating to leaving the EU (“Leave the EU’s Single Market,” “Leave the EU’s Customs Union,” and “Leave the EU”), immigration (“reduce annual net migration to under 100,000”), and continuing the government’s deficit reduction measures (“Cut the deficit by reducing borrowing and cutting government spending”). 16
Central Promises: Combined Coefficient Centered at Zero (Centrality and Approval), Rank (Centrality and Approval), and Weight (Centrality Only).
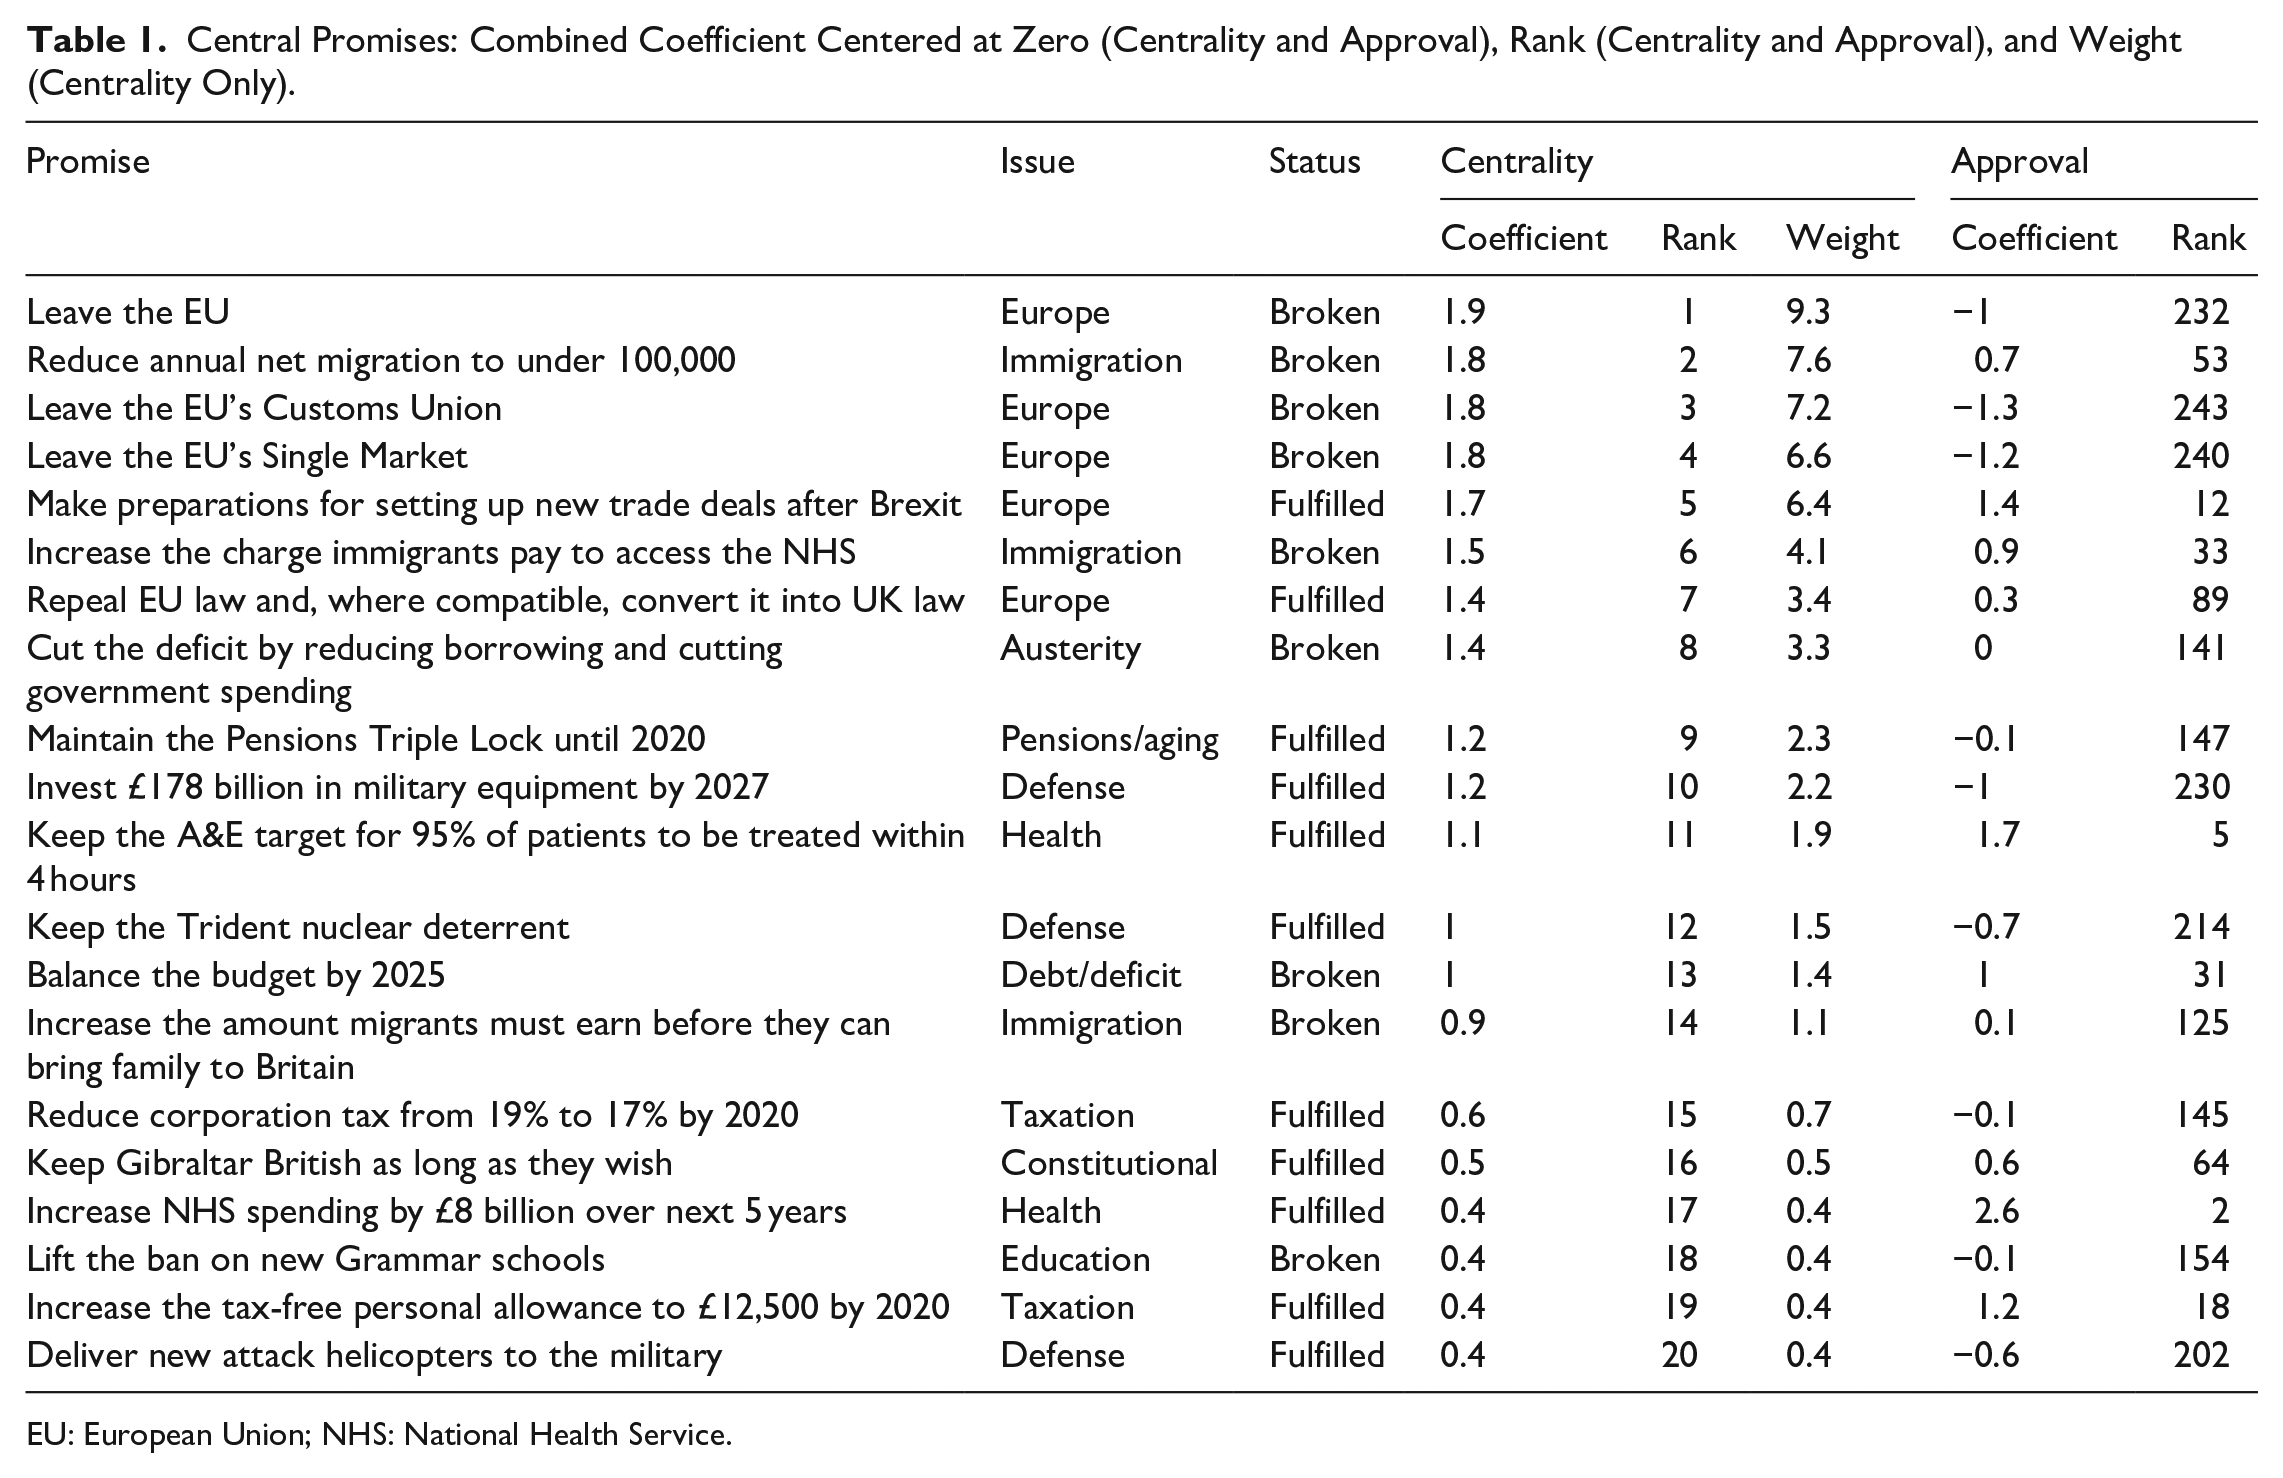
EU: European Union; NHS: National Health Service.
The popular promises also have strong face validity as they almost all relate to the National Health Service (NHS) (e.g. “keep the NHS free at point of use,” “increase NHS spending by £8 billion over next 5 years”). 17 While these promises are popular, they vary in their perceived centrality to the Conservative agenda.
The unpopular promises are also intuitive: legalizing fox hunting, weakening state pensions, and allowing oil drilling without planning permission.
The least central promises are minor administrative promises such as “streamline government services to ask citizens for information less often” and “require schools to have a single point of contact with mental health services.”
Now we are confident the random intercepts capture important variation in promise centrality, we can create weights based on the intercepts. The most central promise (“Leave the EU”) receives 9% of all the weight. This is a plausible weight for this promise, since Leaving the EU was a central plank of Theresa May’s premiership (Fieldhouse et al., 2020) and a large proportion of vote switching between 2015 and 2017 fell along Brexit lines (Mellon et al., 2018). The second largest promise to “Reduce annual net migration to under 100,000” receives 8% weight. This immigration promise has been hugely salient to British political debate and the failure to achieve it led to the EU referendum (Evans and Mellon, 2019).
The centrality of Europe becomes even more apparent when we look at the distribution of issues (Figure 4). This shows the percentage of the Conservatives’ agenda devoted to each issue area when we weight each promise equally and when we weight it by pledge centrality. EU-related promises make up 35% of weighted promises, compared with just 5% if we count all promises equally. 18 Given Brexit’s centrality in recent British politics, the weighted figure has face validity: Theresa May’s failure to leave the EU was seen as a fatal blow to her agenda.
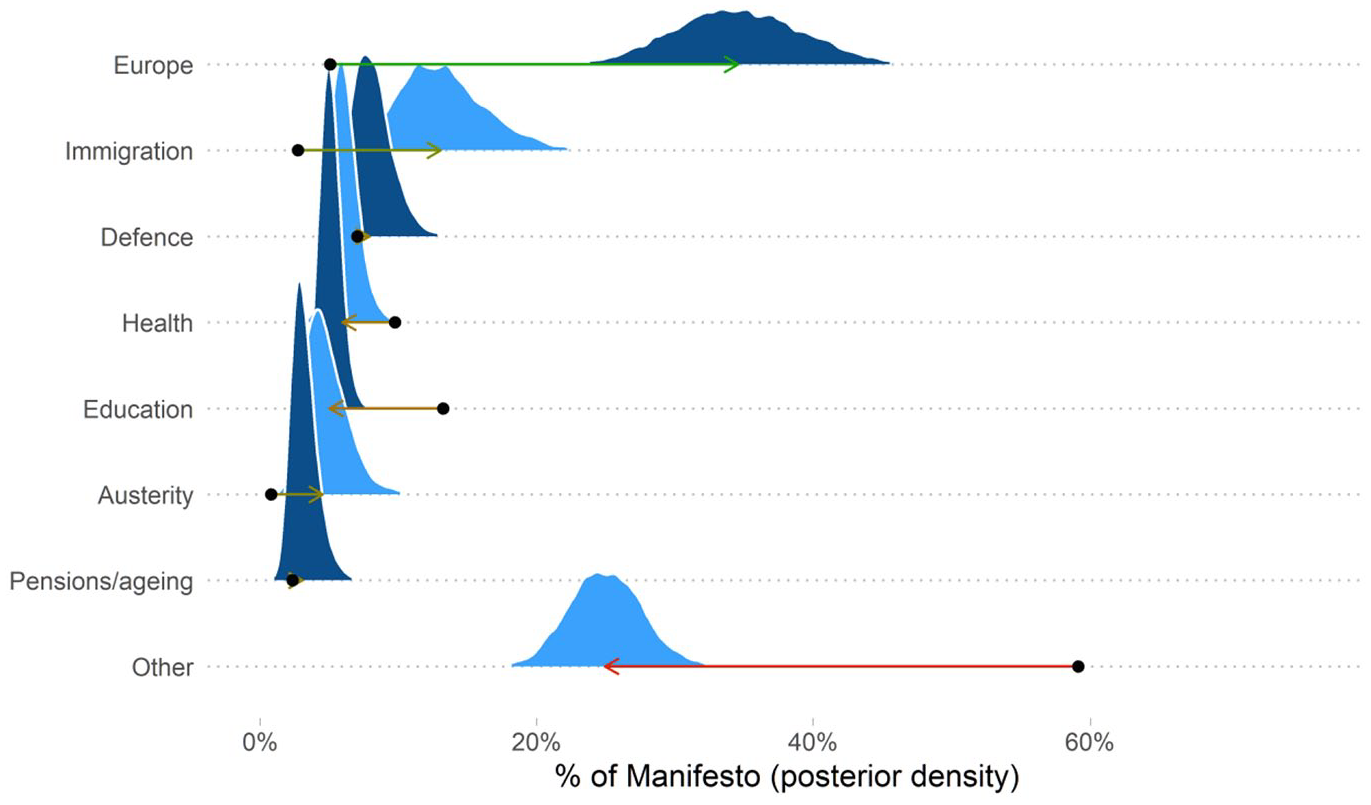
Posterior Distributions of the Percentage of Conservative Manifesto in Issue Areas. Arrows Indicate the Difference between Equally Weighted Proportion of Promises and the Median Weight Falling into that Category. Promise Categories Separately Ordered by Median Value. Other Category Includes Combined Weight of All Promises not Included in Seven Main Categories Listed.
Centrality weights increase the immigration issue area, with most of remaining issue areas dropping in centrality (Figure 4). In particular, the combined “other” category (all 24 remaining issue areas), which contains low weighted promises such as “Use 3rd party identification to make accessing online government services more secure” and “Sanction firms that don’t obey government Internet regulations,” falls dramatically from 61% of the Conservatives’ agenda when equally weighted to 27% using the centrality weights.
We also look at whether these weights match measures of issue centrality from other sources. This is an important aspect of convergent validity, that is, we would expect the balance of issues to be similar but not identical to other sources.
Pledge-centrality weighting brings the issue agenda, as measured in the promises the Conservative’s made in their manifesto, into line with other measures of what was central in the 2017 campaign. Table 2 shows the correlations between the pledge-centrality-weighted issue areas, the equally weighted estimates, and two other measures of the issue agenda in the 2017 campaign: MII responses in BESIP and media coverage during the campaign (Loughborough media tracking project). The correlations show equally weighted promises are uncorrelated with MII responses (r = 0.03) and only weakly correlated with media coverage (r = 0.34). By contrast, pledge-centrality-weighted issue areas are strongly related to BESIP MII responses (r = 0.94) and media coverage (r = 0.73), showing high convergent validity. 19 These changing correlations are driven most by the increased centrality of Europe when using pledge-centrality weights, as Europe is the top issue measured by the MII data and media coverage, but makes up only a small proportion of equally weighted promises. However, as discussed above, tracking individual pledges’ fulfillment is a better measure of promissory representation than just looking at the government’s focus on policy areas because voters care about which promises are fulfilled within an issue area. Voters believe that “Leave the EU” was a much more central promise than “Withdraw from the treaty regulating fishing in European waters” even though both are within the Europe issue area.
Correlation Matrix (12 Issue Areas) of Conjoint-Weighted Promises, Equally Weighted Promises, BESIP MII, and Media Coverage.
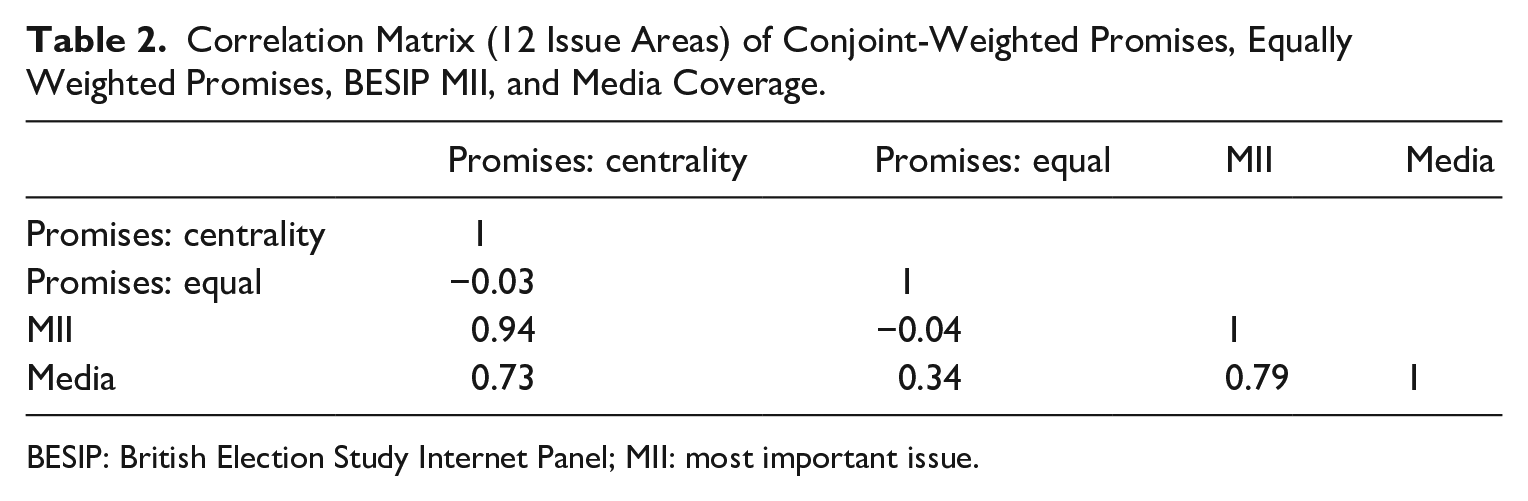
BESIP: British Election Study Internet Panel; MII: most important issue.
To illustrate the difference centrality weighting makes to our conclusions about pledge fulfillment, we tracked the promises that the Conservative government fulfilled by the end of its 2017–2019 term. We find the equally weighted pledge fulfillment of the government was 69%, a rate comparable to other pledge fulfillment studies which suggests that the May/Johnson government followed through on most of their 2017 agenda. However, when we weight the promise fulfillment according to the conjoint experiment, we find only 48% of promises were fulfilled. The reduction of pledge fulfillment by 21 percentage points is 132% of the size of the standard deviation of pledge fulfillment rate across elections in the CPPG data (for promises to change the status quo). In other words, the effect of weighting exceeds most substantive differences in pledge fulfillment rates.
Figure 5 separates completion by whether a promise was to change (216 promises) or maintain the status quo (39 promises). For promises to change the status quo, we see a substantial difference when we use pledge-centrality weights. Figure 5 shows that the Conservatives fulfilled 40% of their promises to change the status quo when we use these weights, compared with 64% when weighting all promises equally. 20 Our results show a >99.9% probability that pledge-centrality weighting lowers the proportion of change promises completed.
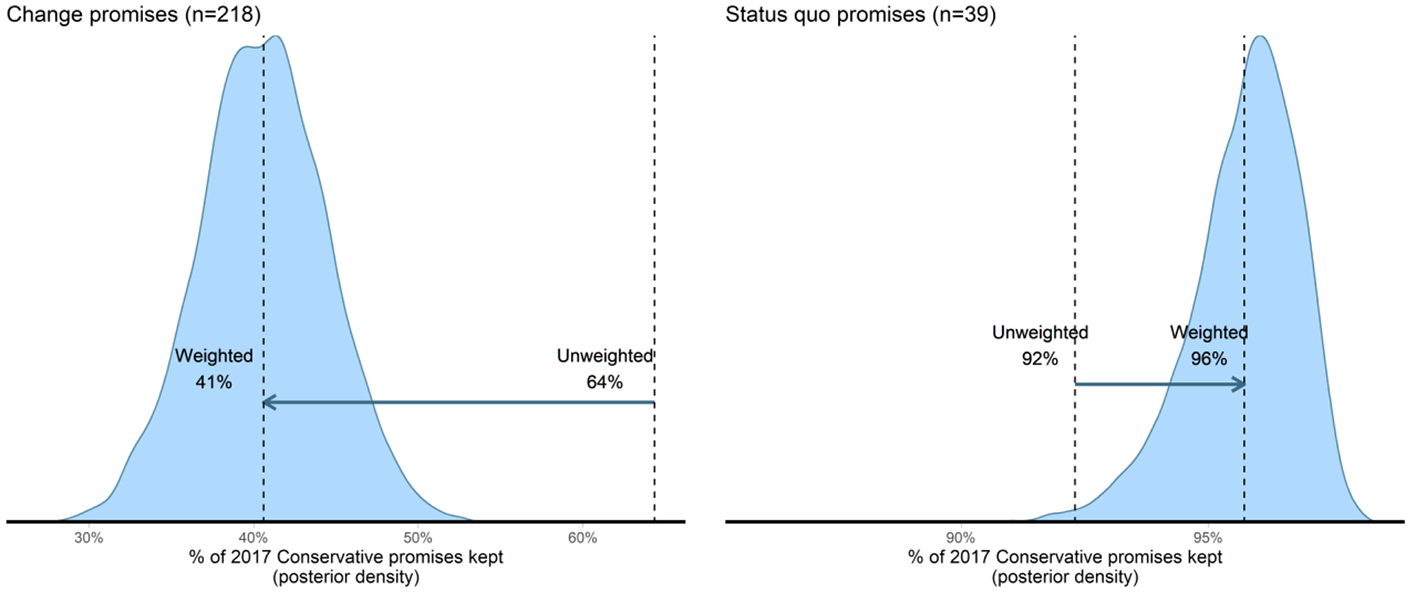
Posterior Distributions of Conservative Promises Fulfilled (%) Using Equal Weights and Weights Derived RE/FMM Models of the Conjoint Experiment. Arrows Indicate How Our Assessment of Fulfillment Moves from Equal Weighting to the Median of the Posterior Distribution of Weighted Completion.
The picture is reversed for promises to maintain the status quo. The pledge-centrality weights suggest the Conservatives fulfilled 96% of their promises to maintain the status quo, whereas this figure was only 92% when weighting promises equally. 21 This is because the Conservatives broke obscure status quo promises such as their promise to “Continue the Red Tape challenge.” 22 After accounting for pledge centrality, the relevance of these broken promises diminishes. 23
Our results show that weighting promises according to their centrality estimated through a conjoint experiment changes our assessment of how well the Conservatives fulfilled their agenda. Most of this difference comes from Brexit-related promises which were considered central to the Conservative agenda but were unfulfilled by the time of the 2019 election.
The effect of promise weighting is not restricted only to European issues. When we exclude European issues (Online Appendix I), promise weighting still greatly affects our estimates of which issues were perceived as central to the Conservative agenda and how much of their agenda they completed.
How Would the Conservative Government Have Performed If They Had Served a Full Term?
The pledge fulfillment figures for the Conservative government fall substantially after weighting is applied. However, it is worth considering that the government only served half of its 5-year term. Might their poor performance be driven by the short governing period?
We cannot know for sure, but strong circumstantial evidence suggests not. Promises can fail to be fulfilled either because a government lacks the ability to fulfill them or because it lacks the motivation to do so. The highest-weighted broken promises were related to Brexit. The government was clearly motivated to leave the EU. However, the evidence is very strong that it did not have the ability to do so, as the government called an early election in 2019 because they no longer believed Parliament would pass a Brexit deal (Prosser, 2020). For the other major broken promises (unrelated to Brexit), there is evidence that Boris Johnson’s (July 2019 onwards) government no longer desired to complete these promises. For these other major promises, the Johnson government actively moved away from completion and all of these promises were dropped from the 2019 Conservative manifesto, including reducing net migration below 100,000, balancing the budget, cutting the deficit, and lifting the ban on new grammar schools. The 2019 manifesto even committed the government to reversing a “fully fulfilled” promise (although it was not implemented): reducing corporation tax to 17%. This fits with previous research that the probability of pledge fulfillment drops in the second half of a government’s term in office (Duval and Pétry, 2019).
All indications suggest the Conservative government was unable to complete its Brexit promises and unwilling to complete the remaining unfulfilled major promises from the 2017 manifesto.
Conclusion
Our results show that the centrality of different election pledges is a problem that cannot be ignored when assessing promissory representation. If equally weighting promises captured the centrality of difference issue areas, the case of Brexit should be an easy test to pass. However, the equally weighted set of promises suggests the Conservative offer at the 2017 election focused on health, education, and miscellaneous administrative changes. Once we account for pledge centrality in the 2017 Conservative manifesto, the Conservatives’ platform was seen as strongly about Brexit.
Accounting for pledge centrality when assessing the 2017 Conservative party’s manifesto reduces our assessment of its promise completion by 21 percentage points. This difference is equivalent to 1.3 standard deviations of the typical variation in promise-completion rates across countries (Thomson et al., 2017) and is larger than the gap Thomson et al. (2017) find between pledge fulfillment by senior coalition partners and single parties governing with a majority: an important institutional predictor of pledge fulfillment. We corroborate our UK results by reexamining the few existing pledge fulfillment studies which distinguish major and minor promises, finding that major-promise completion explains very little variance in overall completion (r2 = 0.07) and that the average absolute gap between major-promise completion and overall promise completion is 28 percentage points.
The size of the difference that pledge centrality makes means future research should urgently check whether existing findings are robust when promissory representation is appropriately measured. The results from existing work, such as the predictors of pledge fulfillment (Costello and Thomson, 2008; Thomson et al., 2017), or even the high level of government promise keeping, could change when we measure promissory representation in a way that reflects the centrality of different promises to a party’s agenda. The gap between single party government and coalition government might, for instance, be underestimated if parties in coalitions focus on completing small unobjectionable pledges, while shelving iconic—but contested—pledges. Ongoing work by groups such as CPPG would be well-complemented by surveys of which pledges are central to the party’s agenda. Extending this approach beyond the UK is important to understanding what political and institutional arrangements lead to higher levels of promissory representation.
Pledge centrality may also be useful as a predictor in pledge fulfillment studies. Future work should consider adding it as another predictor in standard models of pledge fulfillment (e.g. Thomson et al., 2017), as well as in models of citizens’ perceptions of pledge fulfillment (e.g. Brandenburg et al., 2019) where citizens may more accurately assess the completion of central promises.
To this end, we would also add that—although we believe our approach to this problem is justified—there are other potential ways of answering the same question. Rather than adopt a conjoint approach, for example, we might instead ask respondents to consider pairwise comparisons of pledges. This approach is more straightforward to analyze, but comes at the cost of a higher burden in terms of survey time and/or the number of respondents, compared to our conjoint approach. Importantly, our approach is adaptable to circumstances with different constraints of survey time and respondents. A similar number of comparisons could be made with fewer (more) respondents and more (fewer) ratings per respondent. 24
Crucially, our results about pledge centrality are intuitive (Brexit and immigration promises are central) and they closely correlate with public opinion and media coverage at the issue level. This suggests expert and public perceptions of pledge centrality might be similar. If this is the case, then expert judgment would be a possible alternative approach for pledge-centrality weighting. Similarly, the centrality of issue areas in our survey experiment is strongly correlated with other measures of issue salience such as MII survey responses and media coverage. These sorts of data might act as sources for pledge-centrality weighting, especially for historical cases, where our approach would be infeasible. Further research will be necessary to determine the validity of these alternatives.
Can our results resolve the discrepancy between academic and public perceptions of pledge fulfillment (Naurin, 2011)? In the case of the 2017 Conservative agenda, our weighting approach moves our assessment closer to the public view that parties are bad at fulfilling their promises. However, it would be premature to suggest this pattern will hold in every case (and Naurin provides several alternate explanations for the discrepancy). The opposite result is also possible if a party breaks its minor promises, but delivers on large eye-catching proposals. Other factors (e.g. media coverage) may also play a role in public perceptions of pledge fulfillment (Müller, 2020). In order to know whether there are systematic differences between central and peripheral pledge fulfillment rates, this approach will need to be replicated in many more contexts. Indeed, if the Conservative party had fulfilled its Brexit and immigration pledges but achieved nothing else in government, our approach would see them as substantially exceeding the equivalent equally weighted completion rate. If May had passed her Brexit bill through parliament, the government’s completion rate would have increased by 23 percentage points. The standard approach of measuring pledge fulfillment is simply unable to capture these differences.
Supplemental Material
sj-docx-1-psx-10.1177_00323217211027419 – Supplemental material for Which Promises Actually Matter? Election Pledge Centrality and Promissory Representation
Supplemental material, sj-docx-1-psx-10.1177_00323217211027419 for Which Promises Actually Matter? Election Pledge Centrality and Promissory Representation by Jonathan Mellon, Christopher Prosser, Jordan Urban and Adam Feldman in Political Studies
Footnotes
Acknowledgements
We would like to thank Mevan Babakar and Will Moy for their encouragement and input at a very earliest stage of this project. We also wish to thank attendees at the 2018 EPOP conference for their detailed feedback on earlier drafts.
Declaration of Conflicting Interests
The author(s) declared no potential conflicts of interest with respect to the research, authorship, and/or publication of this article.
Funding
The author(s) disclosed receipt of the following financial support for the research, authorship, and/or publication of this article: Thank you to Full Fact and the HABS Company for help in funding this project and for the British Election Study data funded through Economic and Social Research Council Grants: ES/P001734/1 and ES/K005294/1.
Supplemental material
Additional Supplementary Information may be found with the online version of this article. Appendix A: Replication using CPPG promise definitions. Appendix B: Modelling approach. Finite Mixture Model Priors Alternative approach Appendix C: Simulations of Mixture distributions and random effects models. RMSE Figure 1. RMSE of effects and weights for FE, RE, and RE/FMM models with different sizes of gaps between the groups. Distribution of coefficients and weights Figure 2. Bias and efficiency in estimation of the Gini coefficient of promise weights for FE, RE, and RE/FMM models with different sizes of gaps between the groups. Figure 3. Bias and efficiency in estimation of the weights of the most important five promises for FE, RE, and RE/FMM models with different sizes of gaps between the groups. Appendix D: Model diagnostics. Figure 4. Diagnostics for the first-stage model (all respondents) Figure 5. Diagnostics for the first-stage model (2017 Conservative slopes) Figure 6. Diagnostics for the second-stage model (all respondents) Figure 7. Diagnostics for the second-stage model (Conservative slopes) Appendix E: Coefficients, rank, and weights from conjoint analysis for all 257 promises. Figure 8. Histograms of the random intercepts (left panel) and weights (right panel) of the 257 promises after using our modeling approach. Table 1. Centrality and approval coefficients, rank, and weight for all respondents and 2017 Conservative voters. Appendix F: Conservative voters only. Modeling approach Conservative only results Correlation coefficients between random intercepts of approval and centrality for full sample/2017 Conservative sample (n = 257). Correlations within a model are median correlation across MCMC iterations. Figure 9. Posterior distributions of the percentage of Conservative manifesto in issue areas for all respondents and Conservatives voters only. Arrows indicate the difference between unweighted proportion of promises and the median weight falling into that category. Promise categories separately ordered by median value. Other category includes combined weight of all promises not included in seven main categories listed. Figure 10. Posterior distributions of percentage of Conservative party promises fulfilled using equal weights and weights derived RE/FMM models of the conjoint experiment for all respondents and Conservatives voters only. Arrows indicate the movement of our assessment of fulfillment from equal weighting to the median of the posterior distribution of weighted completion. Appendix G: Sensitivity of method to choice of exponent base. Figure 11. Correlations between promises and Media/BES MII measure of issue importance with promise weights calculated using different bases for exponentiation. Appendix H: Quasi-sentence coding of 2017 Conservative Manifesto. Table 3. Correlation matrix between the eight issue areas tracked by the Loughborough media tracking project across the conjoint weighted Conservative manifesto, the unweighted Conservative manifesto, most important issue (MII) responses of BESIP respondents in post-election wave, Media coverage and CMP issue coding. Appendix I: Excluding Europe. Figure 12. Posterior distributions of the percentage of Conservative manifesto in issue areas according to all respondents and 2017 Conservative voters excluding Europe promises. Arrows indicate the difference between unweighted proportion of promises and the median weight falling into that category. Promise categories separately ordered by median value for all respondents and 2017 Conservatives. Other category includes combined weight of all promises not included in seven main categories listed. Figure 13. Posterior distributions of percentage of Conservative party promises fulfilled using equal weights and weights derived RE/FMM models of the conjoint experiment excluding Europe promises. Arrows indicate the movement of our assessment of fulfillment from equal weighting to the median of the posterior distribution of weighted completion.
Notes
Author Biographies
References
Supplementary Material
Please find the following supplemental material available below.
For Open Access articles published under a Creative Commons License, all supplemental material carries the same license as the article it is associated with.
For non-Open Access articles published, all supplemental material carries a non-exclusive license, and permission requests for re-use of supplemental material or any part of supplemental material shall be sent directly to the copyright owner as specified in the copyright notice associated with the article.