
Abstract
A criticism of consociational power sharing as an institutional response to violent conflict is that it buttresses rather than ameliorates the underlying (linguistic, religious or ethno-national) divide, hence prohibiting the emergence of new dimensions of political competition (such as economic left-right or moral liberal-conservative dimensions) that are characteristic of ‘normal’ societies. We test this argument in the context of the illustrative Northern Ireland case, using data from expert coding of party policy documents and opinion data derived from two Voter Advice Applications (VAAs). We find evidence for a moral liberal-conservative dimension of politics in addition to the ethno-national dimension. Hence, we caution against assuming that consociational polities are unidimensional.
Keywords
One response to violent conflict in deeply divided places is to implement consociational power-sharing arrangements. Political parties from the opposing groups in society enter an inclusive coalition government, and each group is given a right of veto over important legislation that may adversely affect their particular community. There is quite a heated normative debate over the merits and demerits of the power-sharing approach to conflict resolution. 1 Proponents argue that it is a system that is most likely to generate a secure and peaceful polity in which all groups are included in decision-making. Critics argue that because power sharing is based on recognising and giving veto rights to distinct rival social groups, the institutional arrangements simply cement and prolong the underlying division in society. Accordingly, other possible political debates that are associated with ‘normal’ societies are prohibited from developing, leaving post-conflict societies forever languishing in divide-based politics.
However, there are counter-arguments, suggesting that implementing consociational government may enable other dimensions to emerge. First, power-sharing arrangements may incentivise movement by formerly violent parties in a moderate direction in order to gain votes and executive power in proportion to those votes. This may lead to within-bloc party similarity and a perceived need by parties to differentiate themselves on other policy dimensions. 2 Second, arriving at a negotiated consociational settlement may signify acceptance of the legitimacy of the state by all major relevant actors and acceptance of the legitimacy of the resulting power-sharing government. This resulting government must make decisions on a range of policy themes, hence raising the salience of those non-divide issue dimensions. 3
Here, we focus on the illustrative case of post-2007 Northern Ireland as a fully functioning consociational power-sharing polity and examine the dimensionality of policy space. 4 Are the critics of consociation right in arguing that there is likely to be only one dimension of competition? Specifically, is the underlying ethno-national divide (between Protestant unionists who favour Northern Ireland remaining part of the United Kingdom and Catholic nationalists who favour a united Ireland) the only strong attitudinal dimension in citizens’ minds and the only dimension driving party competition and vote choice? Or, do Northern Ireland citizens and parties adopt distinct positions on other dimensions of competition and is vote behaviour driven by these issue areas? Despite often being characterised politically as a land of ‘green’ versus ‘orange’ issues, a cursory following of post-2007 Northern Ireland current affairs suggests that economics and morality are core aspects of political debate. Welfare reform has divided the parties and has brought the political institutions to the brink of collapse. The issue of same-sex marriage has led to the resignation of a minister and much inter-party disagreement on an associated ‘conscience clause’ bill. Are these issues indicative of important underlying dimensions of competition on economic (left-right) and moral (liberal-conservative) matters?
We begin by elaborating our general expectations regarding policy dimensionality under Northern Ireland’s consociational conditions and specifying our research questions. We then describe our sources of data (expert coding that we conducted of party policy documents and opinion data from two Voter Advice Applications (VAAs) that we produced). We then report the extent to which non-ethno-national attitudinal dimensions structure citizens’ attitudes and the extent to which the political parties offer distinct positions on these dimensions. Furthermore, we examine whether citizens choose parties on the basis of non-ethno-national dimensions. In theory, if the economic or moral dimensions were very politically salient for citizens and parties were different from each other on these dimensions, citizens might vote ‘across the divide’, with Catholics voting for one of the unionist parties (or Protestants voting for one of the nationalist parties). However, given the rarity of cross ethnic voting, we examine the possible electoral importance of a non-ethno-national dimension in two ways: Does it predict within-bloc voting (i.e. which particular nationalist party a Catholic votes for, or which particular unionist party a Protestant votes for) and does it predict outside-bloc voting (do Catholics and Protestants who vote for the bi-communal Alliance party do so on the basis of ideological dimensions such as economics and morality)?
In short, we find that – in addition to the underlying ethno-national dimension – a moral liberal-conservative dimension is a strongly structured attitudinal dimension. Also, parties offer choice on this dimension and voters vote on the basis of it (in terms of within-bloc and outside-bloc voting). 5 These findings caution against the assumption that consociational power sharing necessarily leads to a unidimensional polity and lends credence to the idea that other policy dimensions may also play a role. We elaborate the implications of our findings both for our understanding of how consociation influences policy space and for normative debates on the desirability or otherwise of power sharing as an institutional response to violent conflict.
Non-Ethno-National Dimensions
We investigate the extent to which dimensions of competition, such as economic left-right, liberal-conservative and pro- versus anti-EU, which are salient in ‘mainland Britain’ (Evans et al., 1996; Heath et al., 1994), operate in Northern Ireland. 6
Economic Left-Right
Lipset and Rokkan (1967) are the departure point for many scholars of political cleavages and policy dimensions. They identify a range of fundamental cleavages in European industrialised societies, arguably the most influential of which is the economic ideological divide between Left and Right. This derived from the owner versus worker (or social class) cleavage, as more economically marginalised sectors of society attempted to secure a redistribution of wealth and influence from the privileged classes and saw the state as the instrument to accomplish this redistribution. This left-right divide is ubiquitous in the international study of policy dimensions and has long been seen as the core divide in British politics. In the Northern Ireland context, some previous research has examined the economic left-right basis of citizens’ attitudes, party positions and vote choice. For example, the Gilland-Lutz and Farrington (2006) study based on a 2003 survey of candidates and the Benoit and Laver (2006) study based on a 2003 expert survey paint a fairly similar picture of Northern Ireland party positions. On the economy, Sinn Féin (SF) is the most ‘left-wing’ and the Ulster Unionist Party (UUP) the most ‘right-wing’, with the remaining three parties – the Democratic Unionist Party (DUP), the (nationalist) Social Democratic and Labour Party (SDLP) and (the cross-community) Alliance (All) – clustered around the centre ground.
In terms of citizens’ economic left-right attitudes and the relationship between these attitudes and vote choice, Evans and Duffy (1997) examined pooled 1989–1991 data from the Northern Ireland Social Attitudes survey (NISAS). A left-right ideology measure was generated from five items which displayed a good level of internal consistency and was, among Protestants, a strong predictor of party preference (with the DUP associated with more left-wing voters). A study by Tilley et al. (2008) used pooled 1989–2004 data from NISAS and the Northern Ireland Life and Times survey (NILTS) and found that economic left-right attitudes (using three items which form ‘a fairly internally coherent scale’) did not predict vote choice for either Protestants or Catholics. Similar findings were arrived at by John Garry (2009). A further study by Tilley and Evans (2011), however, did find that economic left-right (using a two-item scale for 1989–2006 NISAS/NILTS data) predicted Protestant vote choice (again with the DUP linked with more left-wing voters). In short, the findings suggest a reasonably strong structure to citizens’ left-right attitudes but inconsistency regarding the relationship between this dimension and party preference.
However, it may be that, post-2007, economic attitudes more sharply delineate party positions and more strongly structure citizens’ attitudes and determine vote choice, given the degree of prominence afforded economic issues. Most notably, since 2012 the Northern Ireland Executive and Assembly have been clearly divided over the implementation of welfare reform measures introduced by the Westminster government. SF has adopted a staunchly left-wing stance, refusing to implement cuts to social welfare allowances and vetoing the budget. The Executive parties, along with the British and Irish governments, have participated in several high-profile initiatives aimed at reaching agreement on the issue, the most substantial of which resulted in the 2014 Stormont House Agreement. Failure to reach a compromise – primarily between the two largest parties, the DUP and SF – brought the power-sharing institutions at Stormont to the brink of collapse on numerous occasions. As a result, the issue of welfare reform and the parties’ differing stances on how best to proceed has been a consistent and dominant feature of political news coverage since 2012.
Liberal-Conservative
In contrast to Lipset and Rokkan’s materialist owners versus workers cleavage, Ronald Inglehart (1977, 1990) has highlighted the emergence of what he terms post-materialist values among the younger generation, leading to the growth of left-libertarian lifestyle movements that champion issues such as the environment, women’s rights, gay rights and anti-racism. Similarly, authors such as Scott Flanagan (1987) contrast a ‘new politics’, which is defined by a divide between libertarian (‘new Left’) and authoritarian (‘new Right’) values, 7 from the ‘old politics’, the focal point of which is the role of the state in the economy and which separates the (economic) Left from the (economic) Right. Marks et al. (2006) propose that the European political space is defined by two dimensions: one (economic) Left-Right dimension and one ‘Tan/Gal’ dimension. Here, Tan refers to ‘traditionalism/authority/nationalism’, while Gal refers to ‘green/alternative/libertarian’ (Marks et al., 2006).
On this non-economic dimension in Northern Ireland, studies by Gilland-Lutz and Farrington (2006) and Benoit and Laver (2006) showed that in terms of socio-moral issues, SF and Alliance are the two most liberal parties, the UUP and SDLP occupy the middle ground, while the DUP is the most conservative. Regarding the measurement of citizens’ attitudes on this dimension, and its relationship with party preference, Mitchell and Tilley (2004) used a four-item scale to measure moral issues (on sexuality and abortion) and found reasonable internal consistency, suggesting a fairly well-structured attitudinal dimension. Focusing on the 1991–1998 period, the authors found that moral conservativism increasingly predicted Protestant support for the DUP rather than UUP. Garry (2009), using a single-item measure relating to attitudes to homosexuality, did not find evidence of the liberal-conservative distinction explaining within-bloc voting. Again, the findings are inconsistent.
In addition to economic left-right, a liberal-conservative dimension may also be operating in post-2007 Northern Ireland politics. A cluster of moral issues have dominated contemporary political headlines in Northern Ireland (for discussion, see Tonge and Evans, 2015: 128–131). The region’s exceptional legislative stance on abortion, compared to other constituent parts of the United Kingdom, has been a source of sustained public and political debate. The opening of an abortion advice clinic in Belfast in 2012 proved especially controversial, dominating the news agenda for several months and prompting a series of high-profile court cases. In March 2013, the Assembly narrowly rejected a DUP and SDLP proposal to outlaw private abortion clinics. A further attempt by the DUP to tighten abortion law in Northern Ireland was defeated in June 2015. On this occasion, the margin of defeat was just two votes, while later that same month an unsuccessful bid to challenge Northern Ireland’s exemption from the 1967 Abortion Act was launched at Belfast’s High Court.
Recent years have also witnessed a notable degree of attention centred on the issue of equality for the lesbian, gay, bisexual and transgender (LGBT) community in Northern Ireland and, on a related note, the protection of religious rights. A decision by a DUP Health Minister in 2011 to maintain a ban on gay men donating blood – irrespective of its lifting in the rest of the United Kingdom – provoked much public debate and political rancour. An even bigger furore, however, has surrounded the issue of same-sex marriage in Northern Ireland. The refusal of a baking company in 2014 to provide a customer with a product bearing a message supporting same-sex marriage, on account of the owner’s religious faith, has captured both public and political attention to a considerable degree. In response to the bakery owners being taken to court on grounds of discrimination, the DUP has sought to introduce a ‘conscience clause’ protecting business owners – a move which has been met with overwhelming opposition from other parties and the Equality Commission for Northern Ireland. In a political environment dominated by this colloquially dubbed ‘gay cake’ row, the DUP’s Jim Wells was forced to resign as Health Minister following controversial remarks about the suitability of homosexuals to foster children. Again, this episode, which occurred on the Westminster campaign trail, generated extensive media and political scrutiny.
European Union
In addition to the economic left-right and the liberal-conservative divides, we also focus on the pro- versus anti-EU issue dimension which is of considerable salience across Europe and particularly in the United Kingdom in the context of the referendum on UK membership of the EU. The EU debate may be linked to a more profound divide within society. For example, Kriesi et al. (2006) identify a recent societal cleavage between ‘winners’ and ‘losers’ of globalisation, arguing that ‘losers’ tend to take a position of cultural demarcation by rejecting immigration and European integration. In a similar vein, Ford and Goodwin (2014) claim that the United Kingdom Independence Party (UKIP), which garnered 12.6% in the 2015 UK general election, draws its support primarily from what they describe as ‘left behind’ sectors of society, typically older, male blue-collar workers who have become victims of economic globalisation. Referring also to the recent growth of UKIP, some UK commentators have proposed a corresponding divide between ‘communitarians’ and ‘cosmopolitans’. The former (the group to which most UKIP supporters belong) are wary of change, prefer continuity and stability and feel that ‘those close to us matter more than people who are far away’ (Goodhart, 2014), while the latter are mainly metropolitan liberals who embrace change, cultural diversity and geographical mobility.
The issue of the EU has long been a core element of intra- and inter-party debate in Britain, and has also been studied in the specific Northern Ireland context. Gilland-Lutz and Farrington (2006) and Benoit and Laver (2006) studies found that the DUP is the most stridently Eurosceptic of the parties, followed by the UUP and SF. The SDLP and Alliance are both pro-EU, with the former party the most extreme in their position. As far as citizens’ attitudes and vote choice are concerned, Garry (2012) found at the 2009 European Parliament election that in the nationalist bloc SF voters were more sceptical than SDLP voters (although there were no such distinctions between the DUP and UUP support bases).
Specific Research Questions
Our specific research questions that we now address are as follows:
In addition to the ethno-national dimension, is there any other strong attitudinal dimension – such as economic left-right, liberal-conservative or pro- versus anti-EU – that structures citizens’ political attitudes?
If there is, do the parties offer a distinct choice on this additional dimension?
If there is and parties do offer a distinct choice on this additional attitudinal dimension, does this attitudinal dimension determine vote choice?
The parties we consider are those that are significant insofar as they garnered at least 5% of the vote in both the 2011 elections to the Northern Ireland Assembly and in the 2015 UK general election. This leaves us with five parties: the DUP, SF, the SDLP, the UUP and the Alliance.
Data
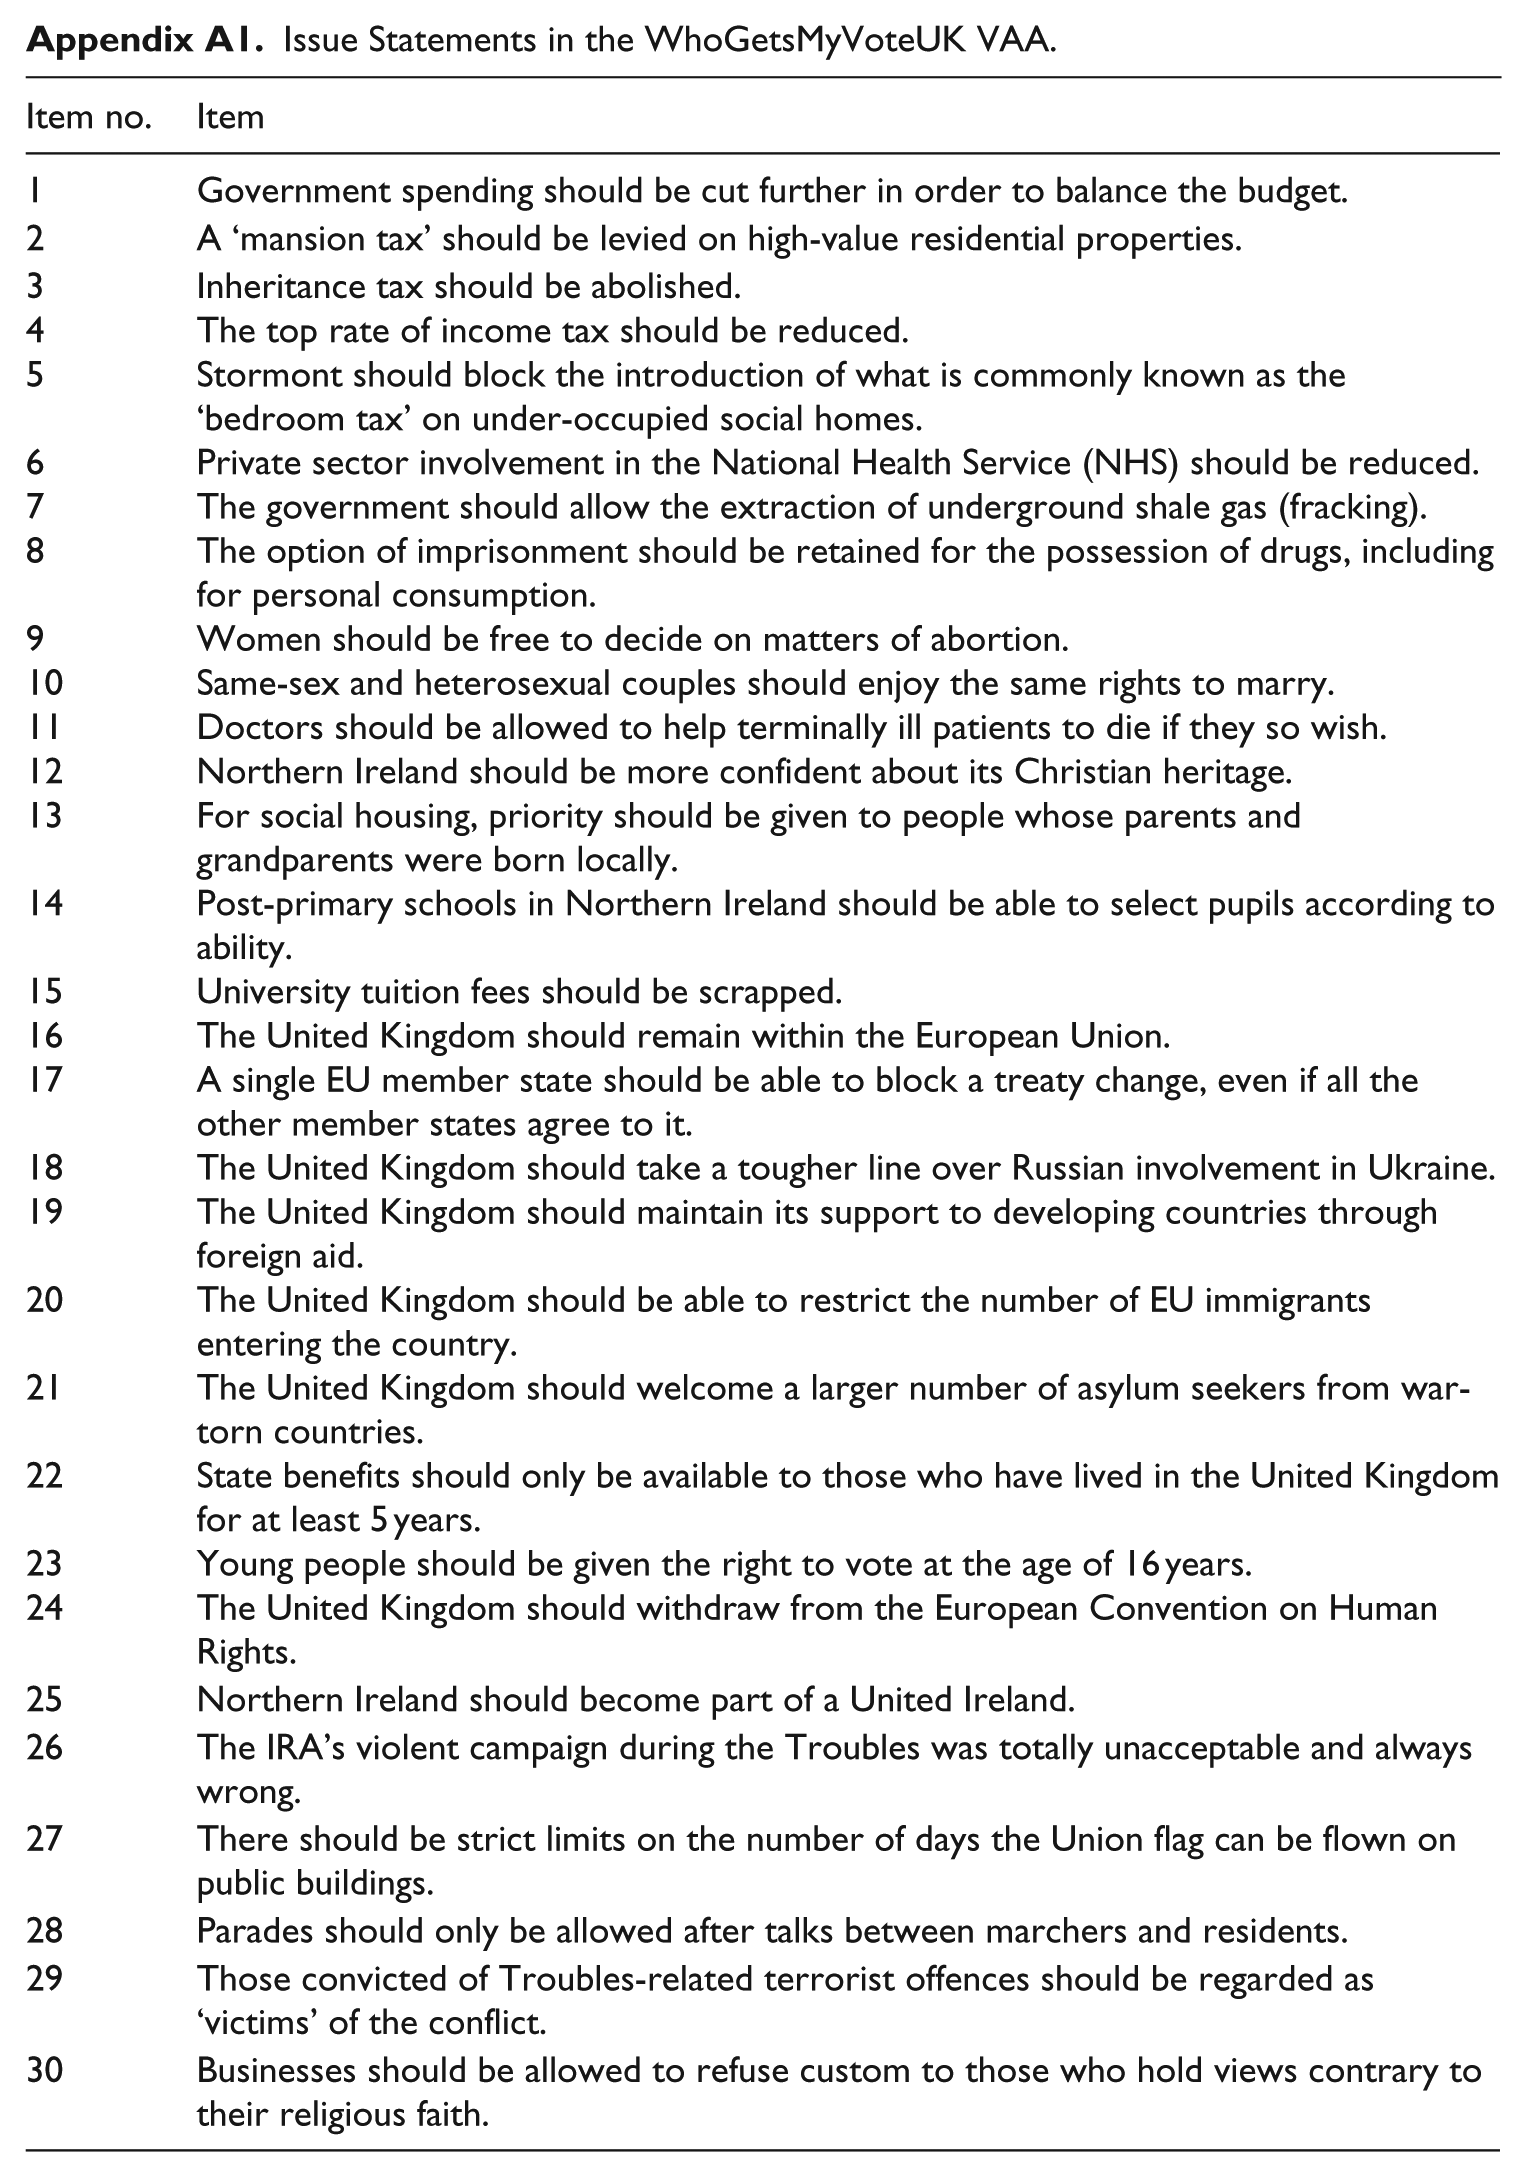
We generate data on citizens’ attitudes from a VAA (WhoGetsMyVoteUK) that we developed and applied in Northern Ireland in the run up to the 2015 Westminster election. 8 VAAs are online applications that enable their users to compare their policy preferences with those of political parties or election candidates in order to help them decide how to vote (for an overview of VAAs, see Garzia and Marschall (2012)). Users are presented with a number of issue statements to which they can express varying degrees of agreement or disagreement. Parties and candidates are also assigned positions with respect to each issue statement and the VAA matches users with the parties/candidates, generating a visual display (typically a map or bar chart) for users to visualise their proximity with each party or candidate. WhoGetsMyVoteUK included 30 issue statements (provided in Appendix A1), which were selected according to the following criteria: (1) statements reflected contentious issues in Northern Ireland that had recently (in the previous 2 years or so) received attention in the media, (2) parties took clear positions with regard to each issue with some parties adopting a favourable position and others a contrary position, (3) evidence suggested that voters were similarly split on each issue and (4) issues were chosen to be as varied as possible and to cover most if not all relevant political debates at both national and regional (Northern Ireland) level. In WhoGetsMyVoteUK, there were five items relating to taxation and spending, two on education, one on healthcare, one on criminal justice, one on housing, one on the environment, five on foreign policy/EU affairs, three on immigration, five on inter-communal relations and six on miscellaneous social issues. For more on statement selection and formulation, see the Supplementary Information in the online Appendix. For each item, VAA users were presented with six possible answer categories: ‘completely agree’, ‘agree’, ‘neither agree nor disagree’, ‘disagree’, ‘completely disagree’ and ‘no opinion’. 9 In the subsequent analysis, all responses were given equal weight, the first five categories were considered to represent an ordinal scale, while ‘no opinion’ responses were considered as missing values. Users were also given the option of answering a number of supplementary questions, relating to age, gender, education, party affiliation and vote intention. 10 In total, 85% of users completed all the supplementary questions and, possibly counter-intuitively, many expressed a clear vote intention and party affiliation, suggesting that – rather than using the tool as advice as to how to vote – some users completed the VAA out of interest or to check if the application would confirm their already made decisions. It should be noted that all the data we use here from the VAA were collected prior to the respondent (VAA user) being given any information regarding where parties stand or where the respondent stands on any generated scale. Before analysis, the data were cleaned thoroughly to weed out as many ‘rogue’ entries as possible (for cleaning methodology, see the online Appendix). After extensive cleaning of data, the dataset included 6636 entries (individuals), compared to 9256 entries prior to cleaning, meaning that 28.3% of users were excluded in the cleaning process.
Parties’ official positions on each of the 30 issue statements were determined by the Delphi method (Dalkey and Helmer, 1963; Gemenis, 2015). First, a panel of experts was assigned to independently code all parties on all issue statements. Coders justified each one of their estimates by providing information from statements in policy documents, party manifestos or other relevant sources. Five coders were assigned to code each party. Subsequently, each of the coders’ individual estimates of each party on each item, and each coder’s associated justification of each estimate, were fed back to the panel anonymously for a second round of coding in which panellists updated their initial codes with the help of justifications from their fellow coders. Once the codes converged to a sufficient extent to be deemed consistent (demonstrated by values of Van der Eijk’s (2001) measure of agreement A>0.7), the median response was taken as the final estimate. Only two rounds of coding were needed.
For our analysis, we rely on both user-generated data and expert coding. We first identify latent ideological dimensions from user responses to the 30 issue statements. Following Gerbing and Anderson (1988), we apply exploratory factor analysis (EFA) to the user response data to get a rough idea of what latent dimensions are relevant, then apply confirmatory factor analysis (CFA) to evaluate and, if necessary, refine the factors identified by EFA (for further details, see the online Appendix). In doing so, we adopt a ‘bottom-up’ perspective that assumes that the dimensionality of the political space is fundamentally ‘demand-generated’ or determined by the orientations of voters. We predetermine neither the number of dimensions nor the nature of each dimension. This ‘bottom-up’ approach contrasts with the more common practice of defining ideological dimensions a priori (see, for example, Marks et al., 2006), but we deem it more appropriate given our emphasis on societal cleavages. Having identified latent dimensions, we then plot (1) the position and spread of party supporters (from user-generated data) and (2) the party positions as determined by the expert coders with respect to these dimensions.
Regarding the quality of the data, the following points may be made. In terms of the expert coding to generate party positions, our data are arguably of very high quality. Five coders were used compared to a single coder as is used in the Comparative Manifesto Project (Budge et al., 2001). The interactive, multi-round nature of the Delphi process also compares favourably with the methodology used by Chapel Hill (Bakker et al., 2015), in which a large number of coders code parties, but discrepancies between coders are resolved by simply taking the mean values.
In terms of our data on citizen opinion, which is perhaps more fundamental insofar as it determines the ideological dimensions we work with, we face a number of challenges. First, it could be argued that the items used in the VAA are determined by the questionnaire designers’ preconceptions of what are the fundamental ideological dimensions and that, therefore, the dimensions that are ‘discovered’ merely reflect this latent bias. While we cannot remove bias in the question formulation process entirely, we carry out a robustness test by repeating our analysis on a similar dataset that was generated by another VAA deployed in Northern Ireland just a year earlier. This was the EUvox VAA that was deployed in all 28 EU member states prior to the 2014 elections to the European Parliament. This VAA also included 30 issue statements but most were very different; 21 of them were common to all EU member states and just nine were specific to Northern Ireland (to see the statements, refer to the online Appendix). This contrasts with WhoGetsMyVoteUK in which all statements were designed to reflect UK/Northern Ireland issues. WhoGetsMyVoteUK and EUvox shared just eight common items. If we were able to obtain similar results from these two very different sets of issue statements, it would confirm the robustness of our findings. After cleaning, the dataset generated by EUvox included 2172 entries.
The second challenge is that our sample is not representative. Rather, the respondents are self-selected. This leads to problems in terms of generalising from our sample given that respondents are unlike the population as a whole in many respects. Typically, VAA respondents tend to have above average levels of interest in politics, tend to be younger and tend (somewhat) to be male (Marschall, 2014). Perhaps even more importantly, their distribution in terms of political orientation may not reflect real world results, potentially leading to a skewed sample that cannot reveal the most relevant ideological dimensions that define the universe of voters. However, the effect of these obvious disadvantages can be minimised by applying a number of sampling techniques to the data. In order to correct for possible political bias in our sample, we generate a sample of users that is more or less representative of the voting population in terms of vote intention and repeat our analysis on this new sample. For additional robustness checks to account for bias on the other variables, we divide the overall sample of VAA users into a number of different sub-samples, based on age, education and political interest, and perform the analysis on each sub-group separately.
Results
Attitudinal Dimensions
When EFA is applied to citizens’ responses to the survey items in WhoGetsMyVoteUK, the ‘elbow’ appears to be located on the fifth eigenvalue, suggesting that there are four relevant dimensions in the political space. When we feed the outputs of the EFA into CFA and then eliminate items until the model satisfies our goodness-of-fit criteria, 11 we find that one dimension contains economic issues (tax, spending, state/private sector involvement in public services and the economy, fracking, university tuition fees, size of the public sector, redistribution of wealth and workers’ rights), one cultural-moral issues (drug use, gay marriage, euthanasia, role of Christianity/religion), one sectarian issues (use of flags, parades, legacy of ‘the Troubles’, union with the Republic of Ireland) and one issues on Europe (desirability of membership, EU powers, membership of the European Convention on Human Rights (ECHR)). Table 1 (below) shows the individual items that load onto each dimension, as well as the goodness-of-fit indices. Items are identified by the number assigned to each item in the table in Appendix A1.
Dimensionality of the Policy Space: Items and Goodness-of-Fit Indices.
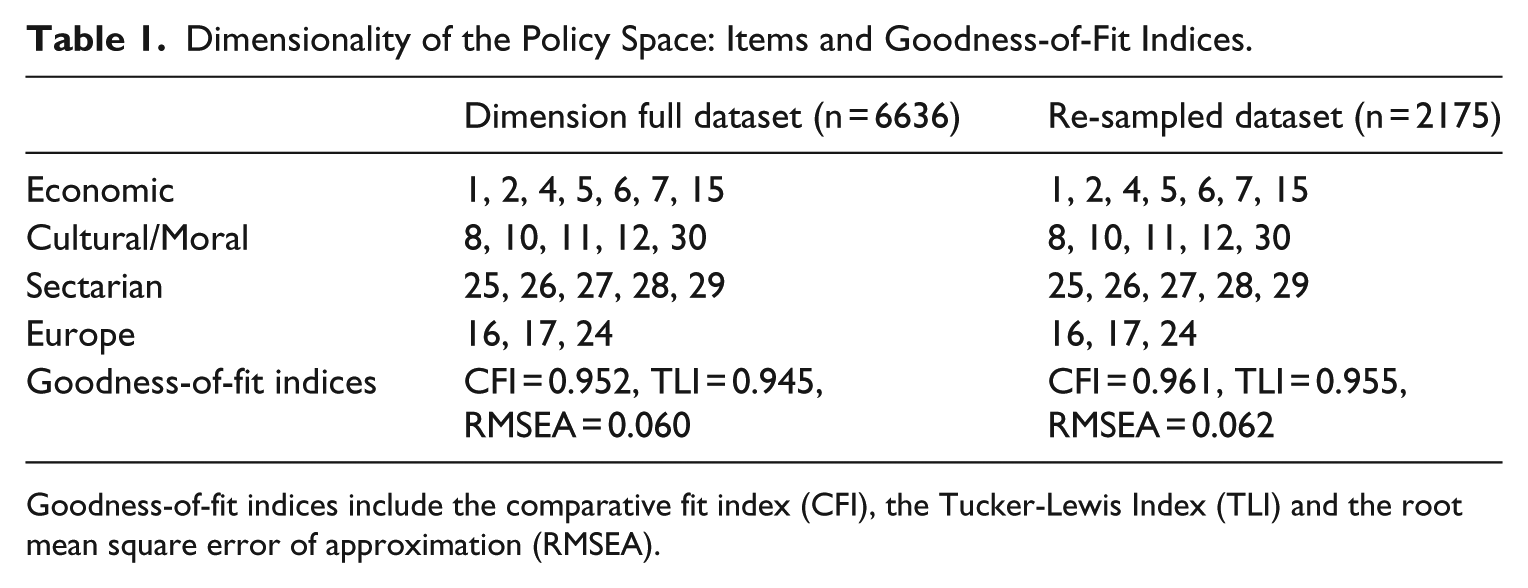
Goodness-of-fit indices include the comparative fit index (CFI), the Tucker-Lewis Index (TLI) and the root mean square error of approximation (RMSEA).
Looking now at the consistency of each of the dimensions identified, if the ethno-national sectarian divide is the dominant dimension in Northern Irish society, we would expect that the items that belong to this dimension form a stronger scale (in terms of internal consistency) than the items that load onto the other dimensions. Performing Mokken Scale Analysis (MSA) on the items that load onto each dimension in each dataset, we see that while the Loevinger H coefficient, which measures the interdependence of items in a given scale, is indeed greater for the sectarian scale, the cultural-moral scale is also quite strong (see Table 2).
Mokken Scale Analysis Applied to the Four Policy Dimensions.
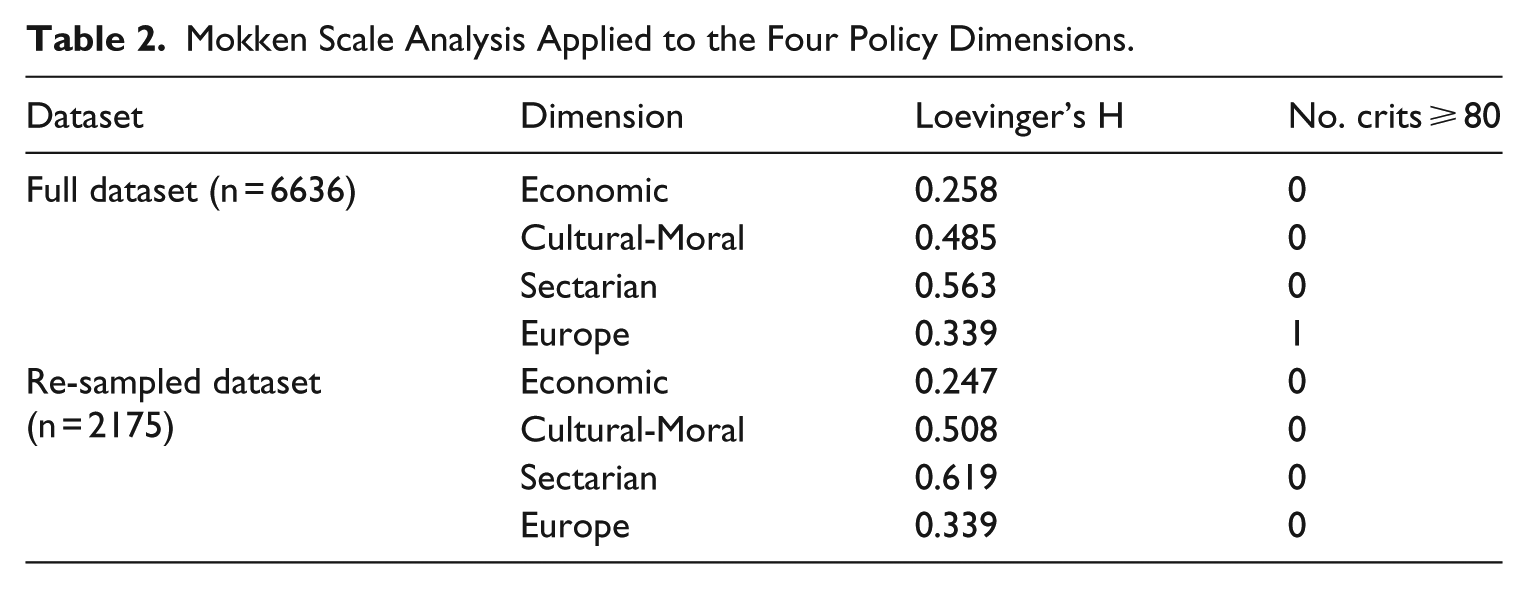
Specifically, the sectarian scale conforms to Mokken’s ‘strong’ category (H>0.5), while the cultural-moral scale is ‘medium’ in strength (H>0.4). The EU dimension is a ‘weak’ scale (H>0.3) that includes just three items, but one of these violates the ‘crit’ threshold for monotone homogeneity. (For more on the criteria used in MSA, see the online Appendix.) The economic dimension is the weakest and does not even reach Mokken’s minimum level of acceptability (H<0.3). Overall, therefore, on the demand side (i.e. from the side of citizens who use the VAA), it would seem that the sectarian dimension is not the only relevant one. In particular, the cultural-moral dimension represents a major divide within Northern Irish society and the economic and Europe dimensions also have some (albeit less) discriminatory power.
Unfortunately, however, our sample is subject to quite a strong political bias. Out of 3059 users who expressed a clear vote intention, 1140 intended to vote for the Alliance Party (fifth-placed in terms of votes in the 2015 elections), while just 324 intended to vote for the first-placed party, the DUP (see Table 3). To control for this, we generate a new sample that includes all 324 DUP voters, 310 SF voters, 180 UUP voters, 176 SDLP voters, 108 Alliance voters, 32 UKIP voters, 29 Traditional Unionist Voice (TUV) voters and 82 voters of other parties or independents. We generate this sample by randomly selecting entries from each group of voters. The new sample reflects the population as a whole in terms of how real votes were cast in 2015 and is augmented by a further 934 VAA users who declared either that they did not intend to vote or were undecided (in order to represent the 43% of voters who did not vote). Applying the above analysis to the new sample, the exact same dimensional structure emerges with precisely the same items loading onto each dimension. The goodness-of-fit indices in Table 1 show that this structure fits even better with the new sample than with the original one, and MSA (Table 2) produces similar or improved values for Loevinger’s H (with the moral-cultural scale becoming ‘strong’). This suggests that the model is really quite robust, and the lack of representativeness of our sample may not pose as much of a problem as we foresaw.
Characteristics of the Sample.
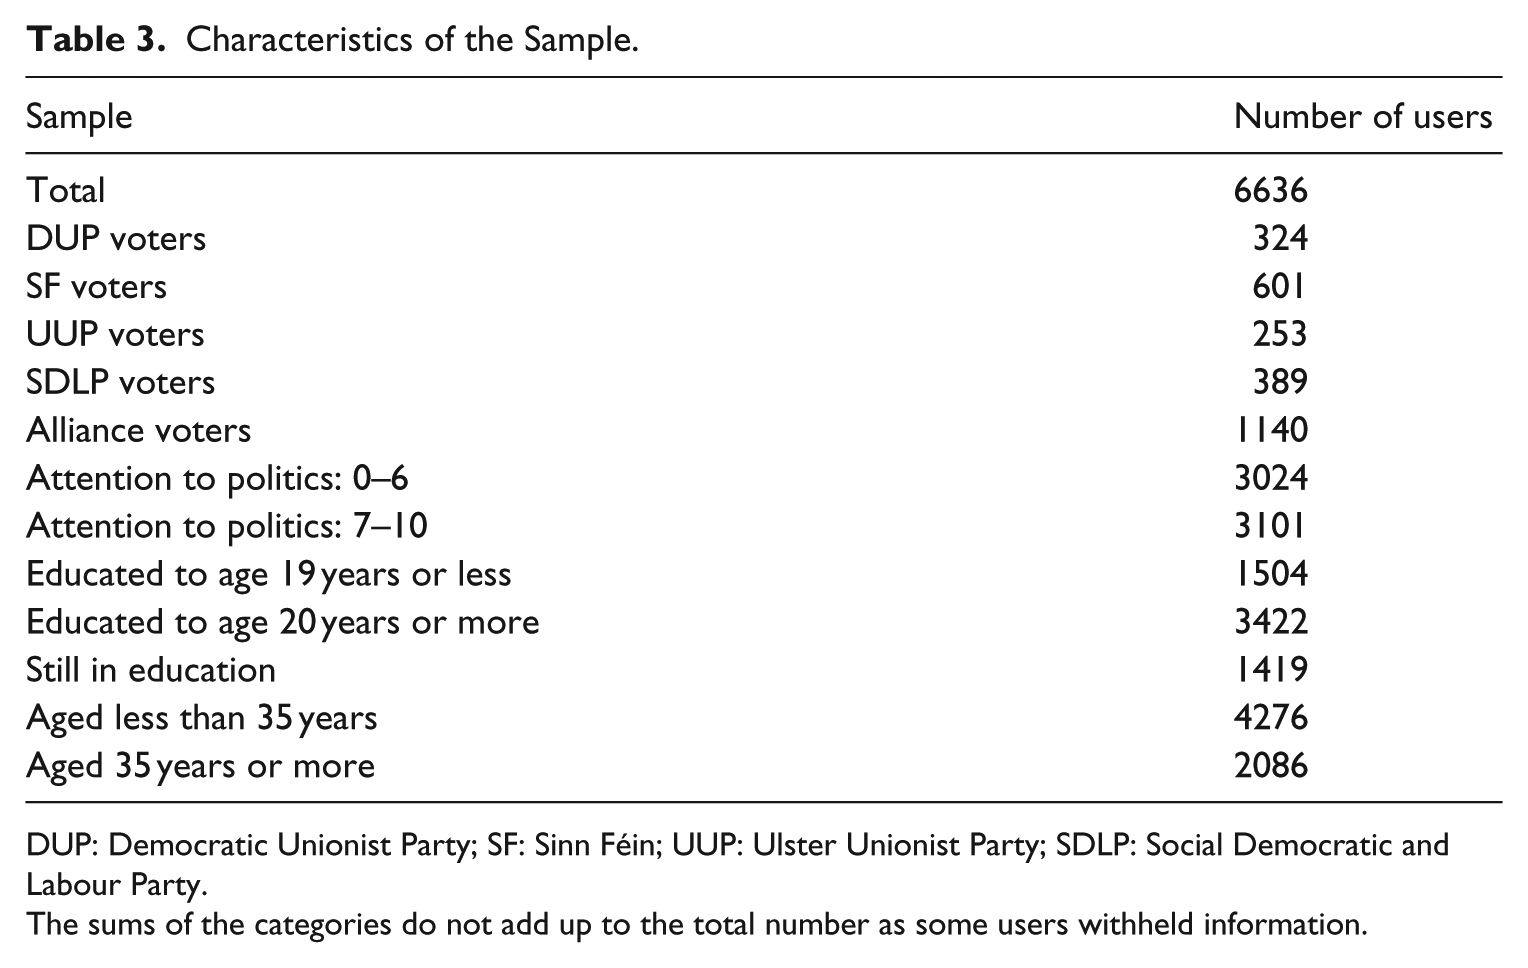
DUP: Democratic Unionist Party; SF: Sinn Féin; UUP: Ulster Unionist Party; SDLP: Social Democratic and Labour Party.
The sums of the categories do not add up to the total number as some users withheld information.
Table 3 suggests that our dataset is also biased in favour of young, well-educated and politically interested voters. For additional robustness checks to estimate the effects of these biases, we re-apply our analysis on the following samples: (1) users who do not pay a high degree of attention to politics, 12 (2) users who did not continue their education beyond the age of 19 years and (3) users of 35 years of age or more. These samples are designed to counteract the prevailing sample bias. For samples (2) and (3), the dimensions extracted are identical to those extracted from the full sample and the goodness-of-fit indices remain acceptable, while for sample (1), we need to remove one item from the economic scale and one item from the sectarian for the model to satisfy our goodness-of-fit criteria. However, the other two scales remain identical and the four-dimensional model remains valid. That the model still applies when our sample is skewed to make it biased in the opposite manner to the overall sample is testimony to its robustness. The outputs of these analyses are available in the online Appendix.
Our final robustness test is designed to control for statement selection bias. Identifying latent dimensions from the (second) dataset derived from the EUvox VAA reveals an almost identical four-dimensional structure with ‘strong’ (H>0.5) sectarian and cultural-moral dimensions, a small (two-item) EU dimension and an economic dimension that is ‘weak’ (H>0.3), but still more coherent than the equivalent dimension derived from the WhoGetsMyVoteUK dataset. Details of the dimensions derived from the EUvox dataset and the items that load onto them, as well as the outputs from EFA, CFA and MSA, are provided in the online Appendix.
Where Do the Parties Stand?
Our next task is to see whether Northern Ireland’s political parties can be distinguished by their positions on issues relating to the four dimensions we have identified. We consider both the positions of the parties as coded by experts and the positions of those users who self-identified as party supporters. We would expect these positions to be broadly similar, but given the fact that official party programmes need to be consistent, while voters (including party supporters) are often idiosyncratic in their views, we would also expect the parties as coded by elites to have clearer (i.e. more polarised) positions than their supporters.
To define the position of a party or user with respect to a given dimension, we use their positions on those items that we identified above as ‘belonging’ to that dimension by virtue of satisfying the goodness-of-fit criteria when CFA is applied and construct a score of between zero and one for each dimension. Details of how this is done is provided in the online Appendix. We drop one item (Item 17) from the Europe dimension as it appears only to load onto this dimension weakly and violates the monotone homogeneity model (see above).
Table 4 shows the positions of each party (as coded by experts) with respect to each dimension. A value close to 1 represents an economic right-wing, cultural conservative, nationalist and pro-EU perspective on the respective dimensions.
Party Positions by Dimension (Expert Coding).
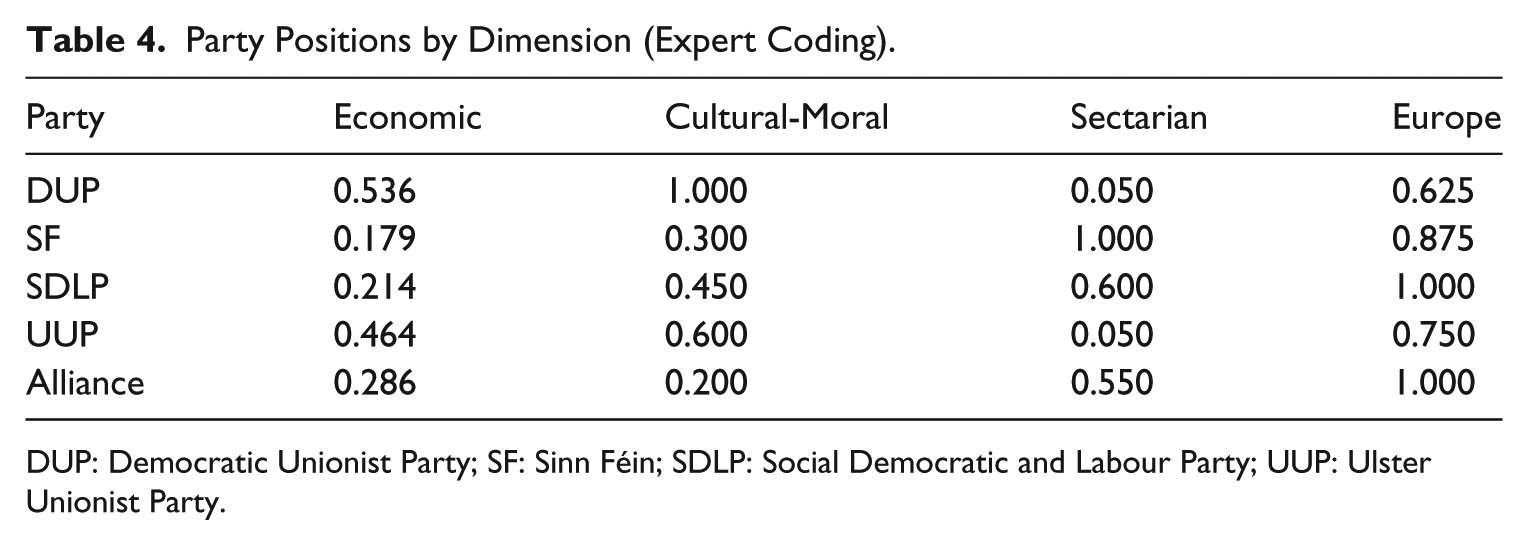
DUP: Democratic Unionist Party; SF: Sinn Féin; SDLP: Social Democratic and Labour Party; UUP: Ulster Unionist Party.
Overall, Table 4 appears to show (1) that the DUP, followed by the UUP, takes the most right-wing position economically, while SF takes the furthest left position; (2) that on the cultural-moral dimension the Alliance, followed by SF, takes the most socially liberal position while the DUP takes the most socially conservative position; (3) that (unsurprisingly) SF takes the most nationalist position, while the DUP and UUP take the most unionist position and (4) that the SDLP and Alliance are the most pro-EU parties, while the DUP is the most Eurosceptic.
To augment this analysis, we also consider the positions of those VAA users who can be described as ‘party supporters’. These we define as users who (1) say they feel closest to a particular party and (2) said that they would vote for the same party in the forthcoming elections. Of these, we identified 499 SF supporters, 225 DUP supporters, 289 SDLP supporters, 173 UUP supporters and 907 Alliance supporters. The mean positions of each group of party supporters with respect to all four dimensions are shown in Table 5 (below).
Party Positions of Party Supporters by Dimension.
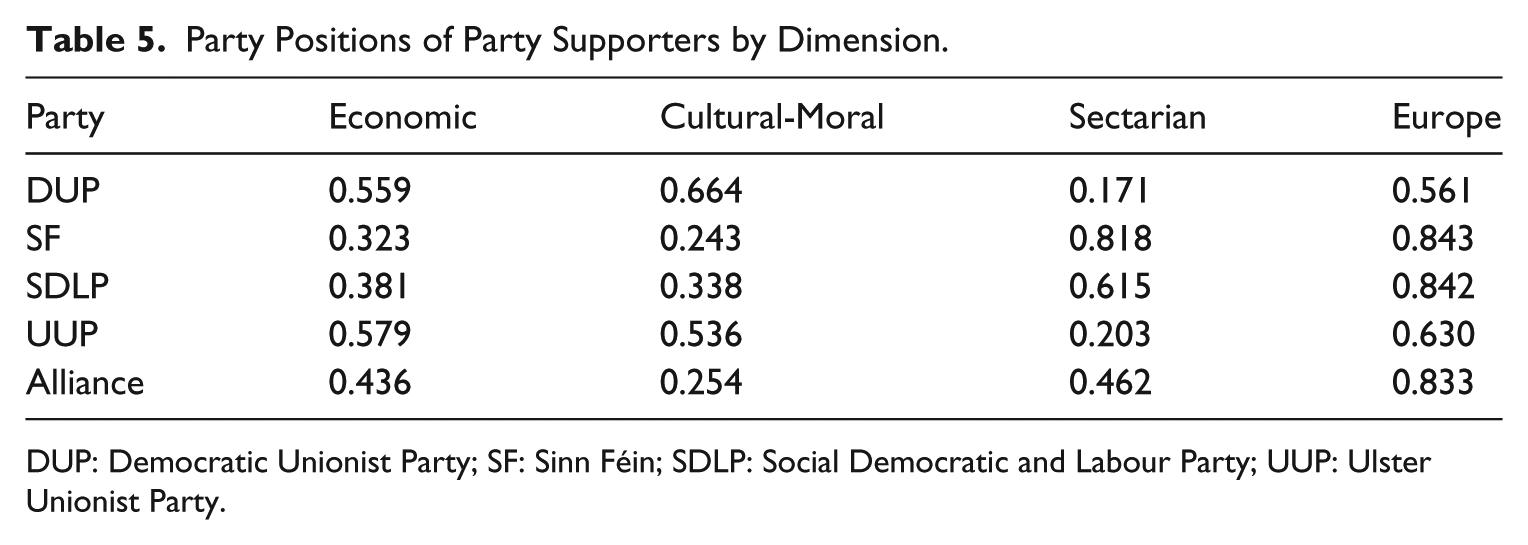
DUP: Democratic Unionist Party; SF: Sinn Féin; SDLP: Social Democratic and Labour Party; UUP: Ulster Unionist Party.
Figure 1 (below) displays these positions graphically but considers only the two dimensions that polarise the parties most: the cultural-moral dimension and the sectarian dimension. The plots display the means of each group of party supporters with respect to these two dimensions (with a square), each party’s position according to the expert coding (with an asterisk) and the contour lines that enclose 50% of party supporters. 13 We can see that, as is the case with the party positions from expert coding, Alliance and SF supporters are located on the liberal side of the cultural-moral spectrum, while DUP supporters are furthest towards the conservative pole. Similarly, DUP supporters and SF supporters are at opposite sides of the sectarian scale. As expected, the official party positions as coded by experts appear more polarised than party supporters, given the need of parties to be consistent. SF and the SDLP appear to buck this trend somewhat, insofar as their supporters appear somewhat more ‘liberal’ than the party position. However, older voters of these two long-established parties may be more conservative than younger supporters, who are more likely to use the VAA.
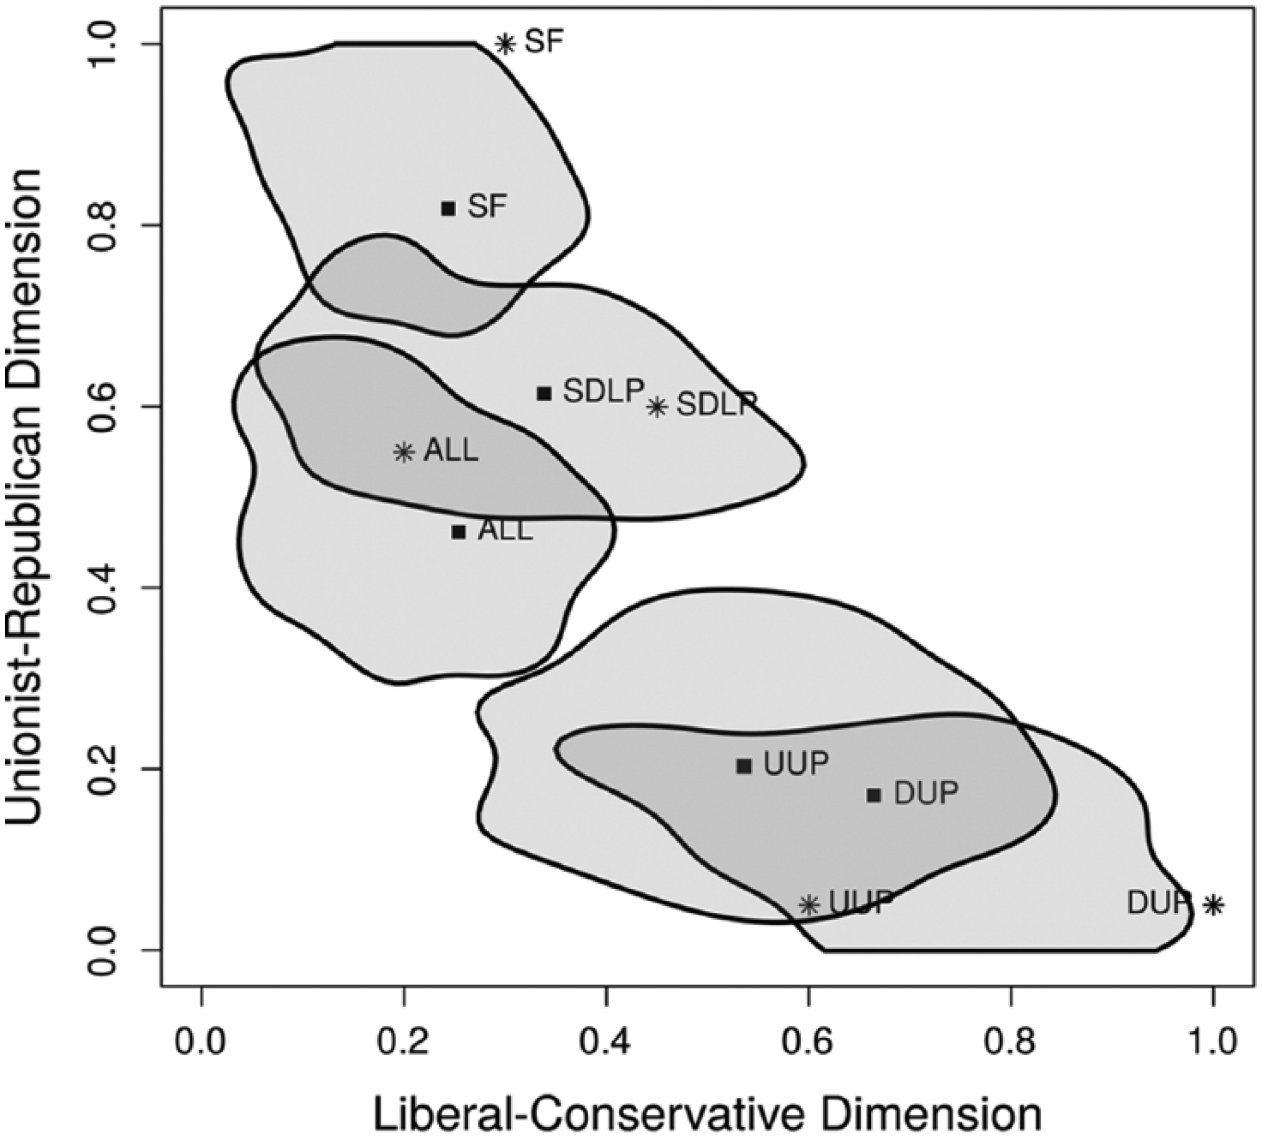
Party Map.
Voting Behaviour
So far we have demonstrated that, in addition to the ethno-national dimension, the moral liberal-conservative theme is a strong attitudinal dimension when data from citizens (the demand side) is examined and parties (the supply side) do offer clear positions on this dimension. Do voters, in addition to ethno-national factors, actually vote on the basis of the moral dimension? We examine the vote choice of the two community blocs separately. First, we examine Protestant vote choice between the two main unionist parties (DUP and UUP) and the bi-communal Alliance party. The identification of Protestant and Catholic voters was made possible by the inclusion in the VAA of a supplementary question that asked for users’ community backgrounds.
A multinomial logistic regression of Protestant respondents’ vote intention between the DUP, UUP and Alliance is reported in Table 6, while a similar regression of Catholic respondents’ vote intention (between SF, the SDLP and Alliance) is shown in Table 7. Our three value dimensions are predictors, and we control for the ethno-national dimension, age, gender and interest in politics. We also control for reported voting behaviour at the previous Westminster election (in 2010), enabling our model to identify whether increased salience of economic and moral matters, since 2010, influences vote intention in 2015.
Multinomial Logistic Regression Predicting Protestant Vote: (DUP = Reference Category).
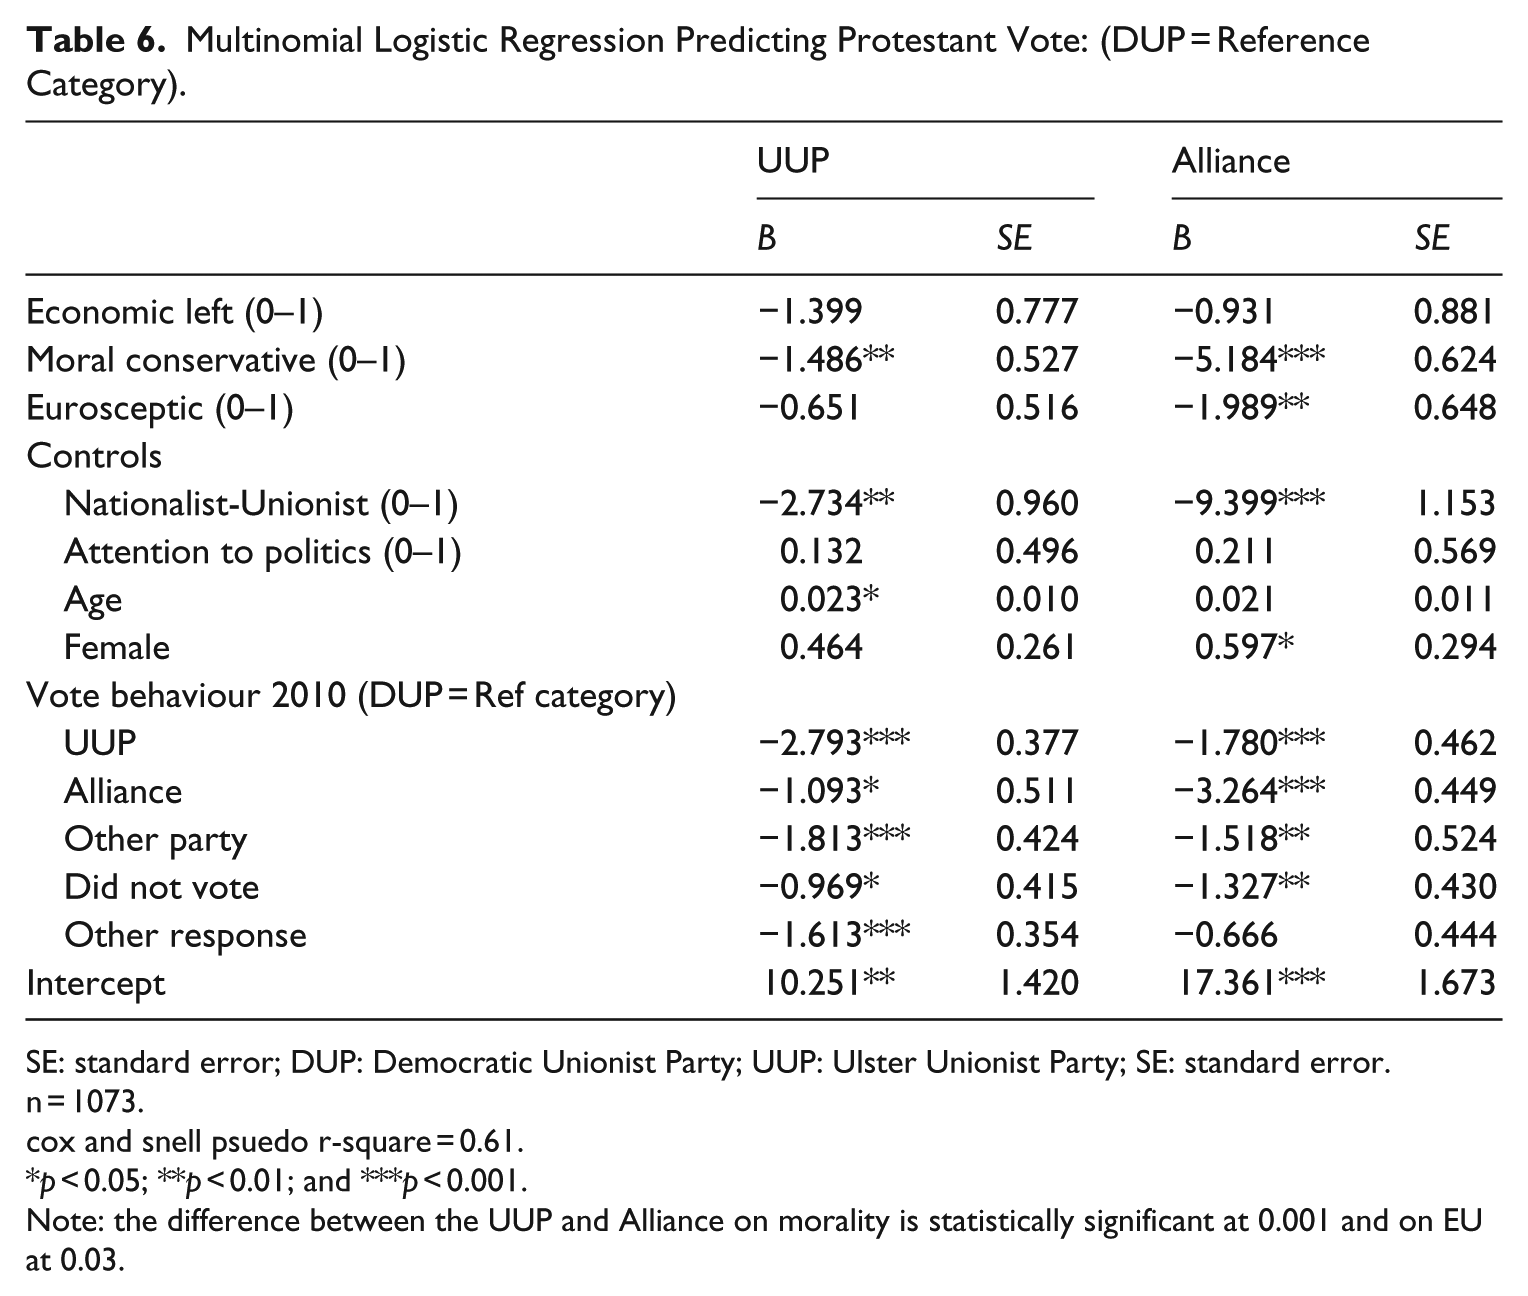
SE: standard error; DUP: Democratic Unionist Party; UUP: Ulster Unionist Party; SE: standard error.
n = 1073.
cox and snell psuedo r-square = 0.61.
p < 0.05; **p < 0.01; and ***p < 0.001.
Note: the difference between the UUP and Alliance on morality is statistically significant at 0.001 and on EU at 0.03.
Multinomial Logistic Regression Predicting Catholic Vote: (Sinn Féin = Reference Category).
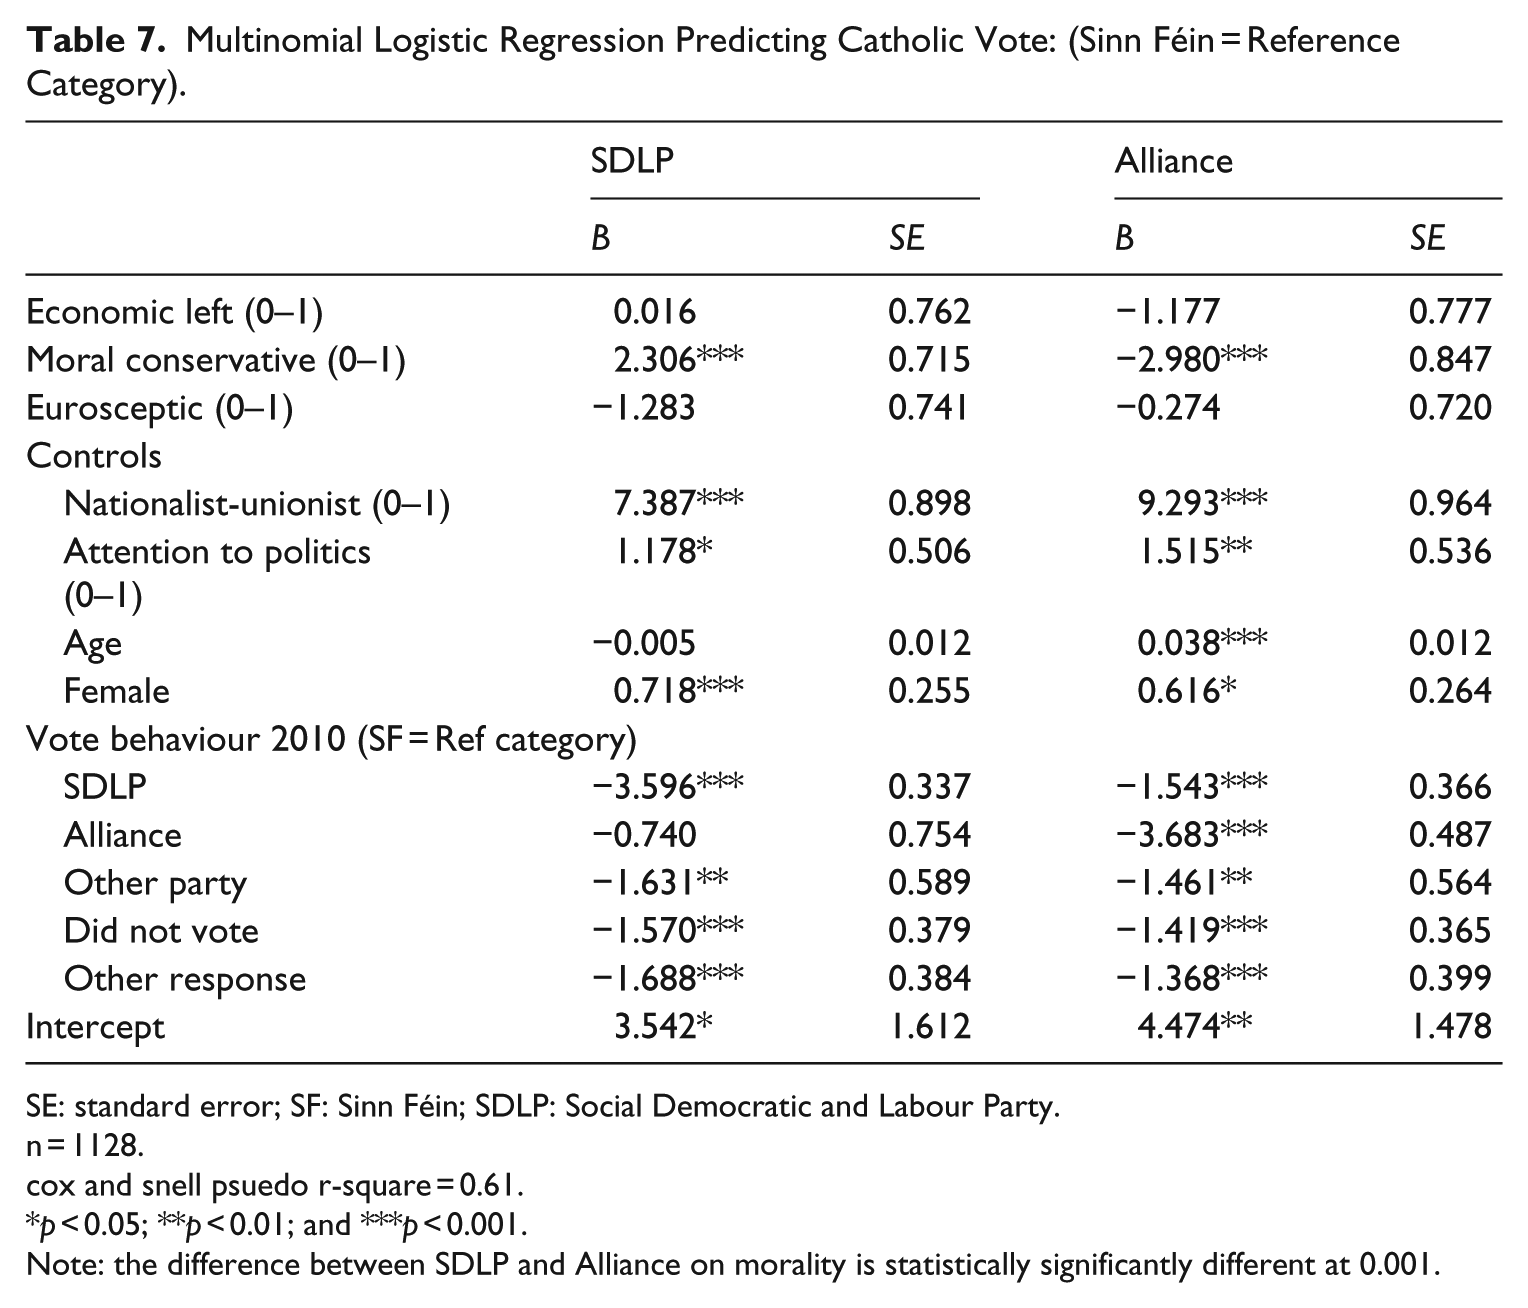
SE: standard error; SF: Sinn Féin; SDLP: Social Democratic and Labour Party.
n = 1128.
cox and snell psuedo r-square = 0.61.
p < 0.05; **p < 0.01; and ***p < 0.001.
Note: the difference between SDLP and Alliance on morality is statistically significantly different at 0.001.
We do not find that economic left-right attitudes predict vote choice in either community. 14 However, we find that liberal-conservative attitudes predict vote choice for both communities to a statistically significant extent (p < 0.001). Using the DUP as a reference category for Protestant voters, we see that a move away from the conservative pole first predicts UUP support and then (as we move towards the liberal pole) Alliance support. For Catholic voters, if we use SF as a reference category, a move towards the liberal pole predicts a vote for Alliance, while a move towards the conservative poll predicts an SDLP vote. The Europe dimension has predictive power only among Protestant voters with a pro-EU position predicting an Alliance vote (p < 0.01).
Conclusion
Institutional responses to violent conflict may start from a simple departure point that similarity between humans is desirable or difference is to be celebrated. Accordingly, responses may facilitate homogeneity or heterogeneity: encourage assimilation or break-up. Accommodationist strategies are towards the recognition-of-difference end of the response spectrum, and consociational power sharing is one influential option in the post-conflict democratic designer’s toolkit (see discussion in O’Leary, 2013). While critics bemoan its recognition of the underlying divide upon which conflict was based, proponents would highlight the system as necessary to provide group-based safeguards at the same time as ending violence. Proponents would also downplay the likelihood of the system cementing a divide-based dimension of competition, while critics are more wary. It is the role of empirical analysis to help identify whether or not multidimensional politics operates in the context of power sharing.
We set up a fairly challenging set of criteria for the observation of multidimensional politics. From the demand side, a dimension must exhibit strong internal coherence as evidenced in the inter-correlation of citizens’ responses to survey items related to a particular theme, and the dimension must be demonstrably distinct from the dimension associated with the underlying divide. From the supply side, parties must offer distinct positions as measured by a set of expert coders using published party statements on the same issues that cluster for citizens on that theme. Third, regarding the interplay of supply and demand there must be evidence of citizens’ vote choice being determined by the issue area, controlling for the underlying divide and previous vote choice.
From the Northern Ireland example, the moral liberal-conservative divide meets these quite demanding criteria. This suggests that there is scope for multidimensional politics to operate under power-sharing conditions. Ethno-national disputes still bedevil Northern Ireland politics, and ‘legacy’ issues associated with flags, parading and the past are far from being resolved. But this continuing political disagreement over issues associated with the nationalist-unionist divide may coexist with other issue areas. This is not to say that members of one community are ‘crossing the divide’ and voting for parties from the rival community, but within-bloc and outside-bloc voting is driven by the moral dimension and that dimension is strongly coherent. Indeed, events since the 2015 Westminster election suggest that the cultural-moral dimension – and the issue of gay rights in particular – will remain salient for both citizens and parties (posing the challenge of how parties deal in the future with this ‘second dimension’ of competition (Elias et al., 2015)). On 2 November 2015, the Northern Ireland Assembly voted narrowly in favour of same-sex marriage. The motion was, however, controversially vetoed by the DUP. Subsequent comments by UUP leader Mike Nesbitt on the issue also suggest a potential liberalising of his party’s stance, which would create greater distinction within the unionist bloc (BBC, 2015). So, the implications of this analysis for normative debates about whether or not consociation is a good institutional response to violent conflict is that, at least in the exemplary Northern Ireland case, there is current evidence that a non-ethno-national dimension of competition is observable and hence the concerns of critics that the institutions cement the ethno-national divide seem to be overplayed.
Footnotes
Appendix
Issue Statements in the WhoGetsMyVoteUK VAA.
| Item no. | Item |
|---|---|
| 1 | Government spending should be cut further in order to balance the budget. |
| 2 | A ‘mansion tax’ should be levied on high-value residential properties. |
| 3 | Inheritance tax should be abolished. |
| 4 | The top rate of income tax should be reduced. |
| 5 | Stormont should block the introduction of what is commonly known as the ‘bedroom tax’ on under-occupied social homes. |
| 6 | Private sector involvement in the National Health Service (NHS) should be reduced. |
| 7 | The government should allow the extraction of underground shale gas (fracking). |
| 8 | The option of imprisonment should be retained for the possession of drugs, including for personal consumption. |
| 9 | Women should be free to decide on matters of abortion. |
| 10 | Same-sex and heterosexual couples should enjoy the same rights to marry. |
| 11 | Doctors should be allowed to help terminally ill patients to die if they so wish. |
| 12 | Northern Ireland should be more confident about its Christian heritage. |
| 13 | For social housing, priority should be given to people whose parents and grandparents were born locally. |
| 14 | Post-primary schools in Northern Ireland should be able to select pupils according to ability. |
| 15 | University tuition fees should be scrapped. |
| 16 | The United Kingdom should remain within the European Union. |
| 17 | A single EU member state should be able to block a treaty change, even if all the other member states agree to it. |
| 18 | The United Kingdom should take a tougher line over Russian involvement in Ukraine. |
| 19 | The United Kingdom should maintain its support to developing countries through foreign aid. |
| 20 | The United Kingdom should be able to restrict the number of EU immigrants entering the country. |
| 21 | The United Kingdom should welcome a larger number of asylum seekers from war-torn countries. |
| 22 | State benefits should only be available to those who have lived in the United Kingdom for at least 5 years. |
| 23 | Young people should be given the right to vote at the age of 16 years. |
| 24 | The United Kingdom should withdraw from the European Convention on Human Rights. |
| 25 | Northern Ireland should become part of a United Ireland. |
| 26 | The IRA’s violent campaign during the Troubles was totally unacceptable and always wrong. |
| 27 | There should be strict limits on the number of days the Union flag can be flown on public buildings. |
| 28 | Parades should only be allowed after talks between marchers and residents. |
| 29 | Those convicted of Troubles-related terrorist offences should be regarded as ‘victims’ of the conflict. |
| 30 | Businesses should be allowed to refuse custom to those who hold views contrary to their religious faith. |
Funding
John Garry and Neil Matthews would like to acknowledge that their work was supported by the Economic and Social Research Council [grant number ES/L005808/1].
Supplementary Information
Additional supplementary information may be found with the online version of this article.
Online Appendix: Technical Issues
Table A1: Size of the Datasets Table A2: Sampling Procedure for representativeness by vote intention Table A3: Factor Loadings (WhoGetsMyVoteUK, full dataset) Table A4: Factor Loadings (WhoGetsMyVoteUK, re-sampled) Table A5: Factor Loadings (EUvox) Table A6: Dimensionality of the Policy Space (EUvox), n = 2172 Table A7: Mokken Scale Analysis (WhoGetsMyVoteUK, full dataset) Table A8: Mokken Scale Analysis (WhoGetsMyVoteUK, re-sampled) Table A9: Mokken Scale Analysis (EUvox) Table A10a: Dimensionality of the Policy Space (WhoGetsMyVoteUK): Less politically attentive users (attention to politics 6 or less), n = 3024 Table A10b: Dimensionality of the Policy Space (WhoGetsMyVoteUK): Users who left school at the age of 19 years or before, n = 1504 Table A10c: Dimensionality of the Policy Space (WhoGetsMyVoteUK): Users aged 35 years and over, n = 2086 Table 11a: Mokken Scale Analysis Applied to the Four Policy Dimensions (WhoGetsMyVoteUK): Less politically attentive users (attention to politics 6 or less), n = 3024 Table A11b: Mokken Scale Analysis Applied to the Four Policy Dimensions: Users who left school at the age of 19 years or before (WhoGetsMyVoteUK), n = 1504 Table A11c: Mokken Scale Analysis Applied to the Four Policy Dimensions (WhoGetsMyVoteUK): Users aged 35 years and over, n = 2086 Figure A1: WhoGetsMyVote (full dataset) Figure A2: WhoGetsMyVote (re-sampled) Figure A3: EUvox (full dataset)
Notes
Author Biographies
References
Supplementary Material
Please find the following supplemental material available below.
For Open Access articles published under a Creative Commons License, all supplemental material carries the same license as the article it is associated with.
For non-Open Access articles published, all supplemental material carries a non-exclusive license, and permission requests for re-use of supplemental material or any part of supplemental material shall be sent directly to the copyright owner as specified in the copyright notice associated with the article.