
Abstract
Agriculture's potential to reduce poverty assumes that income from crops can significantly increase per capita income of small farm households. Using nationally representative data on the value and variable costs of production of 10 crops (rice, maize, blackgram, chickpea, pigeonpea, mustard, groundnut, soybean, sunflower, sesamum) commonly grown in India, we calculated the mean benefit: cost (B:C) ratios and profit per hectare for each crop in seven three-year periods between 2000 and 2020. All crops were profitable (B:C > 1) in all periods but B:C varied widely and unpredictably, both between crops and with time. We then calculated, for the maximum and minimum observed national level values of B:C for each crop, the relation between household land per capita (LPC) over the range 0–1.0 hectares per person, and the crop personal daily income (CPDI) in PPP $ per person per day that would be generated by growing that crop. Only three out of a possible 100 combinations of crop and LPC (chickpea, 2005–2008, LPC = 1.0 and mustard (2008–2011, LPC = 0.9 or 1.0) generated CPDI values greater than a poverty line of $2.15 per person per day. A large survey confirmed that 96.9% of farming households in India had LPC values of 1.0 hectares per person or less. The majority of farming households could not have generated enough income from growing any of these crops during this twenty-year period to reach a poverty line of $2.15 per person per day. Most farms in India do not have enough land to benefit much from intensifying their crop production. Such small incentives and uncertainty about expected returns on investment (and increased exposure to risk) might contribute to low adoption of best practices, and more in-depth studies of rural household livelihood portfolios are needed to clarify that assumption.
Introduction
Estimates suggest there are very many smallholder farmers in the world (Giller et al., 2021; Lowder et al., 2016, 2021; Lowder et al., 2025). These rural households are the target of many development efforts – to increase yields (Global Yield Gap Atlas, 2025; Van Ittersum et al., 2016) and so improve local, national and global food security (Godfray et al., 2010; Godfray and Garnett, 2014), reduce the impact of farming on the environment (United Nations, 2015), and to use crop and livestock production to move out of poverty (CGIAR, 2005; Harris and Orr, 2014).
This study focuses on crop production. To grow crops, to feed their families directly or to be sold to provide income, smallholder farming households must invest some resources. Those resources include time and effort, money (derived from previous farming, other income, savings, or credit) to buy inputs such as seeds, fertilisers, pesticides, tools, and perhaps additional labour. The other necessary resource is land, which may be owned, leased, shared or allocated by the community. By definition, smallholder households do not operate very much land.
In comparison with promoting higher yields, increasing the economic returns from smallholder agriculture has received less emphasis by the research and development community. In general, increasing yields involves increasing investment, and so putting more resources at risk if things go wrong. With limited resources, smallholder rural households need to feel confident that their investment in cropping will pay off reliably and that the benefit will be worth the investment. One easily appreciated measure of return on investment in crop production is the benefit: cost ratio (B:C), defined here in its simplest form as the gross value of all crop outputs divided by the variable costs of production. Values of B:C greater than 1 represent a profit whereas values less than 1 mean that the farmer has made a loss.
At first glance, investing in growing crops is a great way to make money. The literature is full of reports of technologies with B:C ratios greater than one, that is, they are profitable. In fact, larger values for B:C are commonly claimed (see a review by Rosegrant et al., 2023). For instance, almost all the improved rainfed cropping technologies surveyed by Harris and Orr (2014) had B:C ratios (calculated using costs including the imputed value of family labour) greater than two and some had values greater than three or even more. More recently, many authors, for example, Cartsburg et al. (2024), Sanchez et al. (2022), and Gathala et al. (2020) have reported similarly large returns on investment. So, if a rural household had access to some land and was prepared to spend (in money and in kind), say, a thousand dollars they could get an additional thousand dollars in a season (or year, depending on the environment and how many seasons per year it allowed) by engaging in a cropping enterprise with a B:C ratio of 2. Any bank or savings institution that offered such an unprecedented interest rate of 100% on investment would be inundated with investors. Unfortunately, smallholder rural households do not have much land, nor do they generally have much money to invest. Any money they do have is not all ‘spare’ and available for investment; some must be spent on food, clothing and other necessities. To increase adoption, interventions and innovations should therefore not only increase yields but also reduce input requirements per unit of output of those factors which are scarce or expensive (Binswanger, 1986).
India has very many farming households with small amounts of land and the country also has available large amounts of data describing those households and how they grow crops. In this paper we use those data to demonstrate that:
With some exceptions, most cropping enterprises are profitable, that is, have B:C ratios > 1. B:C ratios of a range of crops vary considerably and unpredictably between seasons and between years. Even cropping enterprises with high B:C values only generate small benefits per person for members of households with small amounts of land per capita. To generate significant incomes, the investment required by smallholder households is unfeasibly high.
Our work complements prior studies on living income potential (or lack thereof) of agricultural investments in India. These include Chand et al. (2011), Chand et al. (2015), Gaurav and Mishra (2015), Reddy et al. (2020), and Singh et al. (2025). Despite not focusing on livestock, our study also complements studies on the puzzle of low economic returns in the livestock sector, especially dairy cattle in India (e.g. Attanasio and Augsburg, 2017; Gehrke and Grimm, 2018).
Materials and methods
Data
We use data from two sources: (i) the Government of India's Commission of Agricultural Costs and Prices (CACP) data summarised by Johnson and Singh (2022) and (ii) the National Sample Survey (NSS) 77th Round Situation Assessment of Agricultural Households and Land and Holdings of Households in Rural India. Johnson and Singh (2022) reported trends in costs of cultivation, prices, and incomes for seven three-year periods during 2000–2001 to 2019–2020 for 10 agricultural crops grown in India: rice; maize; blackgram; chickpea; pigeonpea; mustard; groundnut; soybean; sunflower; and sesamum. We report much of the results for these 10 crops, but we also analysed the original CACP data for 17 other crops including wheat and sugarcane for the period 2011–2020 with similar general results (Table S2).
From the Tables in their report, we extracted costs per hectare (A2 + FL) and the gross value of output per hectare (GVO) for all crops and periods. As defined by GOI (2008), A2 + FL represents all paid-out costs such as for seeds, fertilisers, manure, insecticides, etc., hired human-, machine-, and animal labour, interest on working capital, rent paid for leased-in land, and depreciation and maintenance expenditure incurred for owned machinery, and the imputed value of family labour. GVO is calculated as the sum of the values of the main product and any by-products. Rupees were converted to Purchasing Power Parity US dollars using conversion factors representative of each three-year period.
The Situation Assessment of Agricultural Households and Land and Holdings of Households in Rural India, India, NSS 77th Round (National Sample Survey, 2019) provides a nationally representative sample of Indian farming households. We used two variables, household size and farm size to calculate land per capita (LPC) and its distribution.
Stylised identities
For each of the 10 crops, we used the maximum and minimum values of B:C during the 20-year period (‘bounds analysis’, Pardey et al., 2014) to calculate the personal daily income that could be derived from crop production (CPDI, in PPP $ per person per day) of members of farming households with land per capita ratios ranging from 0.1 to 1.0 hectares per person. We used the relation

This stylised identity has previously been used by Harris and Orr (2014). It is also similar to the physical productivity identity (e.g. Gollin, 2018; Hayami and Ruttan, 1985) that states that labour productivity (output per labour) is a product of land productivity (output per land) and land per capita.
Starting from this measure, we can then compute the two measures that a farmer can change in the short run to improve CPDI: (i) investments other than land that can raise the productivity and therefore profits per unit of land, and (ii) the amount of land per capita required to achieve a particular threshold.
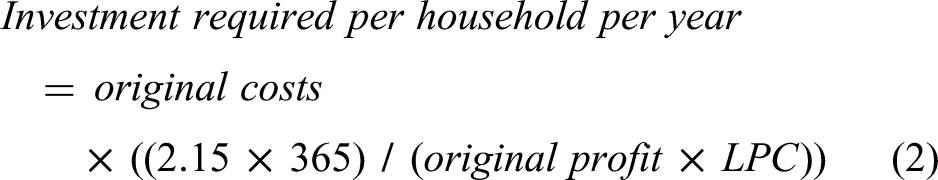
Using the same maximum and minimum cases for crops and the same range of LPC, we calculated the amount of investment per household that would be required to generate a CPDI value of PPP $2.15/person/day, that is, to reach the international poverty line as updated by the World Bank Group in 2022, using the relation
In applying equations (1) to (3), we recognise that we describe a somewhat artificial situation, in that farmers often do not grow any of the 10 crops on all of their land in any season, nor are they restricted to these ten crops. Nor are all farmers restricted to one growing season per year if rainfall or irrigation is available and temperatures are suitable for supporting plant growth, although it should be borne in mind that such additional crops require additional costs of a similar magnitude to those encountered in this study and would be exposed to similar levels of risk and uncertainty of outcome. We contend that our approach is appropriate to demonstrate the year-to-year volatility and unpredictability of the profit, and consequent income per person, to be gained from crop production in India during this twenty-year period.
Results and discussion
Benefit: cost ratios of crop production
Figure 1 shows mean values of B:C ratio for 10 common crops during seven three-year periods between 2000 and 2020. Means, medians and estimates of intertemporal variability for each crop are summarised in Table S1. We report much of the results for these 10 crops, but we also analysed the original CACP data for 17 other crops including wheat and sugarcane for the period 2011–2020 with similar general results (Table S2). These estimates are consistent with prior evidence from Chand et al. (2015) who documented B:C values that ranged from 1.31 to 1.7 between 1983–1984 and 2011–2012. All crop x period combinations are profitable, that is, B:C is >1, but some crops are consistently more profitable than others in all periods. However, there is a large amount of variation in the B:C value of all crops from period to period. We assume that B:C is the resultant of various interactions between land quality, weather, management, policy, markets, prices, etc., and so is impossible to predict in advance of choosing a crop and planting it. In that sense, crop profitability is uncertain and hence investment in crop production carries an unknown degree of risk. This is consistent with evidence by Agarwal and Agrawal (2017) that almost 40% of farmers in India expressed that they don’t like farming because of low profitability (60%) seconded by risks (19%).
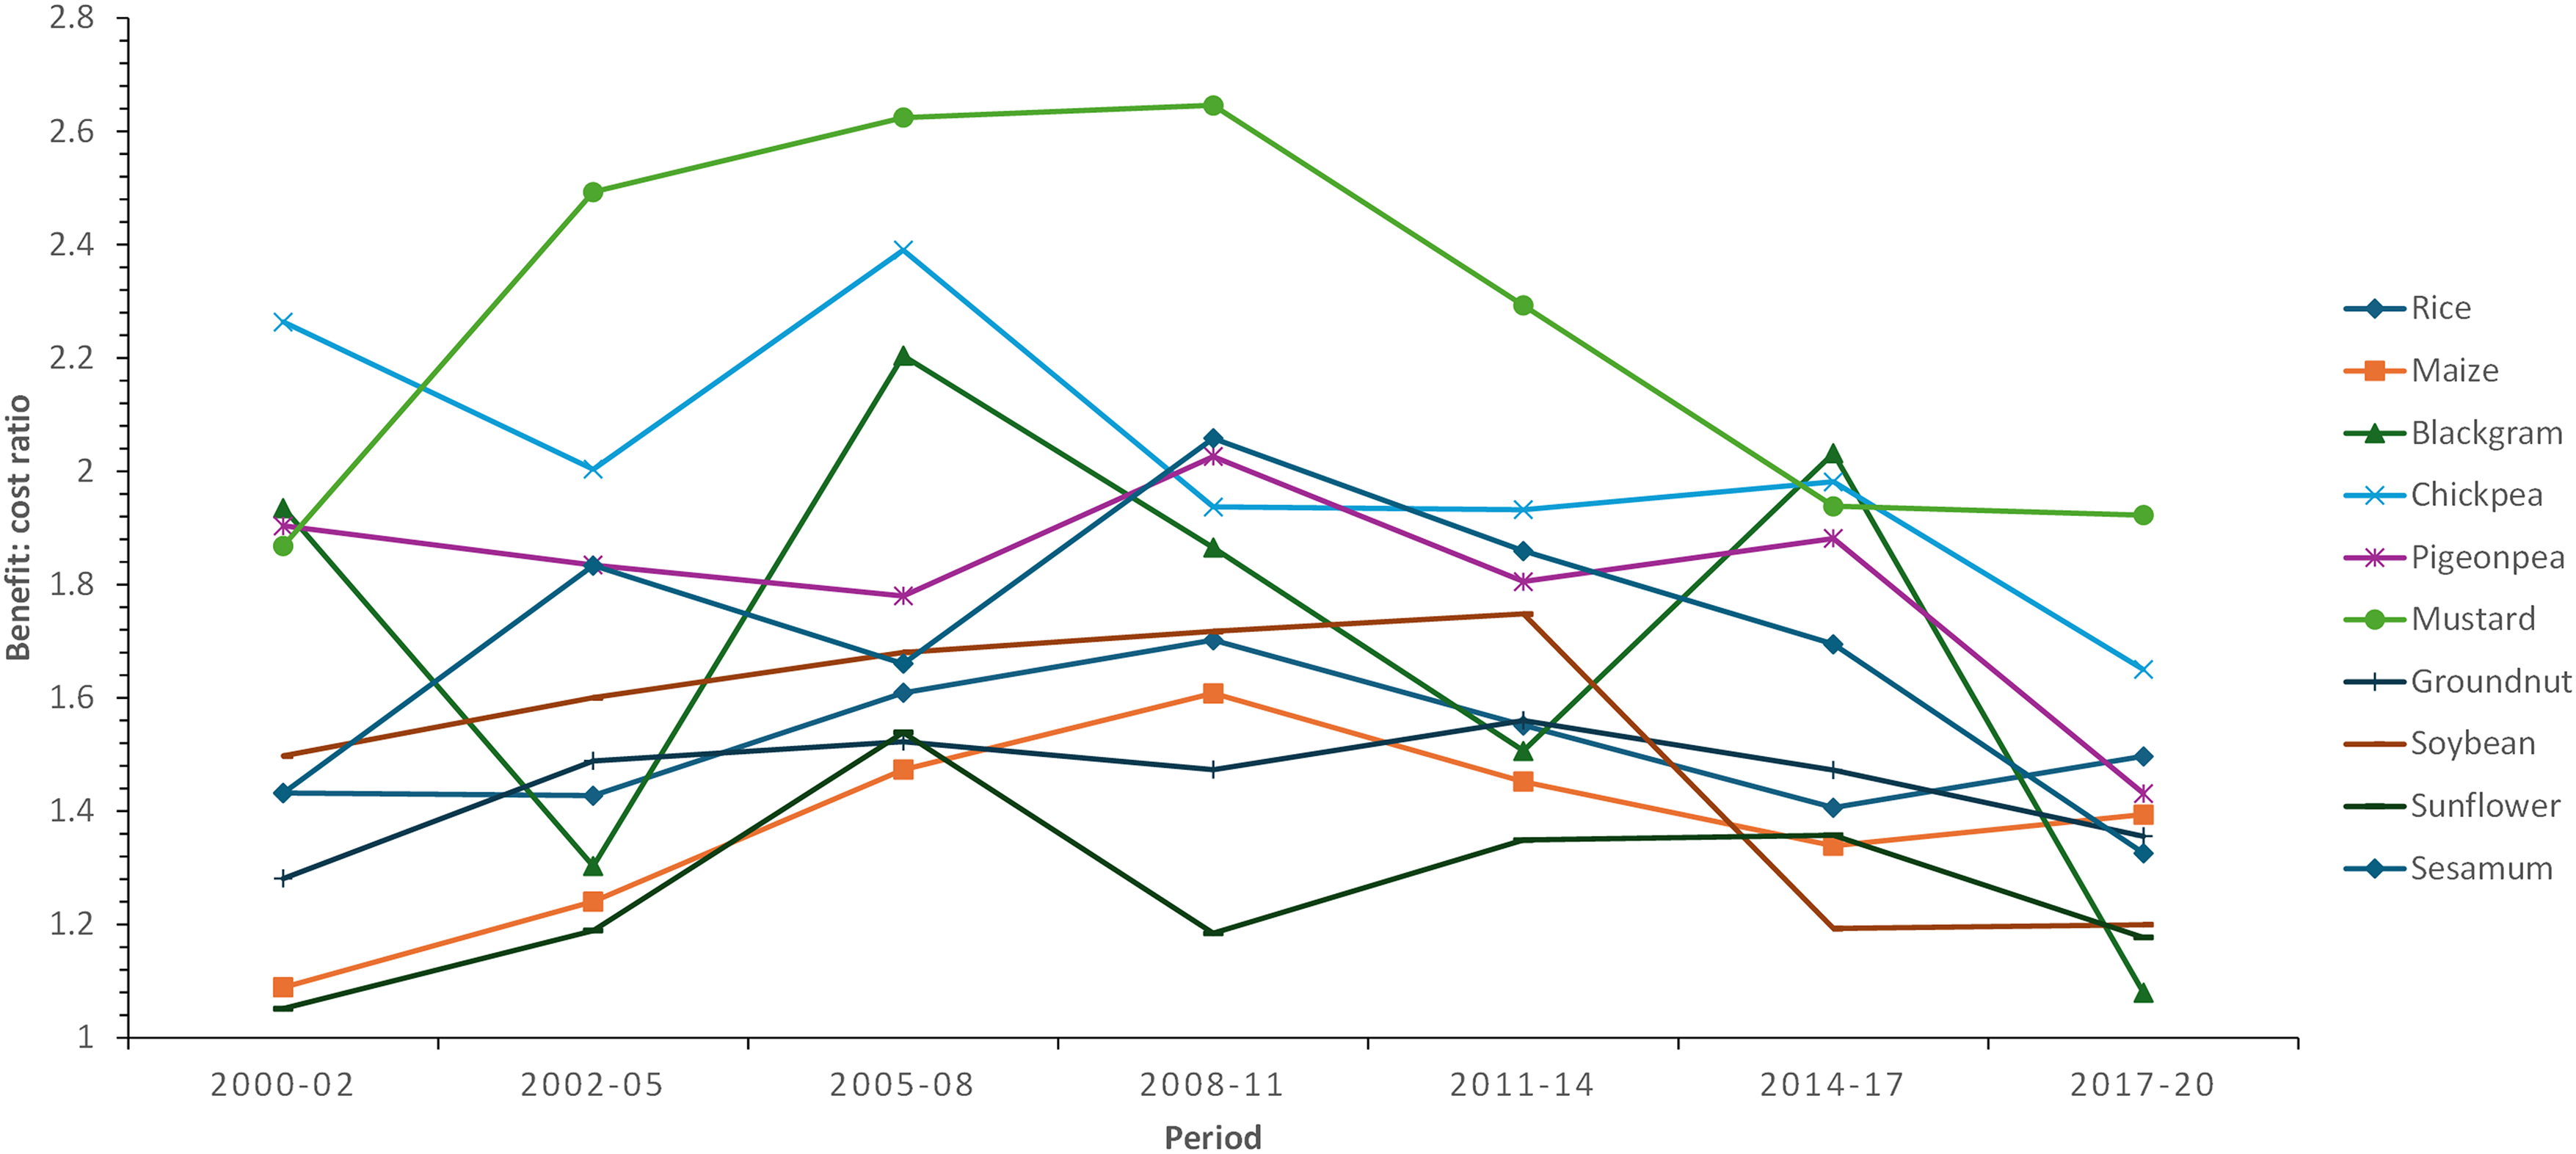
Benefit: cost ratios (gross income per hectare minus variable costs per hectare including imputed cost of family labour) of 10 crops in India between 2000 and 2020. Data from: Trends in costs and incomes from crop production in India: analysis of costs of cultivation data, 2000–2001 to 2019–2020. A project report prepared by the Foundation for Agrarian Studies for International Rice Research Institute, November, 2022.
Table 1 shows the maximum and minimum B:C ratios of the ten crops in Figure 1, together with the associated costs and benefits, both in Indian Rupees and in Purchasing Power Parity dollars calculated using the appropriate conversion factor for the period. Supplemental Table S1 shows the corresponding mean and median values. Both costs and gross incomes per hectare vary markedly between the maximum and minimum periods and the differences in levels of profitability are substantial for all crops, ranging from a 17% reduction (defined as the difference as a proportion of the maximum) in rice to a 51% reduction in blackgram. It should be noted that the returns on investment and profits in Table 1 (and hence also the values of CPDI in Table 2) do not consider any fixed costs or taxes that might have been applicable to farmers’ circumstances, so are almost certainly overestimates of actual profitability.
Maximum and minimum values (see Figure 1) of benefit: cost ratios (gross income per hectare divided by variable costs per hectare including imputed cost of family labour) of 10 crops in India between 2000 and 2020.
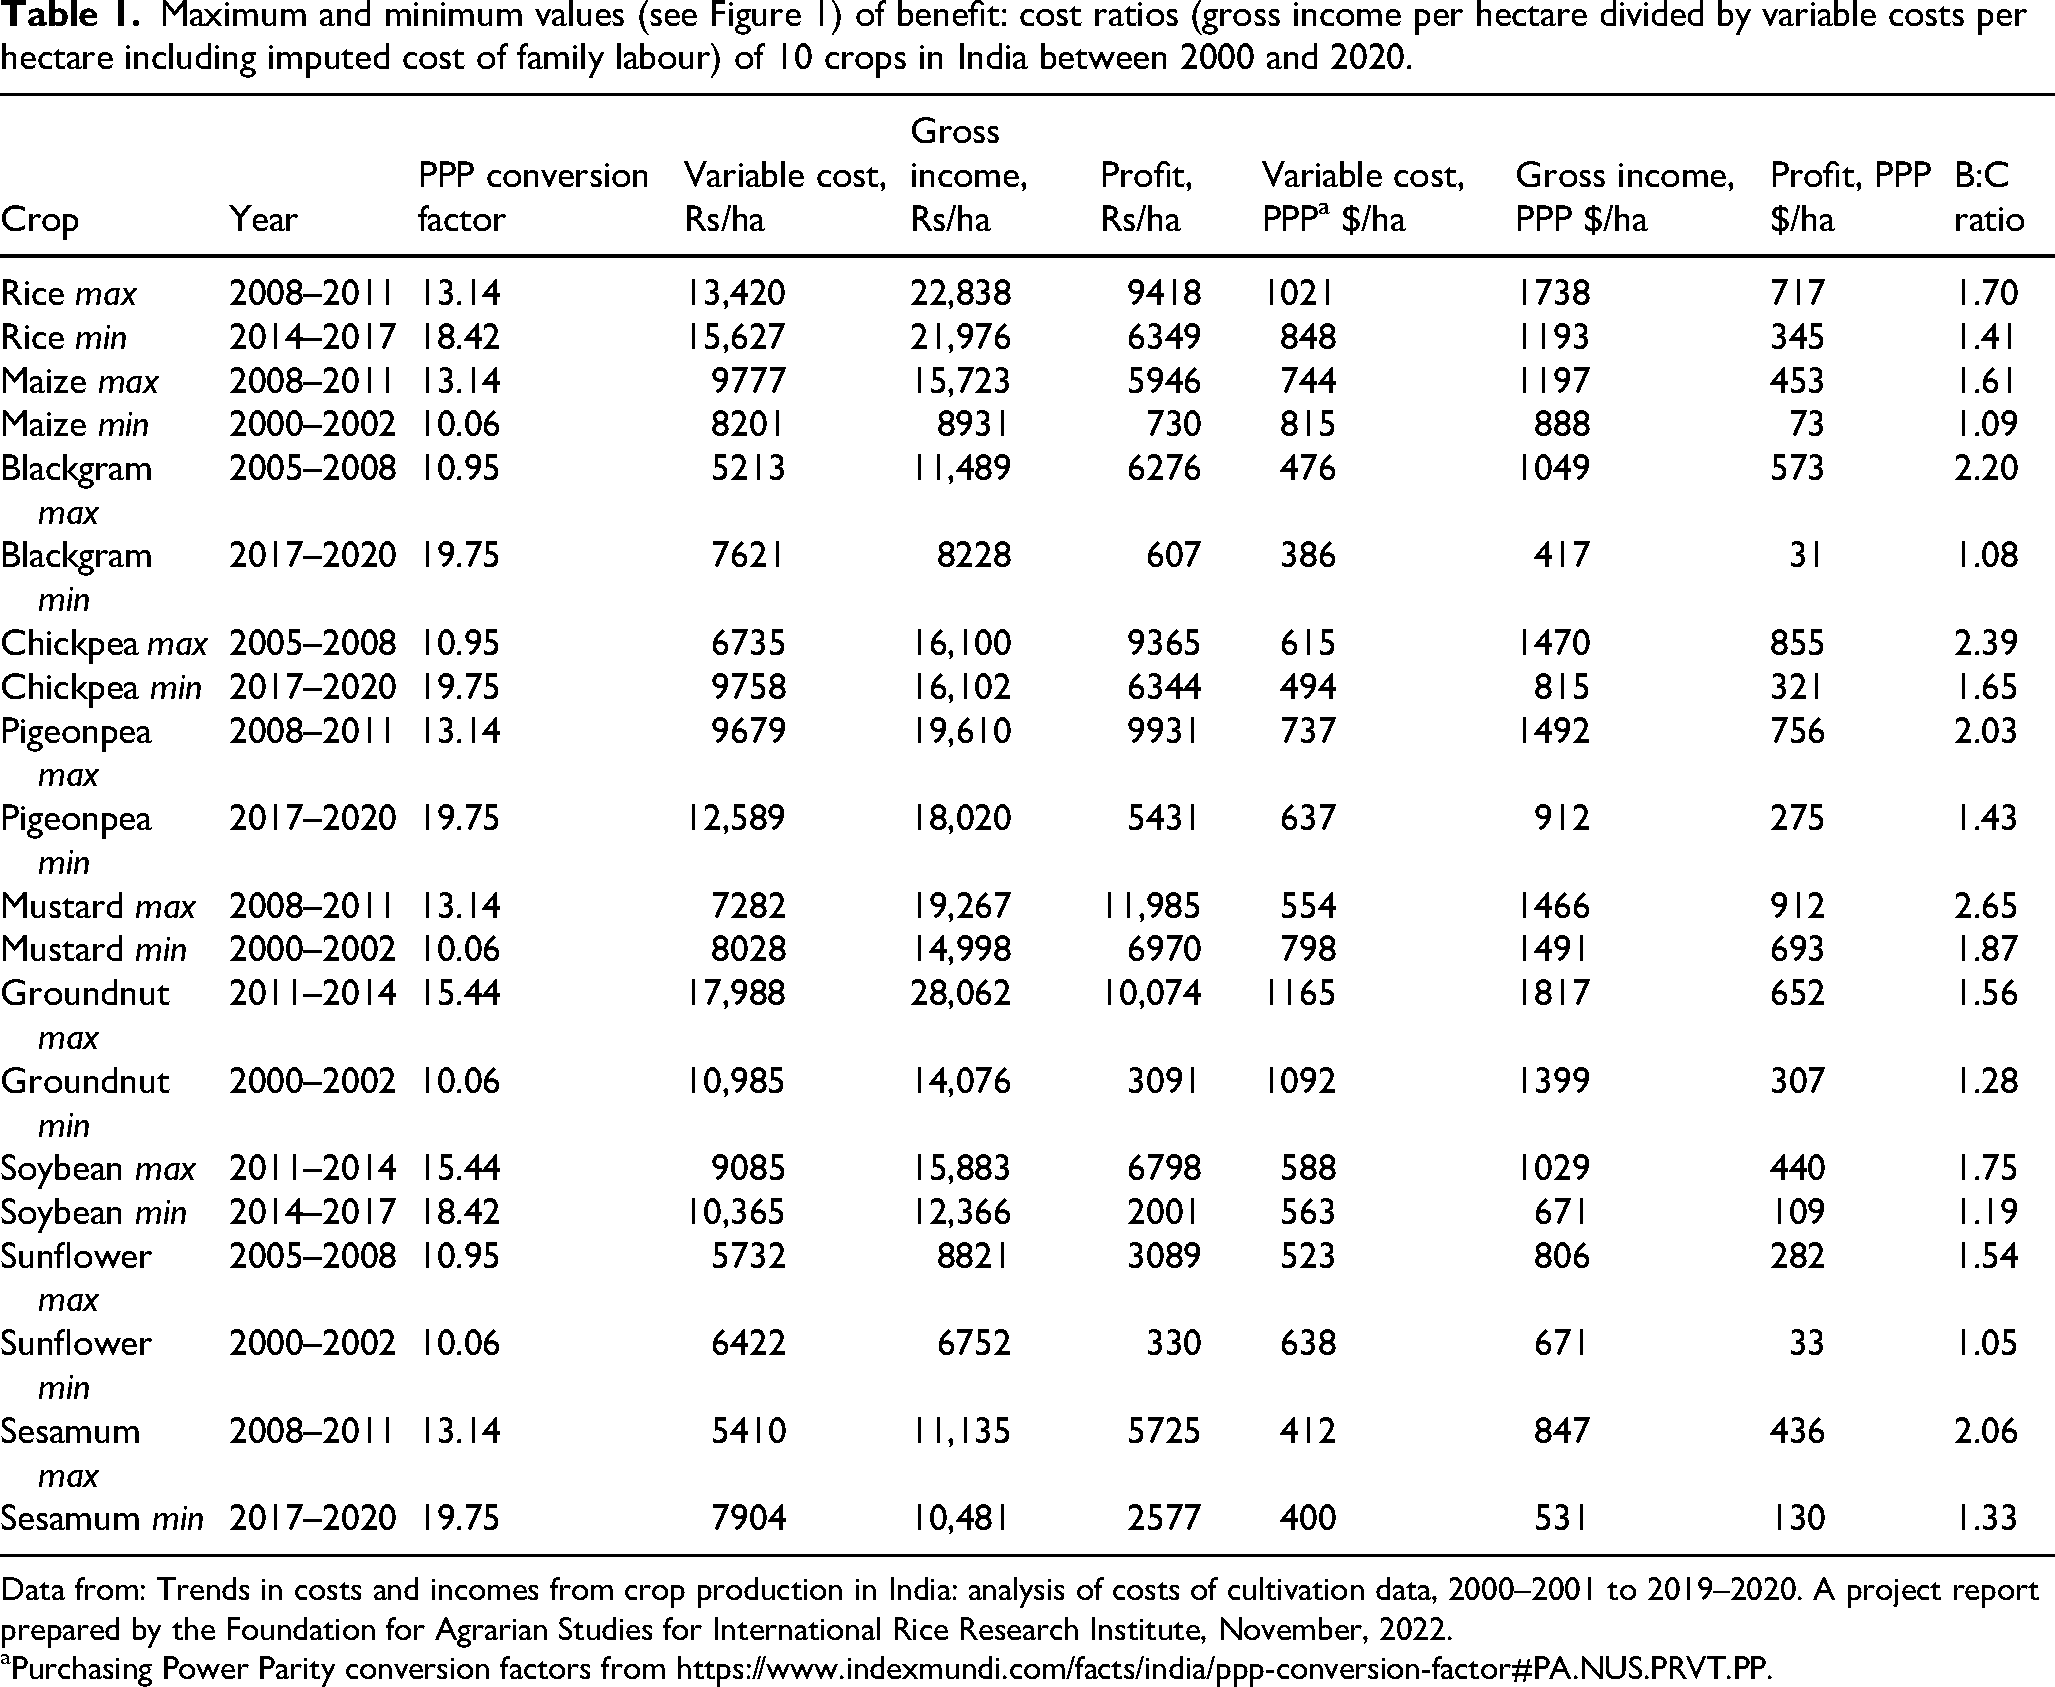
Data from: Trends in costs and incomes from crop production in India: analysis of costs of cultivation data, 2000–2001 to 2019–2020. A project report prepared by the Foundation for Agrarian Studies for International Rice Research Institute, November, 2022.
Purchasing Power Parity conversion factors from https://www.indexmundi.com/facts/india/ppp-conversion-factor#PA.NUS.PRVT.PP.
Personal daily income (PPP $/person/day) from crops at the maximum and minimum values of B:C ratio (2000 to 2020) by land per capita (ha/person). Only shaded values exceed $2.15/person/day.
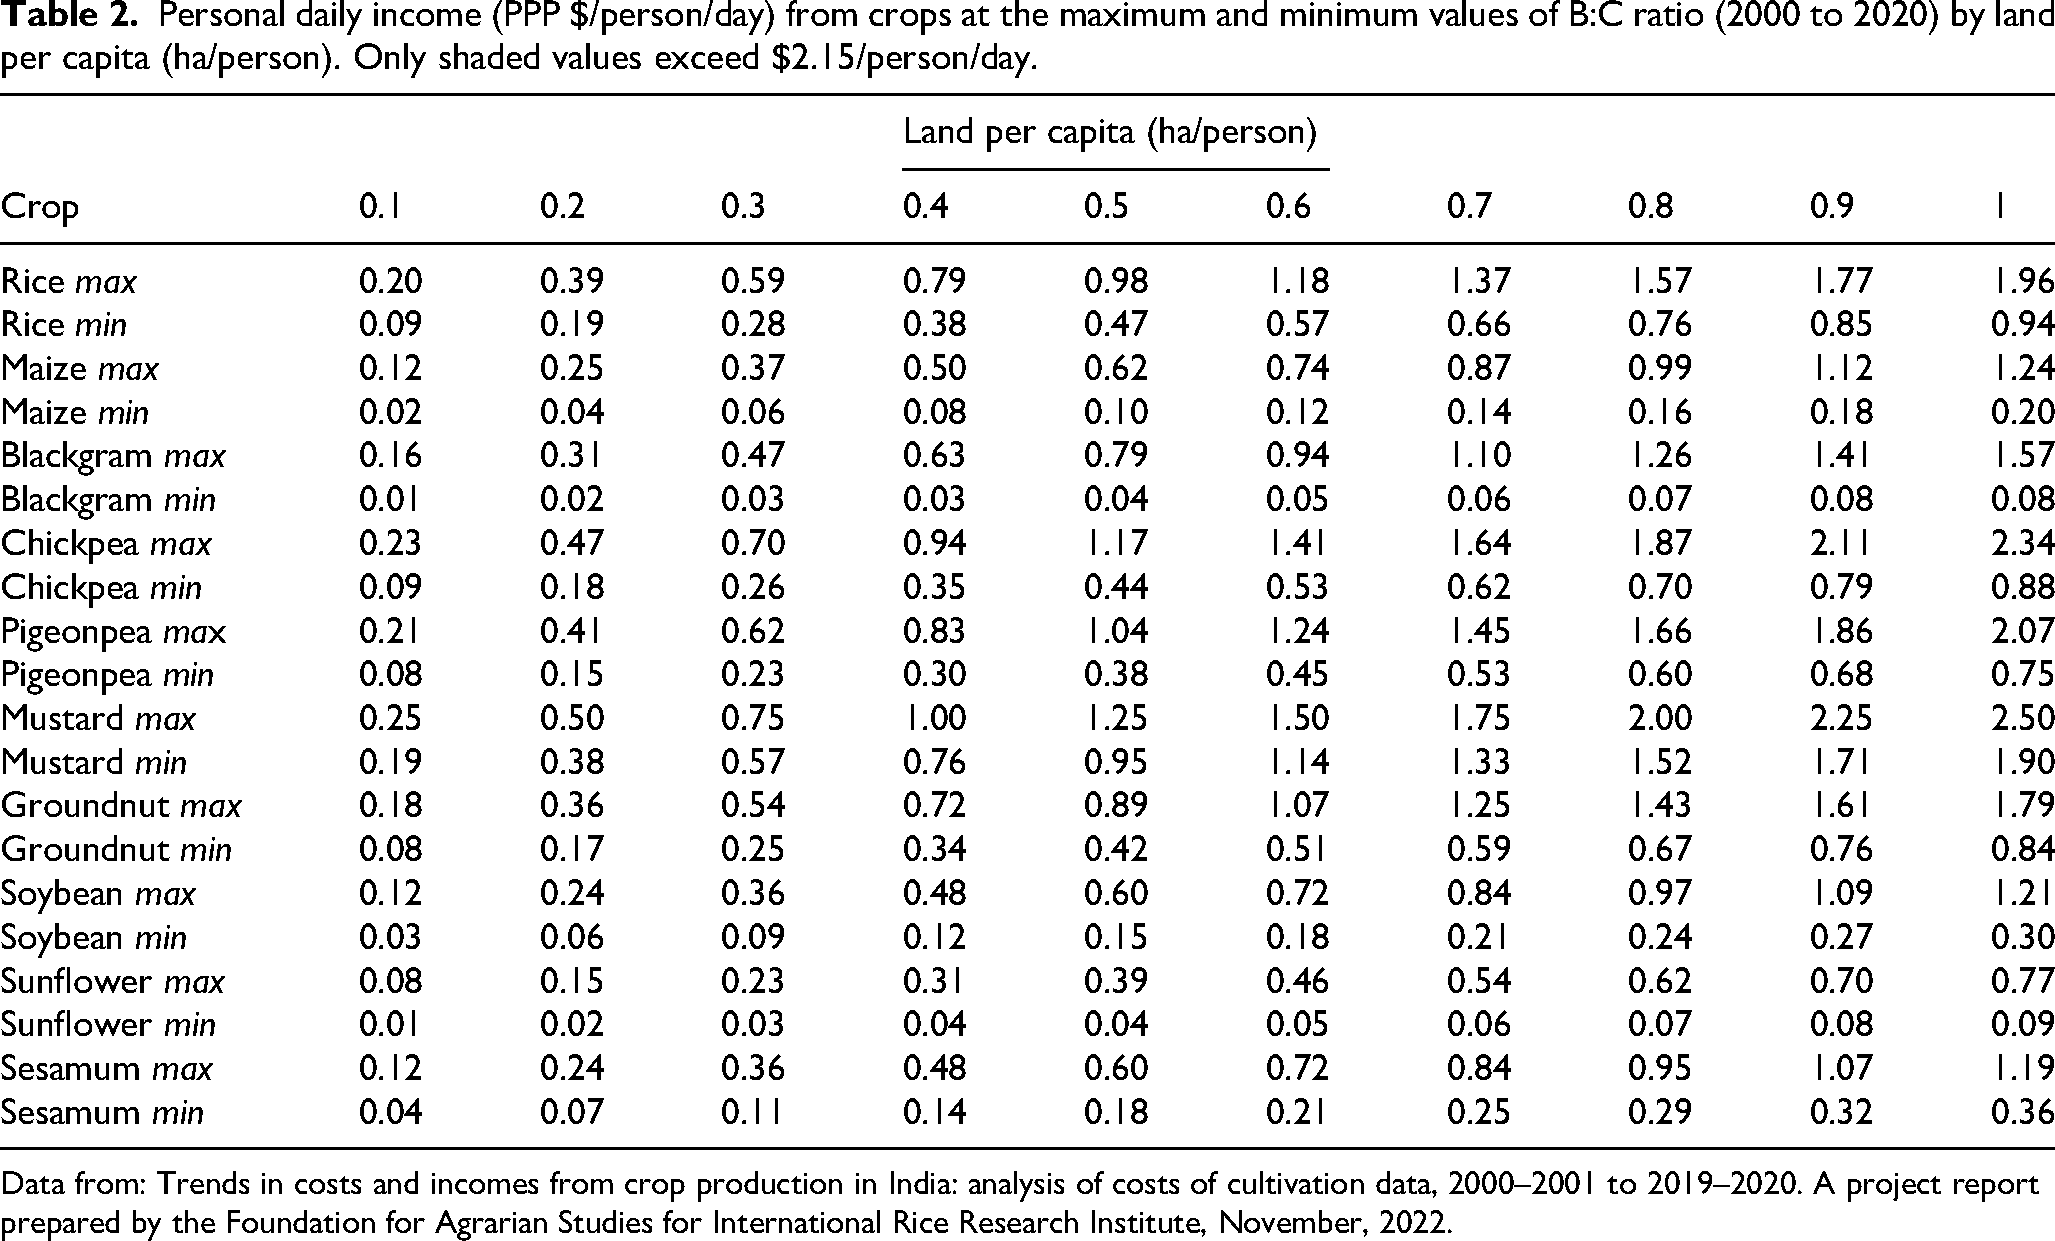
Data from: Trends in costs and incomes from crop production in India: analysis of costs of cultivation data, 2000–2001 to 2019–2020. A project report prepared by the Foundation for Agrarian Studies for International Rice Research Institute, November, 2022.
It would be appropriate to ask if these low levels of profitability and high levels of variability across some of the crops could be resolved by reallocating land and other resources (e.g. irrigation, fertilisers) towards other crops. Variants of this proposal have been advocated based on long-term experimental datasets (e.g. Nayak et al., 2025), and in crop land use optimisation models (e.g. Pal et al., 2023; Wei et al., 2025). These normative assessments however have been superseded by real world assessments from randomised control trials (RCTs) in which for example Lybbert et al. (2024) found that farmers did not consistently switch to pulses even after receiving support. In terms of risk mitigation, there is also evidence from surveys that there is usually positive correlation of farm income sources which reduces the potential of crop diversification as a risk mitigation measure (Gaurav and Mishra 2015).
The values of CPDI calculated (equation (1)) using the profit data from Table 1 are shown in Table 2 for a range of LPC values between 0.1 and 1.0. CPDI values are very small, with only chickpea during the period 2005–2008 (for households with LPC values of 1) and mustard during the period 2008–2011 (for households with 0.9 or more hectares per capita) generating enough income to reach the internationally recognised poverty threshold of $2.15 per person per day. No other crop x household combinations could do this over the range of LPC considered.
In order to determine if findings in Table 2 are applicable to agricultural households in India, we used the data from National Sample Survey (2019) to calculate the distribution of land per capita of 30,719 farming households representative of India in general (Figure 2). The distribution is heavily skewed towards smaller values of LPC, with a median of 0.135 hectares per person and a mean of 0.226 hectares per person. Only 3.1% of households had LPC values greater than 0.9, so the calculations in Table 2 span the appropriate range of LPC in India. Thus, growing any of these ten crops was unlikely to have contributed enough value to cross the $2.15 poverty line for the vast majority of the farming households in the survey and, by implication, in India. Chand et al. (2011) also found that ‘tiny holdings below 0.8ha do not generate enough income to keep a farm family out of poverty despite high productivity. Nearly three-fourths of small farmers in India fall under poverty if they do not get income from non-farm sources’.
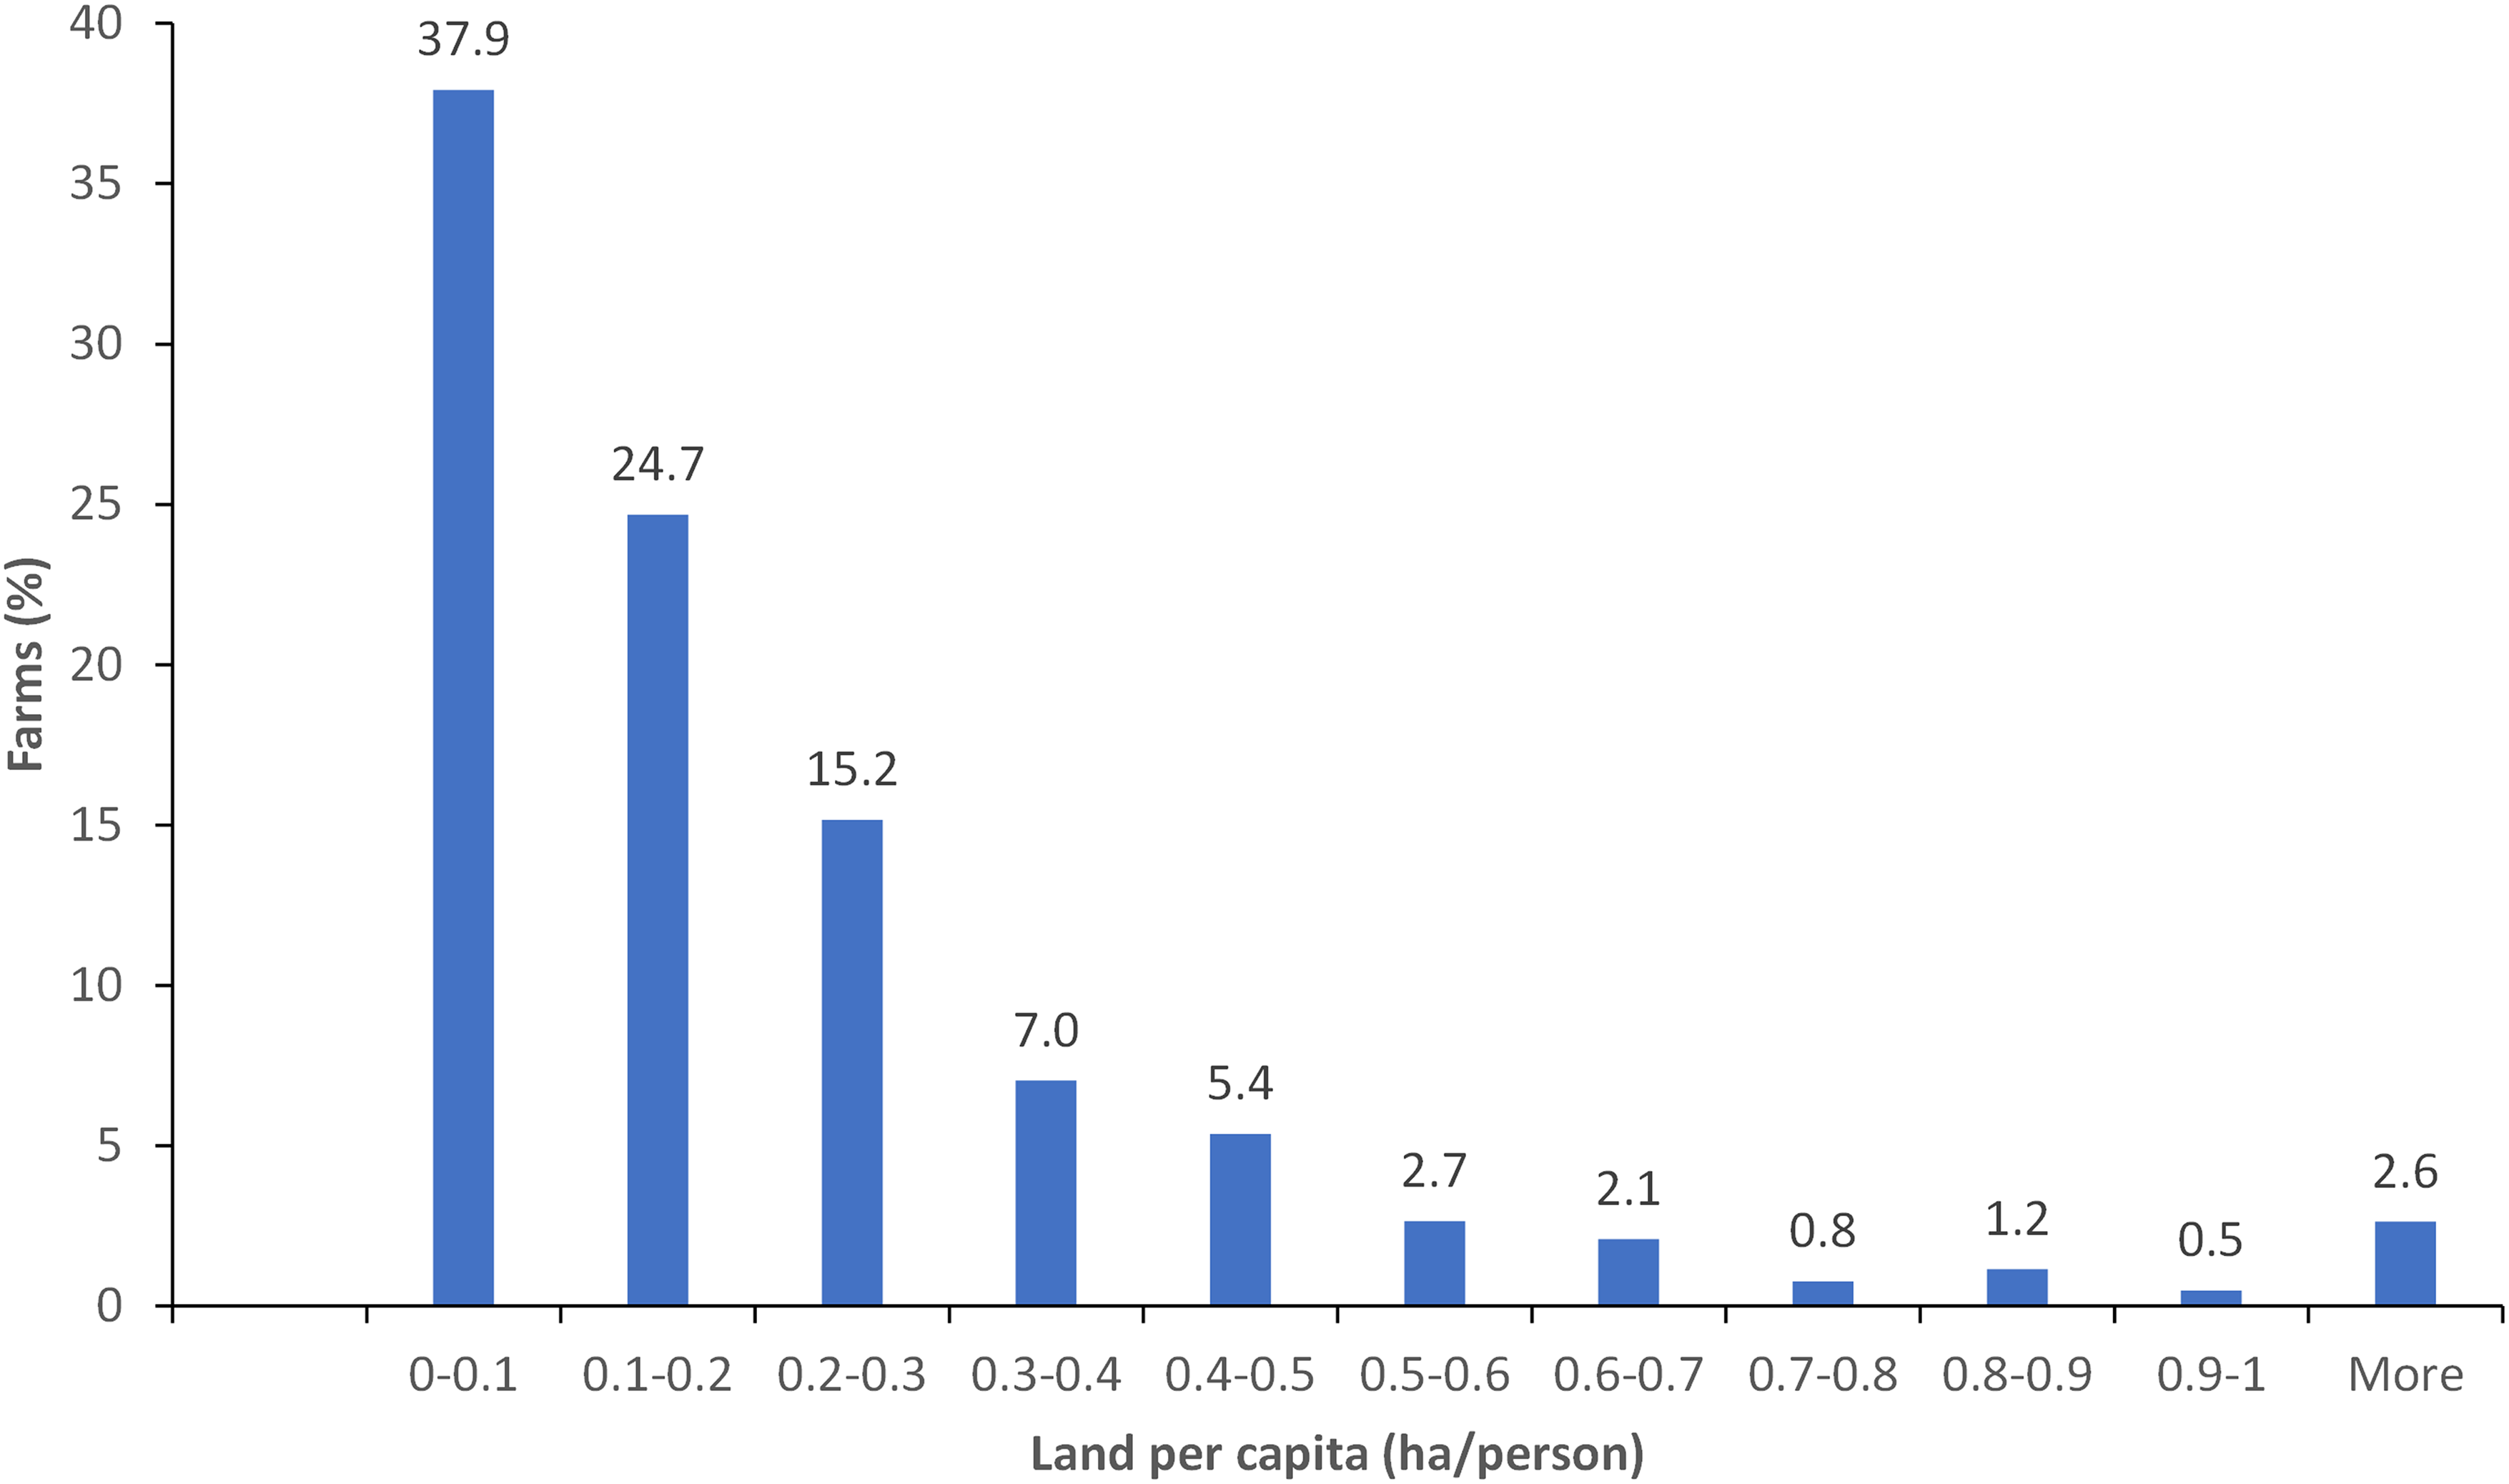
Distribution (%) of land per capita of farming households in India. Values based on utilised land in kharif season, 2019. Data from National Sample Survey (2019). N = 30,719 farming households in 28 States and 8 Union Territories.
However, it is important here to recognise the importance of considering LPC rather than farm size per se. For instance, a household with an LPC value of 0.1 could comprise 10 people farming one ha, 20 people farming two hectares or 30 people farming three hectares, etc. For a crop with a B:C value of 1.7, the investment required per hectare to generate $2.15/p/d would be $11,211 for all three farms but would require $22,421 and $33,632 per household.
Required household investments to generate even a basic level of income
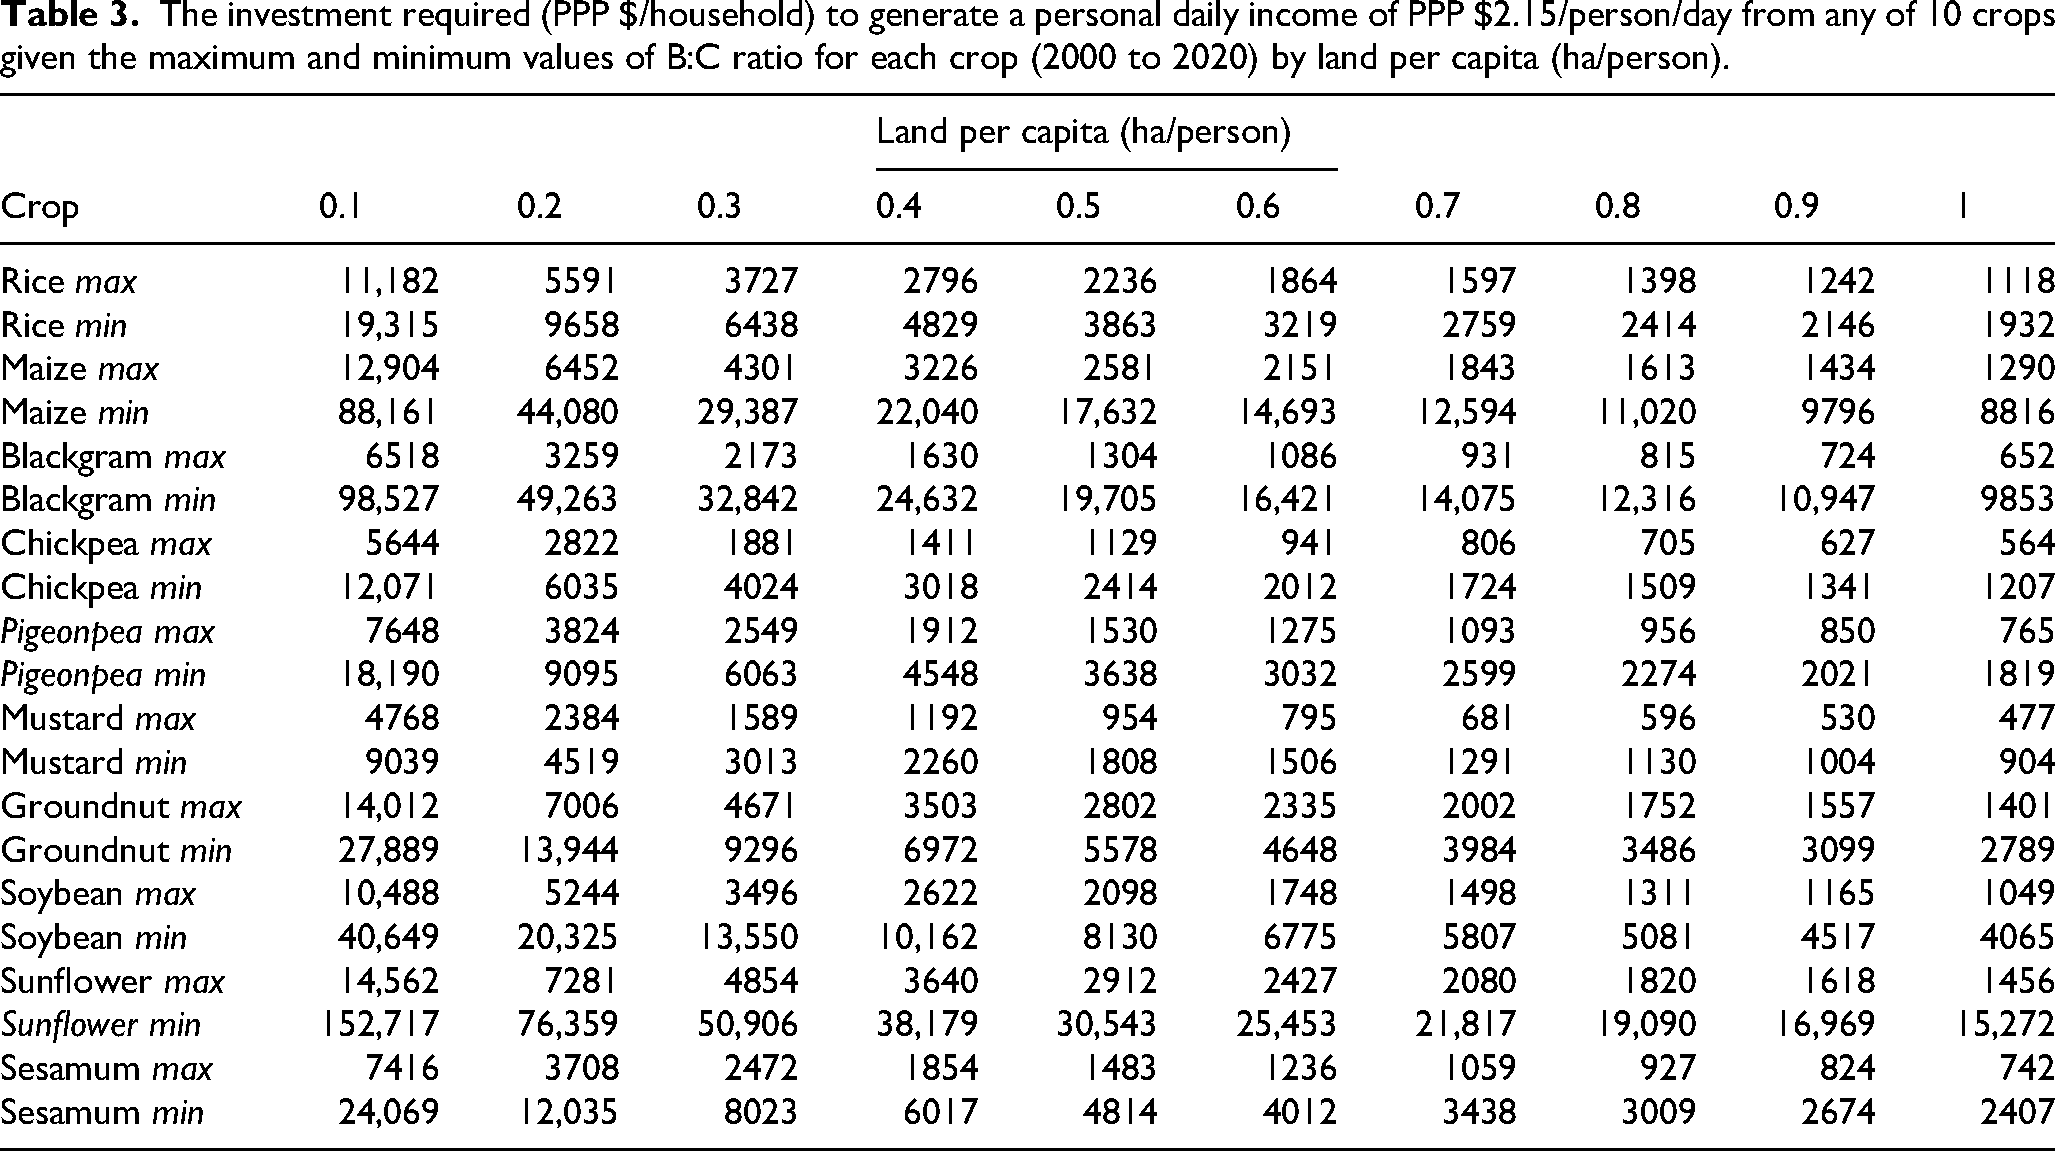
For any given value of B:C ratio, increasing the level of investment should result in a proportional increase in profit. The amounts required for households to generate $2.15 per person per day are shown (calculated using equation (2)) for the ten crops over the range of 0–1 ha per person in Table 3. For most values of LPC the amounts required are very large, particularly at minimum levels of crop performance with small, yet still profitable, B:C ratios and particularly for large households. This is illustrated in Figure 3 for household sizes ranging from 2 to 8. The solid line represents the mean household size, 5.13, calculated from the survey (National Sample Survey, 2019).
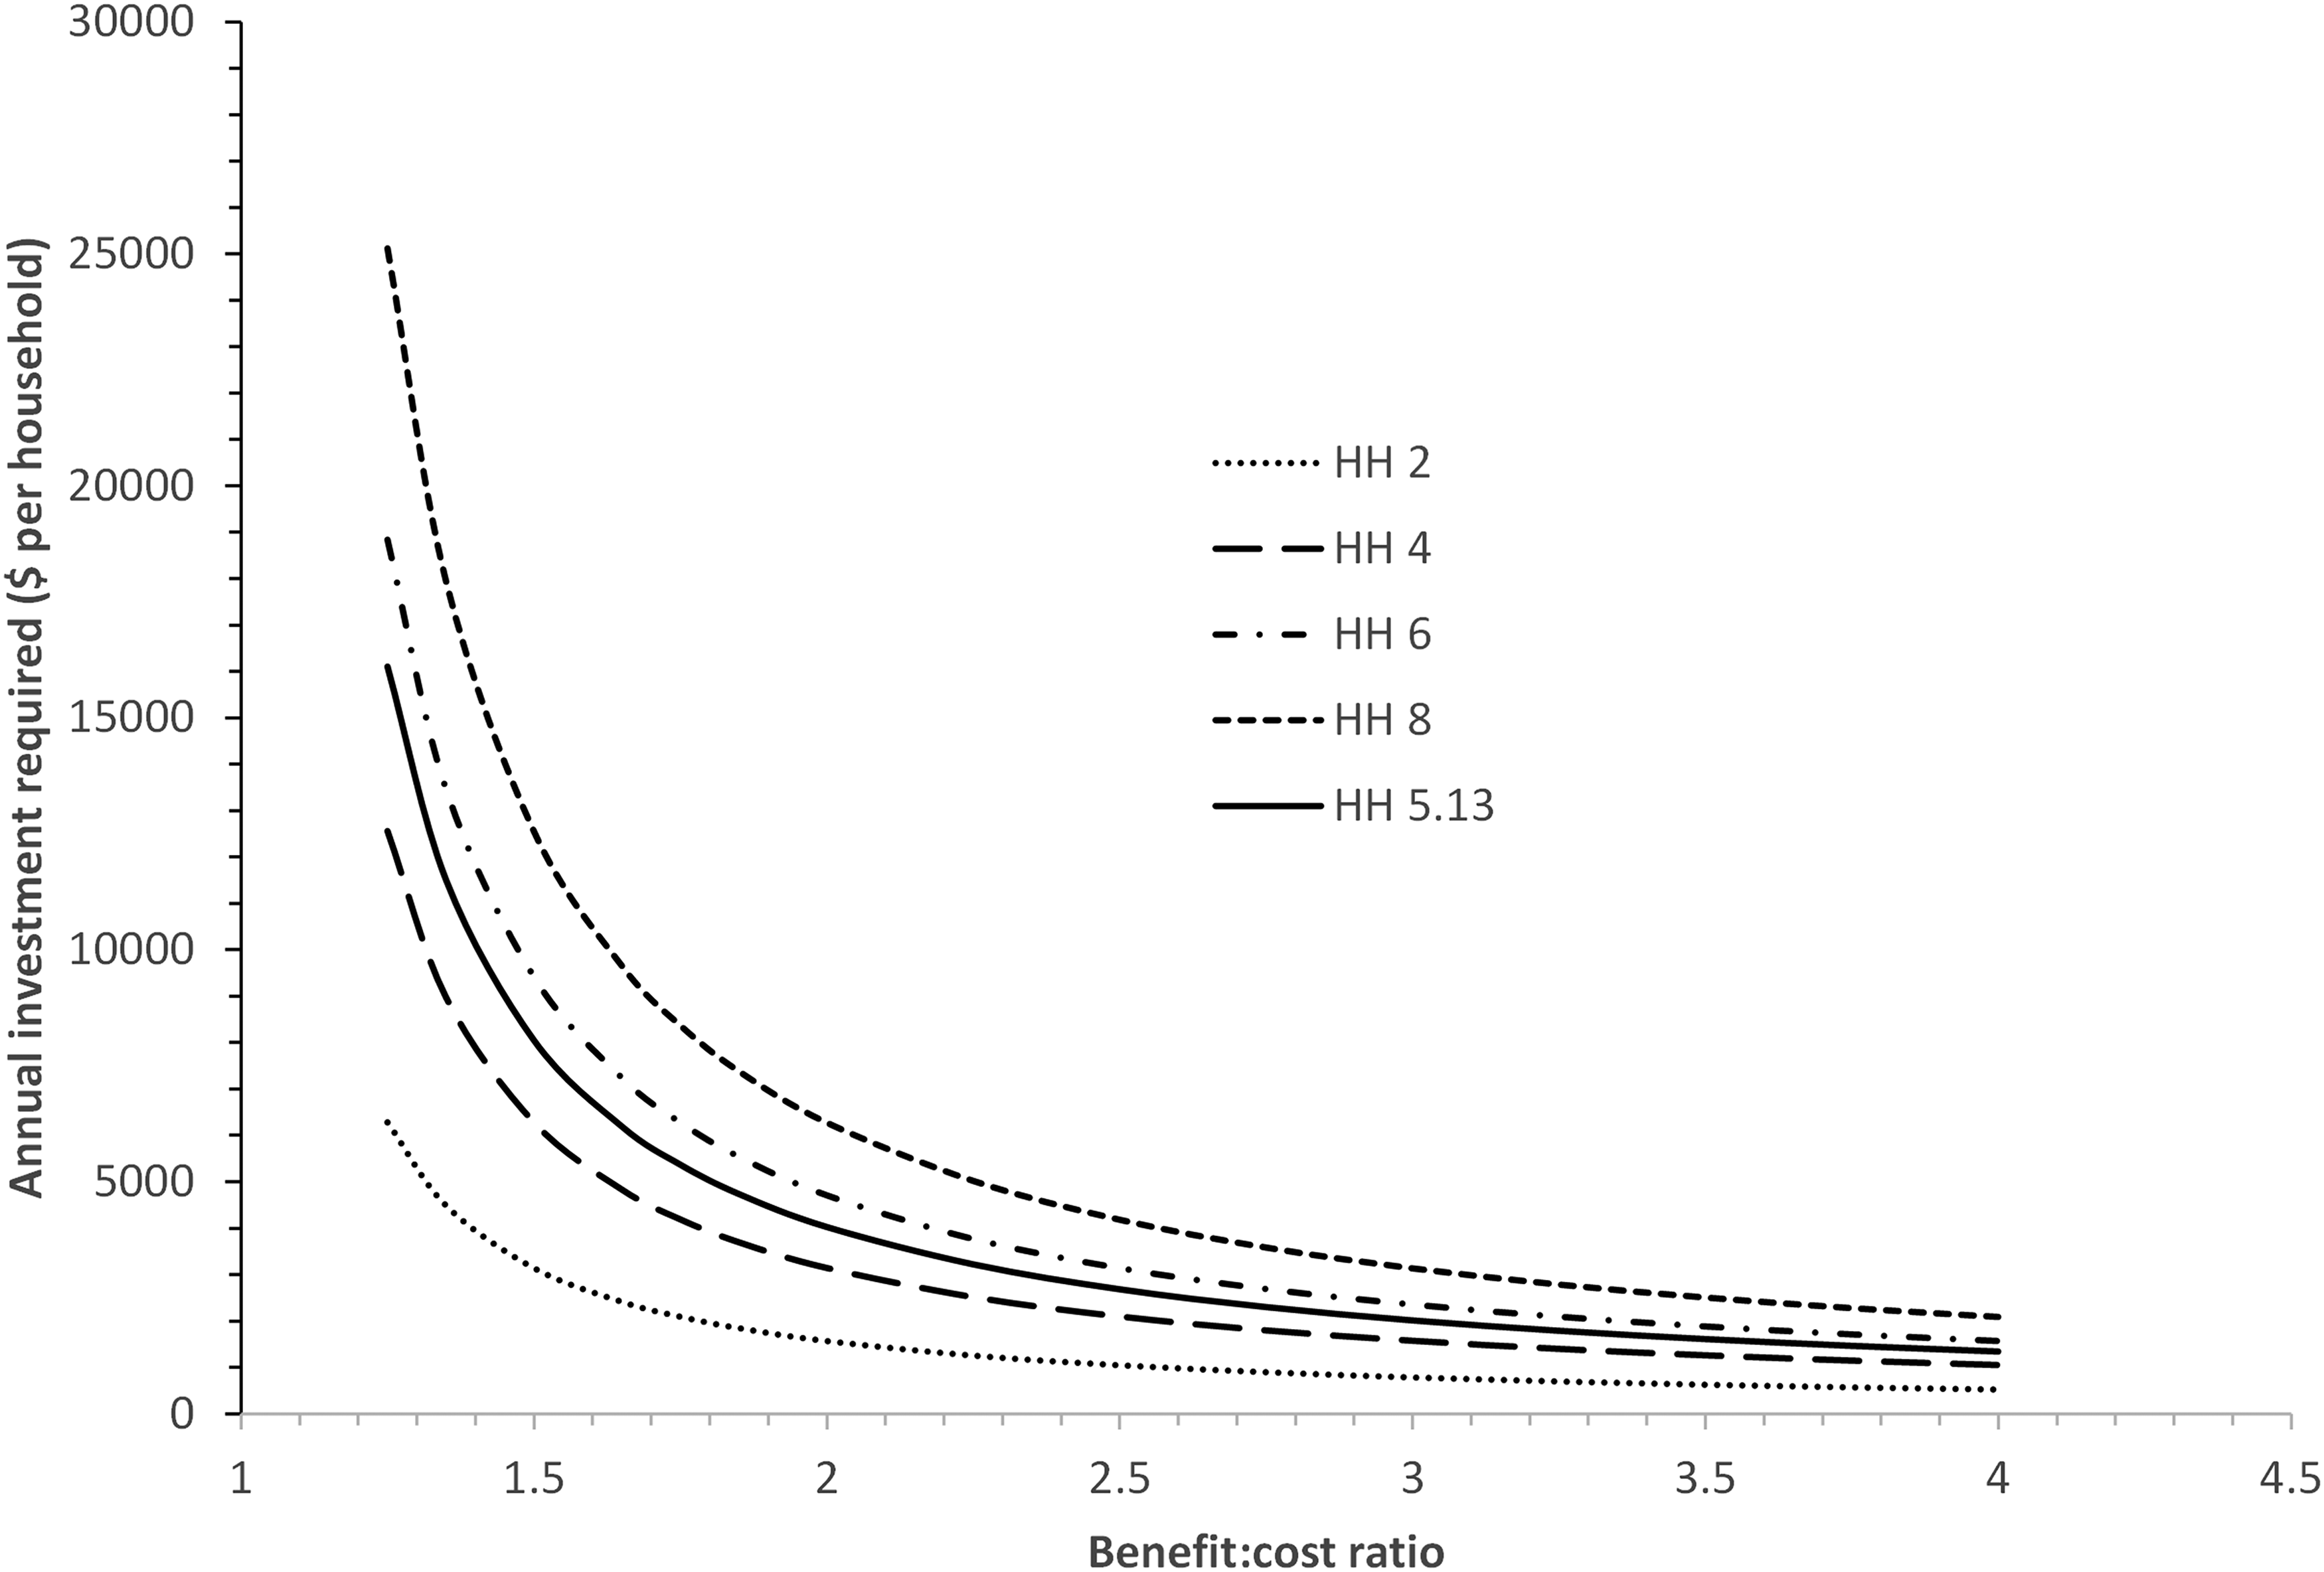
Relation between B:C ratio, household size and the annual investment required to generate $2.15 per person per day from crop production. Mean sample household size = 5.13 (solid line).
The investment required (PPP $/household) to generate a personal daily income of PPP $2.15/person/day from any of 10 crops given the maximum and minimum values of B:C ratio for each crop (2000 to 2020) by land per capita (ha/person).
The costs associated with generating $2.15 per person per day are far larger than the variable costs per hectare for the 10 crops that range from $386 per hectare (blackgram in 2017–2020) to $1165 per hectare (groundnut in 2011–2014), a range that is indicative of the amounts that households may be willing and able to pay. In contrast, a household with the sample mean size of 5.13 would have to invest from $1342 (for an enterprise with B:C = 4) to $16,104 (if B:C were only 1.25). Supplemental Table S3 shows the multiples of current investment required. Investing such large amounts in enterprises that, as we have seen in Figure 1 and Table 1 are inherently unpredictable, is not rational, feasible, or possible for resource-poor households, particularly since production curves are fundamentally asymptotic (i.e. diminishing returns to inputs) and investment beyond a certain point, that is, lavishing very large amounts of resources on small plots, is a waste and would result in large losses. Even modern best-practice cropping technologies with large values of B:C seldom require annual investment of more than $500 per hectare (e.g. Nayak et al., 2022 for maize, one season); $1000 per hectare (e.g. Jat et al., 2014 and Kakraliya et al., 2018 for the two-season rice/wheat system); $1600 (e.g. Kader et al., 2022 and Laik et al., 2014 for the three-season rice/wheat/mungbean system).
Smallholder farmers have two options for increasing their income from crop production – increase the B:C ratio, or increase their value of LPC, that is, operate more land, although these options are not mutually exclusive and can be implemented together in various combinations. Increasing the B:C ratio is possible and there are many improved technologies available to do so. Harris and Orr (2014) listed a range of improved rainfed enterprises with much larger B:C values than those of ‘farmer practice’, with several values above 4. More recent literature abounds with examples of modern crop production technologies with B:C values greater than farmer practice and values of 3 or 4 are commonly reported by researchers (e.g. Singh, 2021 for blackgram; Sharma and Singh, 2024 for chickpea; Tripathy et al., 2023 for mustard and chickpea; Singh et al., 2020 for sesamum; Sandhya and Singh, 2023 for sunflower). Since B:C values in Table 1 range from only 1.08 to 2.65 there would seem to be considerable additional benefit for farm households if they adopted best practices. However, it should be noted that we do not know the proportion of the values calculated in this paper from Johnson and Singh (2022) that represent ‘farmer practice’ rather than reflecting some degree of adoption of ‘improved practice’. The amount of ‘improvement’ over the situation summarised in Tables 1 and 2 that is possible, therefore, is uncertain. There is however a dearth of studies that estimate not only yield gaps but also profit gaps that can help to demonstrate the possibilities (e.g. Manjunatha et al., 2013).
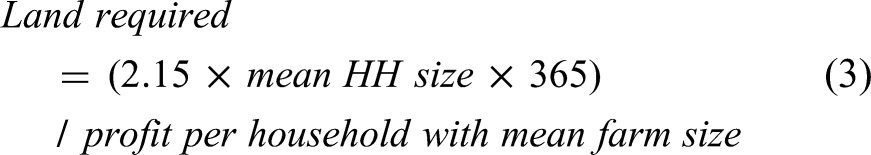
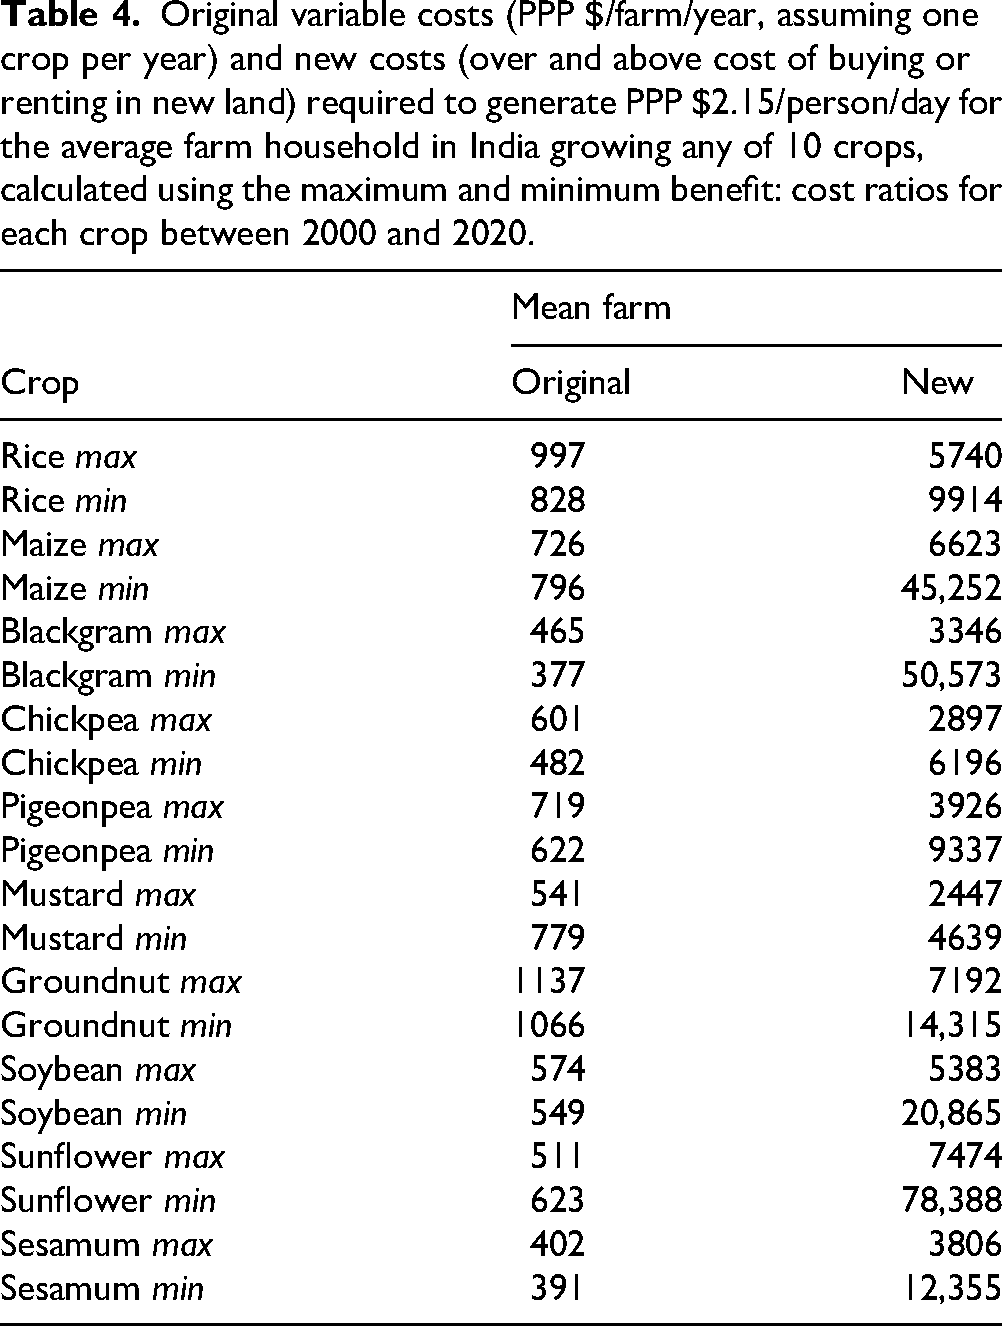
If adopting best practices and pouring huge amounts of resources into cultivating small pieces of land makes little sense, could smallholder households increase their incomes meaningfully from crop production by operating more land? Figure 4 shows, for the mean (0.98 ha, 5.13 people) household, the farm size (calculated using equation (3)) that would be required to generate $2.15 per person per day by growing each of the 10 crops with minimum and maximum profitability. All cases would require substantial investment (not estimated here) in renting in or buying additional land. In addition to that investment to gain access to extra land, growing those crops on the larger farms would require scaled-up variable costs to achieve the same pro-rata outputs. Table 4 shows how much that extra investment would be for the mean household.
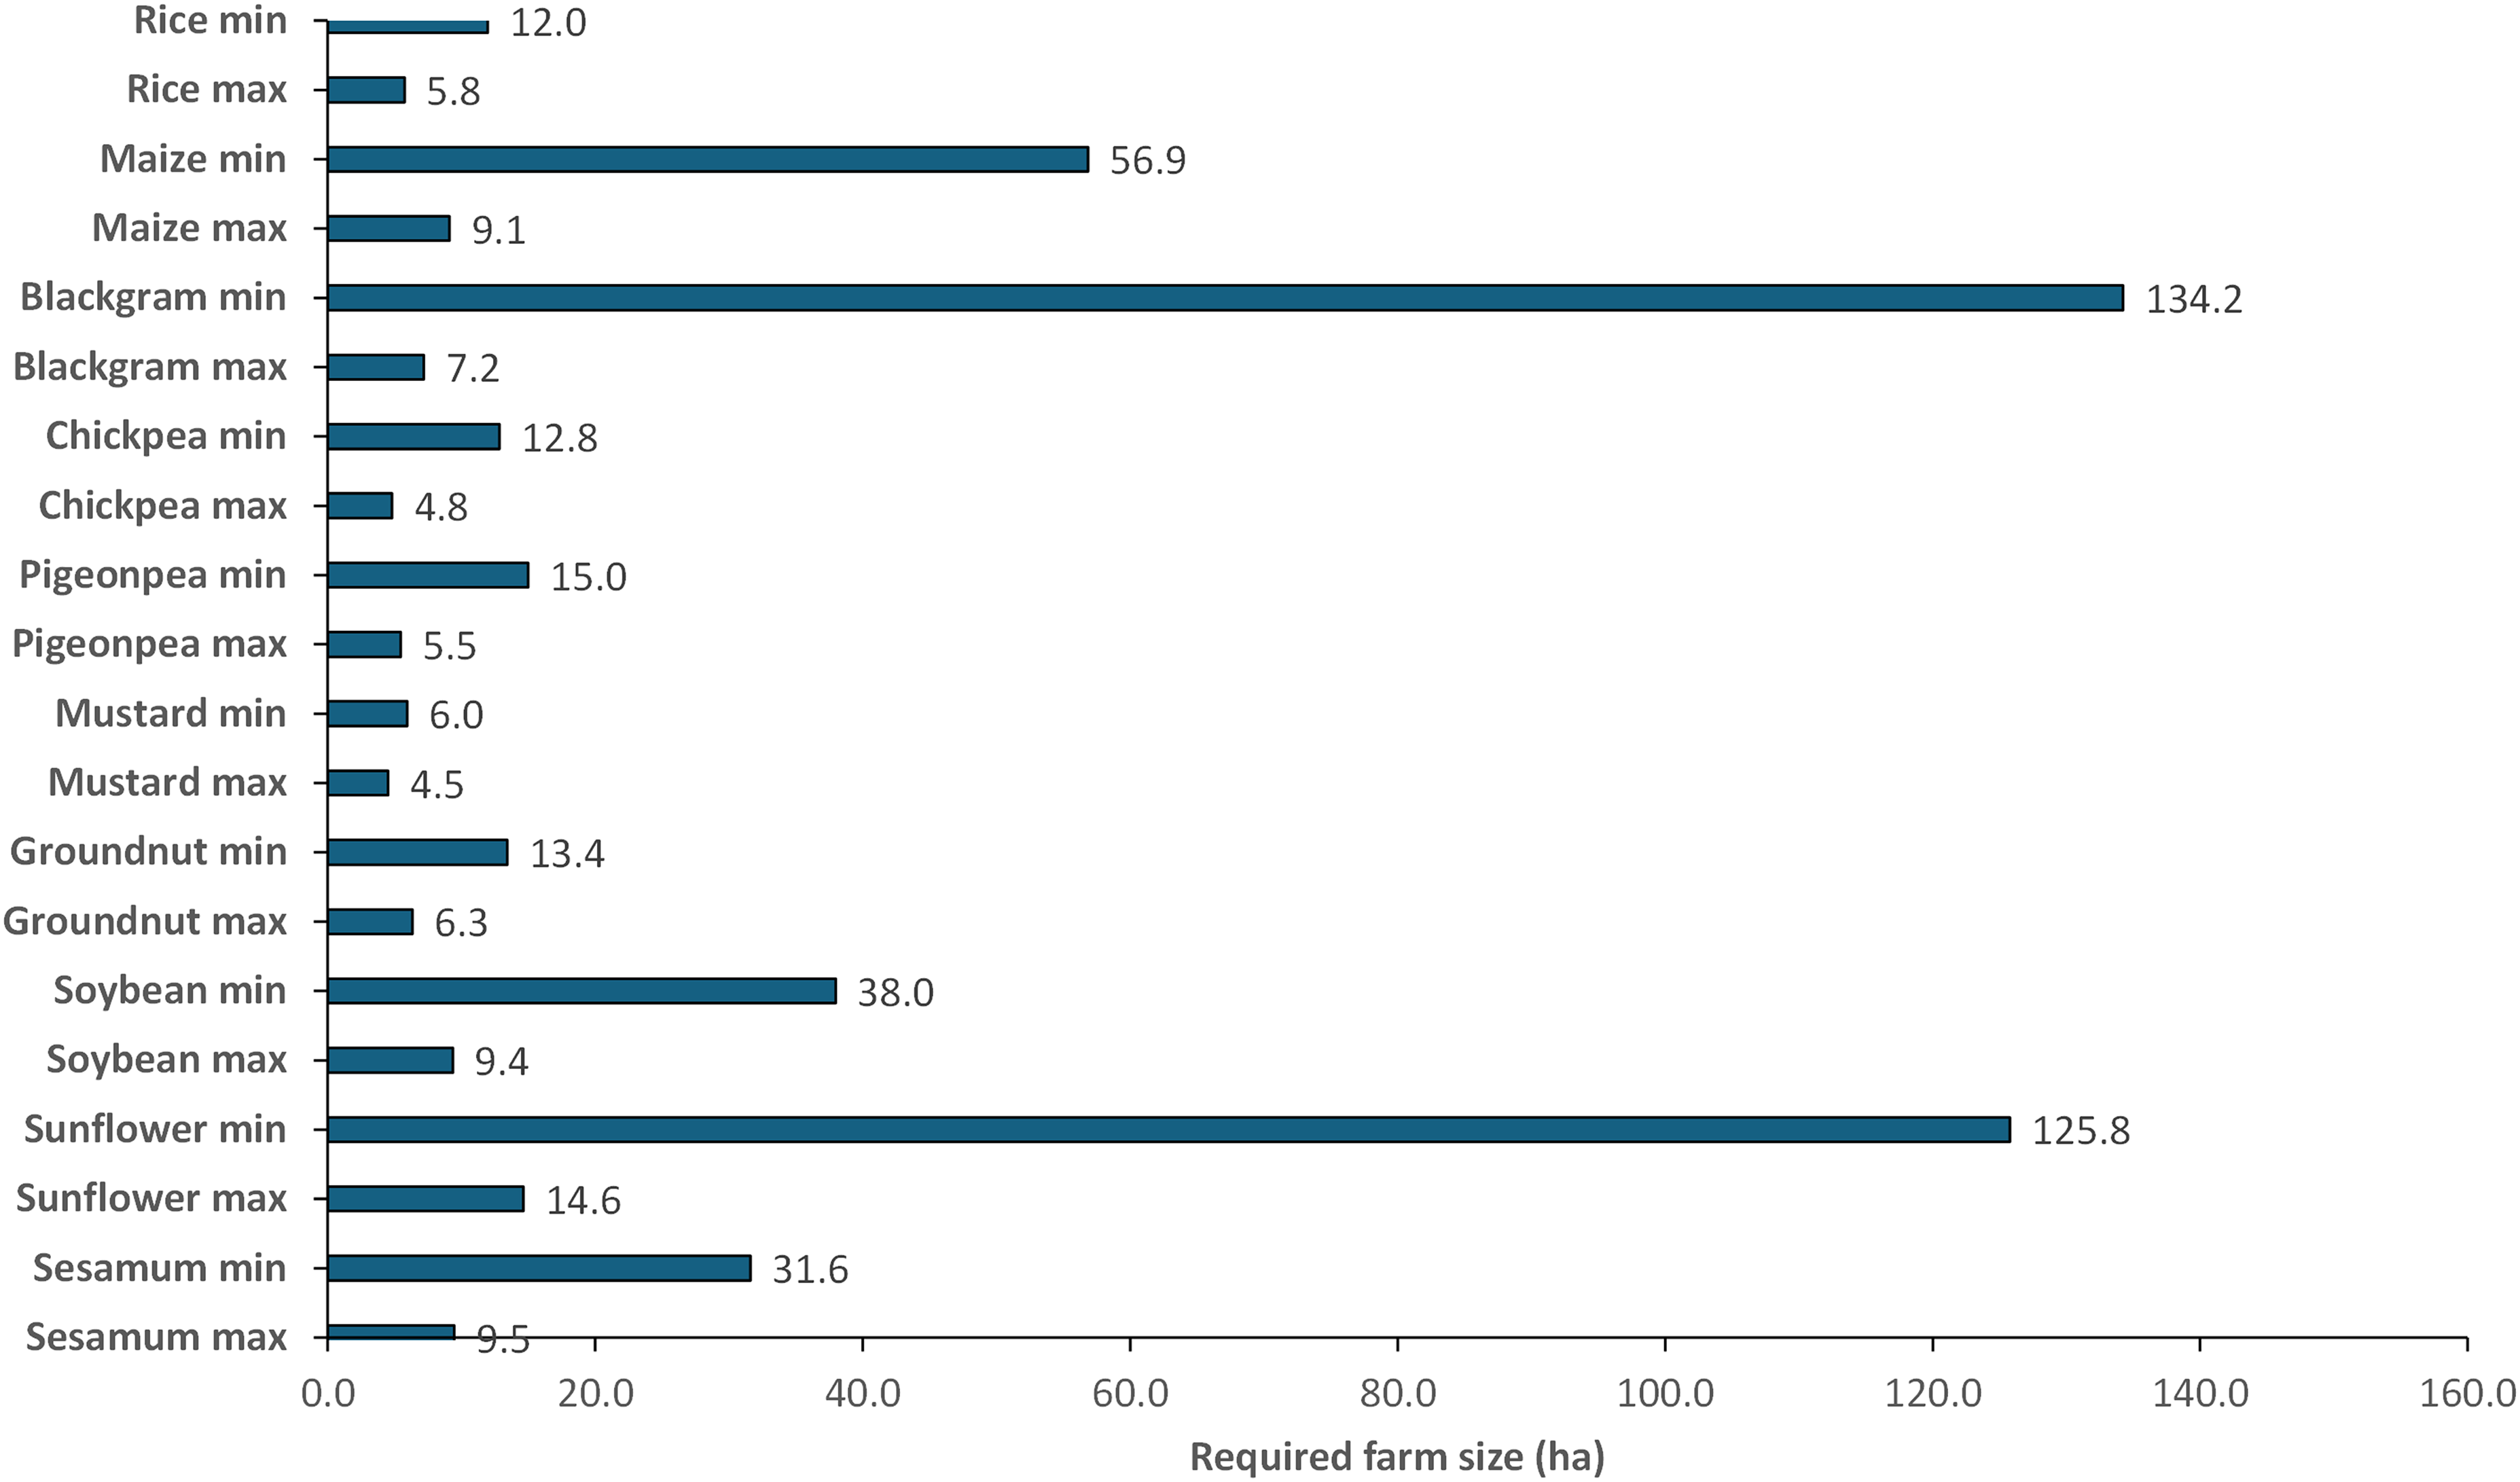
Farm size (ha) required by the sample mean household (5.15 people, 0.98 ha) to generate a personal daily income of PPP $2.15/person/day from 10 crops given the maximum and minimum values of B:C ratio for each crop over the period 2000 to 2020 in India.
Original variable costs (PPP $/farm/year, assuming one crop per year) and new costs (over and above cost of buying or renting in new land) required to generate PPP $2.15/person/day for the average farm household in India growing any of 10 crops, calculated using the maximum and minimum benefit: cost ratios for each crop between 2000 and 2020.
Limitations and future research
There are limitations to the analytical approach we have taken in this paper. Mean and median values can obscure the best performances (but also the worst ones) and there may have been a significant proportion of farm households that grew these crops more profitably than we have indicated here. Nevertheless, our results clearly indicate that production of these commonly grown crops, when grown in only one season per year, alone cannot make most farming households in India prosperous. This is illustrated in Figure 5 where the annual crop profitability required to generate $2.15 per person per day is shown as a function of LPC, together with the percent distribution of LPC in India (from Figure 2). Farms with LPC values of 0.1 or less (39% of the total) would need to make annual profits of almost $8000 per hectare, and even those with LPC values of 0.8 have a profit requirement per hectare greater than the most profitable case in Table 1 (Mustard max, 2008–2011).
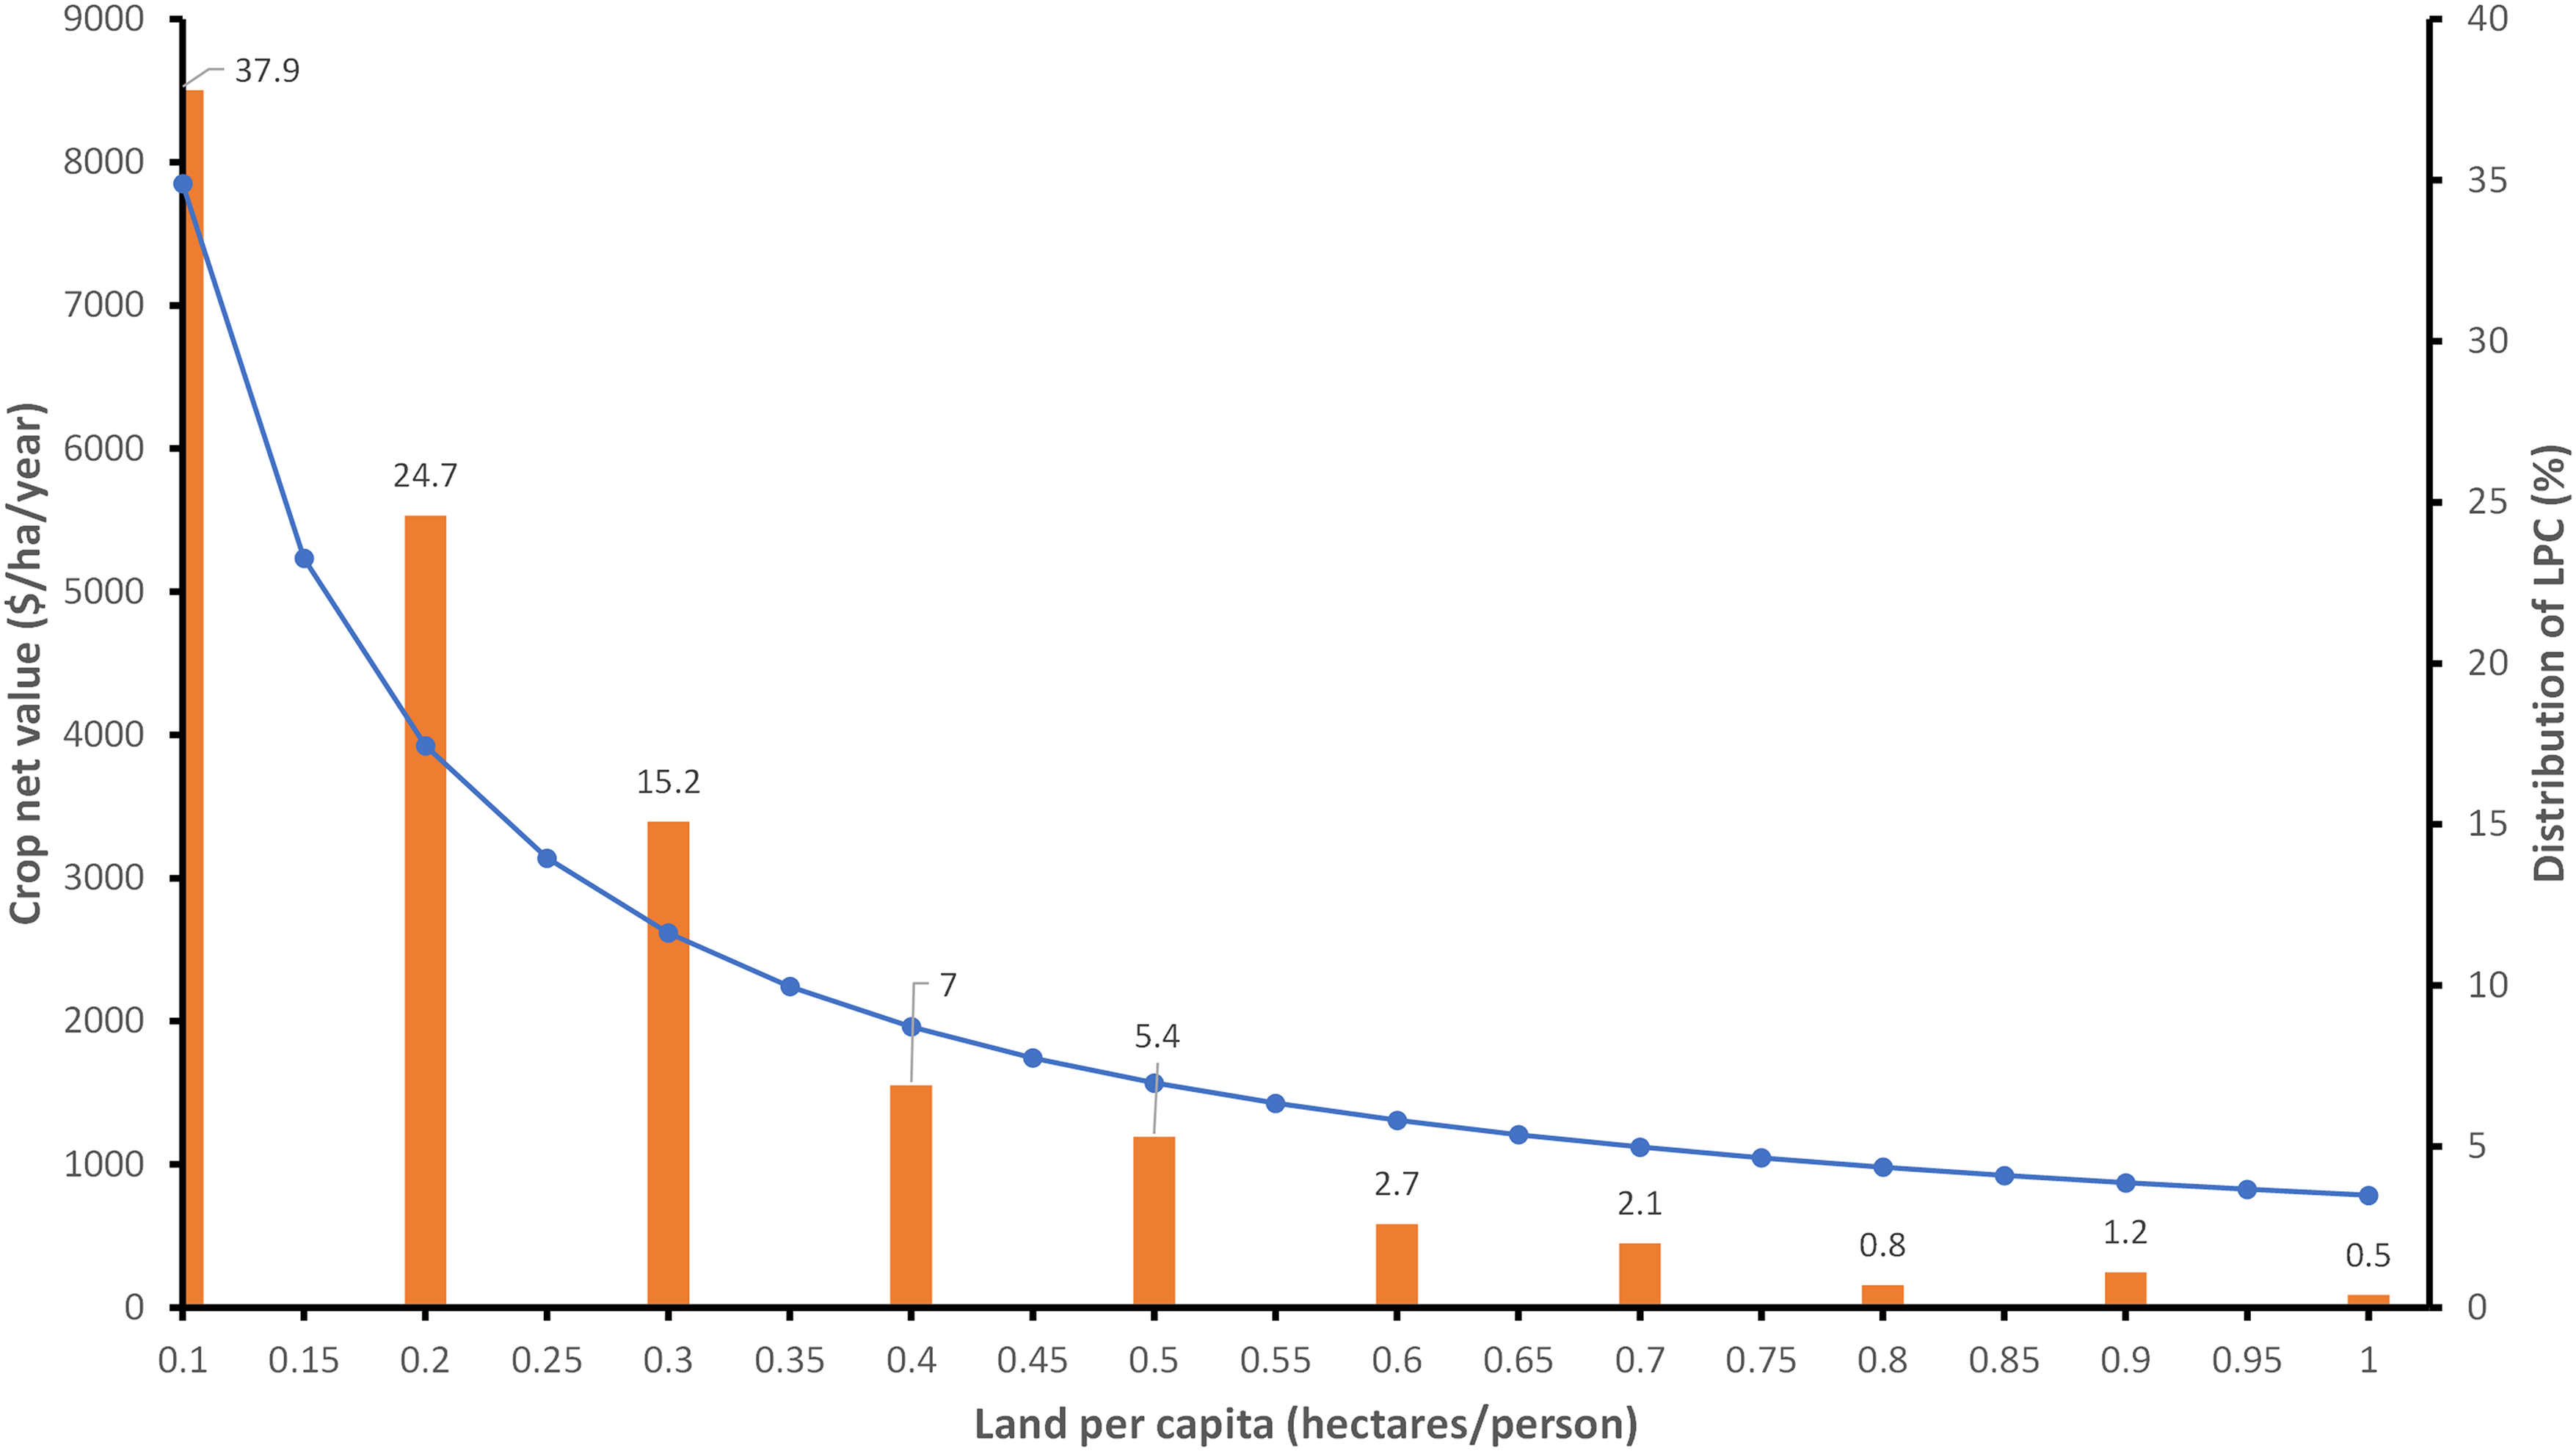
Minimum crop net value per hectare per year (line) required to generate a personal daily income of $2.15 per person per day, as a function of land per capita. Bars represent the percentage distribution of LPC in Indian farm households.
Of course, 56% of Indian agricultural land is irrigated, the country has a cropping intensity of 156% (GOI, 2025) and so double- and even triple cropping are common. Where it is possible, sequential cropping increases annual gross output and profit per hectare, so the situation shown in Figure 5 would be improved. The implications of sequential cropping for smallholder farming households need to be considered and we do so in a subsequent paper.
Smallholder rural households do not confine themselves to the production of staple crops but commonly keep small and large livestock and operate home gardens. Although these clearly contribute to household income, dietary diversity, etc., any land-based enterprise is still subject to the limitations shown in Figure 5. It is also widely recognised that rural households do not base their livelihoods solely on farming (Rao and Charyulu, 2007; Sen, 2003) and may rely heavily on off-farm income. We suggest that in-depth studies of whole farms and whole households are required to understand the drivers of investment choice, the trade-offs that may be necessary, and how that shapes rural development.
Conclusions
Agricultural production is an intrinsically biological phenomenon in which inherently variable natural processes interact in complex ways with farm management and the environment but also with market factors to influence the pattern of production and so, ultimately, income (Pardey et al., 2014).
In this paper we have considered the temporal variation in profitability of individual crops and its consequences for the incomes of smallholder farmers in India. We have shown that, for the majority of farming households in India, low values of land per capita limit the absolute values of personal daily income that can be derived from crop production even if they were able to adopt best-practice technologies for any of the ten crops considered here.
Most farms are too small (and/or have to support too many household members) to generate even modest per capita incomes from crop production alone. Using even such a modest target CPDI of $2.15 – by no means a prosperous ambition – the large amounts of extra land and the correspondingly high additional variable costs required are unfeasibly high, beyond the means of most farm households, and carry unreasonable risks and uncertainties. Thus they represent a sub-optimal base for achieving widespread sustainable agricultural development in support of global goals of food security and environmental stewardship.
While it is widely known that crop production varies from season to season and from year to year, such variation is only apparent in retrospect and is impossible to predict in advance, that is, when choosing and planting a crop, and so there is a high degree of uncertainty concerning the likely returns on investment at the beginning of every cropping enterprise. Such uncertainty could be a major factor in the reluctance of smallholder households to adopt new technologies that may carry additional risks and so add to uncertainty.
Without additional income from local off-farm employment, from work on other people's farms, migration, remittances or businesses; smallholder farm households will struggle to cross ultra poverty lines even if they adopt best cropping practices. There is evidence however, that many, perhaps most, such rural households have income sources in addition to crop production (Birthal, 2025; Michler, 2020), including the rearing of small- and large livestock, which is widespread (although it should be noted that its income generation potential is dependent, directly or indirectly, on land area) and so generates similar low returns for smallholders (Attanasio and Augsburg, 2017; Gehrke and Grimm, 2018).
As we noted earlier, growing two- and three crops a year is common in India, particularly where supplementary irrigation is available. In theory, this should approximately double- or triple cropping income as it effectively doubles or triples values of land per capita per year. We consider the potential effect of multiple cropping on per capita incomes in a second paper in which we show that it alleviates the problem to some extent, but that growing additional crops requires additional investment that may be difficult for resource-poor households.
The limited potential for crop production to generate much income for households with small values of LPC, that is, most farmers in India, does not preclude the adoption of best practices designed to maximise yields (and minimise environmental degradation) but it does necessitate such households striking what they consider to be their best balance between pursuing on- and off-farm opportunities, and migration (Madhok et al., 2025). The details and drivers of such decision-making at individual- and household levels are not readily transparent as they are influenced by people's aspirations, ambitions and ever-changing circumstances and opportunities (Mausch and Harris, 2025).
This all poses a difficult challenge for policymakers who also have to strike a balance between supporting agriculture and other sectors of the economy. One obvious policy lever, given the preponderance of small-LPC farms in India, is land reform to enable the formation of larger farms as countries elsewhere in the world have done. However, land consolidation requires many people to give up farming and sell or rent out their land. Foster and Rosenzweig (2022) estimated that to maximise return per unit of land, the number of farms in India would have to be reduced by 82% and income per farm worker would rise by 68%. Without a corresponding increase in alternative employment that is unlikely to happen, although a coordinated multi-sectoral policy approach would, perhaps, increase the chance of success. However, the importance of agriculture for the economy and society is more than its contribution to income and poverty reduction (Chand, 2025). For example, farms are where people ‘come from’, call home and provide a refuge in times of trouble or hardship (Srivastava, 2020).
Small farms function as valuable components of an enduring social and economic system but require policy support that goes beyond own production to other facets of diversified rural livelihoods.
Supplemental Material
sj-docx-1-oag-10.1177_00307270261419516 - Supplemental material for Land per capita, year-to-year variability and uncertainty of return on investment affect household income from crop production: Evidence from India
Supplemental material, sj-docx-1-oag-10.1177_00307270261419516 for Land per capita, year-to-year variability and uncertainty of return on investment affect household income from crop production: Evidence from India by David Harris and Maxwell Mkondiwa in Outlook on Agriculture
Footnotes
Acknowledgements
Maxwell Mkondiwa acknowledges support from Sustainable Farming and Policy Innovations science programs of the CGIAR.
Funding
The authors received no financial support for the research, authorship, and/or publication of this article.
Declaration of conflicting interests
The authors declared no potential conflicts of interest with respect to the research, authorship, and/or publication of this article.
Supplemental material
Supplemental material for this article is available online.
References
Supplementary Material
Please find the following supplemental material available below.
For Open Access articles published under a Creative Commons License, all supplemental material carries the same license as the article it is associated with.
For non-Open Access articles published, all supplemental material carries a non-exclusive license, and permission requests for re-use of supplemental material or any part of supplemental material shall be sent directly to the copyright owner as specified in the copyright notice associated with the article.