
Abstract
Making a living from a small farm is difficult in sub-Saharan Africa. In this paper, we quantify how difficult, using a simple, robust, relation between per capita daily income from farming (FPDI), land per capita and whole-farm net profitability per hectare. This relation allows the calculation of the land area required to generate various levels of household income as a function of farm performance. We use nationally representative household data for Tanzania to investigate the range of whole-farm profitability and to estimate an upper limit for it. For 6818 cases where households with land reported figures for gross crop and livestock revenues and for costs in any of the three years 2009, 2011 or 2013, actual median whole-farm net profitability was only $454/ha/y even without including the opportunity cost of family labour. When those were considered, median net profitability was negative $238/ha/y, i.e. a net loss. The maximum whole-farm profitability achieved was $4485/ha/y without family labour costs and $2742/ha/y with it. We evaluated actual and potential farm performance for their ability to generate a range of values of FPDI up to $10 per person per day. Most farms are not very profitable, particularly when household labour costs are considered, and few would be considered economically prosperous. Our analysis underscores the fact that improving their operations or adopting new technologies alone is unlikely to lift many smallholder farmers out of poverty in developing countries, given typical farm size distributions and reasonable assumptions about the realized economic returns to adoption of currently available agricultural technologies. While continued agricultural R&D investments are certainly worthwhile, such efforts alone will be insufficient to meaningfully address welfare needs of the world's rural poor. This suggests that agricultural development programs should expand their attention to incorporate off-farm and non-farm components of the rural economy.
Keywords
Introduction
The world's farmers must produce more food to meet the demands of a growing population and they must do so sustainably, i.e. while maintaining or reducing their impact on the environment (United Nations, 2015). In addition, the world's small-scale farmers must be enabled to sustainably intensify their agriculture, with the additional objective of lifting themselves out of poverty. The implied pathway for this is a shift away from a low-input/low-output subsistence orientation to a greater integration with input and output markets. Increasing commercialization will require productivity gains, generally involving the adoption of improved agricultural technologies. Such adoption will only take place if technologies are available, profitable and acceptable to resource-poor rural households that are often risk-averse (Liverpool-Tasie et al., 2017; Yohannes et al., 2023) and may not, for a variety of reasons, be solely focused on farming (Verkaart et al., 2017, 2018).
Progress in sustainable intensification is especially critical – and particularly difficult – for sub-Saharan Africa (SSA), where both yield gaps (Van Ittersum et al., 2016) and rural poverty levels (UNDP, 2022) remain high. There are very many individual crop (Chivenge et al., 2021; Harris and Orr, 2014) and livestock (Otte et al., 2012) innovations currently available that have proven to be very effective in increasing yields and profitability per hectare. However, the adoption of these has not been widespread amongst smallholder farmers (Arslan et al., 2022; Stevenson et al., 2019; Westermann et al., 2018) although several have been adopted by reasonable shares, perhaps 30%, of the target population (Walker and Alwang, 2015). Low profitability and risky returns are often cited for low adoption rates (e.g. Holden, 2018; Liverpool-Tasie et al., 2017). However, most impact evaluations focus on single technologies, while neglecting the returns to other parts of smallholder production and ignoring any potential synergies resulting from combinations of, for example, cereals, legumes and livestock (Asante et al., 2020; Lemaire et al., 2014). Similarly, tradeoffs necessitated by adopting new technologies are seldom assessed in the context of whole-farm profitability (see, for example, the debate around using stover as mulch instead of fodder; Baudron et al., 2012; Corbeels et al., 2014)
We argue that what matters in the ‘real world’ is the whole-farm profitability, i.e. the net revenue from the range of agricultural production activities (including both crop and livestock) pursued on the farm, as this is the basis for defining the per capita and total household income accruing from agriculture. We have very little idea of current whole-farm profitability values in developing countries, nor do we have good estimates of the range of whole-farm profitability values that are possible following adoption of optimized combinations of best practices, i.e. the upper bounds of what farms can earn per hectare under optimal management.
Even large percentage increases in profitability per hectare do not generate much value in absolute terms on a small farm (Harris, 2019; Harris and Orr, 2014). Given that there are around 470 million farms of two hectares or less in the world (Lowder et al., 2016, 2021), this is a stark proposition. In the absence of whole-farm data, Harris and Orr (2014) asked the question ‘Is rainfed crop production a pathway out of poverty?’ and concluded that, for households with very small farms, it was not. They surveyed the literature regarding the net income from 69 cases in which ‘improved’ rainfed crop production technologies designed to increase yields were compared with farmers’ practice and noted that many of these ‘best bet’ technologies increased profit by large percentages, but from an often-low base. Their analysis had an important limitation which was the necessary reliance for data on studies limited to the influence of particular technologies on the performance of individual crops, rather than the combinations of various crops and livestock more characteristic of a ‘real-world’ farm. While data on whole-farm profitability is ostensibly available in comprehensive farm surveys, such as the World Bank's Living Standards Measurement Surveys (Carletto and Gourlay, 2019), analysis of such measures is relatively scarce. 1
In this paper, we use nationally representative household survey data for Tanzania from the Living Standards Measurement Study (LSMS)-ISA project 2 to calculate individual whole-farm profitability values that, in turn, are combined with household land per capita (LPC) ratios to enable the calculation of the amount of daily income per person generated from farming. We show that most farms are not generating sufficient income to be considered very profitable, particularly when household labour costs are considered, and that very few are generating incomes that would be considered economically prosperous. We also calculate the amount of additional land, and the cost of renting it at currently observed rental rates, that would be required for households to meet a reasonable set of income targets. We employ a number of assumptions, including that farmers wish to, and are able to, optimally manage currently available technology, and that land is available for expansion at current median rental prices.
Our results indicate that, given the technologies available now or in the near future, the scope for broad welfare gains from agricultural intensification appears very limited. This suggests that large-scale strategic investments and programming should not ignore the role of the non-farm economy (e.g. Davis et al., 2009) in conditioning the adoption and impacts of technological innovations in small holder-dominated farming systems. We expand upon these points in our concluding remarks.
Methods and data
We recognise the uncertainties and inaccuracies associated with data collected from household surveys (Fraval et al., 2019; Tasciotti and Wagner, 2018; Wollburg et al., 2021). Nevertheless, the World Bank's LSMS is regarded as the de facto standard public database for analysis at the household level (https://www.worldbank.org/en/programs/lsms/initiatives/lsms-ISA#7).
In order to determine the actual levels of whole-farm profitability for rural households, and what might be realistic upper bounds for potential profitability, we used data on costs and revenues for crops and livestock from three rounds of the LSMS-ISA survey for Tanzania 3 to calculate net values for 7575 cases where households with use of land reported figures for gross revenues and for costs in any of the 3 years 2009, 2011 or 2013.
To minimise the effect of outliers, cases with the smallest and largest 5% of net whole-farm profitability were discarded, leaving a total of 6818 cases.
All costs and prices were converted to 2015 Purchasing Power Parity values (https://data.worldbank.org/). Labour costs were defined based on family and hired labour usage, as recorded in the agricultural module of the survey, valued at the prevailing agricultural wage rate (defined as an average daily rate in Tanzanian shillings, converted to real 2015 values). We use the average rental rate for land ($53/ha/y) observed in the Tanzanian LSMS-ISA as summarized by Ricker-Gilbert and Chamberlin (2018). We computed farm size as the sum (in hectares) of plots which are operated by the household, i.e. plots for which the land use is defined as cropped, garden, woodlot, fallow or virgin. We included land which is owned as well as borrowed or rented in.
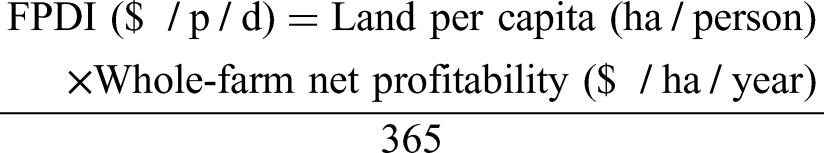
The daily income of a member of a rural household which is derived from farming (henceforth: farming personal daily income, or FPDI) is a simple function of two variables: LPC and whole-farm net annual profitability per unit area. Thus, for a stable household size, there are two ways that FPDI can be increased: (i) acquiring more land; and/or (ii) increasing the profitability of the farm, and is illustrated in the equation below:
Results
Mean operated farm size is 2.67 ha whereas the median is only 1.39 ha. Seventy-six (76) percent of cases involve farms of three hectares or less (Figure 1(a)). What determines FPDI is not land per se but LPC and the mean value of LPC is 0.51 ha per person while the median is only 0.29 ha per person. Seventy-six (76) percent of cases have values of 0.6 ha per person or less (Figure 1(b)). This Tanzania sample is in the middle of the range of LPC values for rural smallholder communities in SSA. For instance, data from Harris (2019, Table 2) show that the median LPC of 47 sites from 15 countries (N = 11,789 households) in SSA ranged from 0.08 to 0.6 ha per person, with an overall median (median of the medians) of 0.25. Jirström et al. (2018) reported median values of LPC for 2478 households in six SSA countries of: 0.12 (Kenya); 0.17 (Malawi); 0.23 (Mozambique); 0.26 (Ghana) and 0.29 (Tanzania). Frelat et al. (2016) reported median LPC values from 17 SSA countries ranging from 0.15 (Malawi) to 0.56 (Senegal).
(a) Distribution of farm size (ha). N = 6818 cases (household×year). (b) Distribution of land per capita (ha per person).
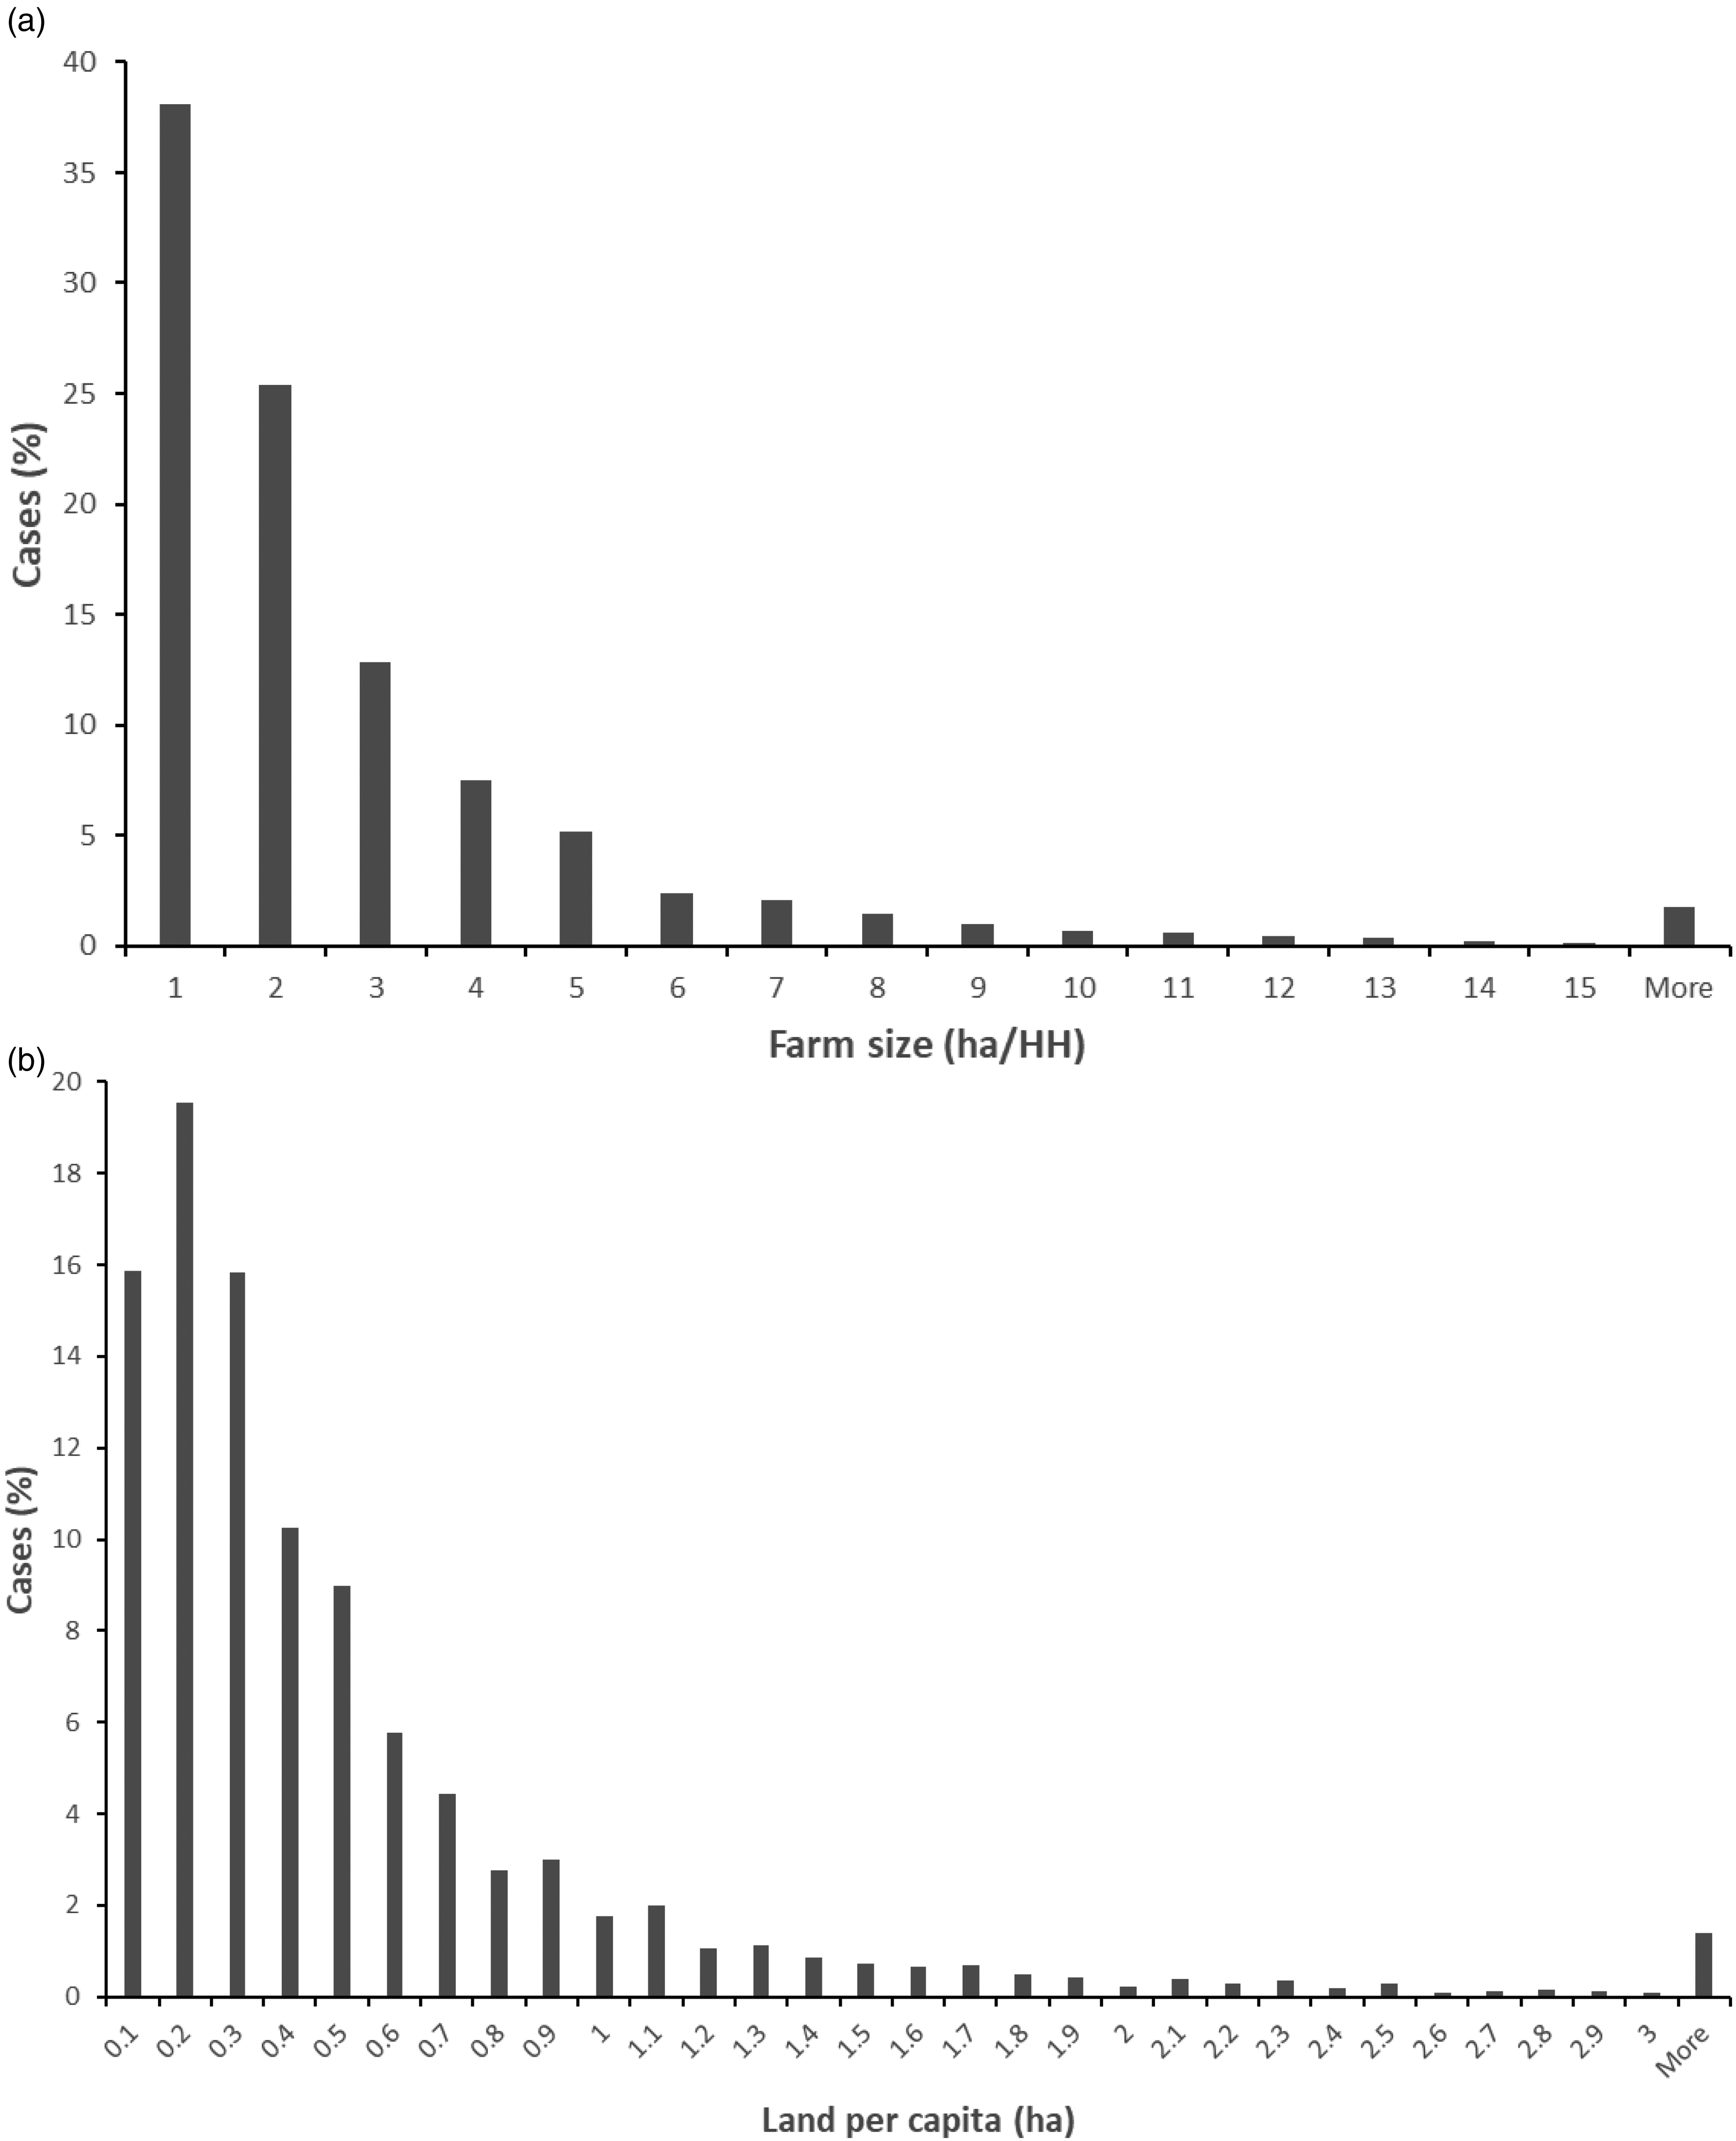
Figure 2 shows the distribution of whole-farm net profitability for 6818 cases (households×years) from Tanzania between 2009 and 2013. There is a dramatic difference between values calculated with- and without the opportunity cost of family labour. Whereas the median value without family labour costs is $454/ha/y, including them drives the median down to minus $238/ha/y, i.e. a loss. Without costing family labour, no cases lost money whereas many did if their labour was counted.
Whole-farm net profitability with- and without the opportunity cost of family labour included.
The maximum value encountered with family labour costs included is $2742/ha/y, while the maximum value without accounting for family labour costs is $4485/ha/y. These two latter values are reasonable candidates for the best achievable farm performance in the sample, although the exact combination of environment, climate and management leading to such outcomes is not known.
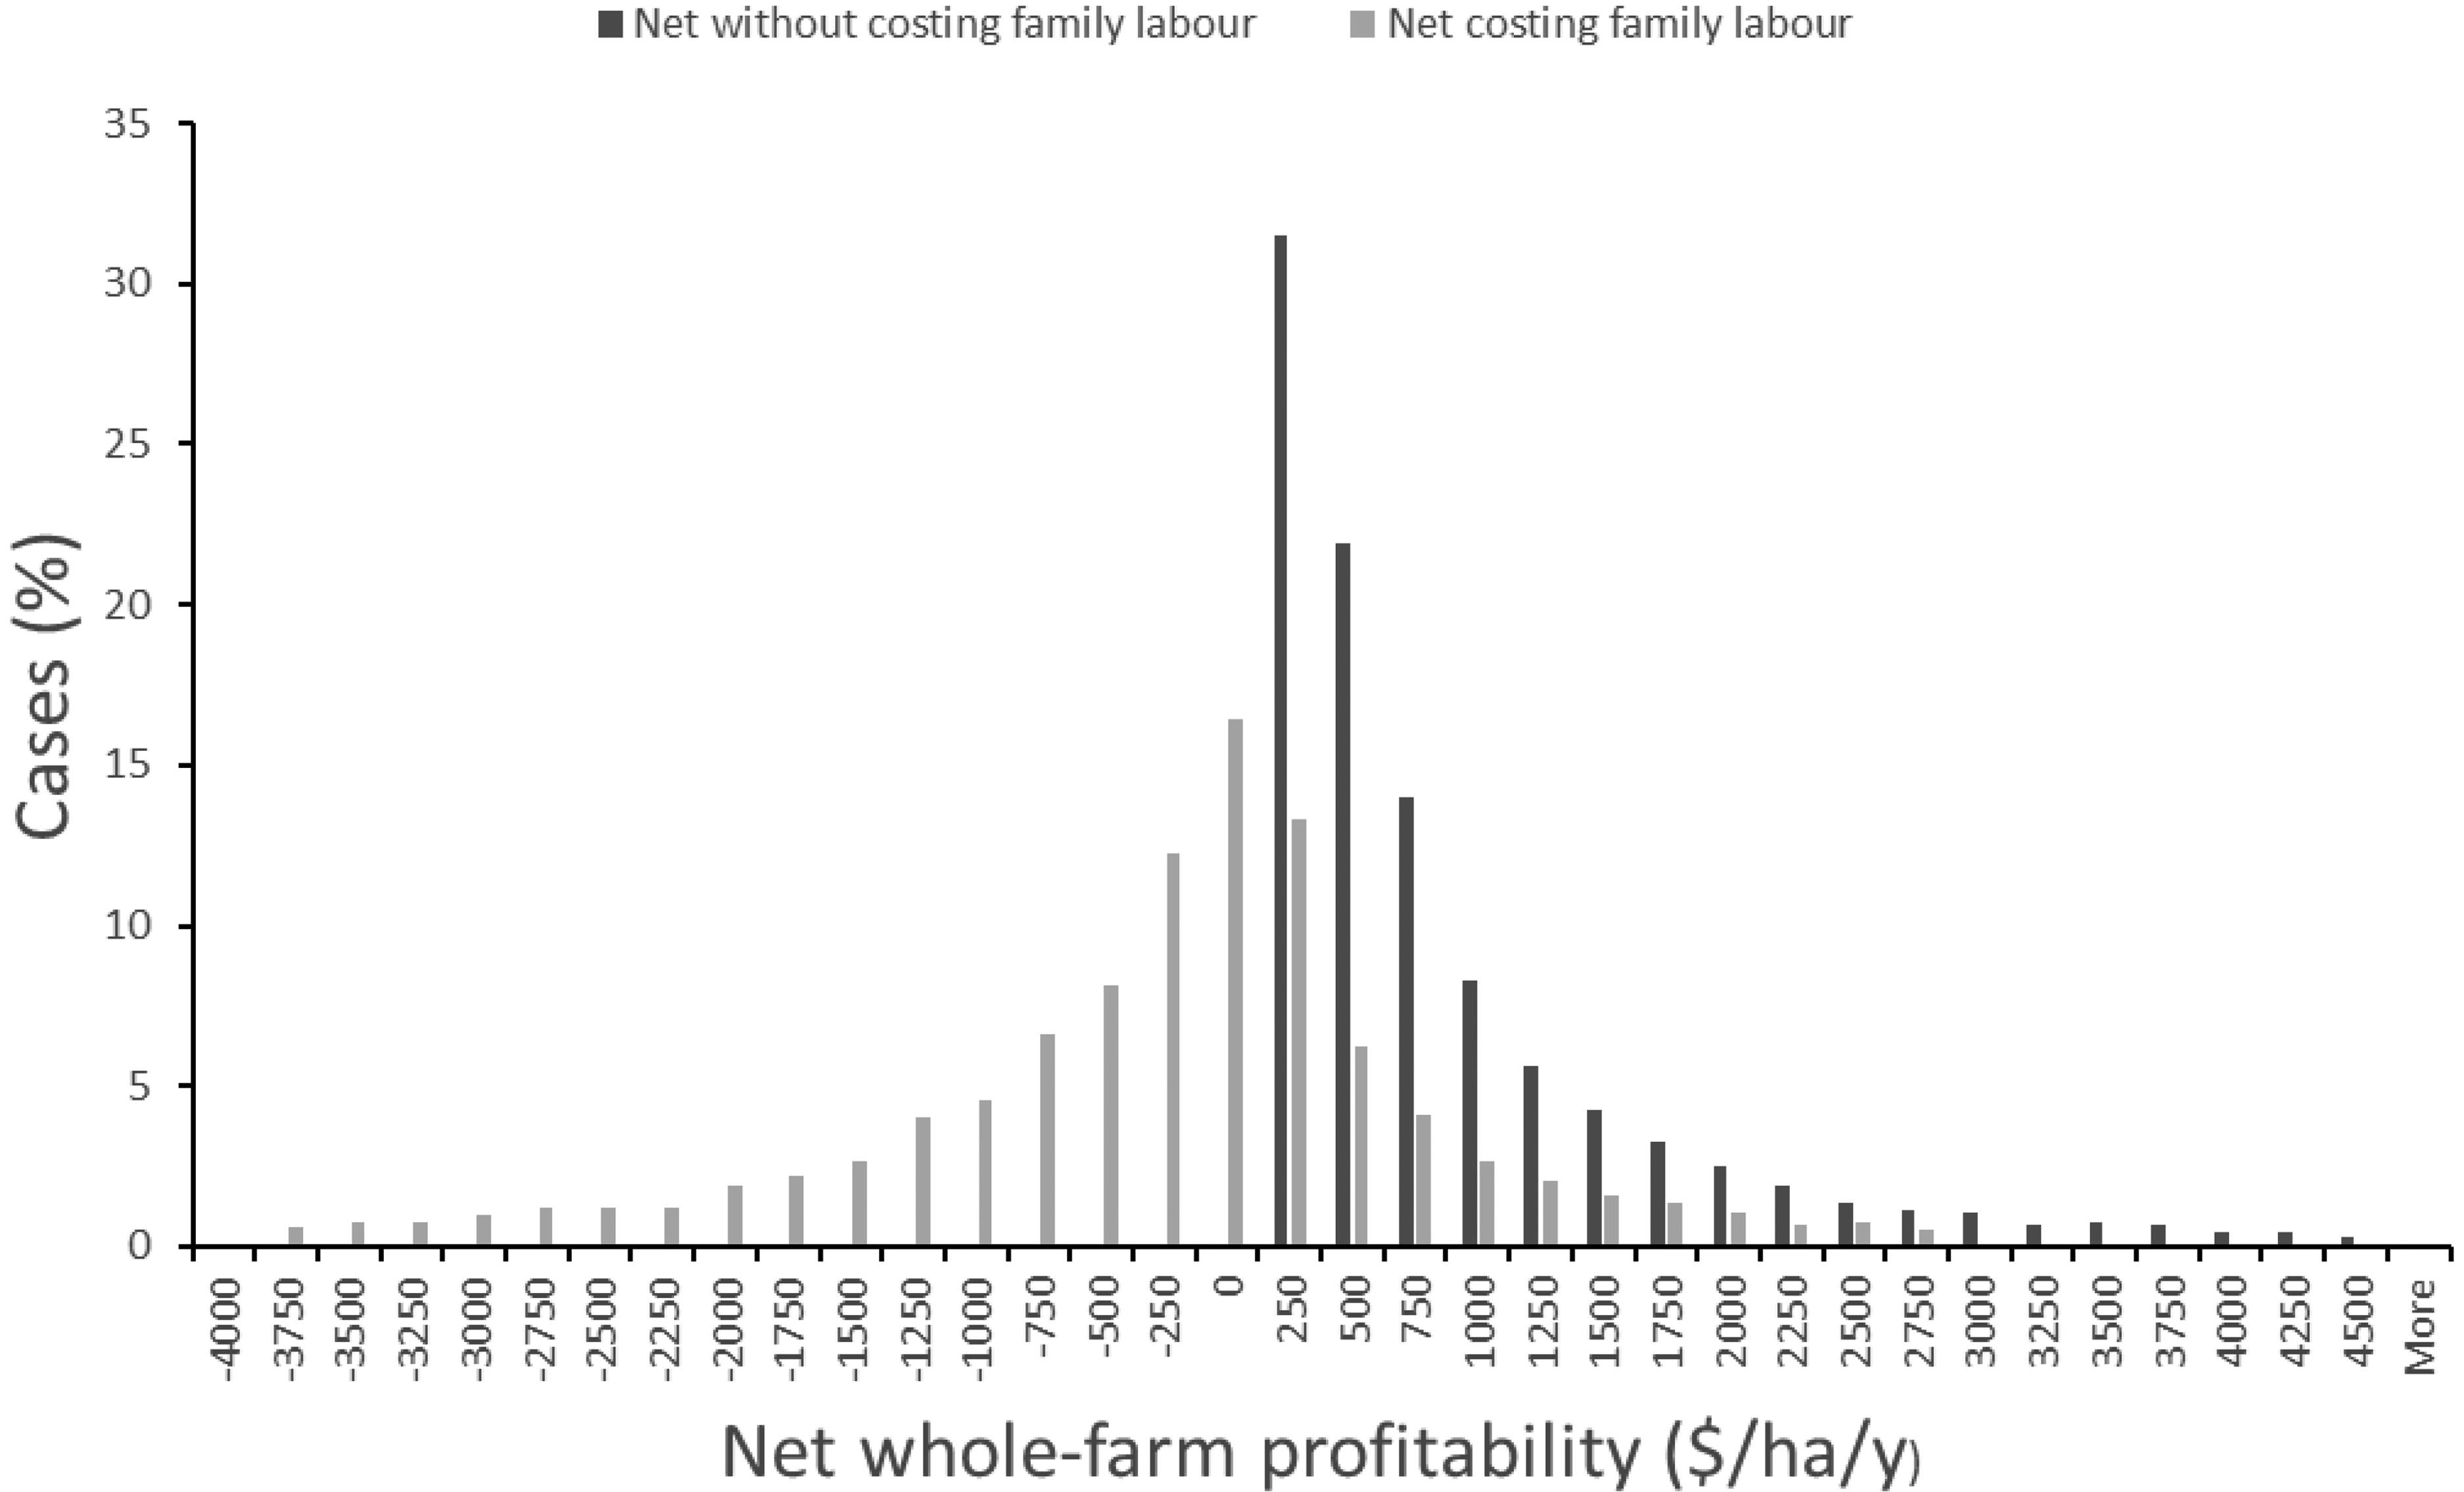
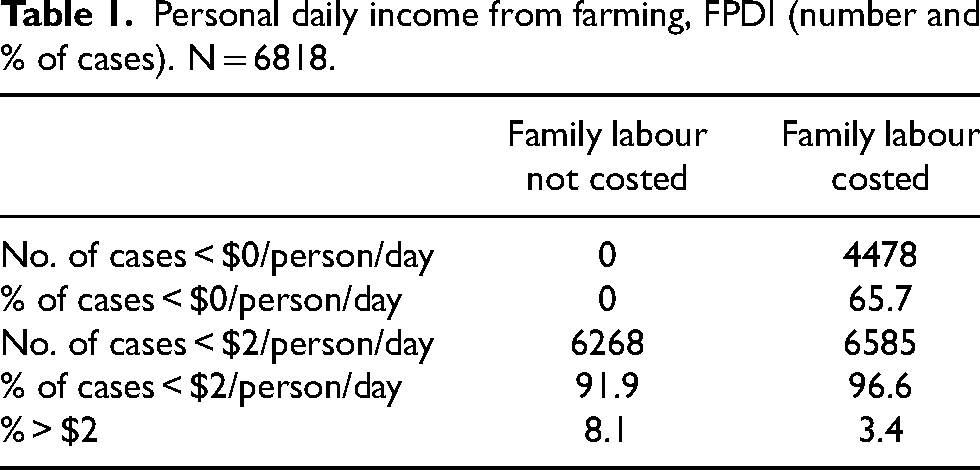
Figure 3 and Table 1 reflect the distribution of actual FPDI values within the sample. In more than 90% of cases, irrespective of whether family labour was costed, FPDI was less than $2/person/day, although in almost 66% of cases FPDI values were negative if costs of production included family labour. In fewer than 10% of cases was farming able to generate net incomes exceeding a nominal extreme poverty line of $2/p/d.
Distribution of personal daily income from farming, FPDI ($/person/day).
Personal daily income from farming, FPDI (number and % of cases). N = 6818.
The relation between whole-farm profitability and LPC (see equation) is shown for a range of target FPDI values in Figure 4. The dotted arrow represents the possible intensification pathway without any changes in LPC (farm size and or household size) for the median value of the sample, i.e. an LPC value of 0.29. A household with that LPC will generate increasing values of FPDI as its whole-farm profitability increases, from $0.36/p/d at point x1 to $2.18/p/d at point x2 and $3.56/p/d at point x3. However, if the cost of family labour is included, the median net whole-farm profitability of minus $238/ha/y will result in a loss of $0.19/p/d (not shown). Equation 1 and Figure 4 are very useful in that they can be used to calculate and visualize, respectively, the current circumstances for any individual farm household and how their situation would change if LPC and/or farm profitability were to change.
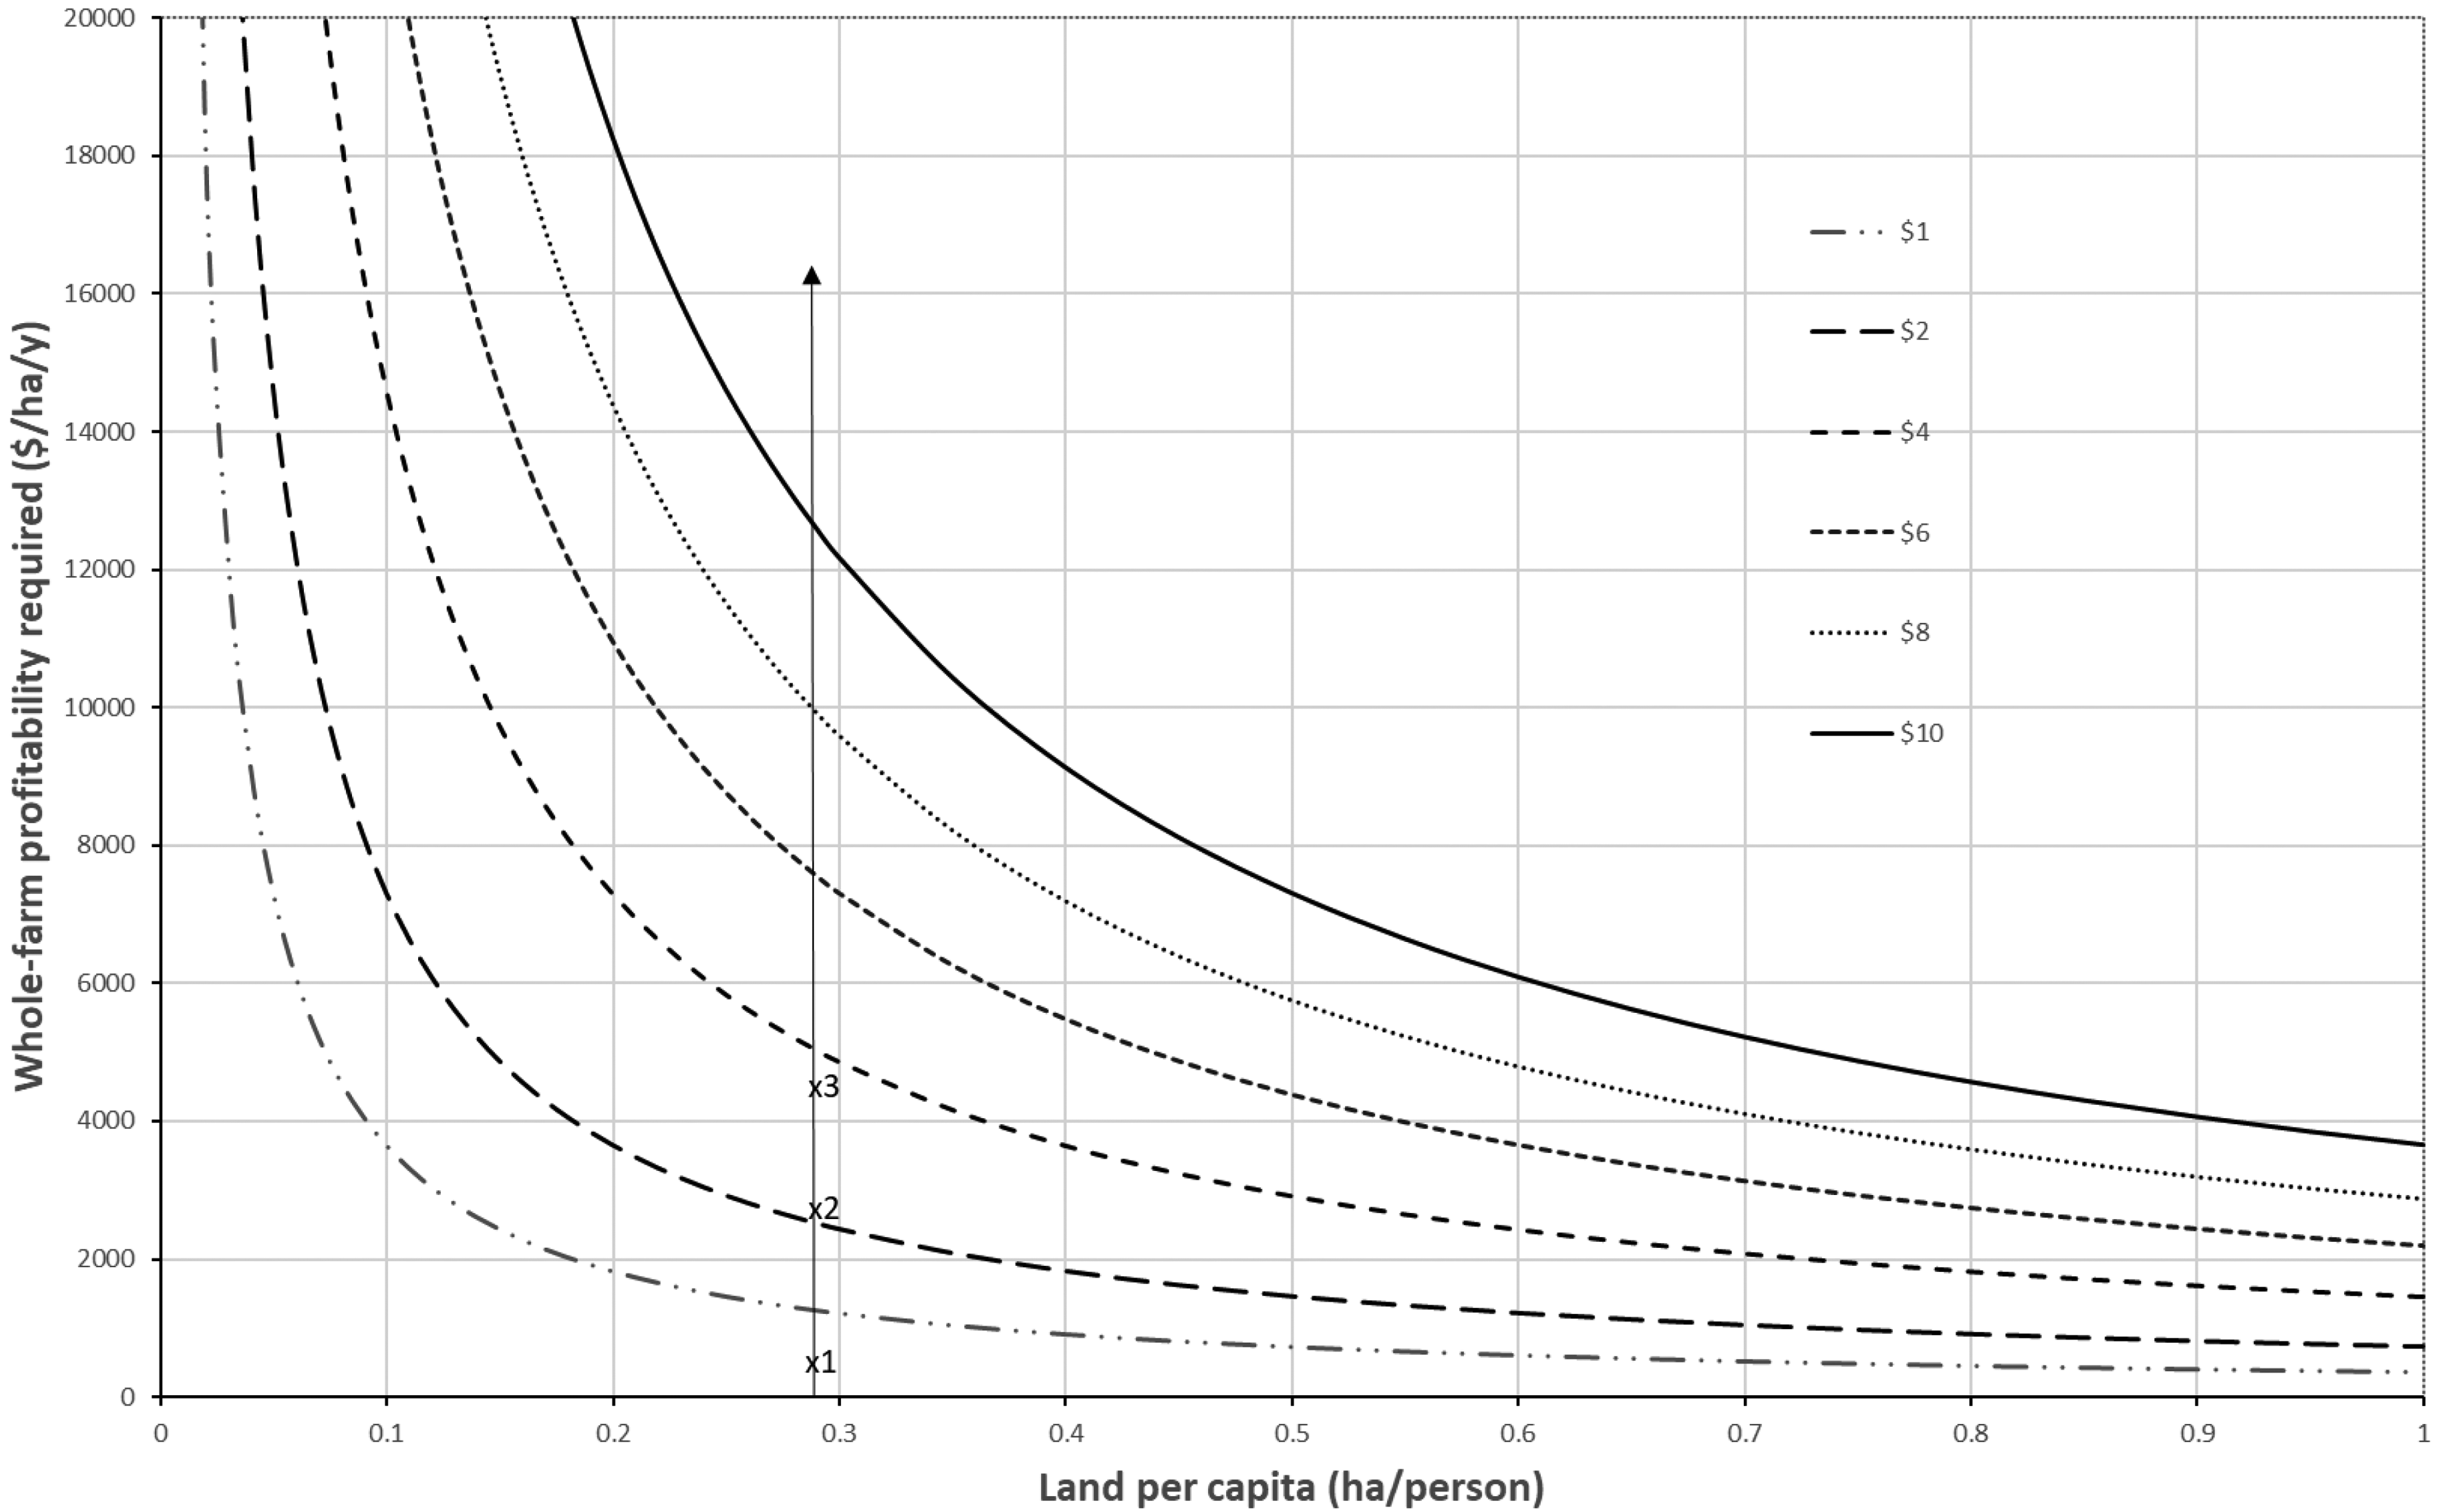
Relation between whole-farm profitability, land per capita and personal daily income from farming (FPDI). The dotted line represents the median value of land per capita for the Tanzania sample (0.29); x1 is the median net profitability of the sample without costing family labour ($454/ha/y); x2 is the maximum net profitability recorded in the sample including the cost of family labour ($2742/ha/y); x3 is the maximum net profitability recorded in the sample but without including the cost of family labour ($4485/ha/y). The median profitability of the sample when family labour is costed represents a loss of $238/ha/y and has not been plotted.
Unless their farms can generate very high levels of profitability, many households would need more land to generate even modest FPDI values. Exactly how many households would need extra land to reach various income goals depends on their current landholding, their level of current (or future) profitability and the FPDI value which they are attempting to generate. At the current median level of profitability (without family labour costed) of $455/ha/y almost all cases would need some extra land to reach even $2/p/d whereas at higher levels of profitability fewer households would require any (Table 2). The higher the target FPDI value, the more cases that would require extra land for any given level of profitability.
Percent of cases (households×years) requiring extra land to generate FPDI values of $2, $4, $6, $8 and $10 per person per day for a range of levels of profitability ($/ha/y) characteristic of the Tanzania sample (x1, x2 and x3 from Figure 4).
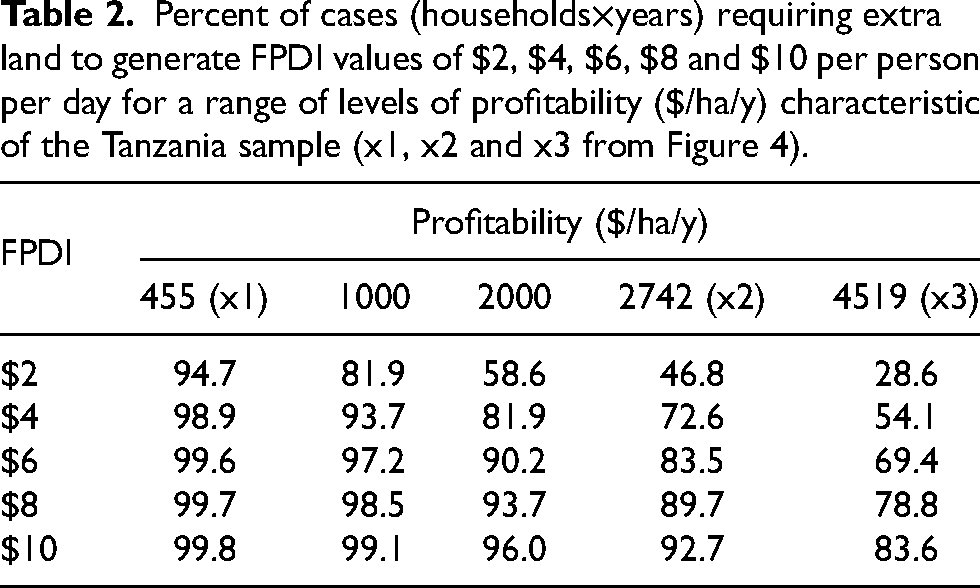
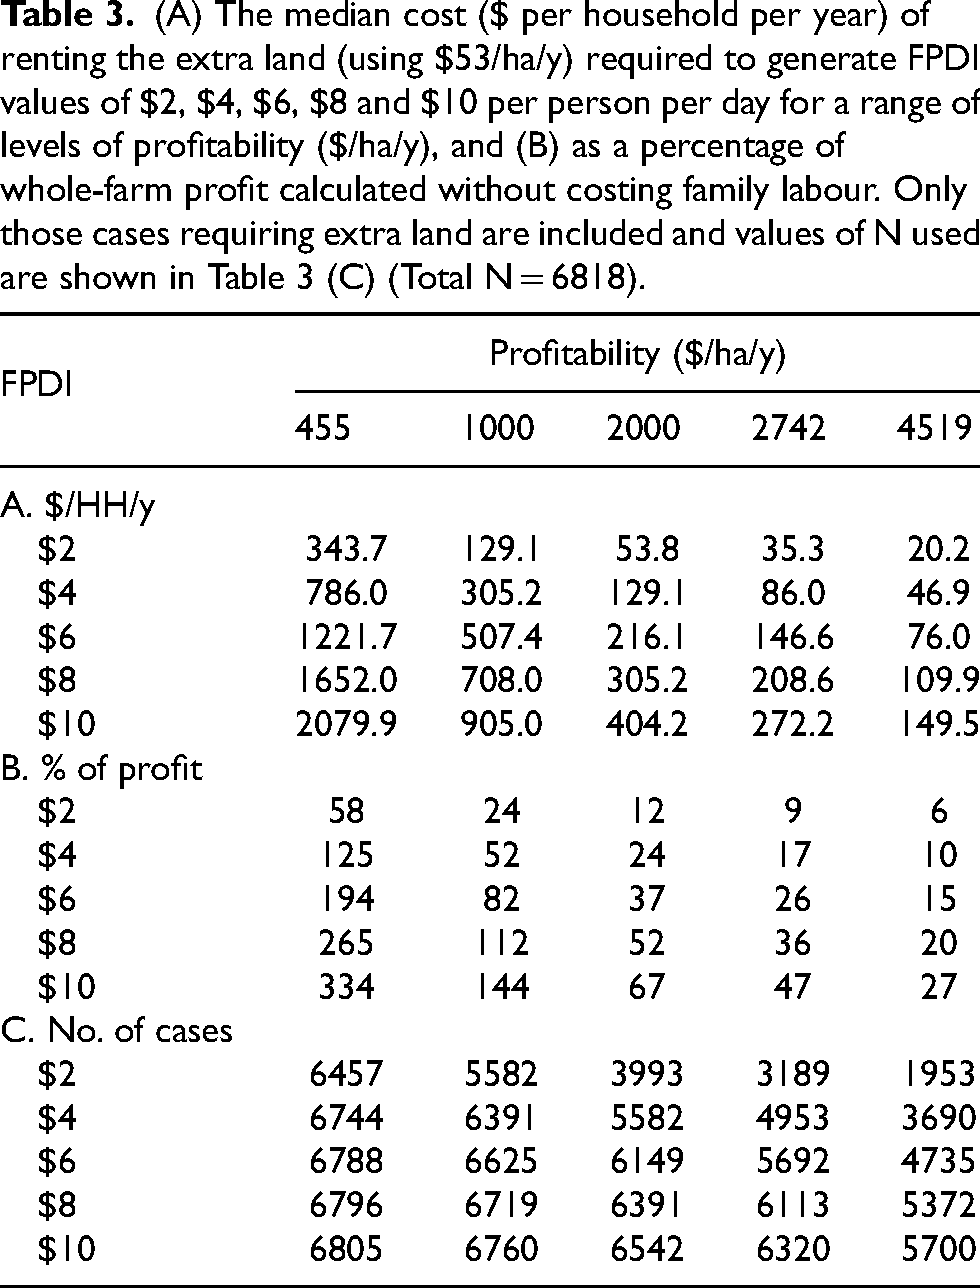
Table 3 shows the median extra costs involved in renting in extra land in absolute terms and as a percentage of the current whole-farm profit assuming household labour is not costed – the most favourable interpretation. Again, extra costs depend on profitability levels and target FPDI values and the additional amounts are substantial unless profitability is very, very high or ambitions for FPDI are low.
(A) The median cost ($ per household per year) of renting the extra land (using $53/ha/y) required to generate FPDI values of $2, $4, $6, $8 and $10 per person per day for a range of levels of profitability ($/ha/y), and (B) as a percentage of whole-farm profit calculated without costing family labour. Only those cases requiring extra land are included and values of N used are shown in Table 3 (C) (Total N = 6818).
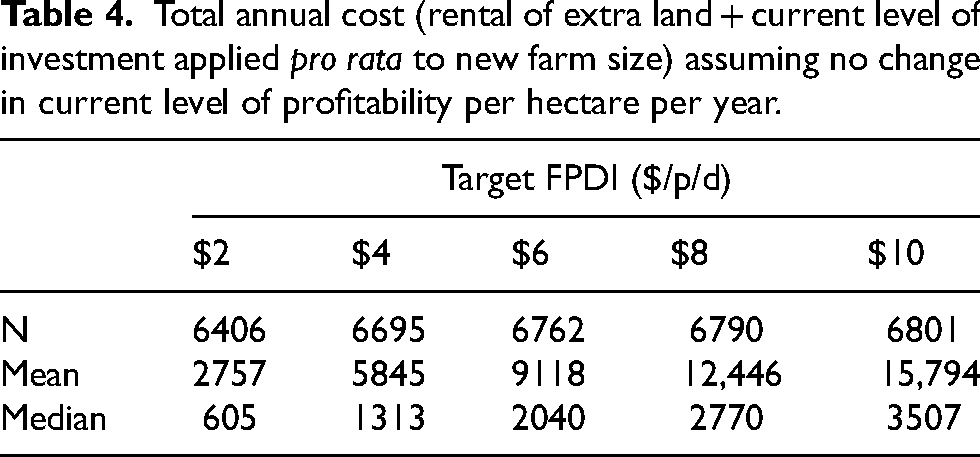
Land rental costs do not constitute the whole picture for households trying to intensify by increasing farm size. Table 4 and Figure 5 reflect the total cost, i.e. renting extra land and maintaining current levels of investment pro rata on their larger farm, for individual households to generate a range of FPDI values. These are substantial amounts for most households.
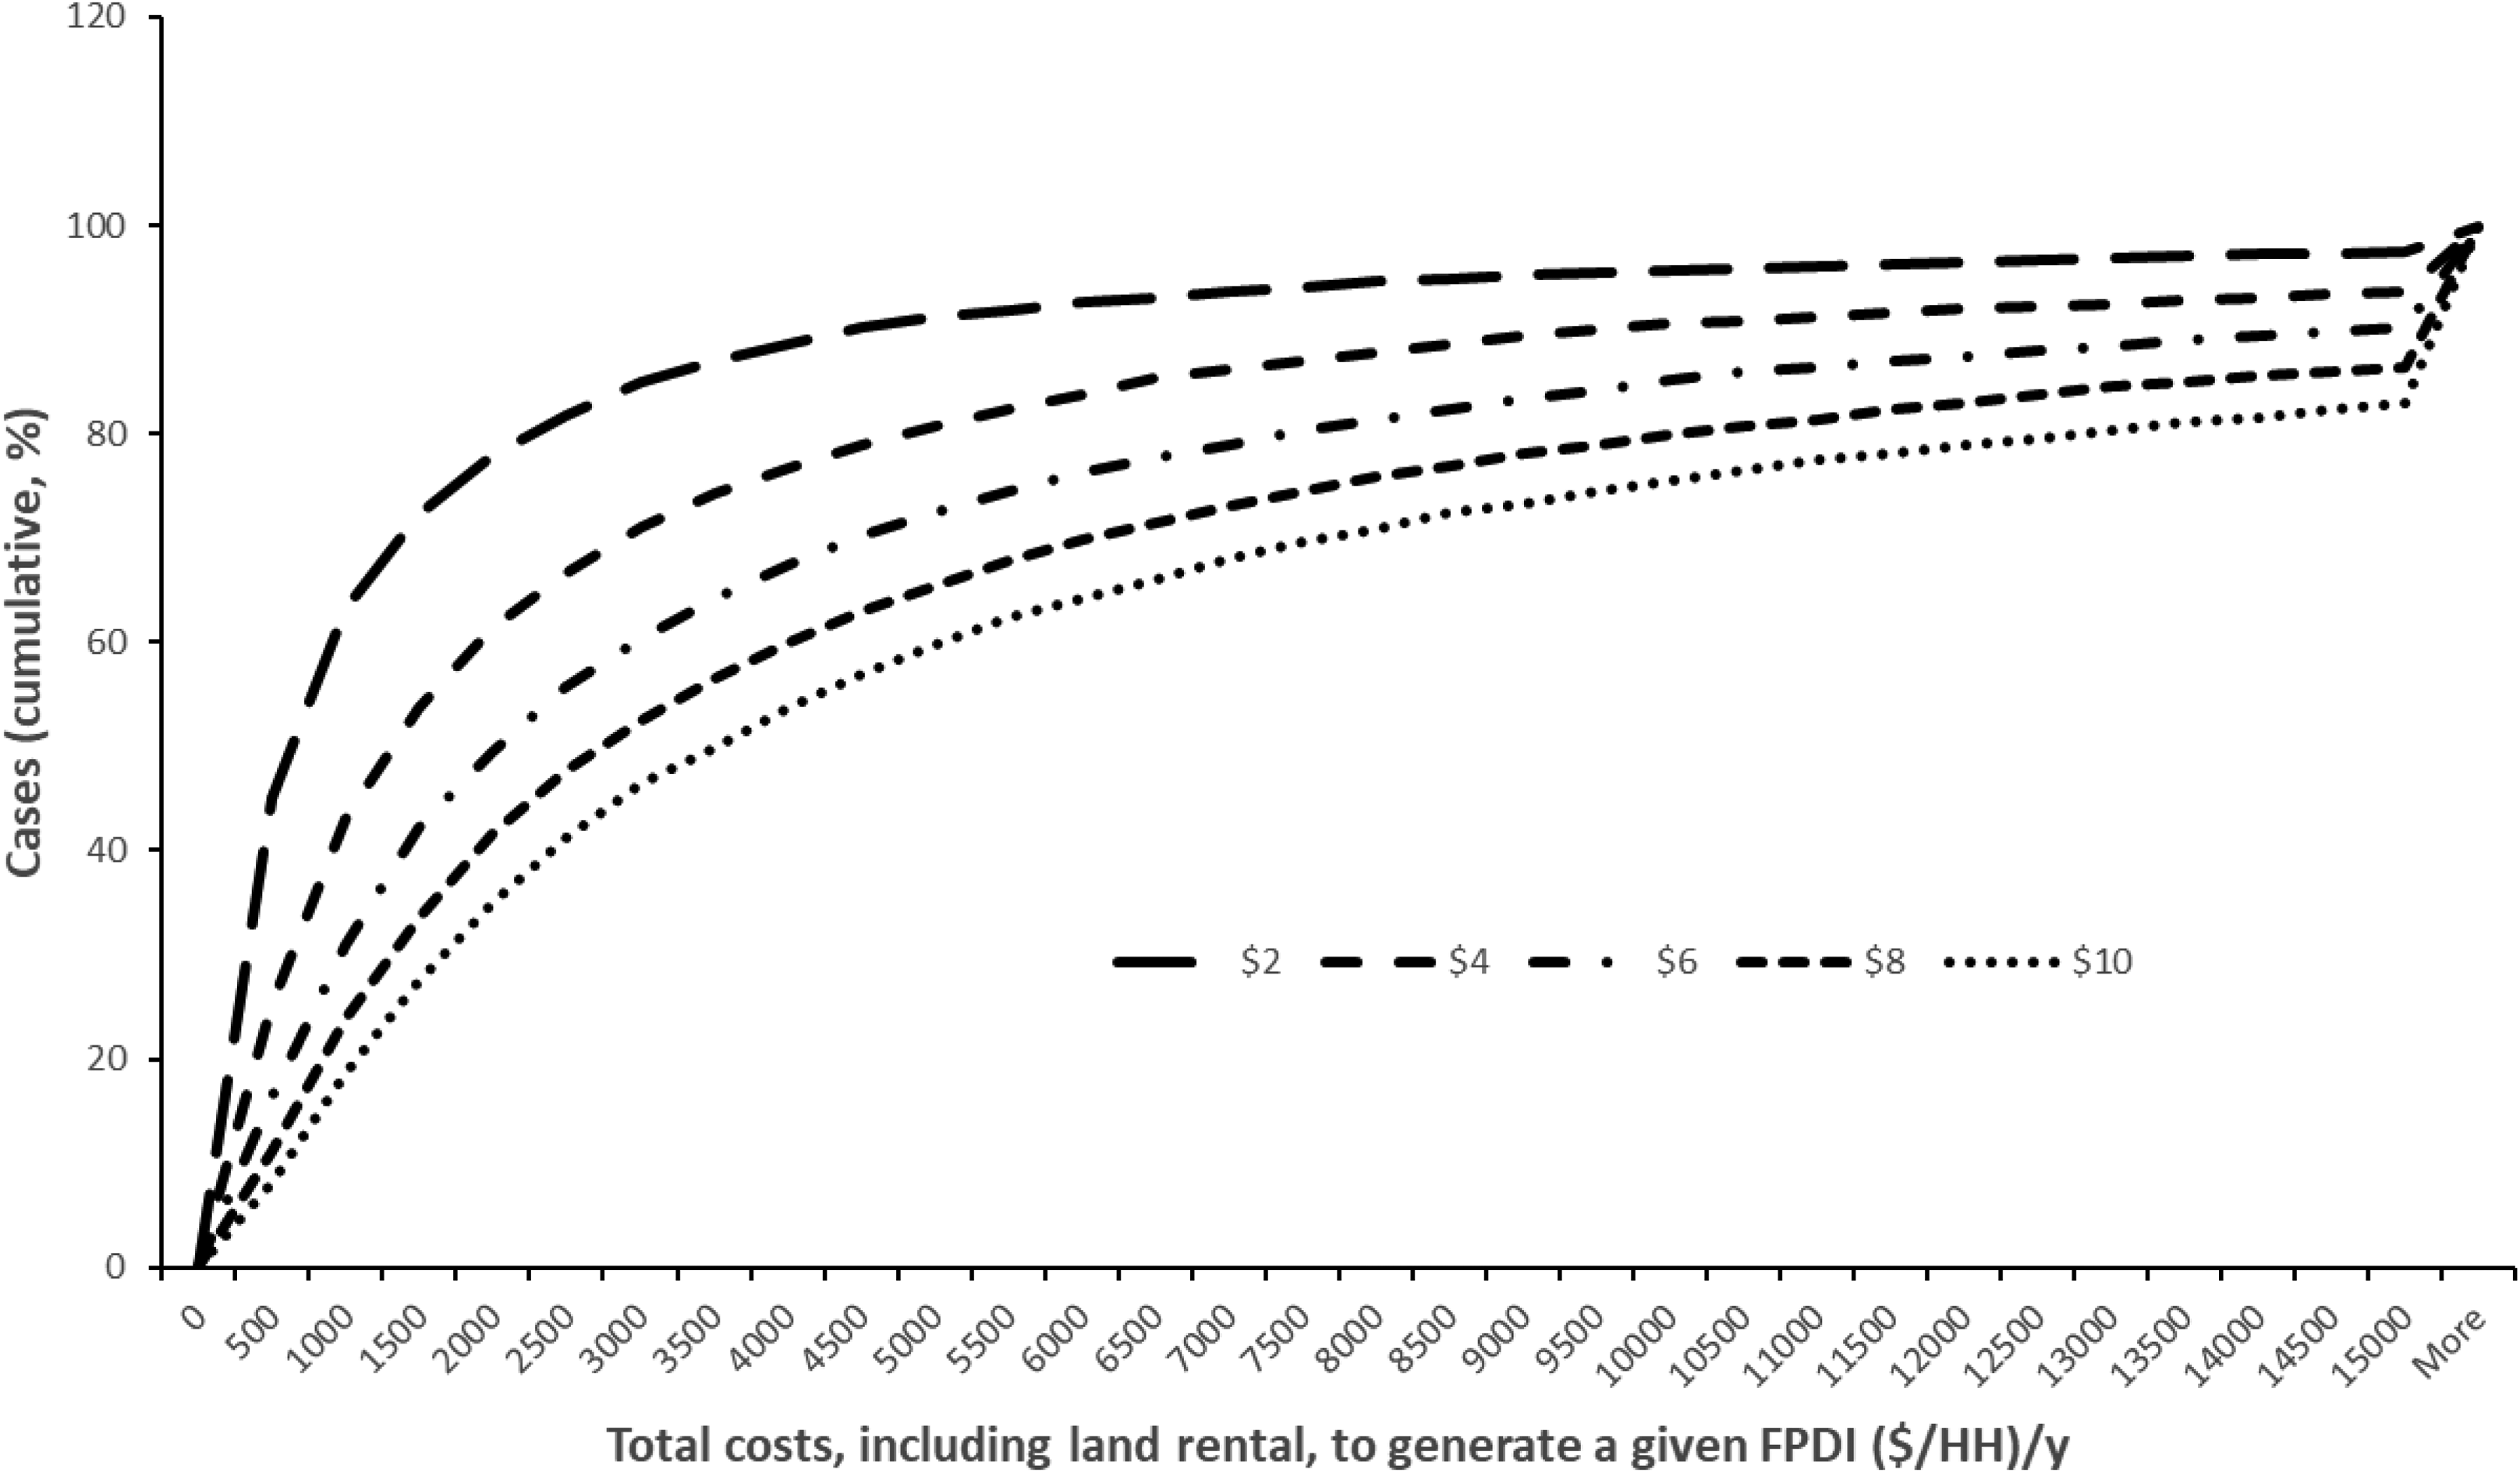
Distribution of total annual cost per household (renting extra land + current level of investment pro rata applied to the new farm size) to generate FPDI values of $2, $4, $6, $8 and $10 per person per day, assuming no change in current level of each farm gross margin.
Total annual cost (rental of extra land + current level of investment applied pro rata to new farm size) assuming no change in current level of profitability per hectare per year.
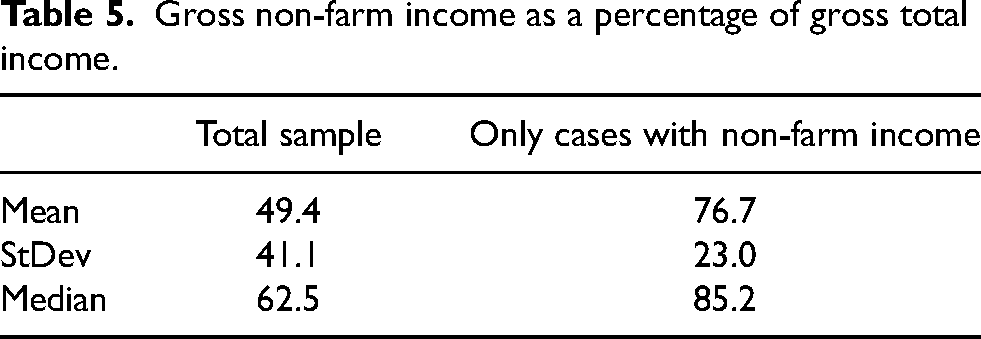
Many smallholder farming households have multiple sources of income (Barrett et al., 2001; Harris and Orr, 2014; Llewellyn and Brown, 2020). Table 5 reflects the distribution of cases with proportions of gross non-farm to gross total income. Overall, on average around 50% of total gross income is derived from non-farm sources with a median value of 62% although 35.6% of cases have no non-farm income at all. When only cases with some non-farm incomes are considered, the mean value rises to 77% and the median to 85%. Where available, non-farm income is an important contributor to the total income of these farming households.
Gross non-farm income as a percentage of gross total income.
Discussion
One caveat to this study is that it relies on self-reported income data, which is somewhat noisy. This is a recognized feature of data collected under large household surveys with comprehensive modules, such as the LSMS-ISA (Fraval et al., 2019; Tasciotti and Wagner, 2018; Wollburg et al., 2021). As described earlier, we addressed outliers through winsoring at the top and bottom 5%. While this is in accordance with standard practice, we recognize that any winsoring threshold is fundamentally arbitrary. To evaluate the robustness of our analytical conclusions to such choices, we also compared results with those from data winsorized at 10%. Median values were unaffected, as expected, and mean values were minimally altered, lending support to our main analytical conclusions. In fact, given the skewness of the distribution of income per capita values (in which very large values are more suspect than very small values), if anything, our results are modest assessments of the limited returns to farming. In any case, we would argue for more research and investment in income data quality in large surveys to better enable our collective understanding of agricultural incomes and returns to technology adoption at scale in the region.
Most rural households in our sample do not have enough land to generate even modest FPDI values even if their farms were to perform at relatively high levels of profitability. However, it is not clear what constitutes feasibly attainable levels of whole-farm net profitability nor even at what levels these farms currently operate. Our analysis of the Tanzania LSMS data shows the dramatic influence that costing family labour can have on estimates, often being the difference between making a profit and a loss. There is a longstanding debate (CIMMYT, 1988; Thorner, 1981) about the importance of assigning opportunity costs where opportunities for alternative allocation of labour may not exist. There is a growing consensus, however, that rural households with small farms cannot thrive on farm income alone (as this paper confirms) and – whether by choice or necessity – African smallholders increasingly pursue off-farm income streams to supplement farm income (Davis et al., 2017; Nagler and Naudé, 2017). Under such circumstances the value of family labour for farming operations must be included, at least to some extent, in calculations of net benefits. In such cases, representative values for median whole-farm net profitability of the Tanzania sample probably lie somewhere between the extreme values of -$238 and $454/ha/y. With the rapidly increasing importance of off-farm income sources, this is an important dynamic. When family labour is no longer available as family members are pursuing jobs elsewhere the prospects of farming using hired labour dramatically change. Households could no longer ignore the costs of labour as this will turn into an actual expense. It will result in many farms in Tanzania making a loss in real terms. This might quickly become an important issue for food security.
There is, presumably, a limit on how profitable per hectare a farm can be if all best practices are adopted. Unfortunately, there is little published evidence concerning what that limit might be for farms in developing countries. There is some evidence from developed countries concerning the profitability of commercially oriented farm enterprises that, presumably, are operated at or near optimum profitability and so might provide reasonable estimates of attainable levels of performance for farms in developing countries. Eves and Painter (2008: Table 6) report average whole-farm net returns per hectare per year (ignoring depreciation) over the period 1990–2005 for farms in Australia ($119), Canada ($79), New Zealand ($198) and USA ($175). More recently, average gross margin, net of any subsidies, for mixed crop and livestock farms in England where farms tend to be smaller than in those countries, was $1135/ha/y for 2021/2022, although that was achieved with high levels of additional fixed costs (which is not appropriate to the LSMS data) and without valuing family labour (which is appropriate to the Tanzania sample), the inclusion of which reduces profitability substantially (FBS, 2022).
Such levels of farm performance per hectare in developed countries, assumed to be representative of commercially viable farms, are broadly like most of the cases we estimated from the Tanzania sample, although they are much lower than the estimated potential values either with, or without, family labour. These ‘boundary’ values per hectare may seem high but may be plausible for a sub-set of farms where high-value crops are grown on small pieces of land or where intensive livestock production is possible. Even with similar performance per hectare, profitability per farm, of course, is higher in the developed world because farms are much bigger (Ritchie and Roser, 2022) and can implement economies of scale, benefit from more effective use of machinery (Muyanga and Jayne, 2019), and often attract substantial subsidies (https://agriculture.ec.europa.eu/common-agricultural-policy/cap-overview/cap-glance_en).
Percentage returns on investment in improved agricultural technologies (e.g. see Harris and Orr, 2014) can be substantial and may far exceed the returns on investing capital in savings deposit accounts in all but a handful of countries worldwide. Of 116 entries listed at Trading Economics (2023), only 10 countries offered bank savings rates above 10% (i.e. a B:C ratio of 1.1) and of those only three had rates greater than 20%. Superficially, then, households with land and capital can potentially make more money from farming using improved methods than they can from putting capital into a bank. Unfortunately, as we have shown, most smallholder farming households do not have much land so their returns in absolute terms, even if impressive in percentage terms, are small and carry a risk of losing their investment because of bad weather, pests, and diseases.
Households can increase their farm size via the land rental market. Renting-in land incurs significant extra costs, not just the rent for the land (Table 3) but also the cost of the extra inputs required to generate the same, or higher, rate of profitability (Table 4 and Figure 5). These costs are substantial unless profitability is, or becomes, very high or ambitions for FPDI are low. Households are also exposed to greater losses in the event of farming disasters.
In theory, not using land and renting it out could provide regular, risk-free income while pursuing alternative income strategies, but has the downside risk of potential food insecurity as the land is no longer available as a fallback option for self-sufficiency through direct consumption. Given the prevailing rental values, incomes would be very small, with a mean PDI value for the sample of $0.07/p/d and a median value of only $0.04/p/d. This compares poorly with the prevailing mean ($0.74/p/d) and median ($0.33/p/d) if family labour is not costed but is an improvement on the situation if family labour is costed where a loss of $0.19/p/d is incurred. Very large LPC values would be needed to generate even modest incomes, e.g. 13.8 ha per person when rented out would only give $2/p/d.
Rural land rental markets have been developing rapidly in many parts of SSA, albeit from a low base (Abay et al., 2021; Chamberlin and Ricker-Gilbert, 2016; Jayne et al., 2021). Much of this growth is attributed to rising labour-land ratios, with land commodification acting as an access-mediating mechanism under increasing scarcity (ibid). However, such markets are still largely at incipient stages of development. As a reflection of this, fewer than 15 percent of smallholders in the Tanzania sample reported renting in farmland in 2015. As such, our estimates of the cost of renting-in land likely represent a lower bound: if demand for rental land were to increase, the average local price in any given area would be expected to increase as well. While in the longer term, rental markets may be expected to play an increasing role in facilitating access to land for smallholder farmers in Africa, the volume of land rented in by tenants is likely to remain limited, due both to the fragmented holdings in much of the region as well as the relatively limited production resources available to many would-be tenants. For example, operating more than 2–3 hectares would generally require access to animal- or mechanized traction as well as hired-in labour beyond what the family could supply. Such constraints would also apply in areas where customary tenure is prevalent and additional ‘free’ land could be allocated by communities.
The foregoing analysis reflects actual revenues, i.e. observed production valued at observed sales prices. It is possible that the terms of trade for agricultural producers may increase in the future, which would make farming more profitable even without additional technology changes. For example, output marketing systems may become more efficient and offer better prices to farmers. Burke et al. (2020) provide some evidence to link recent improvements in output marketing channels with the expansion of medium- and large-scale farmers in Zambia. Such effects may also result from improvements in rural infrastructure (Minten and Kyle, 1999; Schürenberg-Frosch, 2014). Increasing urban demand for food may also contribute to rising food prices, with positive direct effects for net sellers of food (and possibly also positive welfare impacts on poor net consumers, through unskilled rural labour market effects; Headey and Martin, 2016). Yet, taking the results from the developed world as an indication, these changes will not significantly increase farming profits on a per ha basis.
Finally, Figure 6 demonstrates the sensitivity of effects on FPDI of increasing farm size and increasing profitability, either separately or together. Increasing FPDI can be achieved in a linear fashion by improving farm performance or by increasing farm size, although a combination of both strategies is best as the response is non-linear. Given the increasingly limited scope for land expansion in the region (Chamberlin et al., 2014), the generation of more productive (and more profitable) technologies is clearly of paramount importance (Van Ittersum et al., 2016). However, our analysis suggests that returns to new technology adoption would have to be very large indeed to overcome the inherent limitations of small farm sizes to generate incomes above conventionally defined poverty lines. The implications of this seem clear: efforts to lift rural smallholders out of poverty cannot rely on agriculture alone. Furthermore, even while agricultural productivity gains are critically important for smallholder systems, the limited returns to technology investments in absolute terms (i.e. changes in net income) may dampen incentives offered by even high percentage returns to very small investments. 4
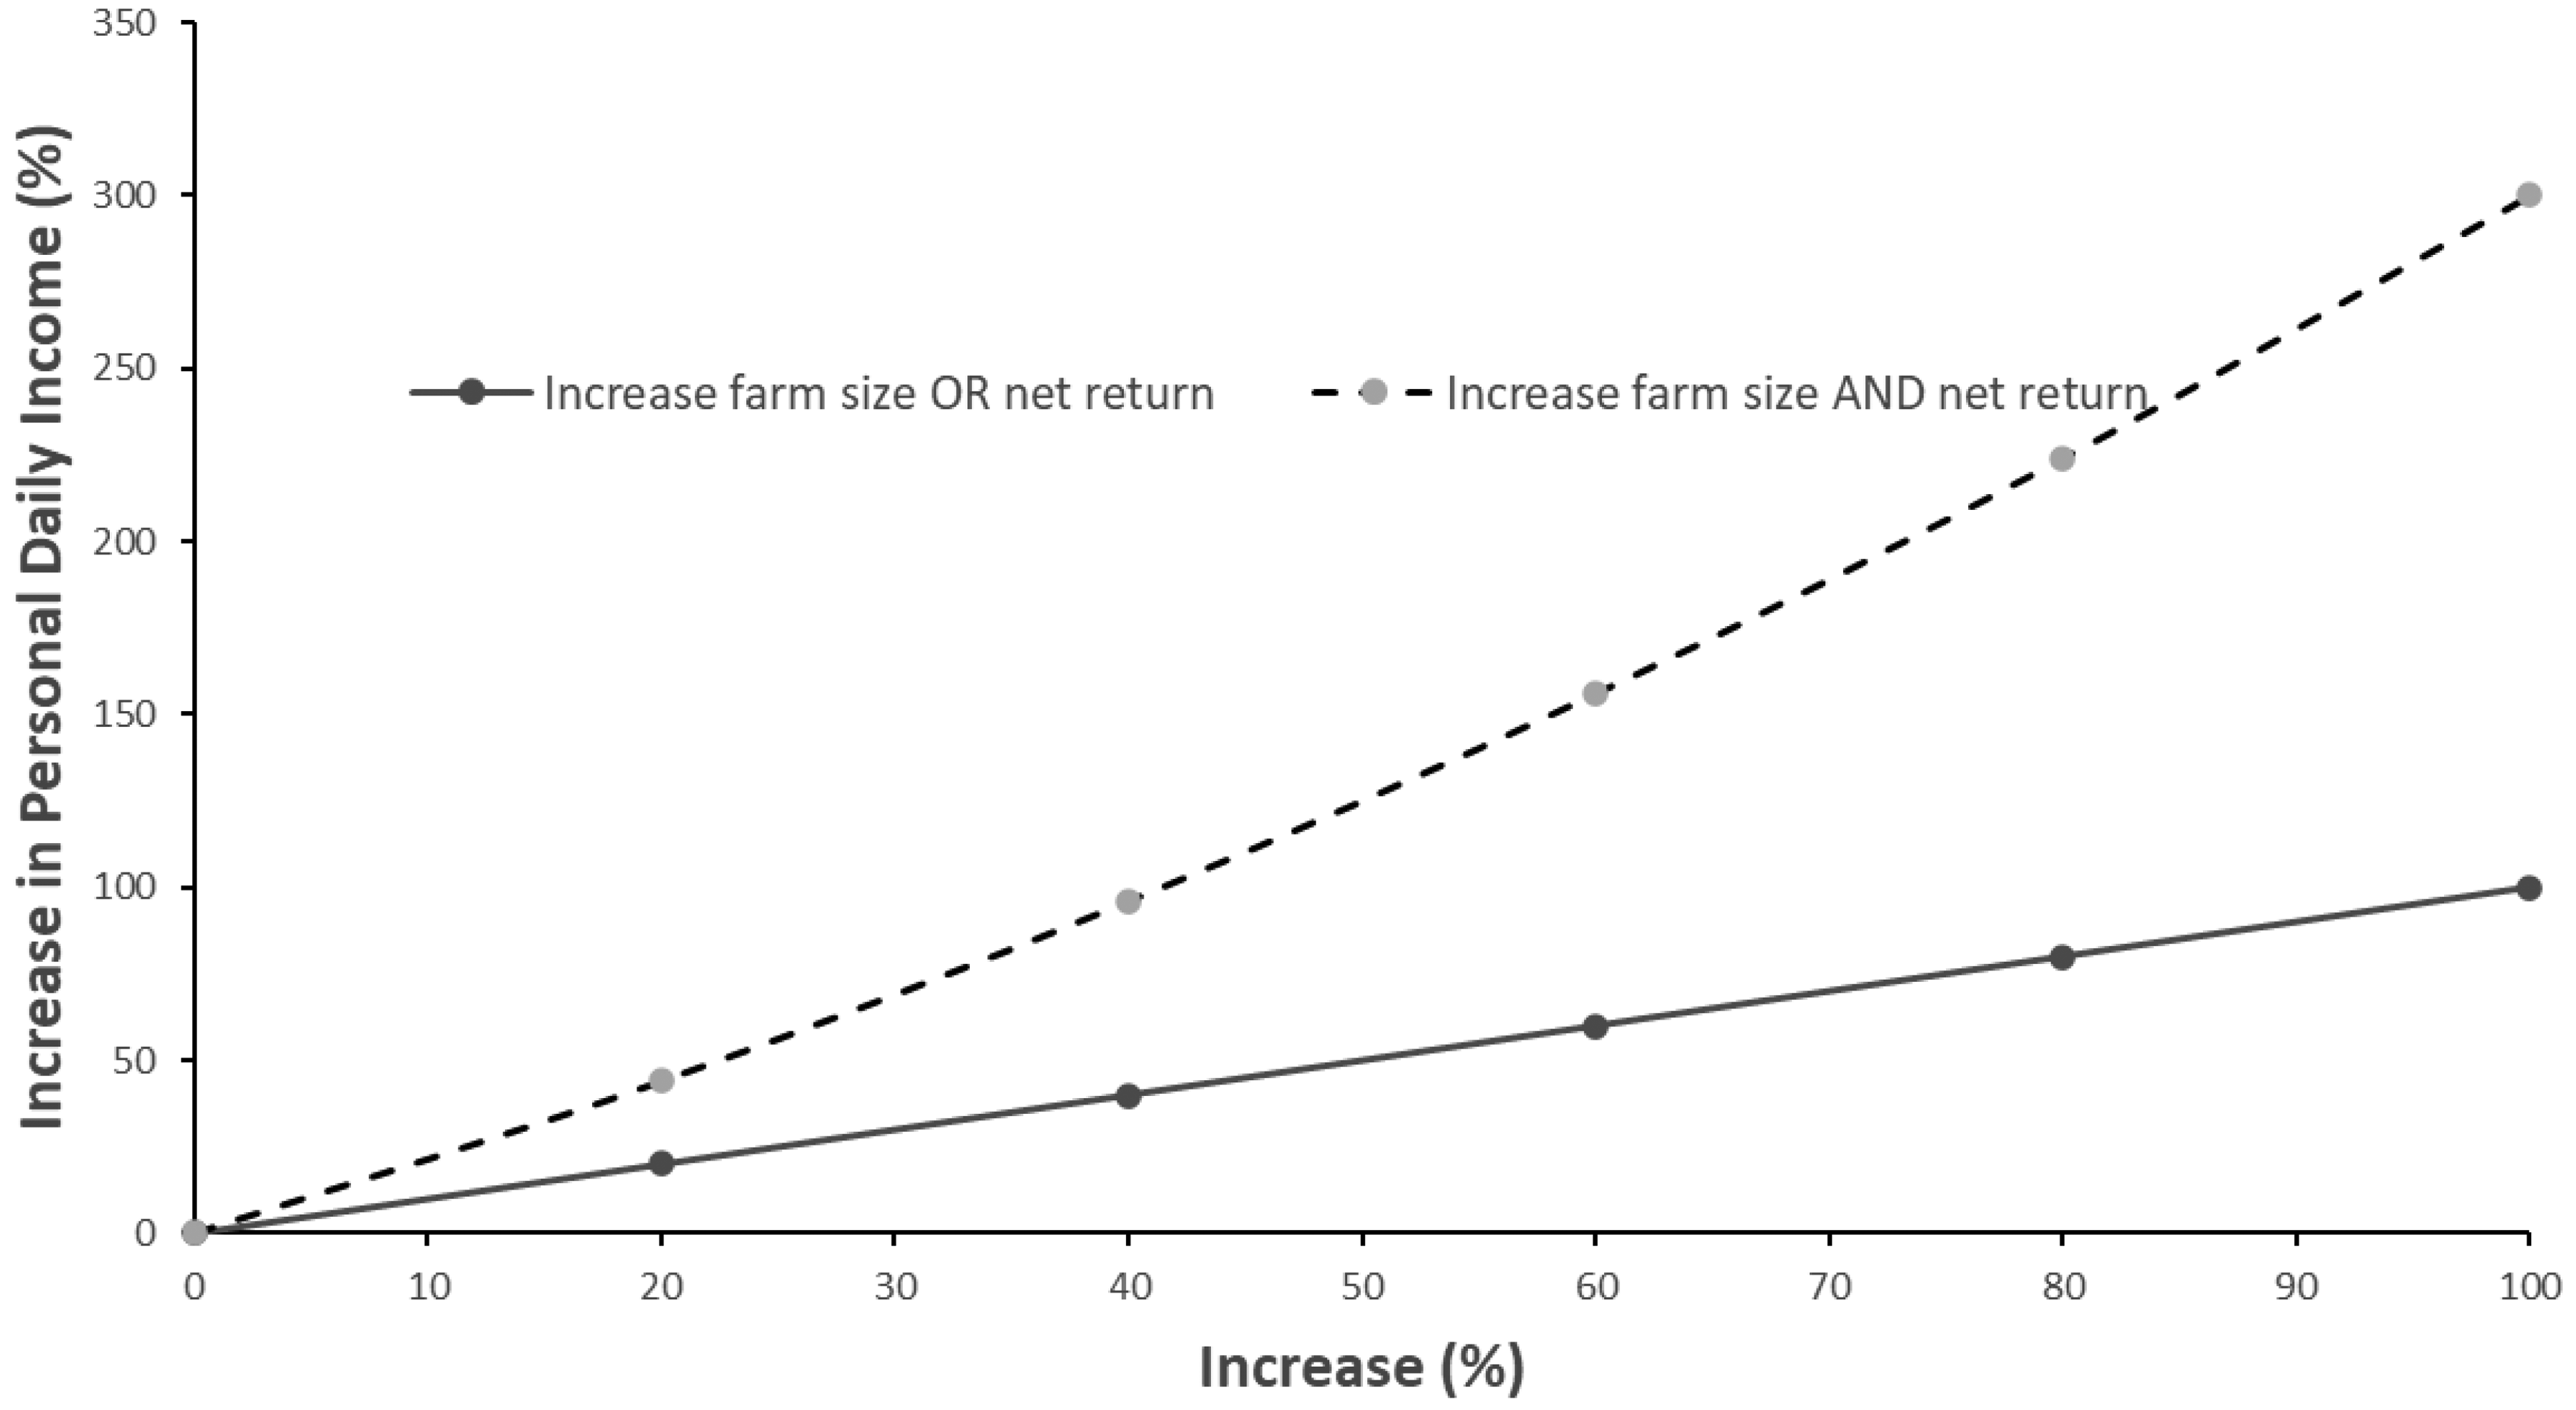
Effects of increasing farm size (land per capita), net return per hectare or both together on the increase in FPDI.
Conclusions
Most farms in Tanzania are too small to be economically viable on the basis of agriculture alone, even if farm performance is improved substantially. The generally small values of LPC are similar to those reported elsewhere in SSA (Deininger et al., 2017), so this conclusion would appear to be broadly relevant to the region. In our data, median whole-farm net profitability is low ($474) without accounting for the cost of family labour and negative (minus $238) if it is costed. Useable estimates of potential profitability (i.e. the highest observed returns) are $4485 and $2472 per hectare per year, depending on whether family labour costs are included.
Nevertheless, despite – conscious or unconscious – underappreciation of the opportunity cost of family labour, and the seeming unattractiveness of the economic incentives that such small returns on investment represent, experience suggests that some rural households do adopt improved farming practices (Walker and Alwang, 2015). Small gains may be worthwhile incentives to invest and be important psychologically for poor people, irrespective of whether some arbitrary poverty line is met. Rural households with land frequently self-identify as ‘farmers’ even when farm income is a minor contributor to household finances (Verkaart et al., 2018). There are many, poorly understood, reasons why rural households make the choices they do. Recent work on aspirations may shed further light on these (Mausch et al., 2021).
Nevertheless, uptake of improved technologies remains poor and the relation between LPC, farm performance and personal daily incomes, as represented in Figure 4, illustrates why the economic incentives for adoption are small and may fail to motivate investments by much of the target population. In these circumstances, we propose that Figure 4 could be used for any household or community to visualize their farming prospects and for researchers and extensionists to decide if their offerings are feasible or attractive in a real-world context.
Our results strongly suggest that efforts by national and international agricultural research systems to bring about welfare gains in developing countries through agricultural productivity improvements are fundamentally constrained by the farm size distributions of their target beneficiaries. While we emphatically concur with the consensus that agricultural R&D investments are vitally important for continued agricultural and broader economic development, we are suggesting that such efforts may have limited direct welfare impacts for African farmers operating extremely small farms, at least in the short run. Large-scale strategic agricultural development investments should not ignore the role of the non-farm economy in conditioning the adoption and impacts of technological innovations in small holder-dominated farming systems. Over the longer term, bigger welfare gains will accrue to moving out of agriculture to higher productivity sectors, i.e. the structural transformation process (Johnston and Mellor, 1961; McMillan and Headey, 2014). But that process also involves incremental productivity gains in agriculture, which are particularly important to the rural poor given the relatively high share of their income that (still) comes from farming. Enabling those gains requires adoption of new technologies, which in turn requires clearer incentives for farmers to make investments. But as we have shown, small farm-level returns in absolute terms may be a powerful disincentive to make such investments by many land-constrained rural households.
Footnotes
Declaration of conflicting interests
The authors declared no potential conflicts of interest with respect to the research, authorship, and/or publication of this article.
Funding
The authors received no financial support for the research, authorship, and/or publication of this article.