
Abstract
The Mouse Grimace Scale (MGS) has been widely used for the noninvasive examination of distress/pain in mice. The aim of this study was to further improve its performance to generate repeatable, faster, blinded and reliable results for developing automated and standardized pictures for MGS scoring and simultaneous evaluation of up to four animals.
Videos of seven C57BL/6N mice were generated in an experiment to assess pain and stress induced by repeated intraperitoneal injection of carbon tetrachloride (CCl4). MGS scores were taken 1 h before and after the injection. Videotaping was performed for 10 min in special observation boxes. For manual selection, pictures of each mouse were randomly chosen for quality analysis and scored according six quality selection criteria (0 = no, 1 = moderate, 2 = full accordance); the maximum possible score was 12.
Overall, 609 pictures from six videos were evaluated for MGS scoring quality; evaluation was performed by using the picture selection tool or by manual scoring. With manual scoring, 288 pictures (48.3% of all randomly generated pictures) were deemed scorable using MGS (mean score = 22.15 ± SD 6.3). To evaluate the algorithm, ratings from different rater groups (beginner, medium-level trained, professional) were compared with the automated image generated. These differences were not significant (p = 0.1091).
This study demonstrates an improved set-up and a picture selection tool that can generate repeatable, not-observer biased and standardized pictures for MGS scoring.
The Mouse Grimace Scale (MGS) was invented by Langford et al. in 2010 as a behavioural test for examination of distress/pain. 1 This method has been widely used for the noninvasive behavioural examination of distress/pain in mice and many other species, such as horses, 2 pigs, 3 lambs, 4 rabbits 5 and rats. 6
In the original MGS setup by Langford et al. 1 pain and distress are measured by coding five different facial expressions.
For evaluation of the MGS, mice are habituated to observation cages for up to 45 min and then they are filmed in the cages for 30 min. Afterward, these pictures from the video are selected (cropped and sorted) and scored manually. 1 Other MGS generation methods recently demonstrated by different workgroups include real-time live scoring by a human examiner 7 or manual capture of individual pictures within custom photo boxes. 8 Because of the lack of automation, these different methods are time-consuming, labour-intensive and difficult to standardize. To reduce this workload, Matsymia et al. presented the Rodent Face Finder® in their study of the extraction of pictures of rodents with pale fur. 9
The aim of our study was to develop and further improve the performance of MGS to generate repeatable, faster, blinded, not-observer-biased, standardized and randomized pictures and reliable results in a one-step approach. The concept is also recommended for identifying mice with dark fur. Furthermore, up to four animals can be filmed and evaluated simultaneously using this method.
The intention of the automation of the technical processes is to minimize subjective intervention as well as avoid selection and performance bias.
Material and methods
Ethical statement
This animal study was performed in accordance with the Federal German law regarding the protection of animals. The study proposal was approved by the governmental animal care and use committee (LANUV, North Rhine-Westphalia, Germany, AZ: 84-02.04.2014.A417) and was in compliance with institution guidelines as well as The Guide for the Use of Laboratory Animals.10,11
Study design
The evaluation of MGS as an integral part of a previous unrelated animal-based study on severity assessment of CCl4 injection for the induction of liver fibrosis in mice. Seven male C57BL/6N mice (Mus musculus) weighing an average of 25 ± 2 g were randomly chosen from a group of 72 animals for video recording. To avoid any hormonal differences, only male animals were included. Information on housing conditions and hygiene management can be found in the supplemental material.
Experimental procedure
To assess pain and stress CCl4 was intraperitoneally injected to induce liver fibrosis. To comply with the 3R principle, no additional experiments were conducted to evaluate MGS. The MGS videotaping was performed twice a day for three days a week, at exactly the same time in the morning. 12
Technical setup
To generate pictures for MGS scoring the animals were filmed with a digital single-lens reflex camera (Canon EOS 700D, Canon Deutschland GmbH, Krefeld, Germany) for 10 min in special observation boxes 9 × 5 × 5 cm3, as described in the protocol used by Langford et al.
1
Information about the construction of MGS observation boxes can be found in the supplemental material. For simultaneous observation of four animals, a special rack was prepared for application of the boxes (Fig. 1) and was placed into a white filming tent (Fotozelt Lichtzelt Würfel 80 × 80 × 80 cm3; Softbox, PMS, Germany) which had its sides, front and bottom illuminated from the outside. The brightness within the observation boxes ranged between 250 and 430 lux, depending on the location.
The rack is designed in a 2 × 2 row system with a height × width × depth of 34 × 11 × 12 cm3 and is made of transparent polycarbonate.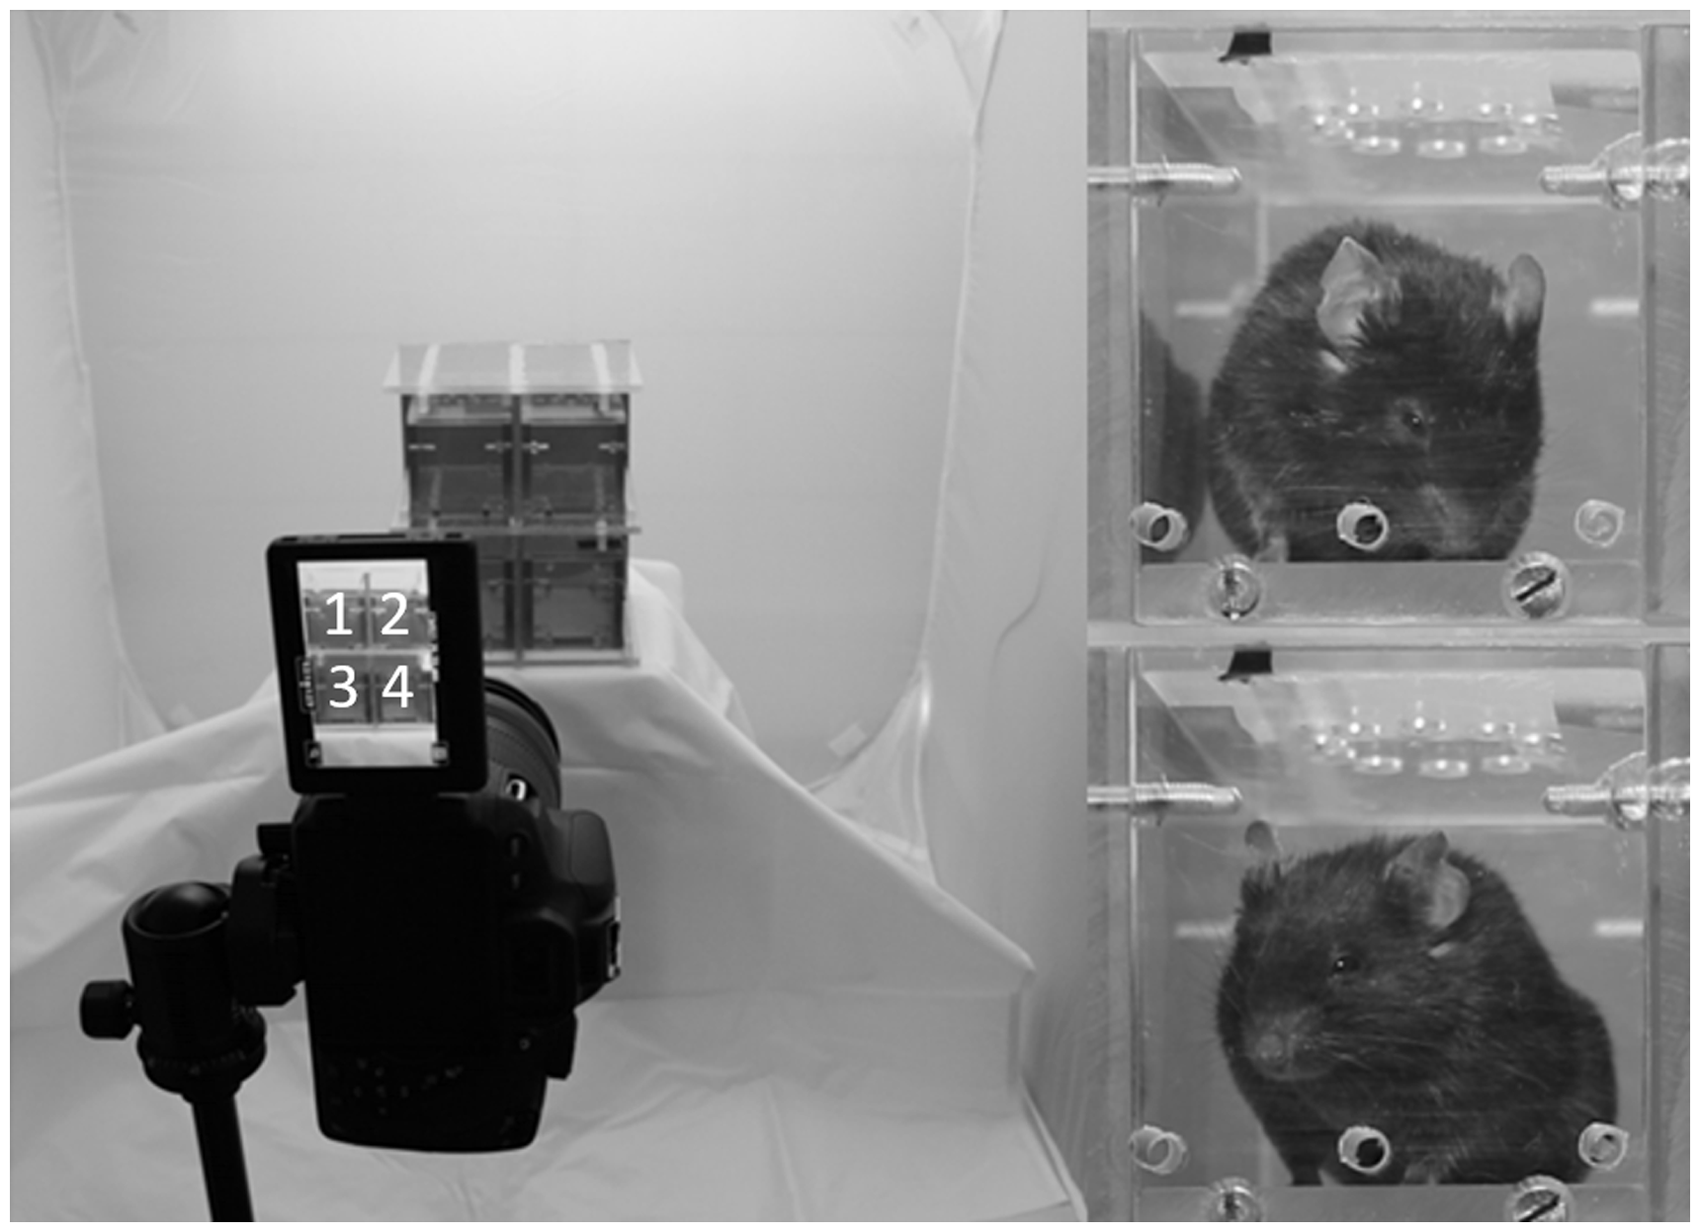
Before the examination started, one of these boxes was placed into each animal's home cage for 5 min to acclimatize the animals for odour adaptation and to minimize the stress of a new surrounding. To reduce the odour, the boxes were cleaned between use and at the end of the day they were disinfected with Antifect N liquid solution (Schülke & Mayr, Norderstedt, Germany).
Image collection
To establish the new generation and evaluation tool and to the compare manual and automated image selection, images from the videos were generated manually and by the picture selection in this experiment. Seven animals out of six randomly chosen videos were subset for generating pictures for MGS.
For manual image generation, the VLC Media Player (32-bit Version 3.0.4) was used on a Windows 7 operating system to capture a picture whenever the animal looked into the camera. The pictures were named by date and the position of the animal in the set-up to guarantee clear assignment.
Six quality criteria were used to manually select the pictures: (1) the mouse should appear in profile or front view; (2) at least one eye should be visible; (3) nose and cheek bulges should be visible; (4) the animal should be static and calm (not in a grooming or in sniffing position); (5) at least one ear should be recognizable; and (6) the overall good image quality should be good (the animal should be in focus, with no or low reflection, no cloudiness and good illumination) (Fig. 2). All pictures were scored according to whether they met each criterion: 0 = no accordance with criteria, 1 = little accordance with criteria, 2 = full accordance with criteria. The maximum possible score for the picture quality was 12 points. As a cut-off value for quality selection, all images selected as scorable for MGS had to have a score of ≥7 points, with no criterion scored 0.
Examples of images excluded for not fulfilling selection criteria. Pictures were scored with a maximum of three for each of the six criteria and were excluded when one criterion was scored as 0 or with an overall score <7 points.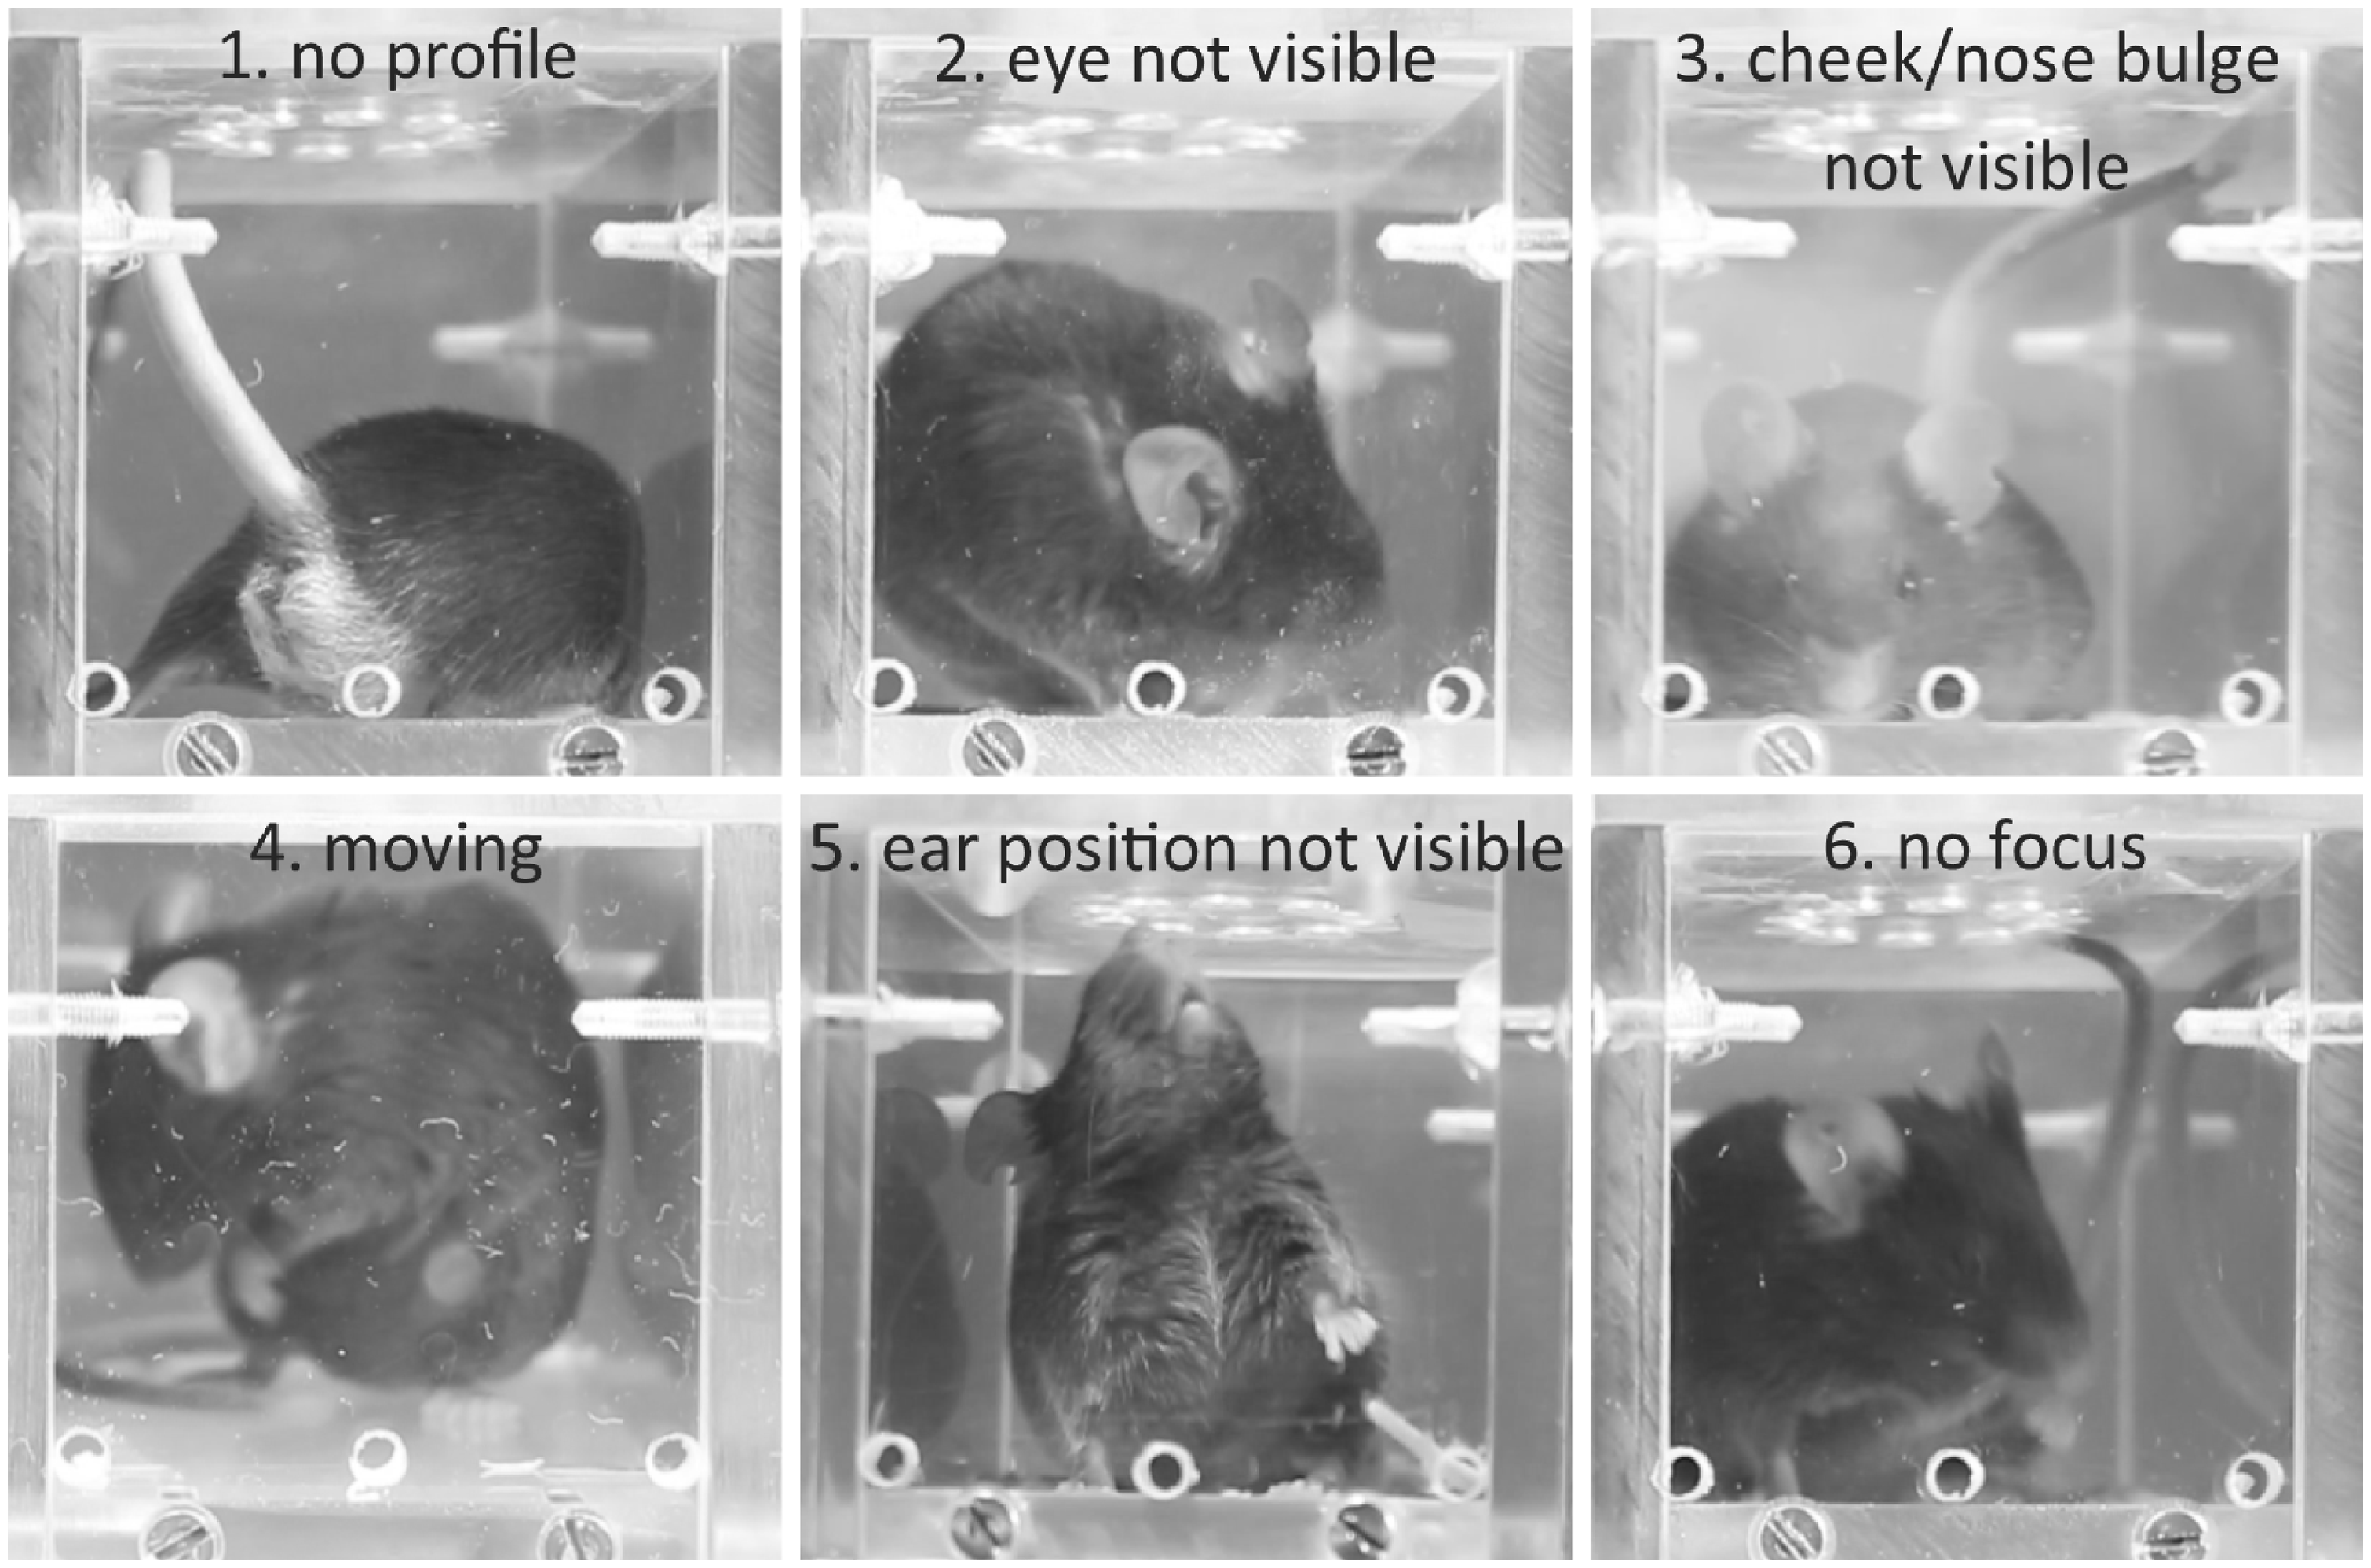
For automated image generation, the algorithm was ‘trained’ with approximately 700 images, which were evaluated by three different human raters according on the basis of the same criteria as described above.
The automated quality scoring was implemented using a pipeline of semantic segmentation networks used to detect relevant facial areas, which were subsequently scored by deep convolutional networks for image classification. In the segmentation stage, a network for semantic segmentation was ‘trained’ to segment the animals’ ears in the images. Subsequently, cropped to 220 × 220 pixels that focused on the centroid of the animals’ ears were forwarded to a set of classification networks that were trained to score each criterion defined previously. As with manual quality scoring, the final quality score of an image was determined by the summation of all individual scores and comparison of the sum to the threshold of 7.
To show the difference between the MGS selection tool and manual selection method, 50 pictures (mean, 47 ± 5.8) were randomly cut out per animal video.
Afterwards, the generated images were filed with an animal identifier and time in an Excel sheet (Microsoft Excel Version 2016 for Windows) and were evaluated randomly and subsequently blinded in a scoring tool.
Evaluation process
To evaluate interrater reliability between image selection by the algorithm and manual selection, nine human raters (three beginners, three with medium-level training, three professionals) evaluated 116 images of three animals generated from two different videos. The videos used for this evaluation were different from those videos selected to ‘train’ the algorithm to assess the transferability of the algorithm to new data. The beginners were people who had no experience in handling or evaluating animals, or those with ≤2 years of experience in animals. The raters with medium-level training had ≥2 years but ≤5 years of experience in animal science and no to little experience with evaluating MGS images. The professionals had ≥5 years of experience in animal science, had good to very good knowledge of handling and stress assessment of animals, and were highly familiar with the MGS scoring system. All groups simultaneously performed the scoring after a 30-minute briefing of the test setup.
Statistical analysis
Data were analysed with GraphPad PRISM 7 software (GraphPad Software Version 7, La Jolla, CA, USA, www.graphpad.com) and R (R Foundation for Statistical Computing, Vienna). 13 To calculate the interclass correlation coefficient (ICC), the ICC function from the interrater reliability (irr) library 14 was used. The model was built as a two-way setup with random column and row effects. The type was set to agreement between raters which yielded an ICC value with corresponding F-values and 95% confidence intervals for the model. A Kruskal–Wallis test was used to compare responses of the raters at different training levels. Results were assumed to be statistically significant when p < 0.05. To calculate of reliability between two different rater groups Fisher's Exact test was used.
Results
MGS set-up
In total, 609 pictures were selected random and scored for quality. Of these, 288 pictures fulfilled the described quality criteria for MGS scoring. For each animal, at least nine and up to 31 pictures, with a mean of 22 pictures/video (SD = 6.3) were selected as scorable. They represented an overall of 48.3% of the randomly generated pictures. Of the pictures in positions 1, 2, 3 and 4 in the rack (Fig. 1), 50.8, 48.1, 45.1 and 41.5% were scorable, respectively. There was no significant difference between the ability of the image to be scored and the position in the MGS setting (Fig. 3).
The image quality for each position (Pos.) of each Mouse Grimace Scale (MGS) box in the rack. There was no significant difference among all four positions in picture quality. One-way ANOVA, F (3, 15) = 0.1847.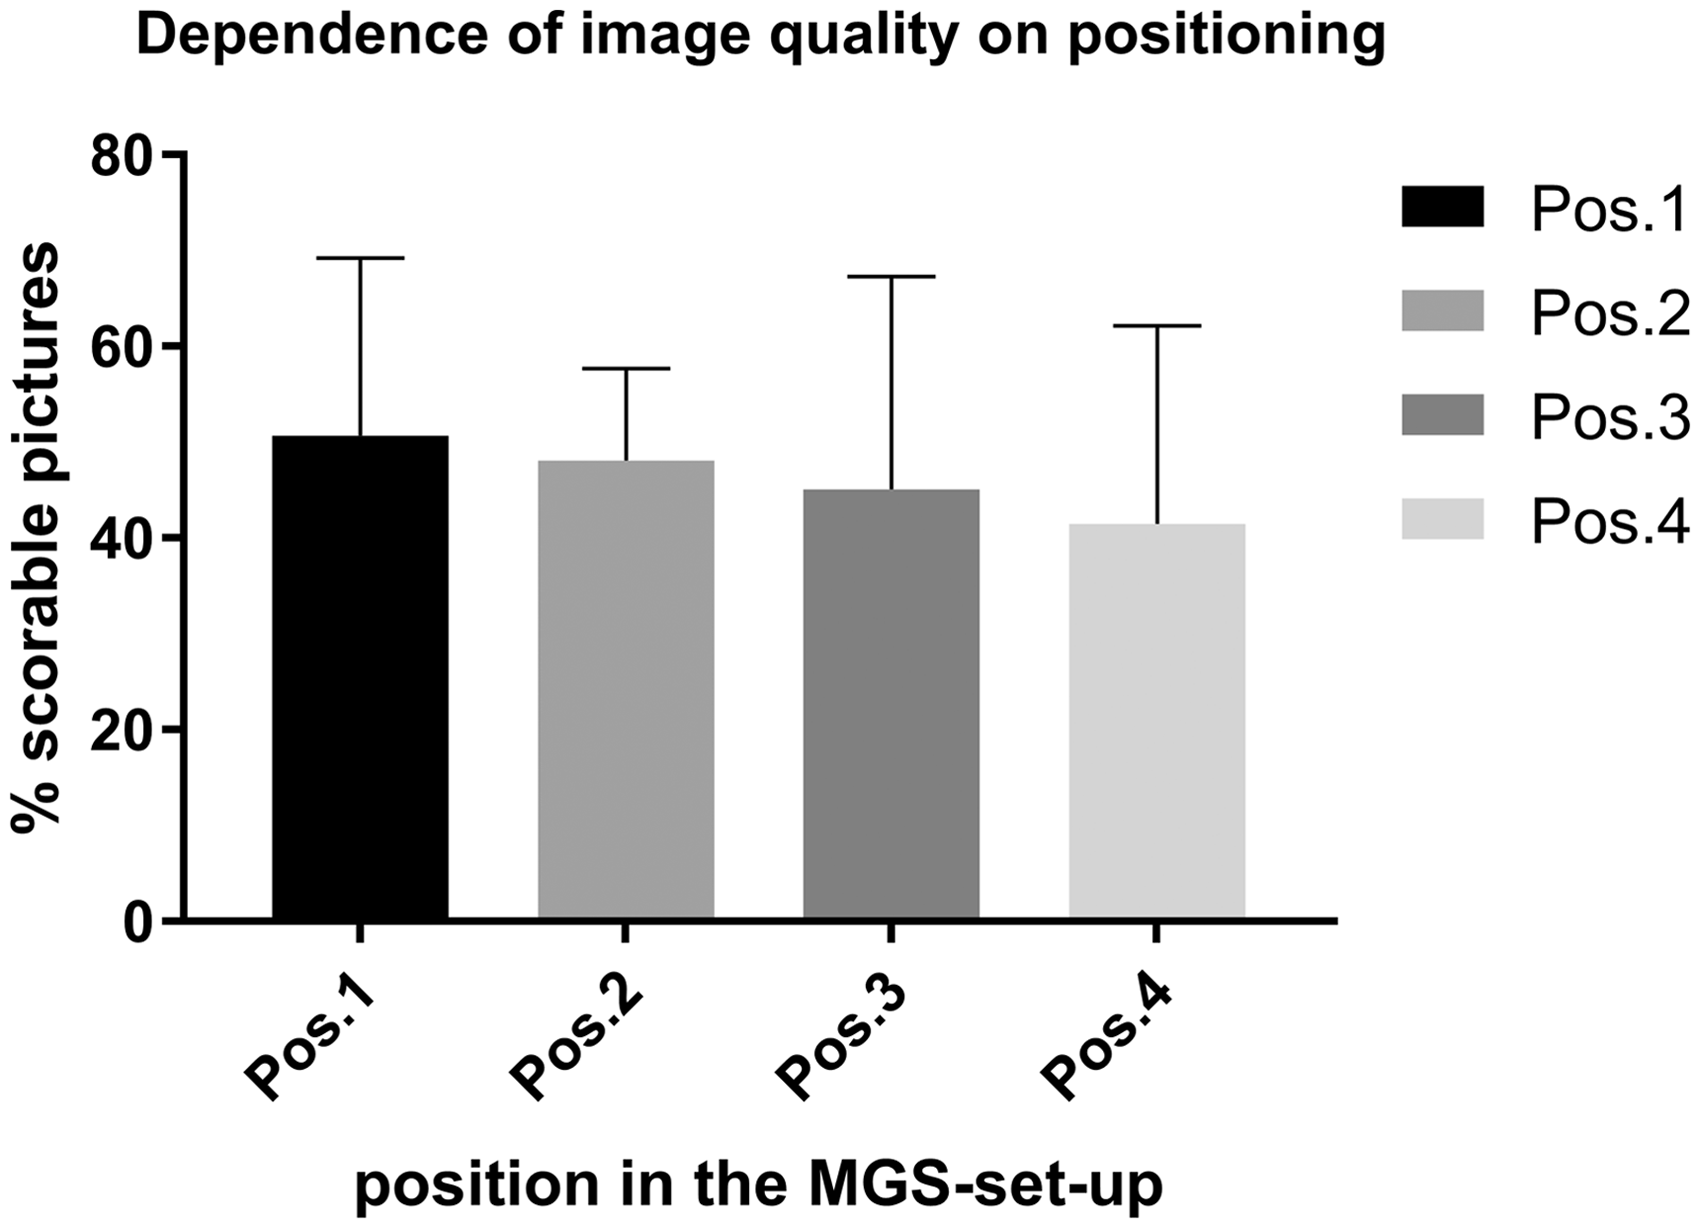
Irr analysis
Calculation of the Inter Class Correlation Value (ICC) between different rater groups.
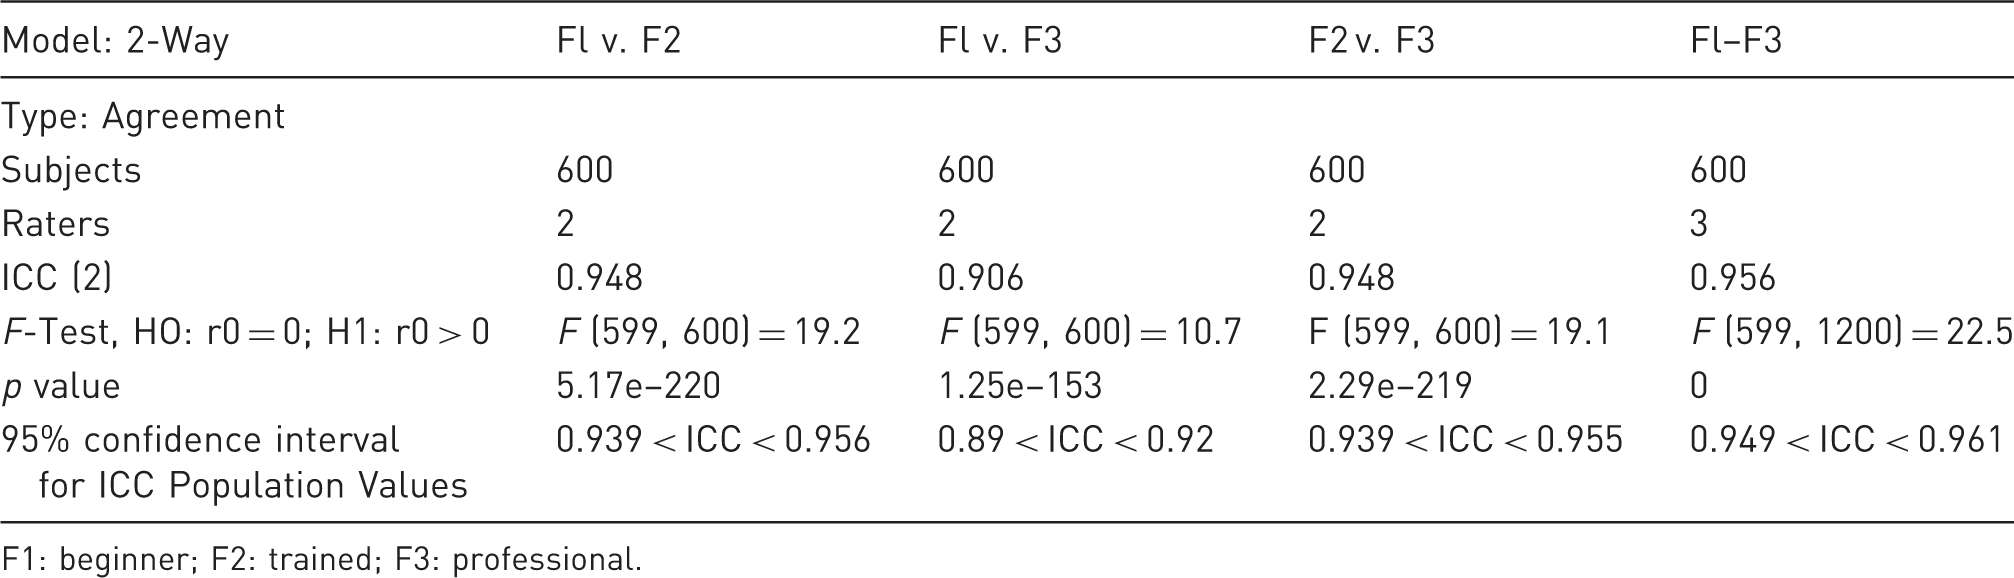
F1: beginner; F2: trained; F3: professional.
There was no significant difference between the distribution of the quality scoring points for the images and the different training levels (Fig. 4).
Comparison of the distribution quality of scoring points for pictures with regard to rater training levels. The Kruskal–Wallis test with 1 degree of freedom yielded a value of 1.7758; p = 0.1827.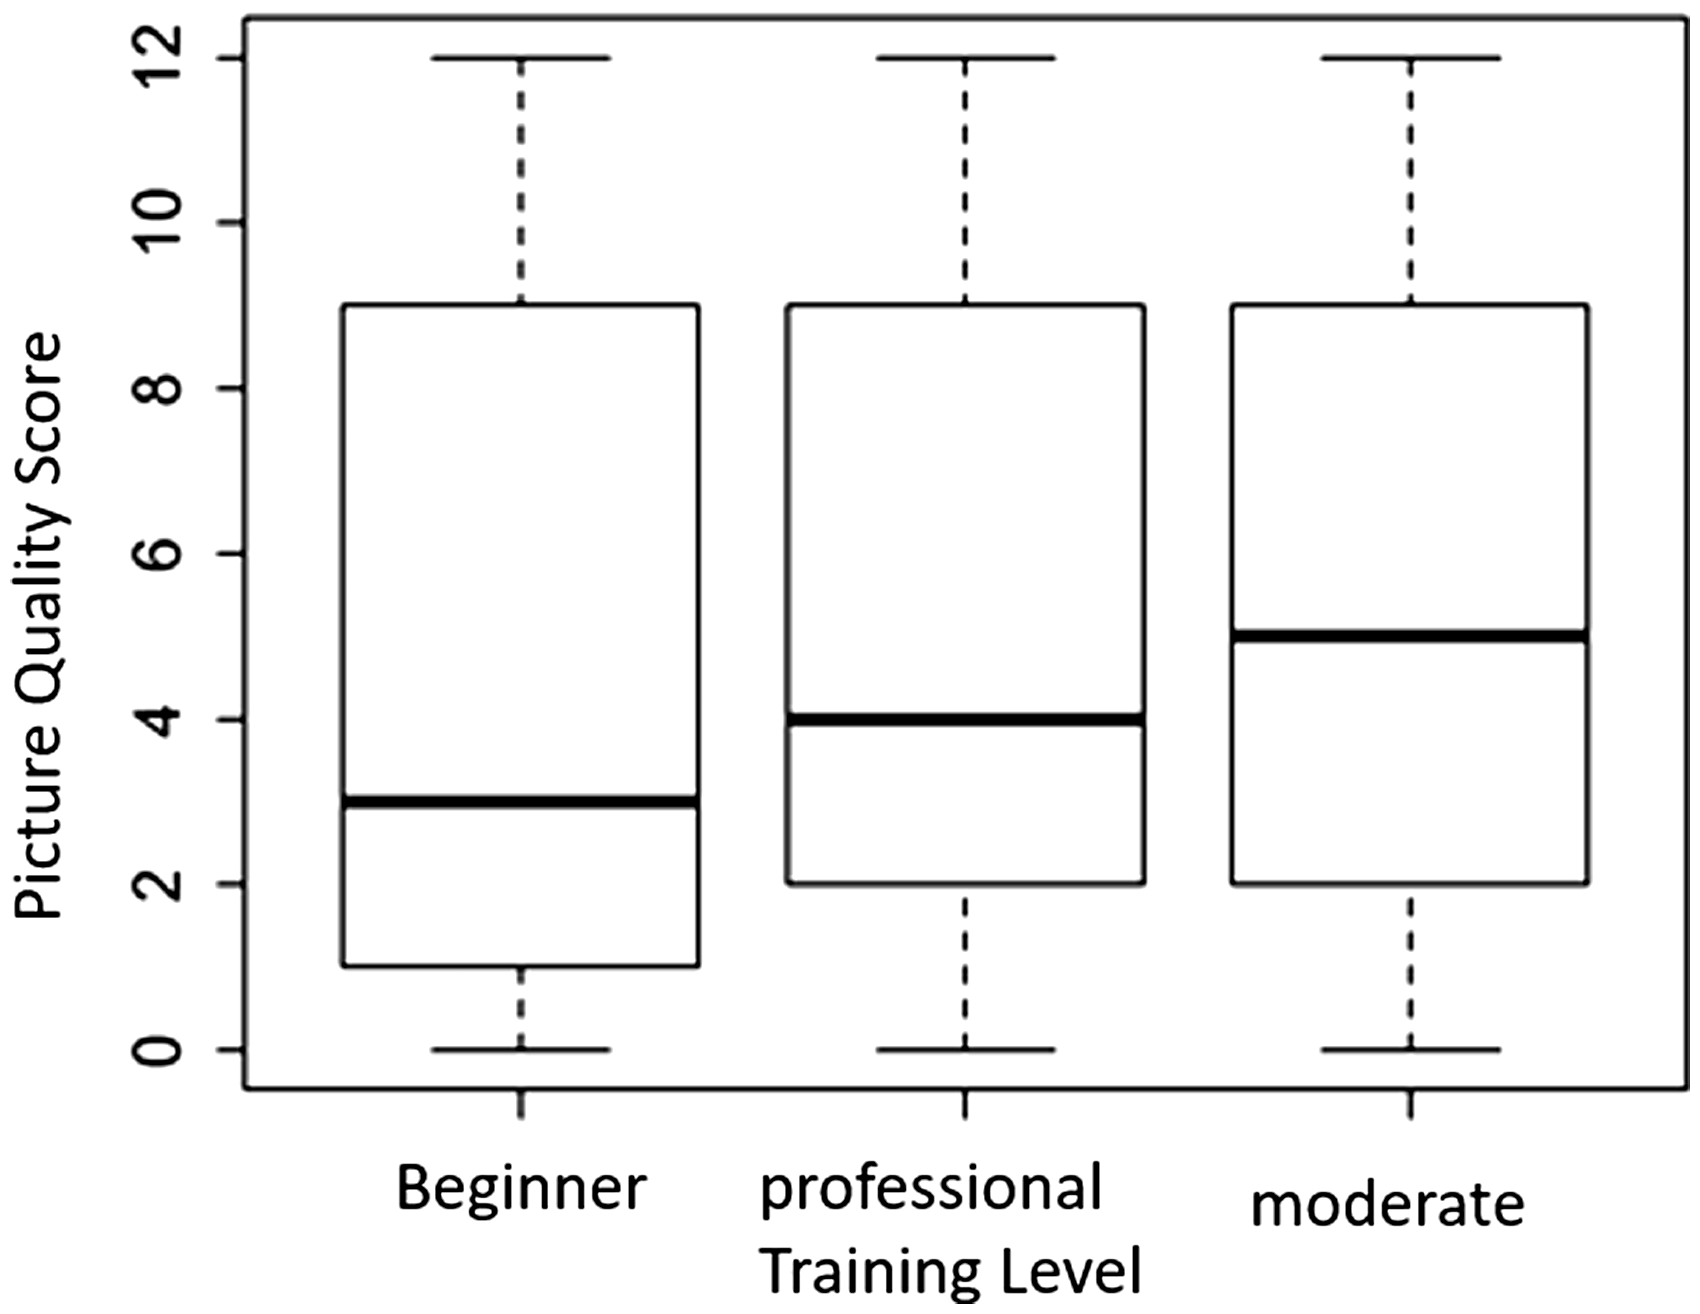
Analysis between irr and the algorithm
On comparing the scores produced by the algorithm and those by all nine raters, the average overall agreement (identical selected pictures) was 74.14 ± 1.86%. Data were analysed with Cohen's κ (Kappa) (Fig. 5).
16
The values for κ were calculated as follows for the comparing the scores produced by the algorithm and the scoring groups: on comparing the algorithm with the beginner group, κ = 0.427, on comparing with the group with medium-level training κ = 0.362, and on comparing with the professional group, κ = 0.449. Cohen's κ values can assume values between –1 and 1. In this study, Cohen's κ was considered as moderate when it was >0.410. Fisher's exact test was used to calculate the specificity and sensitivity of the algorithm against a professional rater; this test yielded a specificity of 0.84 and a sensitivity of 0.42 (data not shown).
Comparison of agreement between the algorithm and different training levels as well as the overall agreement. Data were analysed using Cohen's κ test.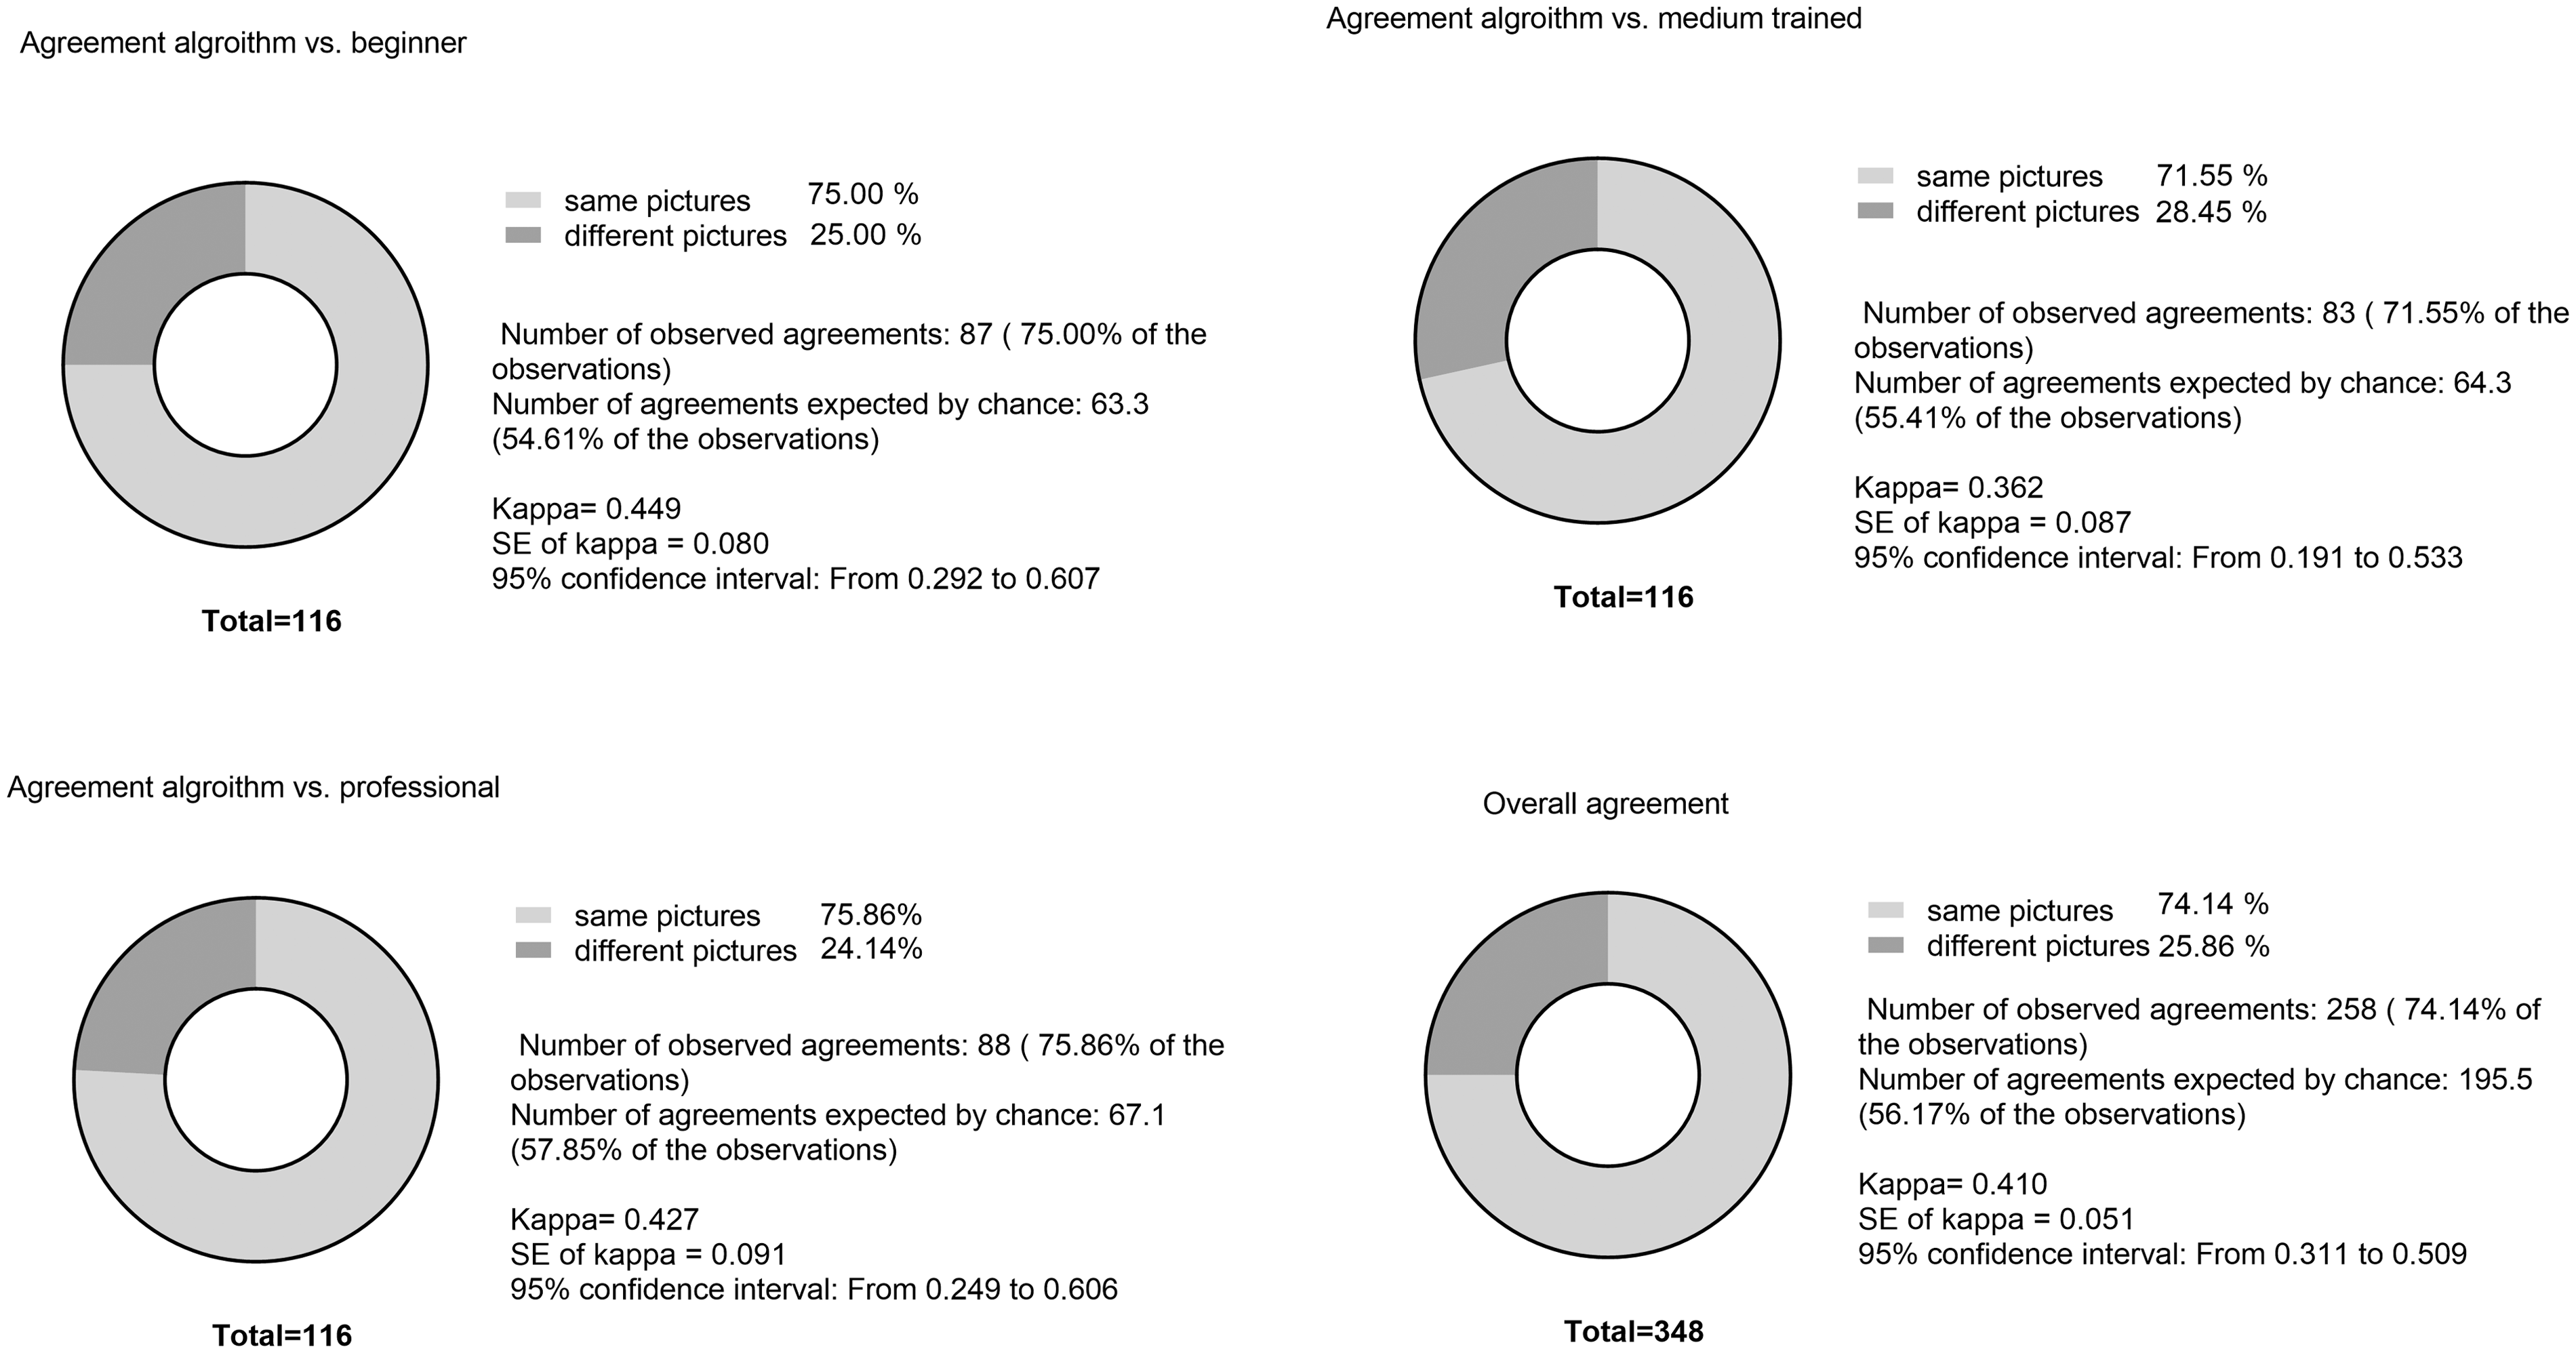
Discussion
Although the MGS is used often and is a recognized method for the classification of distress/pain, the implementation of MGS in different working groups varies. According to different studies in which MGS was implemented, there are multiple variations in the use and structure of the observation boxes, length of the film recordings and the timing of the image selection. For example, some raters use 80 × 80 × 80 mm3 photographic cubes and others film the animals inside the box used as photographic cuboid with dimensions of 22 × 29 × 39 cm3. 8
In several studies, the recording time ranged from 10 min to over 30 min and the selection time or criteria were often random or not specified.7–9
These variations in behaviour tests can have an effect on the comparability of results and, therefore, more animals are needed to validate the results. 17 This shows the need for standardization of these tests. In the various studies, the minimum recording time that the animals were filmed individually ranged between 3 and 10 min.7,17 In larger studies with more animals, the amount of filming time was multiplied by filming each individual animal, thus, the processing time would be radically increased with regard to manual cutting and scoring of images. In a similar manner, the Rodent Face Finder® extracts the images from 30 min videos for use in a manual evaluation, whereby the output images are then randomly inserted into a PowerPoint macro. 6 Matsymia et al. 9 and Sotocinal et al. 6 used the Rodent Face Finder® to identify white animals, which were recorded individually. Because the ‘C57BL/6N (“B6”) mice are one of the oldest and most widely used inbred strains in biomedical research’, 18 our aim was to implement image selection of animals with dark fur.
To reduce labour intensity as well as the stress level on the animal, we decreased the filming time from 30 to 10 min. 1 In addition, the animals were acclimatized by placement of the MGS box for 5 min into their home cage before the recordings were started. However, we decided against reducing the filming time further to <10 min; instead, we opted for a simultaneous recording of up to four animals. This decision was made to maintain a better overview of the behaviour of the animals during the recordings, and it was based on the fact that a recording time of <10 min is rarely reported. 17
Red foil on all long sides of the observation boxes prevented a view of the other animals. We could not visually detect any influence of the animals on each other with regard to altered or increased social interaction, such as rearing, leaning toward the other box, or increased sniffing behaviour, which was described by Kim et. al. as a response stimulus to other animals. 19 Moreover, an observation time of more than 12 min subjectively resulted in a visible increased respiration rate which was manifested by fogging on the front side of the observation boxes. A long observation period may, on one hand, result in increased exploratory movement of the animals in their boxes, with the consequence of less accurate pictures possible from the session. On the other hand, a too short observation period could increase the likelihood of picking random behaviours. A filming duration of 10 min was enough time to habituate the animals to the boxes with no observed increase in visible stress behaviour and to simultaneously obtain good pictures. In contrast to our 10-min filming protocol and automated image selection, manual live scoring was described by Miller and Leach. 7 In their study, the examiner scored the animal for 5 s during a 10-min observation period while sitting in front of the cage. In our view, personal observation for the live examination seems accurate but has two drawbacks: choosing an independent moment in a long period of 10 min increases the risk of bias and this method is highly observer-dependent and therefore highly subjective as well as time consuming. Because our 10-min recordings yielded several images, the random image selection, as opposed to manual selection, is independent of observer choice. Our results have demonstrated that almost 50% of the images randomly created with our set-up could be used for evaluation without further selection. This shows that the standardized set-up per se is a good basis for selecting the images. We were able to determine that visual blockage by a red transparent foil minimizes the mutual influence of animals. In addition, the foil allowed a better contrast of the animals' dark coat against the white background, but it still let enough light pass to brighten the MGS box. It is therefore possible to ameliorate the assessment of MGS criteria. When selecting the images automatically, we were able to show good agreement between the algorithm and manual image selection (Fig. 5).
To select the images with our protocol and the tool, an average manual processing time of 1.35 s per picture was required (data not shown). This corresponds to almost 21 times less time that a person would spend manually (28.2 s per picture) selecting the images and therefore can significantly reduce the labour and personal working time. The study by Matsumiya et al. also showed that automatic generation of images can lead to a reduction in selection bias and also to a significant decrease in labour intensity. 9
We are aware that only male animals used in a previous study were used to train the algorithm. The use of randomly selected animals from another study is in accordance with the 3R principle. However, intensive research has not revealed differences in grimace expression between female and male mice. We therefore conclude that the algorithm we developed may not be influenced by the sex of the animal.
Conclusion
Through automated image selection under specifically defined criteria with this set-up, images were selected independent of the personal assessment of the observer, and thus, selection bias was reduced. Nevertheless, pictures can be selected according to quality, but extraction from the video is random. The disadvantage is that deviations in behaviour in the video recordings cannot be identified. According to Amy L. Miller, this is a disadvantage of MGS scoring through image capture. It cannot be ruled out that the animal accidentally blinked or showed exploratory behaviour in the picture because it is a momentary picture. 7
Our set-up takescare of this problem as images in which the animals exhibited random movement behaviour, such as grooming or sniffing, are not selected. At the same time, the output can be varied as large as desired that the weighting of random momentary images is minimized. Although these measures can minimize incorrect selection, they cannot exclude it completely.
Another disadvantage of the MGS analysis is the strong manual inclusion in image evaluation. So far, even images selected by the algorithm still have to be evaluated manually. They can be displayed and evaluated randomly and blinded with the output of the tool, but an automatic evaluation is not yet possible for all MGS criteria. Although, if the set-up that we used minimized time spent selecting images and four animals could be observed simultaneously, the total time required for processing is adequate for long-term evaluation of severity, but it is not suitable for an acute decision about the animal's condition due to the time delay. 7
In the future, the work to be conducted should serve to generate MGS scores more on the basis of live video analyses in live scoring and to make it independent of time delay and observer. 20
Supplemental Material
LAN881655 Supplemental Material - Supplemental material for Improvement of the Mouse Grimace Scale set-up for implementing a semi-automated Mouse Grimace Scale scoring (Part 1)
Supplemental material, LAN881655 Supplemental Material for Improvement of the Mouse Grimace Scale set-up for implementing a semi-automated Mouse Grimace Scale scoring (Part 1) by Lisa Ernst, Marcin Kopaczka, Mareike Schulz, Steven R Talbot, L Zieglowski, M Meyer, S Bruch, Dorit Merhof and Rene H Tolba in Laboratory Animals
Footnotes
Acknowledgements
The authors thank the technical facility for the construction of the set-up parts and observation cages, the volunteers who contributed to the evaluation and the technical assistants for their support.
Declaration of Conflicting Interests
The author(s) declared no potential conflicts of interest with respect to the research, authorship and/or publication of this article.
Funding
The author(s) received no financial support for the research, authorship and/or publication of this article.
Supplemental Material
Supplemental material for this article is available online.
References
Supplementary Material
Please find the following supplemental material available below.
For Open Access articles published under a Creative Commons License, all supplemental material carries the same license as the article it is associated with.
For non-Open Access articles published, all supplemental material carries a non-exclusive license, and permission requests for re-use of supplemental material or any part of supplemental material shall be sent directly to the copyright owner as specified in the copyright notice associated with the article.