
Abstract
Severity assessment in animal models is a data-driven process. We therefore present a use case for building a repository for interlaboratory collaboration with the potential of uploading specific content, making group announcements and internal prepublication discussions. We clearly show that it is possible to offer such a structure with minimal effort and a basic understanding of web-based services, also taking into account the human factor in individual data collection. The FOR2591 Online Repository serves as a blueprint for other groups, so that one day not only will data sharing among consortium members be improved but the transition from the private to the persistent domain will also be easier.
Monitoring the well-being of animals and aberrance from it requires evidence-based multimodal techniques. 1 In the quest of searching for optimal indicators and variables, empirical methods are indispensable. As such, the combination of multivariate data for an unbiased assessment of well-being and severity categorisation requires advanced knowledge on statistical modelling. In this context, ‘Big Data’, ‘data mining’, ‘machine learning’ (ML) and ‘artificial intelligence’ (AI) are keywords researchers are often confronted with. Finding definitions for these fields is still a matter of ongoing research. In our opinion, however, AI is an unspecific word for largely automated (adaptive) computational problem solving, while ML takes a more direct approach, usually by finding optimal feature representations followed by classification/regression analysis. Whereas data mining applies algorithmic approaches to large data sets, Big Data is not innately connected to the prior keywords. Usually, the latter is largely defined by the five Vs (volume, variety, velocity, validity and value) and has no analytical qualities per se. These methods not only allow directed and on-point analyses of single animals but can lead to general models, for example describing severity levels. 2 The key issue here is data quality.
On a formal level, acquiring and evaluating experimental data are at the core of every empirical science. Therefore, a careful, structured and efficient handling of data stocks is crucial to gain new findings. In particular, data conservation is a key issue of safeguarding good scientific practice to ensure reproducibility of results at any time.
3
Standardised data handling is realised by means of a data management plan implementing the Curation Domain Model that splits the data life cycle into four phases called ‘domains’.
4
These are:
Private domain. This is the phase where research groups perform their experiments, collect primary data and decide whether it is worth further analysis at the group level. Group domain. This domain serves as data pool to collect data and share it with groups working on similar issues. Persistent domain: Here, a pre-selection and preparation for long-term conservation is performed. Access domain: The final stage of long-term data curation.
Private domains are under researchers’ responsibility, whereas long-term storage solutions require final definitions on data structures. So, the urgent task is to develop a repository structure to operate the group domain for severity assessment in animal models. In contrast to a conventional linear life cycle, this domain design allows for data to be reused at a very early stage nearly parallel to its primary usage. Collaborative work on a common data stock offers a large variety of additional analytical capabilities. Furthermore, the presence of, compared to usual scopes in animal science, large amounts of data may avoid redundant experiments and raises hopes of applying methods of computational KDD (Knowledge Discovery in Databases) in addition to classic meta-analyses.
In this report, we suggest an easy-to-use platform as a use case for data sharing, information distribution and knowledge pooling, making it available to a limited group of peers. In order to gain best value from scientific data, especially when animals are involved, strategies to combine multiple data sets need to be laid out. 5 Therefore, we will discuss some minor and major aspects of the development process of a repository for use in severity assessment and will focus on our experiences concerning compliance and interlaboratory data harmonisation.
Use case: Repository organisation
Objective and preliminary work
To harmonise qualitative scales and measurement procedures for severity assessment in different scenarios, it is crucial to collect and merge data from experiments of different design and methodology. The solution of choice would be a front-end controlled database system. Approaches to draw on solutions established in clinical research or own developments failed due to high usage complexity and requirements mismatch. So an intermediate solution is based on a repository containing data sets in files. The file format and the entire system is refined stepwise to prepare a final future database solution for standardised data.
Repository framework
The online repository FOR (FOR2591 Online Repository) runs as a sub-domain on https://for.severity-assessment.de. Sites will subsequently be shown as sub-paths in the format ‘./path’. On the ‘for’ sub-domain, a WordPress framework (current version 4.9.8) was installed followed by the Twenty Sixteen theme. Within WordPress, the following plugins are used: Contact Form 7, Embed Any Document, Password Protected, TinyMCE Advanced, VFB Pro and Wordfence Security. A basic tutorial can be found at https://learn.wordpress.com/. 6
General structure
The basic structure of the repository is that of a classic blog. This means that there are sites and posts within a content management system (CMS). Depending on relative domain state, data can be preliminary, sensitive or due to be published. So, data access is restricted to a need-to-know basis.
Static sites were used in structuring the repository, while posts contain the individual experimental information. Experimental data are linked and displayed as individual files to the respective post and are bundled project-wise as zip files on the general ‘./repository’ site. This flexible framework offers many advantages for project partners, since it allows easy publication and data sharing while maintaining readability and structure. In addition, it limits the required level of database proficiency for the actual users. The comment function allows easy information sharing and discussion. This can be used rather extensively if required.
The repository starts with a splash screen giving an overview of the different options on the site. Users can decide whether they want to ‘visit the data repository and download raw data’, ‘learn about the individual projects’, ‘read more about FOR’, ‘download FORm for uploading data’ or ‘contact the admin’. This meta-structure is also accessible via the main menu at the top of the website (Figure 1). The menu structure and definition have to be defined within the CMS. If the repository becomes more complex, the overall structure of the menu can easily be adapted.
General structure of the FOR repository, with links to a separated upload/information site and specific project folders. Each research item has a connection to the actual repository where all files can be downloaded as a bundle.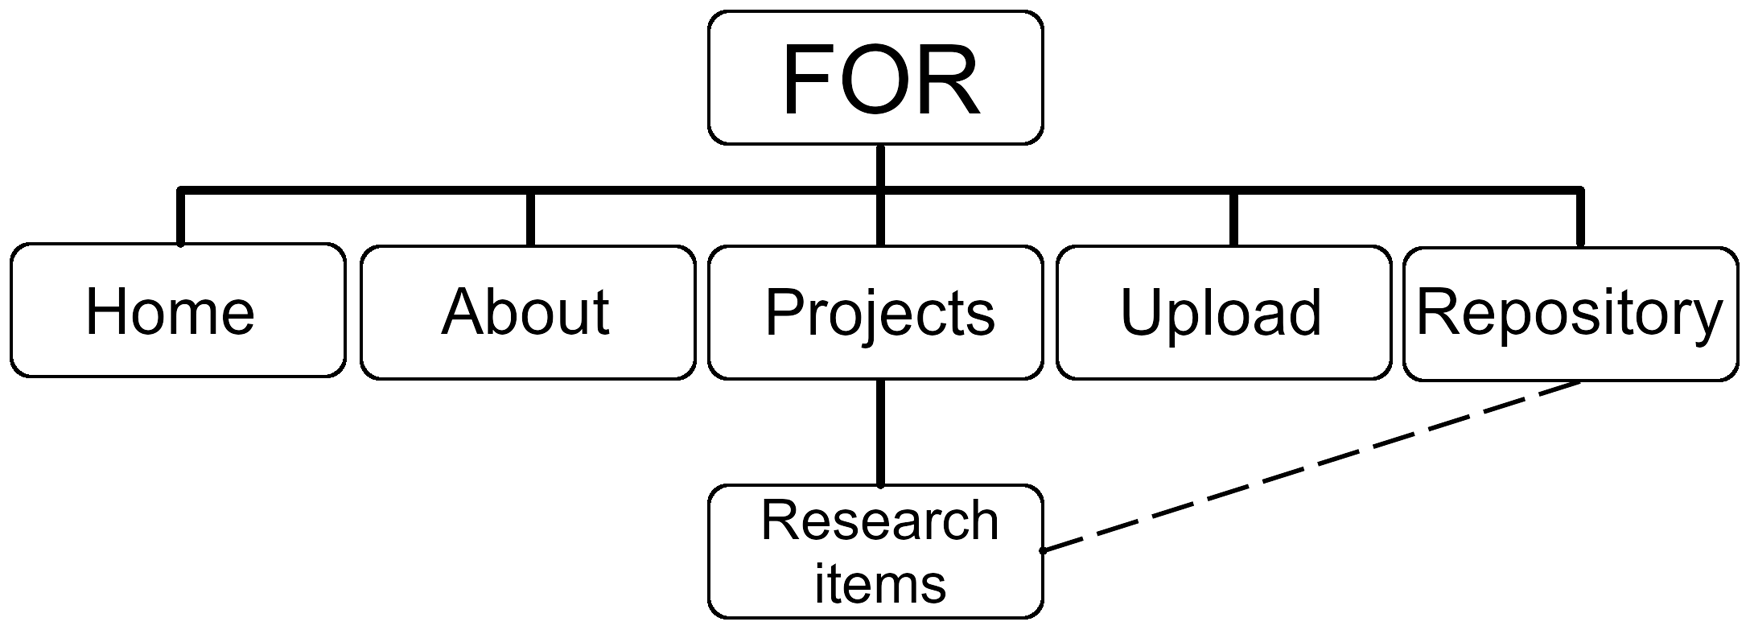
In a widget section, actual news is shown (i.e. if there is an active data collection call, a new publication, a new meeting, etc.). Any updates to the data collection sheet (FORm) and so on are also shown here. Further, the user has the option to use a search field to find posts or data of interest. In the lower section of the widget area, the last top five posts/projects are listed, followed by a list of keywords together with the corresponding topic frequencies.
Data repository organisation
Data organisation in the repository is twofold. First, all uploaded data are stored as *.txt and are bundled in *.zip files under ‘./repository’. Individual files can be downloaded directly by clicking on the provided links. For later organisation purposes, a tag is provided which makes it easier to find project-specific experiments when the repository becomes larger. In addition, there is a search function for finding distinct keywords such as work groups, experimental topics and parameters using the metadata of the included data sets. A list of categories in the widget area can be used to narrow down the search for keywords. Further, a second link connects the data with the actual project description. Here, each study is described according to the entries n the ‘information tab’ of the current version of FORm. Below the actual project description, the corresponding data can be downloaded directly as *.txt files.
Data upload
Data upload to the repository is a managed process. The repository’s admin reviews and curates any provided data before bringing it to the website by harmonising headers in terms of variable names and time formats, cleaning tables from comments and restructuring potential tabular misfits. The ‘./data-upload’ section therefore contains information on how to structure and upload data in general. Special care is taken in naming the uploaded files systematically. The naming pattern was set to ‘workgroup_project_subproject_year_month_day.xlsx’. However, in the repository, this naming was not used. Post IDs were set to individual project names. This has proven to be more understandable by users from different backgrounds. Final files are uploaded by the admin via file transfer protocol (ftp) to the server and hyperlinked to the meta-information of the respective study.
Use case: Data collection
In order to harmonise the data-collection process, a form (FORm) was developed in several steps. FORm in its actual version (v1.1.1) is provided with the supplemental material of this report or can be downloaded from the repository. All project partners were required to organise their data in this MS Excel speadsheet. The file consists of several sub-tabs to organise the data-collection process further. The first tab (‘readme’) contains concise information on how to format data in the query sheets. It is followed by a tab with general information on the study (who, how, where, etc.) and was finally upgraded with a section containing an excerpt for the ARRIVE guidelines. In addition, information on ethical statements, severity grading, funding and conflicts of interests are covered so that each upload has sufficient metadata and annotations available.
Example for a data line-up in long format. Animals have multiple rows, one for each time point. Variables are stored column-wise for each treatment.
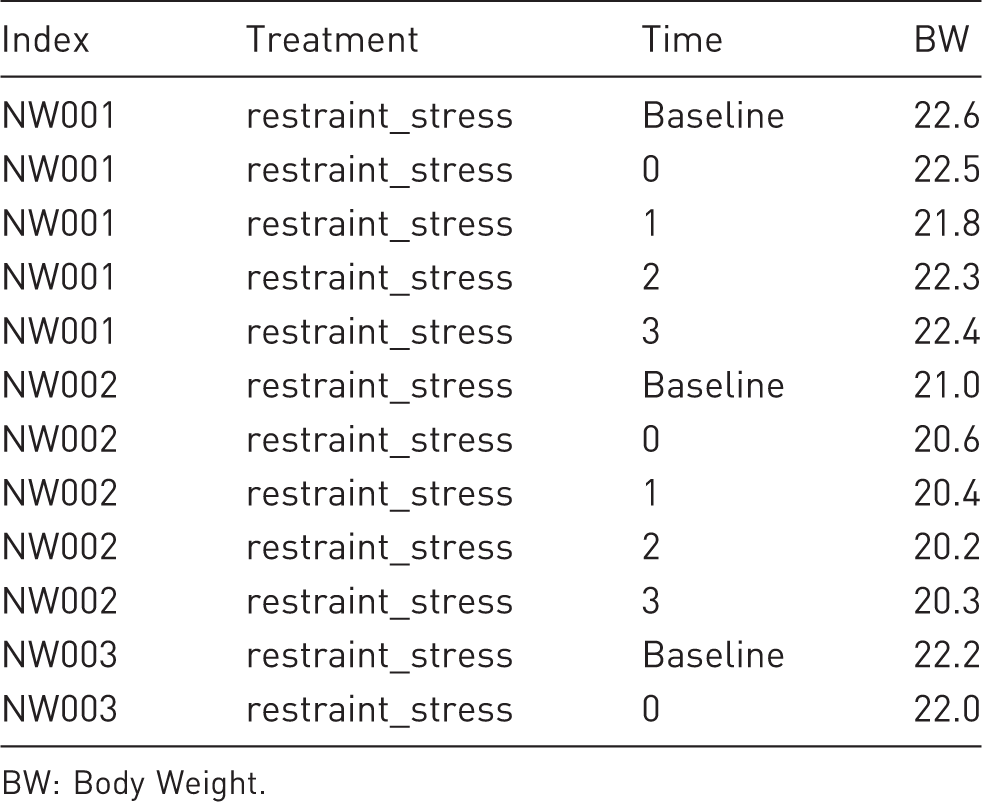
BW: Body Weight.
FORm also contains a section for explanatory plots and analyses performed by the actual project partner, as well as a comment section. In case information in the data tabs is not sufficient, a sample information file (SIF) can be provided as a separate tab. Here, additional variables such as sex, age or further treatments can be entered. The FOR2591 identification number serves as a common terminology in all data items. At the time of publication, FOR contains 14 data sets from studies originating from various groups of the consortium. As the focus of the first survey lies on assessing the impact of severity on body weight, the current structure contains 215,878 singular items on this specific matter.
Discussion
A large data pool gives the opportunity to develop new KDD strategies. Maybe it can even serve as a blueprint for future Big Data solutions. The Big Data hype with its promises of better insights into all sorts of analytical questions is long over. As it became somewhat of a daily reality, the possibilities of Big Data were accompanied by evolutions in the fields of machine and deep learning, which now offer not only interesting applications for our daily lives, but also new insights for science itself.
However, specifically in animal sciences, with few exceptions, we have not even arrived at the stage of Big Data. The reasons for this are manifold. One major factor is certainly that storage solutions are usually limited to ‘in-house’ applications (private domain) and are only shared after publication (group/persistent domain). When publication goals are achieved, the interest in contributing data to larger databases is meagre, since this appears to offer no further benefit, as was exemplarily shown in a study by Campbell et al. 7 The paradigm of publishing data only once puts even more pressure on this system.
Furthermore, there are no easy-to-understand and thorough concepts on how to analyse and rate experimental data on a large scale – let alone giving the data translational meaning. This includes the quest for ‘the best parameter’ indicating potential severity in animals. Although meta-analyses tools and statistical concepts are available, it still remains rather unclear how these relate to daily routines and animal well-being. Nevertheless, one promising approach lies in the emerging importance and use of systematic reviews and risk analysis. These techniques give insights into animal experiments by using already published data and statistics, eventually allowing a refinement, reduction or replacement of animals (3R principle by Russel and Burch 8 ). In reality, many different obstacles remain which make it arduous to establish unified data-storage solutions for larger projects and consortiums, as the specific needs are highly individual. Cloud-based commercial solutions such as labfolder exist, but they offer limited control over content (management) and repository structure and may require additional fees. 9
A joint research repository is a first step in the development of a regular database for experimental data. However, an actual database requires knowledge not only on building the actual framework but also on query design and getting the most out of it. Furthermore, there is no standardised method of communicating information between scientists or data sets. Therefore, a blog-like structure offers the optimal solution in covering both sharing data and allowing communication among peers. The format is also well suited for sharing the uploaded data, since only a limited set of variables are collected. There is simply no need to build an oversized relational database for the given complexity of data. In addition, during the whole process, the aim was to learn as much as possible about the data-collection process and the dynamics of a scientific consortium.
One additional benefit of a CMS is its relative ease of use. Most users are intuitively familiar with blog navigation, since many of us use the Internet every day. For most people, it is a fact of life to retrieve information from websites such as FOR. This is a major advantage compared to regular databases. Furthermore, it is a great platform for sharing news among project partners.
Challenges and disadvantages
Of course, there are also some disadvantages in using a CMS. First, there needs to be an administrator to run and update the system. This requires some training in CMS (e.g. WordPress, Joomla, and others). Some experience with servers and ftp protocols is also certainly helpful for uploading files and changing php and CSS files. Setting up an environment such as FOR requires a hosting process, and the risk of getting hacked is substantial for popular CMS.
Managing the content is another obstacle. Data provided by project partners are usually very variable. Even if different labs measure the same outcomes, they will invent unpredictable ways of data collection and interpretation, even though standard operating procedures (SOPs) are implemented and in spite of FORm’s attempt to provide a mutual standard for data collection. In our experience, occurring variance in data collection still has to be harmonised manually by the admin and requires an active communication role, even though people have agreed to use standardised procedures. Scientists will have to be called, emailed or asked to change and adapt the provided data until everything is unified. This has proven to be one of the more work-intense steps in building the repository. This is particularly true for data deriving from non-invasive imaging, where raw data are often difficult to export and read. Even the reconstruction and storage of volumetric image data generate a high device manufacturer-dependent heterogeneity. Furthermore, imaging data consume significant storage space. Thus, so far, only selected images or the quantitative results of image analyses are transferred into the FOR repository, and the raw and volumetric data are stored on separate servers at our universities. In this context, we plan to integrate a new file format specifically designed to store longitudinal multimodal image data. This standardised and open-file format includes a cryptographic hash to ensure data integrity in a provable and legally accepted way, provides fast and efficient image compression, and was developed in cooperation with several small-animal imaging hardware manufacturers and image-analysis software companies. 10
A data dictionary usually helps with the definition of variables so that the collection process is unified. In FOR, the data dictionary was introduced rather late in the whole process. Therefore, it is highly recommended to define variables right at the beginning of a project so that format, type and scale of variables are transparent. But even if such a dictionary is available, users will still be very ingenious at misinterpreting its meaning. A practical approach for structuring larger data projects was described by Wulf et al. 11 A systemised nomenclature such as SNOMED-CT 12 may also help in structuring systematic data formats.
Maintaining data quality over time is important as well. Data degrade over time, since new or supplemental data give new insights. Another important factor in data degradation is insufficient documentation and avoidance of commonly accepted community standards for data collection. Therefore, it cannot be stressed enough that rigorous standardisation and harmonisation rules must be adhered to by all project partners. Further, the collection of sufficient metadata is of the utmost importance for providing ongoing and long-lasting data quality (e.g. for potential reuse). Scientists and admin will occasionally have to change or update the data. A clear protocol or workflow for this is important.
Data format and harmonisation
Tabular data are stored in the long format because this is the favoured structure for data analysis. For users, data entry is explained in detail in FORm, as well as in an extensive tutorial within the repository. Further, a harmonised data dictionary is used to standardise, for example, variable names.
Furthermore, there are some aspects which cannot be solved by data science. Experiments often differ in individual set-up parameters such as different time points, fundamental experimental procedures and conditions. Normally, this is regulated by SOPs which every consortium member was obliged to follow and which can be found on the internal section of https://severity-assessment.de. However, even if there were attempts at standardisation, variation remained. This is not easy to document because some of these variations are not apparently visible in the raw data. These potential experimental confounders are an inherent weakness of every data-collection process. Special care should always be taken by all consortium members and admin not only in controlling data quality itself, but also in gaining knowledge on how data were generated in the first place. To conquer general bias in data collection, FORm was invented and curated. It also offers a flexible way of adjusting to individual needs if, for example, a member requires fields for additional parameters. Over the whole data-collection period, FORm was continuously improved. Changes were made public using the information widgets in the repository.
Pitfalls in data collection
One major factor in data collection for severity assessment is humans. Ease of use is a central topic to lower inhibition thresholds to join collaborative work. Managing compliance is an issue in the data-collection process. It is essential to establish clear and concise communication protocols for the process as well as deadlines. FOR gave ample possibilities to study these effects, which can hardly be generalised because they are highly individual. Simplifying the procedures during the whole process will benefit all members.
Until then, we will also continue to approach KDD and data mining in further publications. The quality and quantity of collected data are sufficient to develop and validate algorithms able to perform standardised and automated analyses on data sets. We are aiming at the identification of parameters suitable to measure severity of interventions.
Conclusion
Although data collection is a demanding process, the final result is worth the effort. With the present use case of a working repository, we have shown a way for a consortium of researchers to share data by using a Small Data approach. We provide a clear structure of communication and data format while offering general advice and examples for future work groups. This we deem as a first step towards planning larger databases so that, one day, animal sciences will be on its way to Big Data in terms of shared experimental data. There is still a long way to go until recent methods of deep learning and so on can be used on combined harmonised data (e.g. in severity estimation). However, there is still much to be learned from behavioural, physiological and biochemical data and even more so when methods of ML and mathematical modelling are applied. All these new methods require very large amounts of data to enable generalisation. Our approach of concentrating on a Small Data approach is a first tap into this topic while offering great usability for all contributing scientists.
Supplemental Material
Supplemental material for Design of a joint research data platform: A use case for severity assessment
Supplemental Material for Design of a joint research data platform: A use case for severity assessment by Steven R Talbot, Stefan Bruch, Fabian Kießling, Michael Marschollek, Branco Jandric, René H Tolba and André Bleich in Laboratory Animals
Footnotes
Acknowledgements
We thank all FOR 2591 scientists and contributors who shared their data and made this use case possible.
Declaration of Conflicting Interests
The author(s) declared no potential conflicts of interest with respect to the research, authorship and/or publication of this article.
Funding
The author(s) disclosed receipt of the following financial support for the research, authorship, and/or publication of this article: This work was funded by the German Research Council, Germany (Deutsche Forschungsgemeinschaft) FOR 2591 (FKZ Talbot: Bl953/9-1, Bruch: To542/6-1, Kiessling: Ki1072/20-1, Tolba: To542/5-1 and To542/6-1, Bleich: Bl953/9-1 and Bl953/10-1).
References
Supplementary Material
Please find the following supplemental material available below.
For Open Access articles published under a Creative Commons License, all supplemental material carries the same license as the article it is associated with.
For non-Open Access articles published, all supplemental material carries a non-exclusive license, and permission requests for re-use of supplemental material or any part of supplemental material shall be sent directly to the copyright owner as specified in the copyright notice associated with the article.