
Abstract
In vivo micro-computed tomography (CT) imaging allows longitudinal studies of pulmonary neoplasms in genetically engineered mouse models. Respiratory gating increases the accuracy of lung tumor measurements but lengthens anesthesia time in animals that may be at increased risk for complications. We hypothesized that semiautomated, volumetric, and linear tumor measurements performed in micro-CT images from non-gated scans would have correlation with histological findings. Primary lung tumors were induced in eight FVB mice with two transgenes (FVB/N-Tg(tetO-Kras2)12Hev/J; FVB.Cg-Tg(Scgb1a1-rtTA)1Jaw/J). Non-gated micro-CT scans were performed and the lungs were subsequently harvested. In the acquired micro-CT scans, measurements of all identified tumors were determined using the following methods: semiautomated three-dimensional (3D) volume, ellipsoid volume, Response Evaluation Criteria in Solid Tumors (RECIST; sum of largest axial (i.e., transverse) diameter from five tumors), sum of largest axial diameters from all tumors (modified RECIST), and average axial diameter. For histological analysis, all five lung lobes were analyzed and the tumor area was summed from measurements made on five histological sections that were 300 µm apart from each other (covering a total depth of 1200 µm). All micro-CT measurement methods had very strong correlation with histological tumor burden (Pearson’s correlation coefficient, 0.87 (p = 0.0053) −0.98 (p < 0.0001)). The only methods found to have different correlations were the semiautomated 3D method and the RECIST method (Williams’ test for dependent overlapping correlations, p = 0.013). Our results suggest quantification of lung tumor burden from non-gated micro-CT imaging will reflect histological differences between mice and can therefore be used for between-group comparisons or when concerns about systemic health of research animals may limit lengthy anesthetic procedures.
Introduction
Primary lung cancer has been the leading cause of death attributed to cancer in humans worldwide since the mid-20th century, with 222,500 new cases and 155,870 attributable deaths estimated for 2017 just in the United States of America (USA).1,2 The use of genetically engineered mouse models (GEMMs) is becoming standard in pulmonary cancer research. 3 Weaknesses of xenograft models that use cancer cell lines include biologic behavior that may vary from the parent tumor, lack of heterogeneity in the tumor cell population, and the necessity of evaluating tumor growth in the setting of a compromised immune system. In contrast, lung cancer that develops in GEMMs does so in an immune-competent environment in a spontaneous and endemic fashion. 4 As opposed to ex vivo or necropsy studies, the use of in vivo diagnostic imaging methods allows longitudinal studies of tumor development and drug response. In addition to allowing individual tumors to be followed over time, and thus strengthening the statistical analysis of drug responses, this strategy shortens overall experiment time periods and greatly reduces animal numbers and expenses associated with the production and maintenance of GEMM colonies.3,5–8
In clinical oncology research, the progression of solid tumors is monitored with axial diameter measurements and reported following the Response Evaluation Criteria in Solid Tumors (RECIST).9–13 In contrast with clinical practice, where the goal may be to identify precise information about an individual patient, the finding of interest in biomedical cancer research is often the sum differences between two groups (e.g., wild type or mutated genotype). Computed tomography (CT) is generally the preferred imaging modality for monitoring lung tumors, given the inherent high contrast resolution of the thoracic cavity and measurement reproducibility, although radiation exposure is a concern.13–15 In order to accomplish smaller scale imaging as required for mouse models, micro-CT instruments have modifications that maximize spatial resolution and improve signal-to-noise ratios. 15 In GEMMs, micro-CT imaging techniques currently allow detection of tumors below 1 mm3, and with specific scanners, workloads larger than 100 mice/day can be imaged.7,14 Various methods have been described to measure and report the pulmonary tumor burden of GEMMs. For micro-CT analysis, these have included performing multiplanar and three-dimensional (3D) reconstructions for individual tumor contouring and volume calculations, ellipsoid volume calculations, determining combined tumor and vasculature volume, semiautomated quantification, tumor diameter measurements, counting tumor number, and monitoring aerated lung volume.7,8,14,16–21 Histological analysis has included evaluation of serial sections in either one or multiple lung lobes.7,14 Authors generally use one micro-CT analysis method only, and the various methods have not been compared rigorously. Limitations of published information correlating micro-CT findings with histology include correlation of tumors from limited numbers of mice, lack of thorough statistical analysis, correlation of tumor location only and not size, and evaluation of tumors in only one area of the lung.7,14,16,20,22
Methods to improve the precision and accuracy of lung tumor measurements from an acquisition point of view include the use of respiratory-gated micro-CT and contrast media. Respiratory gating can result in nearly motion artifact-free images and can be achieved by the use of invasive and non-invasive methods.5,8,15,19,23 These techniques increased the conspicuity and number of detected tumors in micro-CT images, but still missed some extremely small tumors that were detectable with histology.5,6,23 Both prospective6,23–26 and retrospective27–31 respiratory gating techniques have been published, with different authors using custom-made or commercially available software. However, to our knowledge, the retrospective gating techniques have not been validated in tumor-bearing mouse models. The use of standard intravenous iodinated contrast media is limited by the extremely short biological half-life of these materials in laboratory animals, attributed to their extremely high cardiac output. 23 To overcome this limitation, a liposomal-iodinated contrast medium and gold/iodine nanoparticle based dual-energy (spectral) CT have been described,19,32 although the extent to which these improve analysis remains unknown.
Imaging of GEMMs may occur in mice whose health is systemically compromised from either an advanced disease burden or secondary to expected side effects from drug treatment (e.g., myelosuppression and diarrhea from cytotoxic chemotherapy). Although respiratory gating can be used to increase the accuracy of pulmonary micro-CT findings, anesthesia time is much longer with a prospectively gated scan (∼40 min) than with a retrospectively gated scan (30 s to 15 min) or a standard non-gated scan (∼10 min).14,27,30,33 This lengthy anesthesia may further stress the research animals, particularly in light of having reduced lung ventilatory capacity from pulmonary neoplasms, and thus contribute to morbidity and mortality, which may be as high as 30% when protocols requiring intubation are initially being developed. 8 For similar concerns, researchers may elect not to further manipulate the animals with administration of contrast media. We therefore sought to determine if volumetric and linear measurements from micro-CT images obtained without respiratory gating would correlate with histological assessment of tumor burden in a GEMM of non-small cell lung cancer (NSCLC). NSCLC is the most common type of lung cancer, and we evaluated a mouse model with mutated Kras, which is the most frequently mutated oncogene in NSCLC. 34 An additional goal of our study was to compare multiple volumetric and linear measurement methods. Our hypothesis was that both volumetric and linear measurements from micro-CT images obtained without respiratory gating would correlate with histological assessment of tumor burden.
Animals
A total of eight adult mice were used in this research study. Mice were produced from intercrosses of transgenic mice originally obtained from The Jackson Laboratory (Bar Harbor, Maine, USA) (FVB/N-Tg(tetO-Kras2)12Hev/J, Stock number 004375; and, FVB.Cg-Tg(Scgb1a1-rtTA)1Jaw/J, Stock number 006222) and mice with partial Hus1 deficiency obtained from Dr Robert Weiss at Cornell University, NY, USA (Hus1+/neo and Hus1+/Δ 1 n ).35,36 Same sex litter mates were housed together in individually ventilated cages with two or four mice per cage. All mice were maintained on a regular diurnal lighting cycle (12:12 light:dark) with ad libitum access to food (7012 Harlan Teklad LM-485 Mouse/Rat Sterilizable Diet) and water. Chopped corn cob was used as bedding. Environmental enrichment included nesting material (Nestlets, Ancare, Bellmore, NY, USA), PVC pipe, and shelter (Refuge XKA-2450-087, Ketchum Manufacturing Inc., Brockville, Ontario, Canada). Mice were housed under broken barrier-specific pathogen-free conditions in the Transgenic Mouse Core Facility of Cornell University, accredited by AAALAC (The Association for Assessment and Accreditation of Laboratory Animal Care International). Animal care occurred in accordance with Guide for the Care and Use of Laboratory Animals. 37 The study protocol was approved by the Cornell University Institutional Animal Care and Use Committee, NY, USA (IACUC, protocol #2011-0093).
Materials and methods
Lung tumor induction
Primary lung tumors were induced as previously described with reverse-tetracycline transactivator protein in type II alveolar epithelial cells and a tetracycline-activated oncogenic Kras4bG 12 D allele. 34 Through interbreeding, some mice also had partial Hus1 impairment (Hus1neo/Δ 1 n ). 36 The study population included six males (Hus1neo/Δ 1 n , n = 3; Hus1+/neo, n = 3; 14–15 months old) and two females (Hus1+/neo, 12–14 months old). This study population was a subset of a larger population that was part of a parallel study evaluating lung tumorigenesis and sensitivity to cytotoxic cisplatin chemotherapy. Selection was simply numerical based on age/date of birth – the first eight mice from the larger study were analyzed in this initial study. Mice were chosen such that four mice had tissues harvested 1 week after cisplatin treatment, as described below, and four mice had tissues harvested 3 weeks after cisplatin treatment. Due to availability issues that were not part of our experimental design, only males were evaluated 1 week after cisplatin treatment. Both sexes were evaluated 3 weeks after cisplatin, and we purposefully included equal numbers of both. Baseline scans were performed when we suspected mice would have at least one tumor that was 2 mm in diameter. This timing (10–11 months after oncogene induction) was determined based on preliminary data collected from other mice that were not part of this study population (data not shown).
Treatment with cisplatin
Data reported here were generated in parallel to a larger study evaluating lung tumorigenesis and sensitivity to cytotoxic cisplatin chemotherapy. Baseline micro-CT scans were obtained after 10–11 months of Kras4bG 12 D induction. The following day, all mice received a single intraperitoneal dose of cisplatin (males, 12.75 mg/kg; females, 11.4 mg/kg). Cisplatin was freshly prepared in sterile phosphate buffered saline (Sigma, MO, USA) at a concentration of 1 mg/ml and sterile-filtered (Acrodisc® Syringe Filter, 0.2 µm pore) prior to administration. Following treatment with cisplatin, all mice were monitored by research staff at a minimum of once daily; body weights were recorded daily, and all cages received fresh wet food daily. At 1 week later, four mice (Hus1neo/Δ 1 n , male, n = 2; Hus1+/neo, male, n = 2) had another micro-CT scan evaluated prior to euthanasia and tissue collection. The other four mice (Hus1neo/Δ 1 n , male, n = 1; Hus1+/neo, male, n = 1; Hus1+/neo, female, n = 2) were re-evaluated via micro-CT 3 weeks after cisplatin treatment and subsequently euthanized for tissue collection.
High-resolution micro-CT acquisition of the thorax
The non-gated, high-resolution micro-CT image data were acquired through the Cornell University Biotechnology Research Center, with a GE eXplore CT-120 micro-CT scanner (GE Healthcare, London, ON, Canada). The micro-CT images were acquired in sternal position and under general anesthesia. The micro-CT acquisition parameters were as follows: tube voltage 80 kVp, tube current 30 mA, exposure time 32 msec, and 800 frames per scan. The time for tube rotation between frames was slightly less than 1 s, with a total scan time of about 10 min per mouse. Image data sets were reconstructed using 26.0 × 47.0 mm field of view, variable matrix size (544 × 580 to 588 × 608) with constant pixel size (0.05 mm), 0.05 mm slice thickness, and a default Feldkamp’s filtered back-projection algorithm. 38
Anesthesia
In order to minimize hypothermia related to anesthesia, cages were removed from the individually ventilated cage racks for a minimum of 10 min pre-anesthesia and remained off-rack for a minimum of 10 min post-anesthesia. Anesthesia was induced in an induction chamber using isoflurane with the oxygen flow meter between 0.5–1.0 Liter/min and the vaporizer at 3–5%. Pedal withdrawal and palpebral reflexes were checked to ensure an appropriate plane of anesthesia was obtained. Sterile ophthalmic lubricant was applied once the appropriate plane of anesthesia was reached. Anesthesia was maintained during the scan with use of a nose cone and a vaporizer setting of 1–3%. Mice were maintained under fairly deep anesthesia, with 30–60 breaths per minute. Respiratory rate was monitored continuously during the scan from the fluoroscopic preview window and adjustments to the vaporizer setting were made as needed to lighten or deepen the plane of anesthesia based on the observed respiratory rate. Following the scan, mice were kept warm during recovery with the use of a disposable handwarmer. Mice were monitored until fully recovered. Total procedural time was ≤15 min per mouse, from the initiation of anesthesia induction to full recovery. All animals were fully recovered before cages were returned to the ventilated cage racks.
Measurement of pulmonary tumor burden in high-resolution micro-CT scans
All the images from the thoracic high-resolution micro-CT acquisitions were evaluated using an open source-software DICOM-image-viewer (Osirix 6.02, Pixmeo, Switzerland). Images were displayed and analyzed on lung window settings (WL, −500 HU; WW, 1400 HU) by a veterinary diagnostic imaging clinician (AG), with 2 years’ experience interpreting thoracic CT studies in companion animals. Transverse, dorsal, and sagittal views were used for image review and identification and quantification of tumors. The observer (AG) was unaware of subject information, cisplatin treatment status, and duration of tetracycline treatment status at the times the scans were acquired and remained blinded to this information during image analysis. In the acquired thoracic micro-CT images, the identified pulmonary tumors were measured using volumetric and linear measurement methods. These were performed as follows. Semiautomated 3D volumetric method: using a semiautomated 3D segmentation tool (Osirix 6.02, Pixmeo) a variable number of areas were manually drawn for each pulmonary tumor in the transverse plane (Figure 1(a)), then the DICOM-image-viewer generated the missing areas in the transverse plane and calculated the volume of each tumor (Figure 1(c)). The generated areas were reviewed and manually adjusted to the tumor contour. The number of manually drawn areas depended on the size and shape of the tumor being measured; one area was drawn for every 3–5 available slices. Ellipsoid volume method: calculated from the product of the largest height, width, and length measurements of each pulmonary tumor and π/6. RECIST measurement method: sum of the largest diameters made in the axial (i.e., transverse) plane of each of the five largest pulmonary tumors. Modified RECIST measurement method: sum of the largest diameters made in the axial (i.e., transverse) plane of all the pulmonary tumors identified. Average axial diameter method: the average of the largest height and width diameters of each pulmonary tumor in the axial (i.e., transverse) plane. When used clinically, RECIST monitors five target lesions per organ and has minimum size criteria for evaluation of lesions using standard CT.
9
Due to the high spatial resolution of micro-CT and obvious size differences between species, we opted not to use any minimum size criteria. For consistency, we included the five largest tumors from each mouse for our RECIST measurement method. Because the RECIST measurements utilize only one value, we questioned whether a calculation from two values would have improved correlation with histological analysis and developed the average axial diameter method to investigate our query. Diameter measurements were performed manually with the use of electronic calipers. For the measurements performed manually on the micro-CT images, the margins were identified by visual assessment of differences in X-ray attenuation between aerated lung and adjacent soft tissues (e.g., tumor). When similar attenuation of soft tissue structures and blurring caused by motion artifact hampered identification and measurement of tumors adjacent to cardiovascular structures, diaphragm, and thoracic body wall, the distinction of the tumor margins was determined using the best clinical judgment of the observer (AG).
14
For our statistical analysis, the micro-CT pulmonary tumor burden measurements were reported as the sum of the measurements of all the tumors identified, except for the RECIST measurement method, which included only the largest five tumors identified. Although not pertinent to our statistical analysis, in order to show that individual tumors could be detected on non-gated lung micro-CT scans at different time points, we have also reported the baseline volume measurements for the smallest tumor from each mouse that could be identified on both scans (Supplementary Table 1).
(a) Pulmonary nodules with manually selected and automatically propagated ROIs in a thoracic micro-CT of a GEMM mouse (axial reconstruction; WL, −500; WW, 1400). (b) Histological sample of pulmonary adenomas from the same mouse imaged in 1(a) (H&E). (c) Volume rendering image of the pulmonary nodule highlighted in 1(a) and automatic volume calculation obtained with a segmentation tool from an open source-software DICOM-image-viewer (Osirix 6.02, Pixmeo, Switzerland).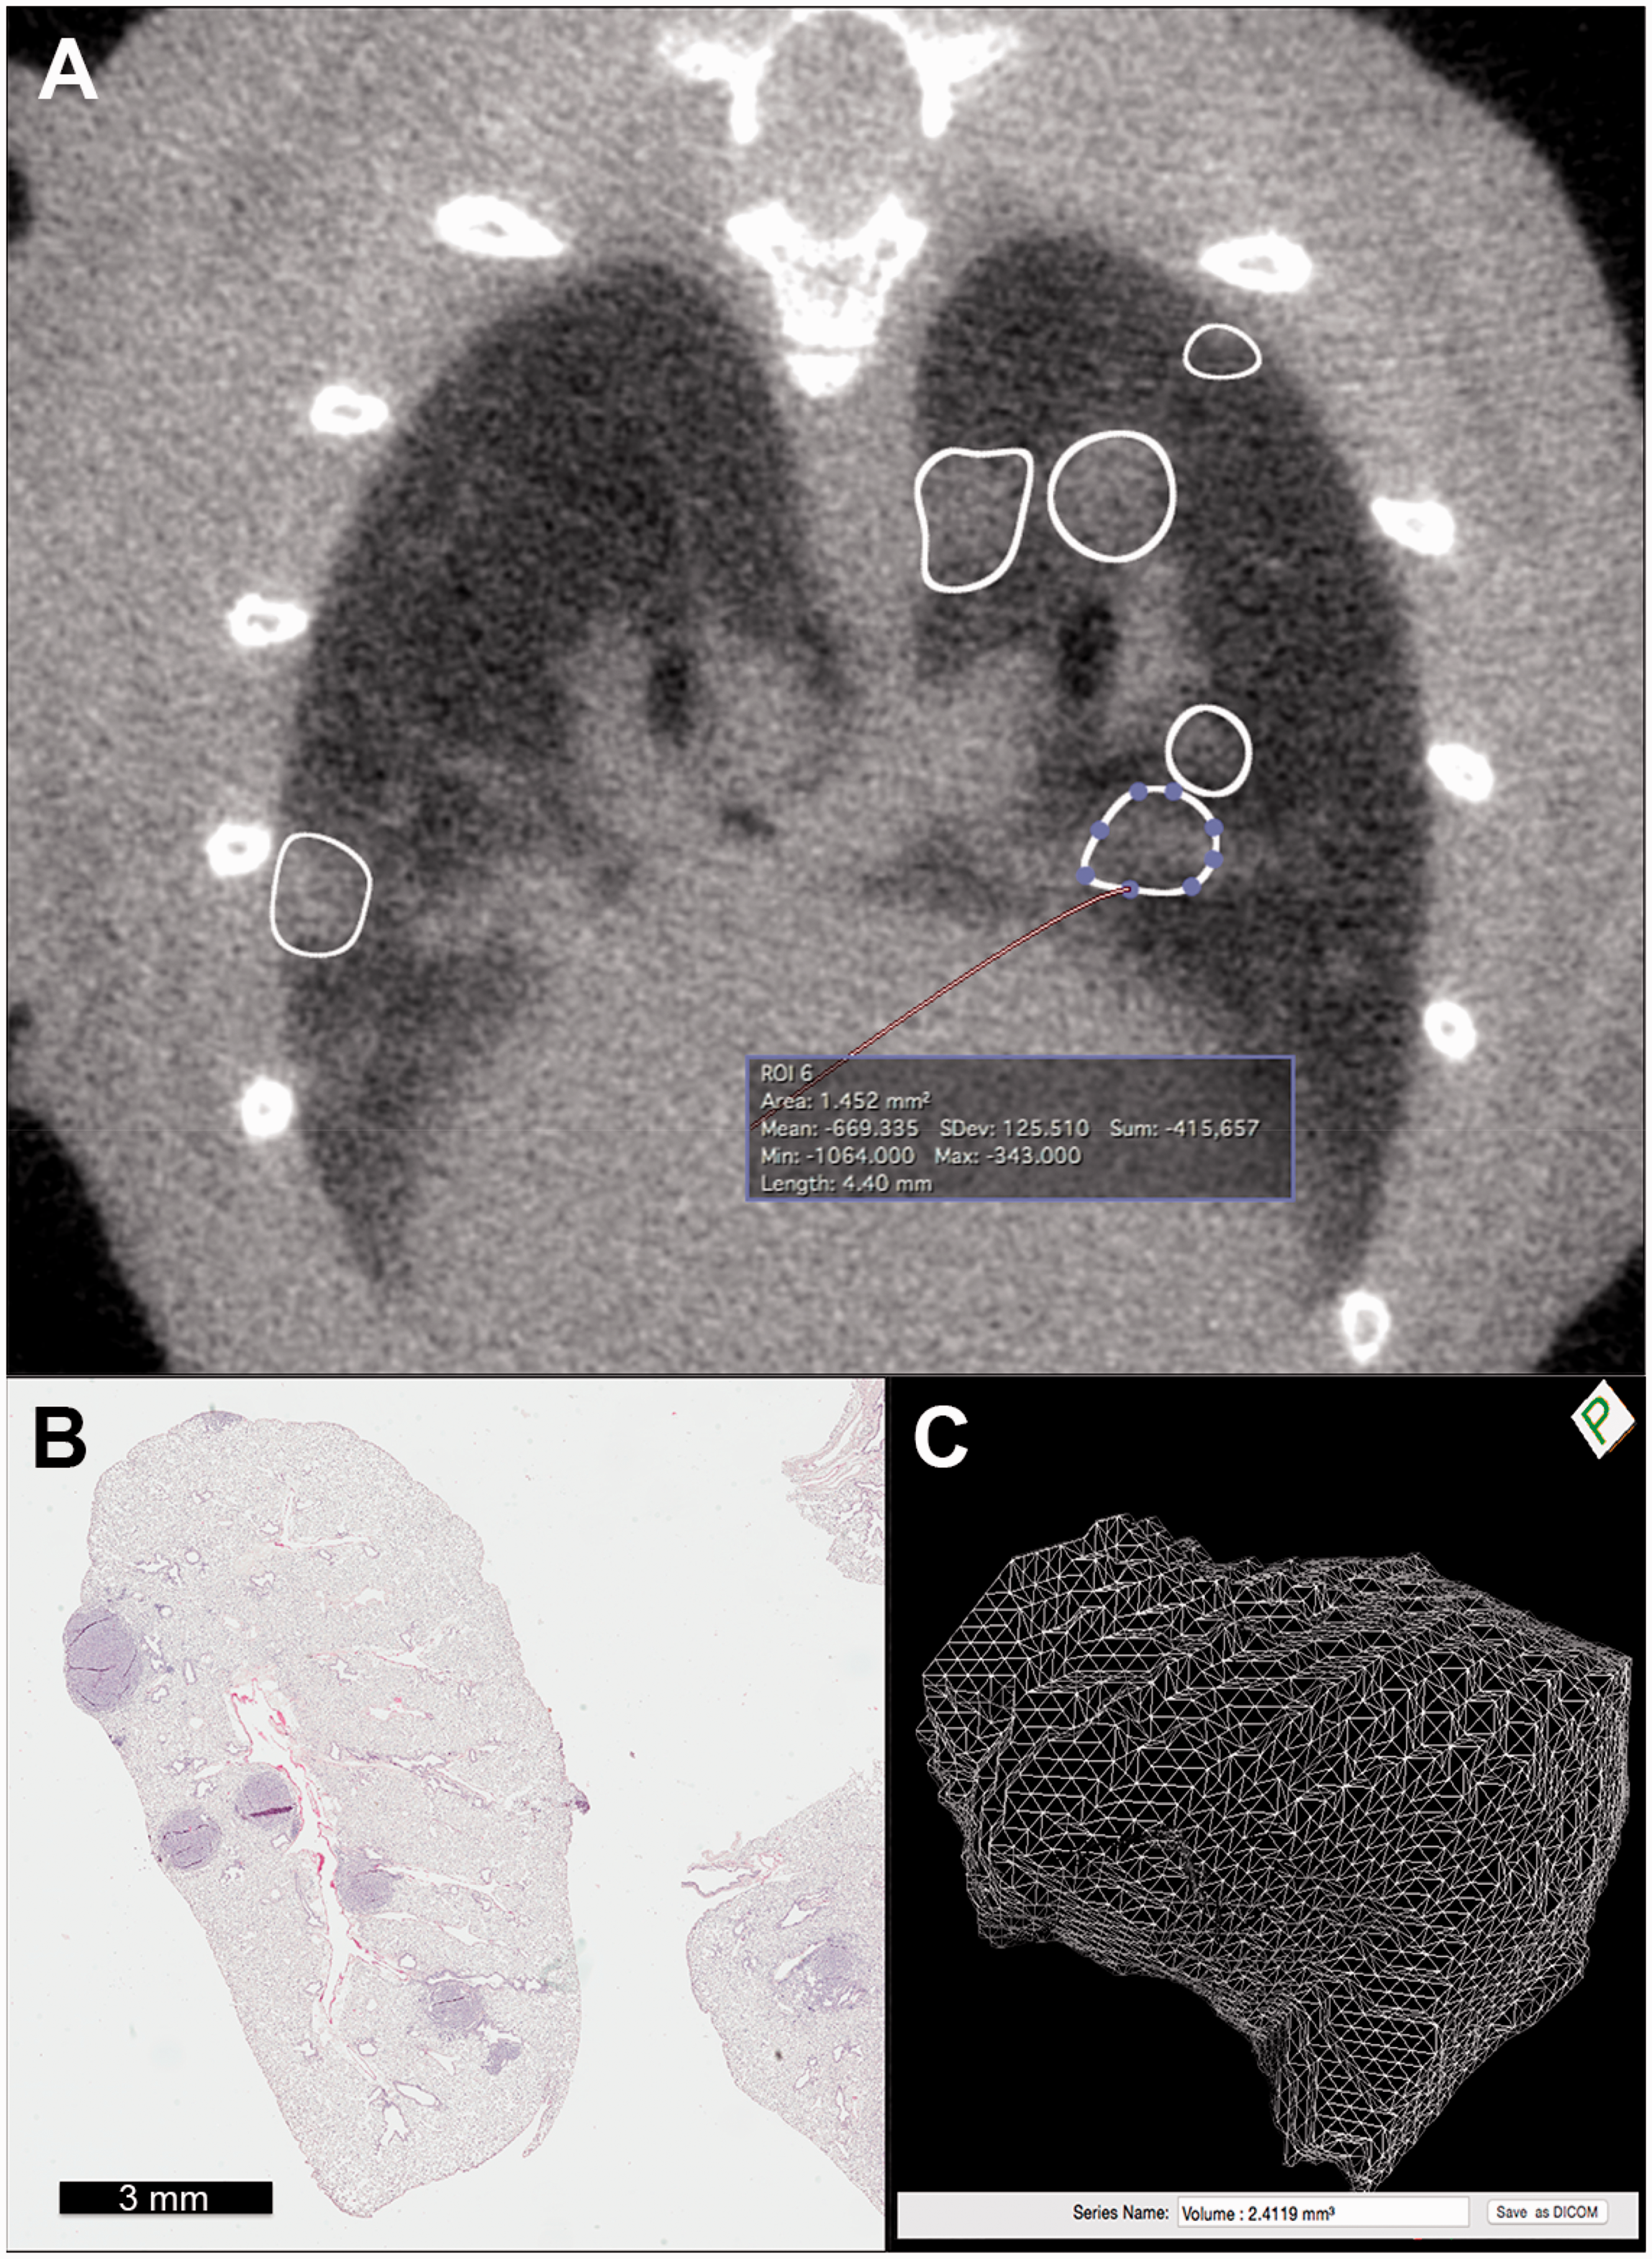
Histological measurement of tumor burden
Mice were euthanized the day after the acquisition of the final micro-CT scans due to requirements of a larger, parallel study investigating response to cytotoxic cisplatin chemotherapy. Euthanasia was performed by CO2 asphyxiation, in agreement with IACUC procedures. After death was confirmed, the thoracic cavity was opened and 5–10 ml of phosphate buffered saline was injected through the trachea in order to inflate the lungs; this was followed by 5–10 ml injection of fixative (4% paraformaldehyde). The lungs were then harvested for routine overnight fixation (in 4% paraformaldehyde at 4℃), processing, and staining with hematoxylin and eosin (H&E) for use in tumor burden quantification and morphologic analysis. For each mouse, all five lung lobes were embedded together in one block in a standardized fashion such that each section analyzed contained dorsal, longitudinal planes of each lung lobe (i.e., not transverse or sagittal). Histological data were collected from five H&E-stained sections from each mouse using a digital microscope (Aperio Scanscope CS0). Sections were 5 µm thick. They were first collected at the lung surface, and then serially every 300 µm so that depth of analysis was approximately 1200 µm throughout all five lung lobes. On each section, manual segmentations (i.e., outlines) of individual tumors were made by a different observer (JC) using a commercial histological image analysis software that then calculated the area of the region outlined (Aperio ImageScope v.10.2.2.2319, Leica Biosystems Inc., IL, USA). Tumors were identified and outlined based on descriptions and recommendations from the Mouse Models of Human Cancers Consortium. 39 Histological classification was confirmed by a board-certified veterinary pathologist with extensive experience in mouse histopathology (TS). The pulmonary tumor burden per mouse was determined by summing the manual segmentations of individual tumors from all five sections. These observers (JC and TS) were blinded to the results of the micro-CT image analysis.
Statistics
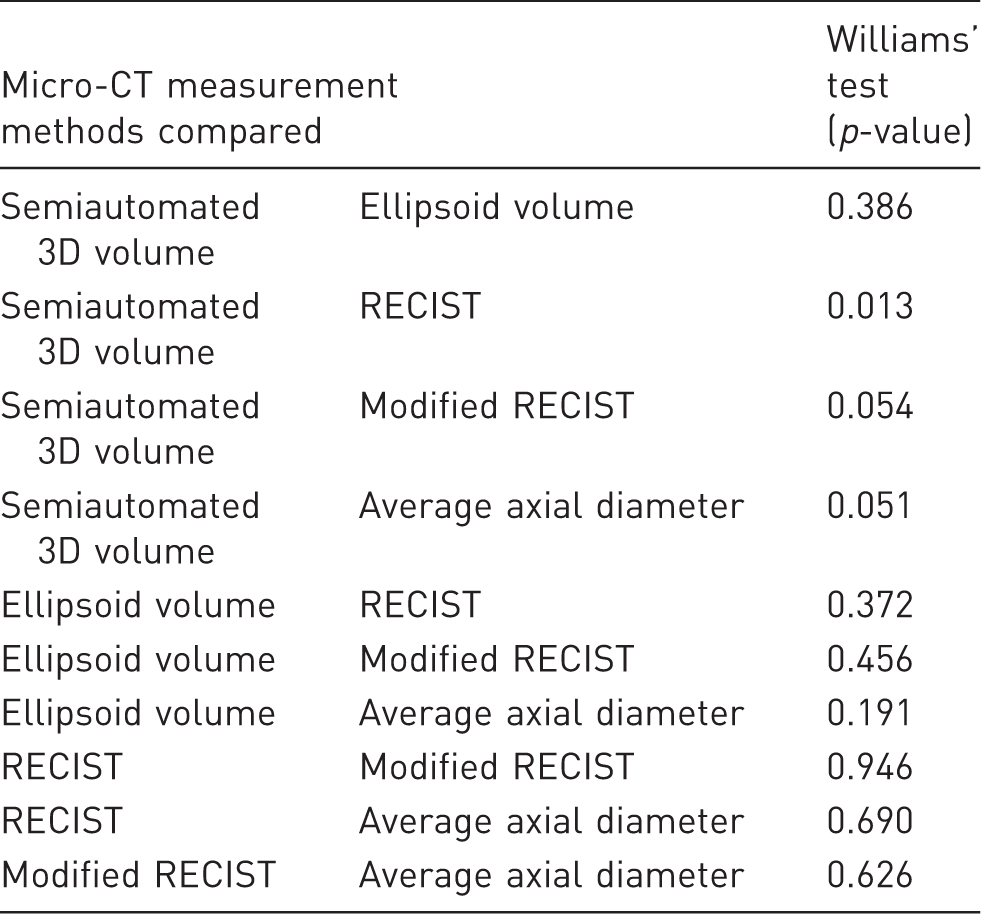
We sought to determine the correlation of tumor burden per mouse for each of the CT measurement methods with the histological assessment of tumor burden using Pearson correlation coefficients. Because we wished to determine if there was a linear relationship between the different methods of assessing tumor burden, we performed a correlation analysis rather than a Bland–Altman analysis for agreement. A sample size of eight gives us 95% power (α = 0.05, β = 0.05) to identify a correlation coefficient of 0.90 (GPower 3.1.9.2). Correlation coefficients of 0.8–1.0 are considered very strong. 40 The Shapiro–Wilks test for normality was used to determine whether each of the dataset distributions used in the correlation analysis significantly deviated from a normal distribution. These analyses were performed using commercial statistical software (JMP 13, SAS, NC, USA). A two-tailed Williams’ test was performed to test for differences between the Pearson correlation coefficients of the various micro-CT tumor burden measurement methods using an online available tool.41,42 The statistical significance was set at p < 0.05.
Results
Prior to baseline micro-CT and cisplatin treatment all mice were in good body condition without significant respiratory signs or other health concerns. All mice recovered quickly and uneventfully from all anesthetic episodes. No mouse died spontaneously during or after the imaging procedures. No mice were moribund prior to scheduled euthanasia. In the four mice imaged 1 week after cisplatin therapy, median weight loss from prior to cisplatin treatment was 2% (range, 6% weight loss to 1% weight gain). In the four mice imaged 3 weeks after cisplatin therapy, median weight loss was 12% (range, 7–15% weight loss). When weighed again the day after micro-CT imaging, additional mild weight loss was observed in some mice (range, 2% weight loss to 1% weight gain).
Tumor burden results with high-resolution micro-CT and histology, per mouse.
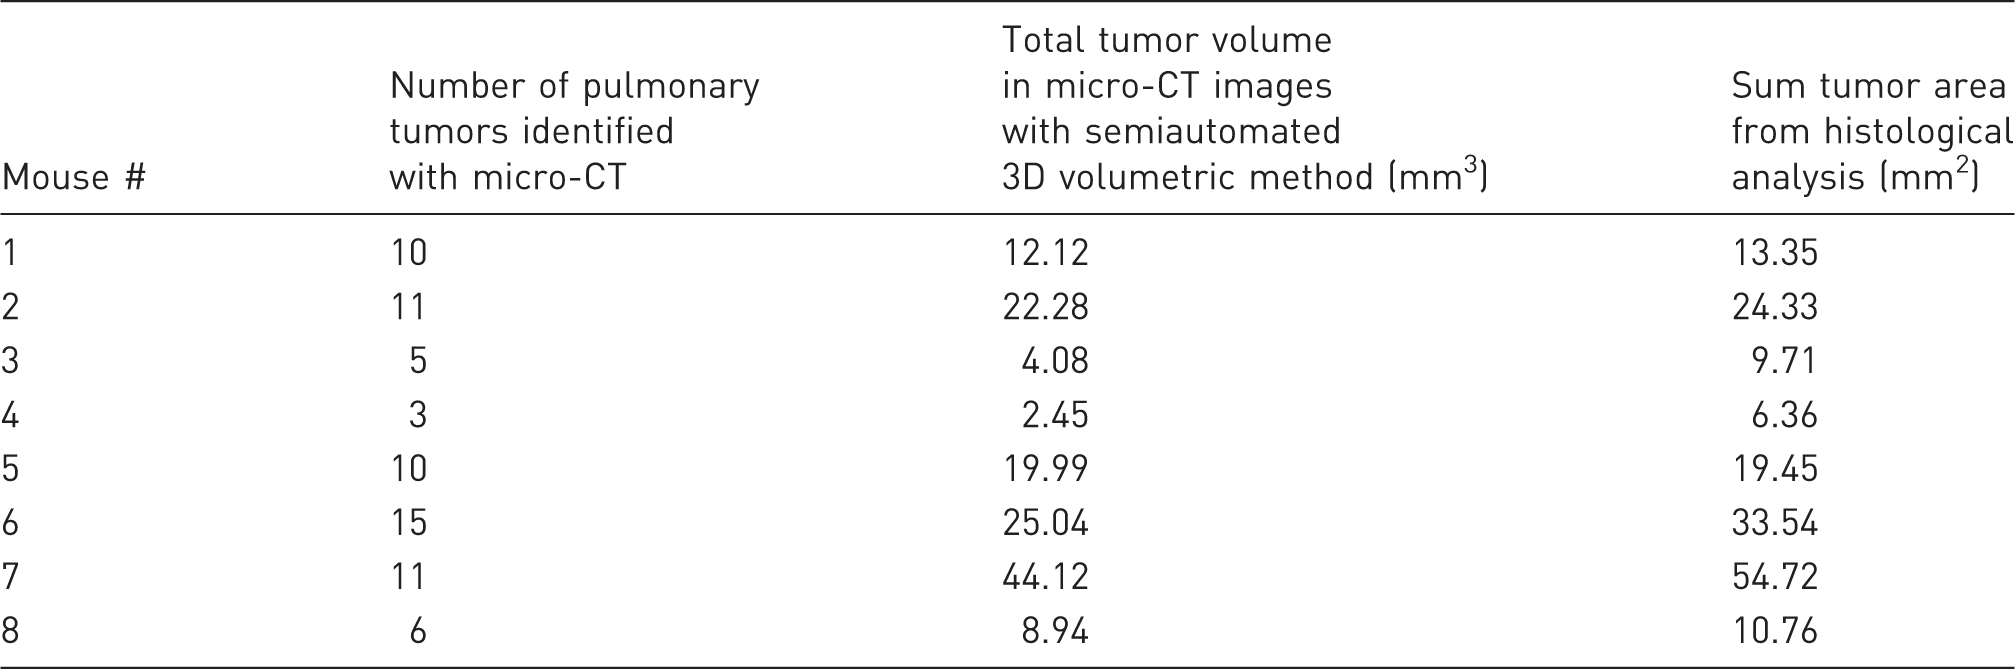
3D: three-dimensional; CT: computed tomography.
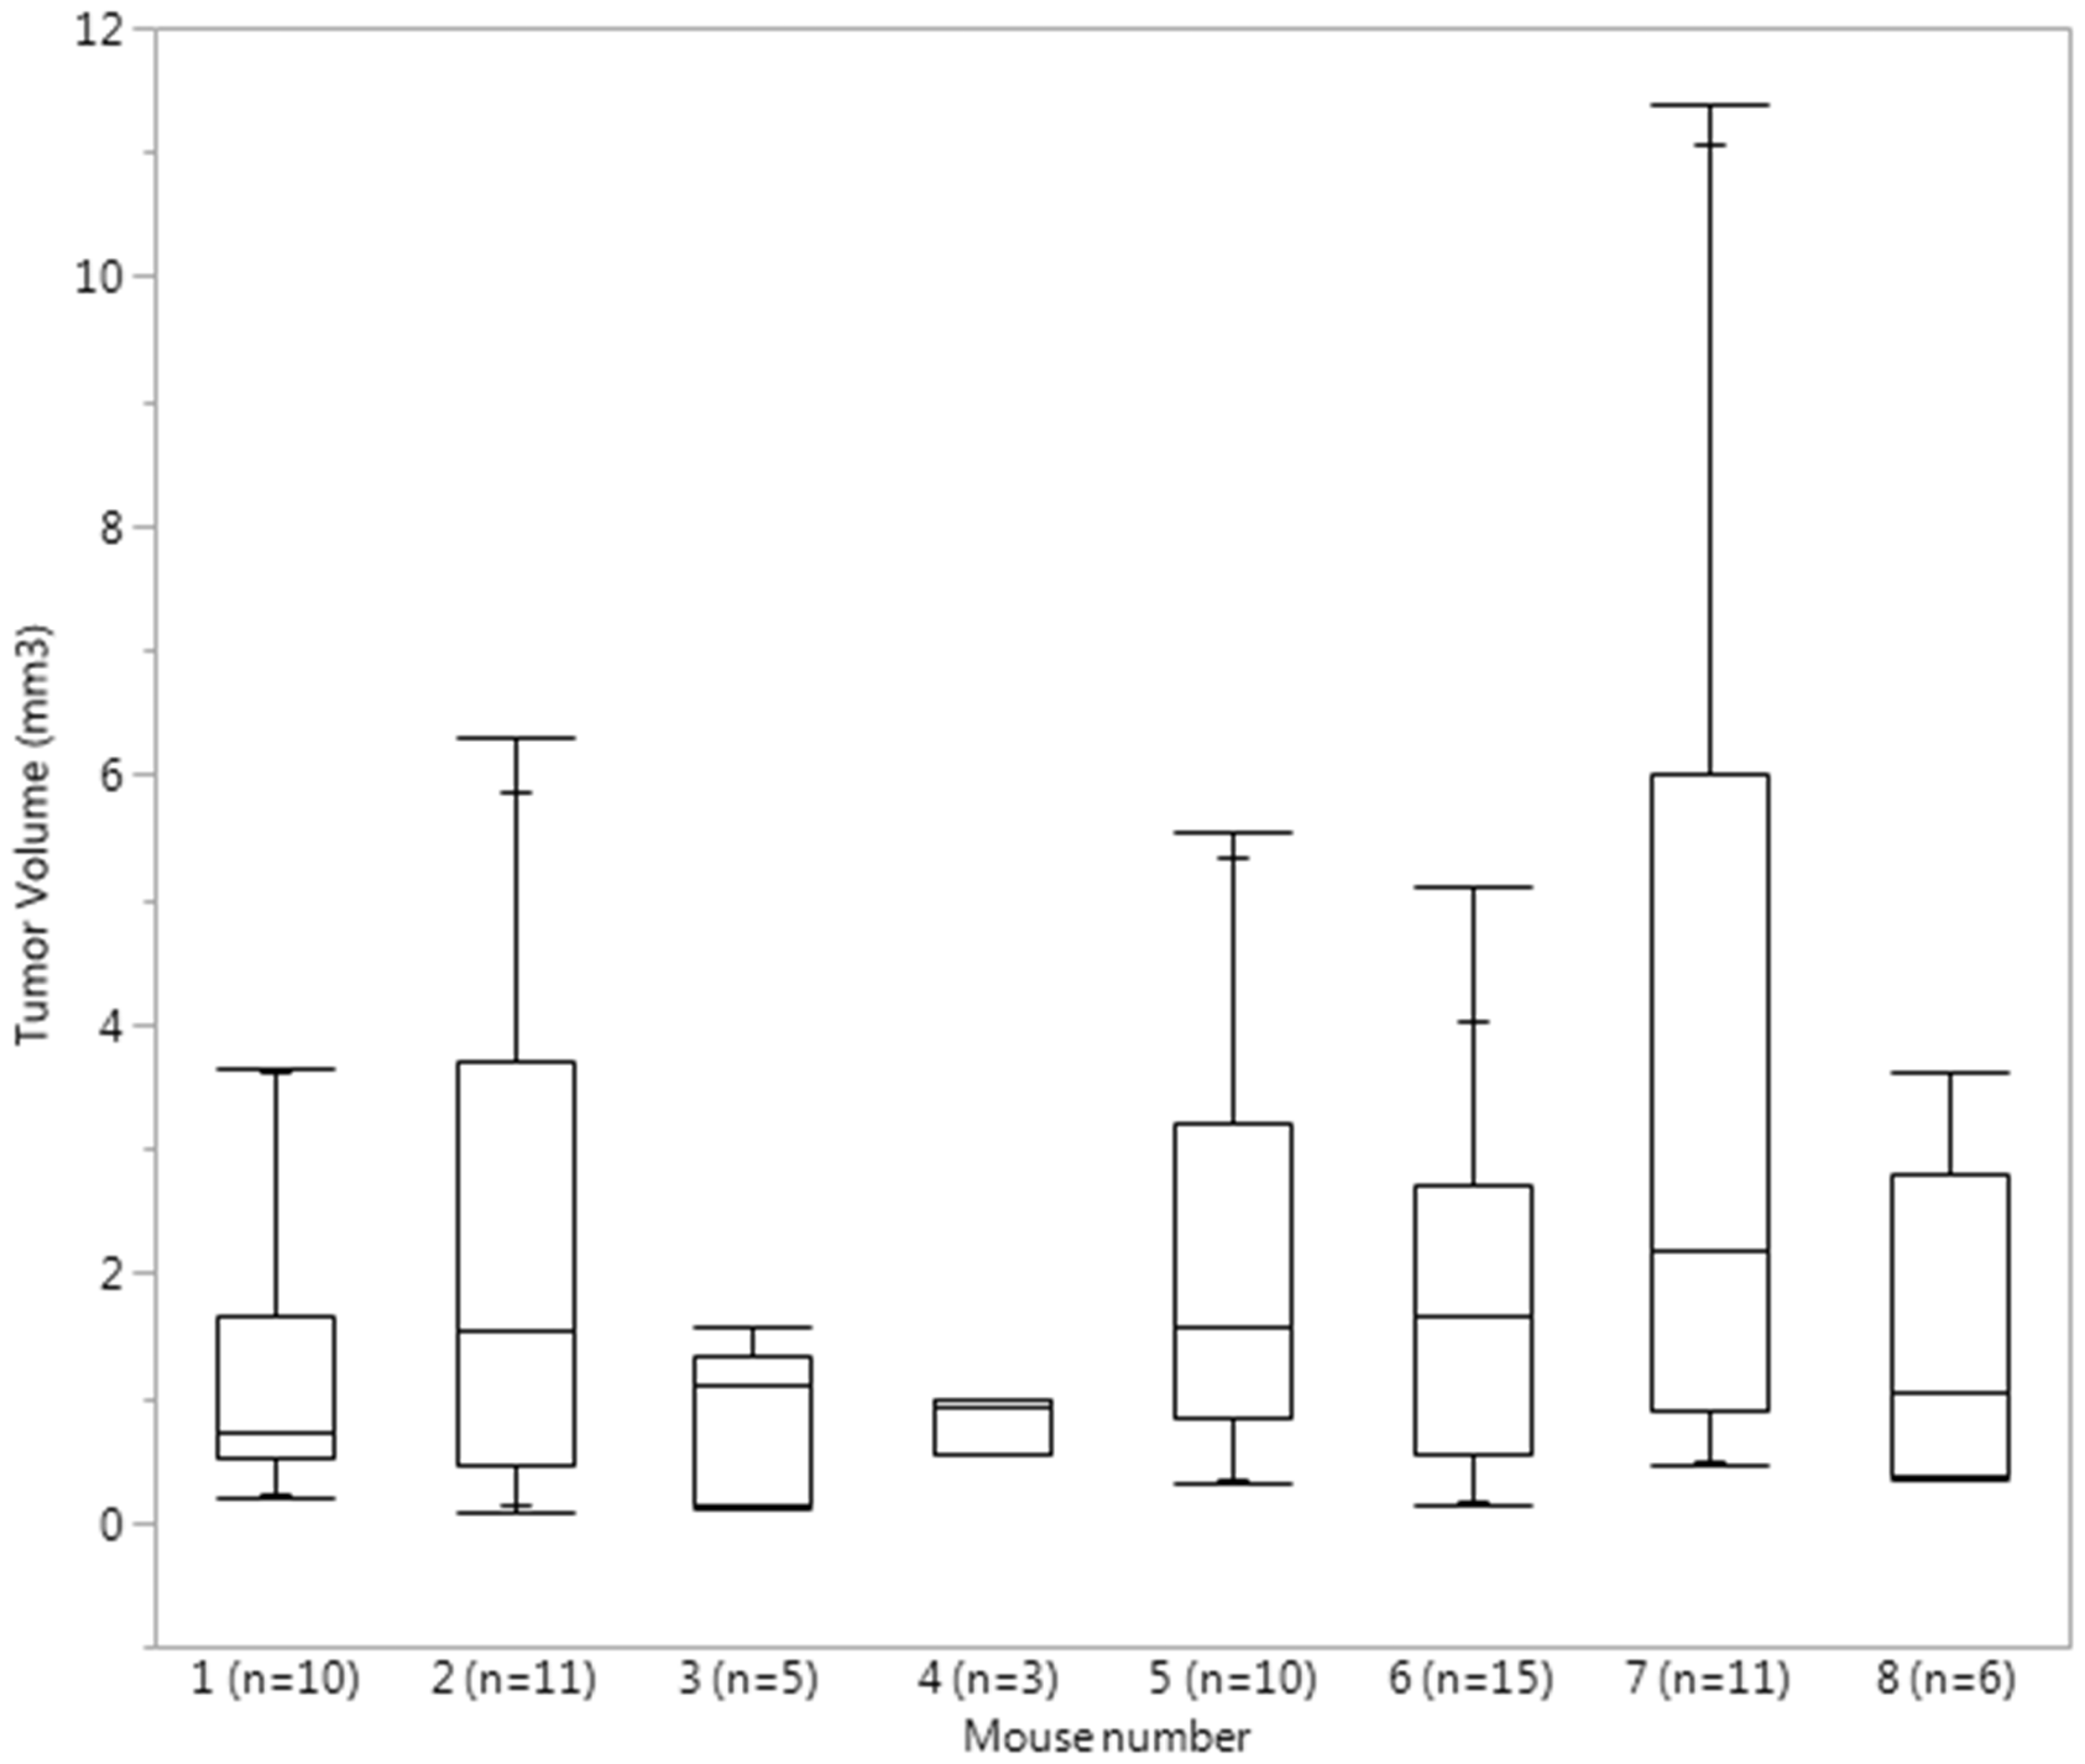
Quantile box plots reflecting the distribution of individual tumor volume in each mouse. Total number of tumors per mouse is listed next to the mouse number.
Correlation of sum histological tumor area with micro-CT measurements.
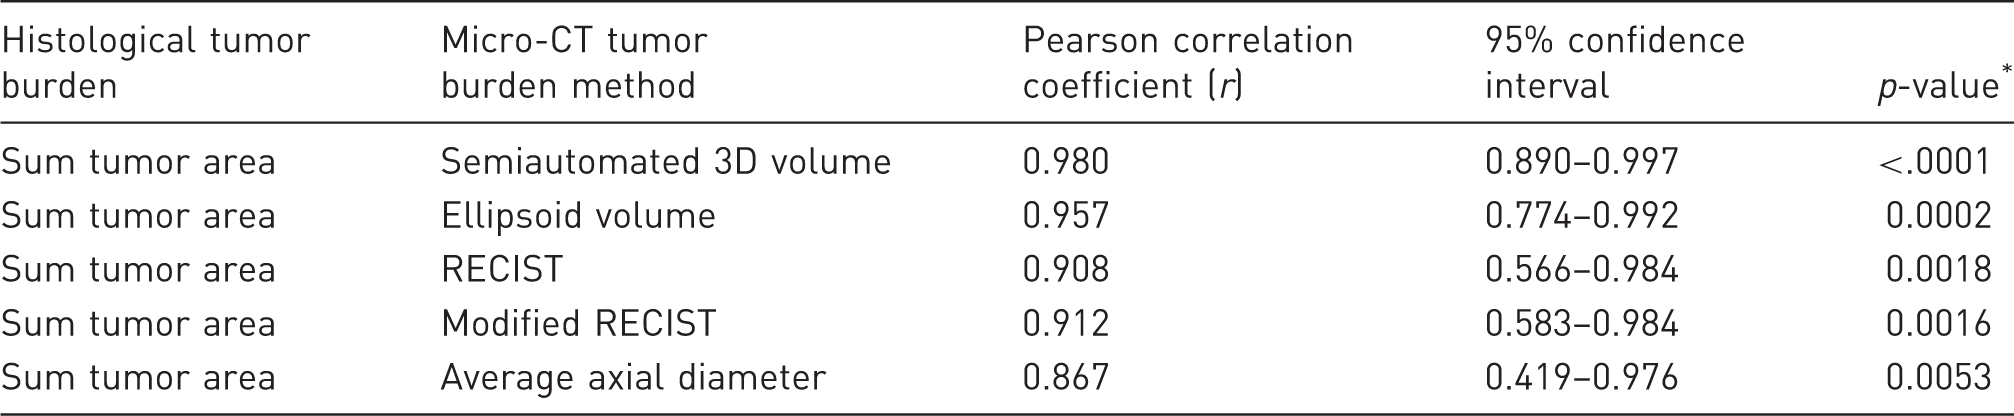
p-values indicate the probability that the correlation is not greater than 0.
3D: three dimensional; CT: computed tomography; RECIST: Response Evaluation Criteria in Solid Tumors.
Williams’ test for detection of difference between two dependent correlations sharing a variable.
3D: three dimensional; CT: computed tomography; RECIST: Response Evaluation Criteria in Solid Tumors.
Discussion
In our study of non-gated micro-CT imaging in a GEMM of NSCLC, we demonstrated very strong correlations between semiautomated 3D volume, ellipsoid volume, RECIST, modified RECIST, and average axial diameter measurement methods of pulmonary tumor burden with histological assessment of pulmonary tumor burden. These results indicate that non-gated micro-CT imaging is a reasonable way to quantitatively monitor lung tumor burden in GEMMs where between-group comparisons are prioritized over individual animal findings or concerns about systemic health of the research animals may limit lengthy anesthetic procedures. Although our anesthesia protocol was well tolerated in our study population, lengthier procedures will require more intensive monitoring and support (e.g., warming during scans, rectal temperature monitoring, fluid therapy).8,43,44 Our findings will thus enable a reduction in the number of research animals that are used in procedures requiring more invasive techniques and interventions.
Our findings also demonstrate limitations of some of the measurement methods. There are noticeable discrepancies in the volumetric calculations obtained via the semiautomated 3D method and the ellipsoid volume method for mice #1, #5, and #7 (Supplementary Table 2). There is also a sizeable discrepancy between the modified RECIST method and the average axial diameter method for mouse #1. The ellipsoid volume method would be expected to misrepresent the volume status of tumors that are very irregular, as observed in some of our tumors, whereas the modified RECIST and average axial diameter methods would be discordant in tumors that have a measurement in one plane that is very different from the measurement in the other plane. It is not surprising that we detected a difference between correlations of the semiautomated 3D volumetric method and the RECIST method, given that with the RECIST method only a subset of the total tumors was evaluated in some animals. We found no advantage of the average axial diameter method over RECIST or modified RECIST through either comparison of r or the Williams’ test results. Because of the very strong correlations we found between all of the micro-CT measurement methods and the histological analysis, a study with a much larger sample size would be needed to say with confidence whether the various correlations actually differ from each other. For example, using a (post hoc) simulation-based power calculation, the power to declare the observed difference in the correlation of the semiautomated 3D volumetric method (r, 0.980) and the correlation of the ellipsoid volume method (r, 0.957) statistically significant, using a two-sided Williams’ test (α = 0.05) and a sample size of eight, is only 14%. However, one must question whether a larger study (i.e., n = 50) is truly justifiable. Is the difference between an r of 0.980 and 0.957 relevant? Despite these sample size limitations, given the r of 0.980 for the semiautomated 3D volumetric method, and the Williams’ test results showing a difference between this correlation and the RECIST method correlation, as well as the marginal differences with the modified RECIST and average axial diameter correlations (Table 3), we recommend that semiautomated 3D volumetric measurements should be preferentially considered in the absence of other experimental limitations (e.g., time constraints, and software availability).
In our study, a single observer performed the measurements of the tumors in the micro-CT images and these measurements were performed only once. Because of this, interobserver and intraobserver variabilities could not be calculated. However, the intraobserver variability was reduced by blinding the observer to the tumor development status of the mice included in the study. In addition, the observer had 2 years’ experience reading CT studies in companion animals and was proficient in the use of electronic calipers limiting the likelihood of measurement bias. The strong correlation between the measurements performed on the micro-CT images and the histological measurements supports that even if present, the effect of the bias may not be relevant. However, we must caution that in circumstances with multiple observers over time (e.g., clinical practice), our results may not apply, and they should be validated with additional research.
The efficiency of tumor burden measurements and consistency amongst radiologists have been improved by the development of new post-processing and image analysis techniques. The substantial manual intervention that was initially required for semiautomated quantification methods has been improved by the development of advanced semiautomated methods.7,16 However, in our experience, the volumetric measurement methods were subjectively more time consuming than methods requiring a single or few linear measurements in the axial plane (i.e., RECIST, modified RECIST, and average axial diameter).
In micro-CT image analysis, the ability to differentiate two adjacent structures is not limited by its exceptional submillimeter spatial resolution but by its inherent increased noise and the limited contrast resolution that exists between adjacent pixels of structures with similar attenuation coefficients (e.g., tumor and blood vessel). This limitation can be overcome by the use of intravenous positive contrast materials and CT angiography, which have their own limitations in use in mouse models.19,23 Other researchers using non-contrast enhanced pulmonary micro-CT to monitor tumor progression have approximated relative total tumor burden by measuring total tumor and vessel volume. 7 The very strong correlations we found between the micro-CT and histological measurements of lung tumor burden suggest that the risk of under-measuring or over-measuring total pulmonary tumor burden due to similar attenuation between tumor and adjacent blood vessels may have a negligible effect when between-group comparisons are made in some cancer models.
Considerable changes in lung volume between scans have been reported in GEMMS and the concern has been raised as to whether these changes may affect tumor volume measurements. 16 Although dorsal recumbency substantially reduced motion artifact on micro-CT images in mice, 5 sternal position is recommended in thoracic CT in dogs in order to reduce the development of areas of atelectasis and pulmonary ground glass opacity. 45 It would be anticipated that similar principles would apply to mice and consequently, by scanning mice in sternal recumbency, we aimed for optimization of lung inflation, improvement of ventilation in systemically compromised animals, and detection of tumor margins.
A limitation of our study is that all mice were imaged at relatively similar time periods after oncogene induction. Although we did have a fair bit of variability (>120-fold difference) in individual tumor volume, our findings may not extrapolate well to circumstances with a different individual tumor volume range than that covered in our study (0.09 mm3 to 11.4 mm3). A second limitation is that we did not evaluate equal numbers of male and female mice. The male bias was not an intentional part of our experimental design, but rather was related to the random variability of mice available to study (based on when mice with the genotypes of interest were born with appropriate control littermates for our parallel study). In oncogenic Kras models, males tend to have smaller tumors than females, 46 therefore our study is likely biased towards somewhat smaller tumor volumes. Another possible limitation of our study is that the histological calculation of pulmonary tumor burden was limited to five sections from each mouse. However, serial section analysis is a time-consuming process and evaluating every existing piece of lung tissue is not a practical goal in either a research or clinical setting. To our knowledge there is no established consensus on how histological tumor burden should be calculated and reported in GEMMs. In addition to serial section analysis, other methods used to calculate pulmonary tumor burden have included counting tumors on the pleural surface, calculating volumes by dividing the average tumor weight by the average tumor density, and dissecting the tumors from frozen lungs.6,7,14,32 Because fixation techniques can reduce lung tumor size and shift downwards the histological stage classification, measurement of tumor size in fresh specimens might be prioritized. 47 However, small or non-surface lesions cannot always be appreciated when fresh tissue is evaluated by the natural eye. Our results demonstrated very strong correlation coefficients (that were statistically significant from 0) between the histological quantitative analysis of fixed specimens and all the micro-CT measurement methods analyzed, which suggests that if present, the effect of fixation may not alter between-group differences, provided all samples are processed similarly. Our analysis of serial sections was similar in approach to that used by others but we did not report data as a percentage of lung area or integrate the tumor area for each section over the distance between contiguous sections. Because our objective was to correlate histological data with micro-CT data, we considered these approaches might not represent with sufficient accuracy the irregular shapes, distribution, and location of the pulmonary tumors, and might have added additional uncontrolled measurement bias. An additional strength of our approach is that we did not restrict our histological analysis to the pulmonary surface or to one specific lung lobe.
In summary, the very strong correlations we identified between volumetric and linear micro-CT measurements and histological analysis indicate non-gated pulmonary micro-CT can provide useful information in GEMMs in which poor systemic health of research animals may preclude lengthy anesthetic procedures or use of intravenous contrast media. In research settings in which tumor response or progression is compared between groups and absolute tumor size is not paramount, any of the measurement methods analyzed should be expected to reflect differences in a relationship similar to that which would be detected histologically.
Footnotes
Acknowledgments
The authors would like to thank Teresa Porri and the Cornell Biotechnology Resource Center Imaging Facility for the acquisition of the micro-CT scans, Tina Abratte for animal care and assistance with micro-CT acquisition, and Lynn M Johnson of the Cornell Statistical Consulting Unit for her advice on the statistical analysis.
Declaration of Conflicting Interests
The author(s) declared no potential conflicts of interest with respect to the research, authorship, and/or publication of this article.
Funding
The author(s) disclosed receipt of the following financial support for the research, authorship, and/or publication of this article: This work was supported by the American Lung Association and the American Lung Association of New York, USA (grant number RG-192135-N).
References
Supplementary Material
Please find the following supplemental material available below.
For Open Access articles published under a Creative Commons License, all supplemental material carries the same license as the article it is associated with.
For non-Open Access articles published, all supplemental material carries a non-exclusive license, and permission requests for re-use of supplemental material or any part of supplemental material shall be sent directly to the copyright owner as specified in the copyright notice associated with the article.