
Abstract
Rat molar eruption and occlusion data were compiled from several studies but several inconsistencies were found, rendering the planning of eruptional studies difficult and imprecise. Our aim was to measure eruption and occlusion days, as well as eruption velocity, in the upper and lower three molars from infancy to end of adolescence in the rat. A total of 19 male and female Wistar rats were scanned daily by micro-computed tomography (CT) from day 15 to 70. We measured the eruption of all maxillary and mandibular molars with reference points at the hard palate and mandibular canal at three stages: pre-emergent, pre-occlusal, and functional. Statistical analysis was performed with a mixed-model analysis of variance (ANOVA) and a Sidak post hoc test. The first molar erupts on average on day 17, the second molar on day 20, and the third molar on day 33. The eruption velocity of the first molar was the highest at 90.9 microns/day (standard error (se) = 12.80), followed by the second molar at 65.9 microns/day (se = 5.80), and the lowest was the third at 47.0 microns/day (se = 3.28), (p < 0.001). On average, the pre-occlusal phase had the highest velocity at 97.2 microns/day (se = 1.72), the pre-emergent was lower at 84.9 (se = 2.29), and the functional was the lowest at 21.7 (se = 0.45), (p < 0.001). The eruption rate decreased from the first to third molar and was also different between phases: the pre-occlusal phase had the highest rate, closely followed by the pre-emergent phase while the functional eruption rate was significantly lower than the other phases.
Introduction
Tooth eruption is a complex process involving many structures, cellular types, and signaling pathways. Its physiology has been the subject of research, primarily focusing on the pre-emergent stage of the eruption process where the role of the dental follicle, of the alveolar bone and of the germ have been well-described.1,2 At this time, the post-emergent eruption mechanism has not been elucidated and the current knowledge relies mostly on hypotheses. The most common are: blood flow pressure at the apex, collagen fibers of the periodontal ligament, root elongation, pulp and dentin proliferation, rate of alveolar bone remodeling, and presence of occlusal forces.3–6 It is possible that one or more of these factors contribute to the eruption process and thus to discover the cellular and molecular actors in the post-emergent process, further research is required.
The albino rat is a well-adapted model for studying the eruption process, in particular the rat molars, which are sufficiently similar to human molars to provide valuable insight. In order to examine their post-emergent stage, one must know the eruption timing of rat molars. Hoffman and Schour7,8 published two hallmark studies on rat molar development from birth to 500 days, which included a detailed table of molar development stages and time. However, these data are compiled from four different studies and carry the biases linked to cross-sectional studies, as well as that of combining results of different origin. For example, the day of eruption of the first molar is cited as day 19 but Grier and Wise 9 observed it to be day 17 and later Wise et al. 10 cited it as day 18. Although some data on the timing of rat molars exist, inconsistencies between publications indicates the need for a more complete investigation, especially whether the mechanism of the pre-occlusal eruption should be investigated. Our goal was to follow the eruption of the three molars of the Wistar rat in a longitudinal design by the means of in vivo micro-computed tomography (CT) scans from 15 to 70 days of age to investigate the mean eruption age, occlusion age, and eruption velocities, as well as the amount of variation in the three molars.
Animals
This study was approved by the ethical committee of the Republic and Canton of Geneva, Switzerland under the number GE/72/15. The experimental group consisted of 19 15-day old rats (8 females and 11 males) of the Rattus norvegicus species, and Wistar strain. They were born in-house of two dams with no specific microbiological or immune status or particular genetic background. The dams were obtained from Janvier Labs, France. All animals were housed in the animal facility of the University of Geneva, Switzerland and cared for by the laboratory technicians of the facility and our lab. The experimental rats were kept with their dam until weaning on day 21 and then transferred to new cages of four rats/cage and separated by sex.
Wistar rats were chosen because they are a widely used experimental strain and thanks to the non-invasive in vivo micro-CT method we were able to maintain a low number of animals. The animals were followed longitudinally with daily in vivo micro-CT scans from 15 to 42 post-natal days and three times per week from 43 to 70 days. The rats were marked by piercing of the ears and weighed three times per week to monitor growth. At the age of 70 days all the rats were humanely killed by CO2 and the dams were kept for further breeding. One of the rats died in respiratory failure during the scan at the age of 56 days. To control for any adverse effect of the repeated micro-CT procedure, the experimental group was compared with that of a control group containing nine male rats. The control group received a single micro-CT scan, five male rats at the age of 18 days and four male rats at the age of 28 days. To examine the influence of the anesthesia procedure on the well-being of the animals, the weight of the control rats was compared with that of the male rats of the experimental group. Furthermore, to ensure that the frequent anesthetic procedure had no adverse effects on tooth eruption, the tooth development stage of the four first molars was compared between the control and experimental groups.
Material and methods
Micro-CT
The Perkin Elmer® Quantum GX in vivo micro-CT was used with isoflurane anesthetic gas. The gas was administered at 5% and 1 l/min for the induction phase and at 2% and 1 l/min during the scan. Up to the age of 32 days, the rats were scanned using the mouse-size tray at 30-micron resolution (standard) and 2 min exposure time. From 34 to 70 days, the rat-size tray was necessary and the scanning parameters were adjusted accordingly to maintain resolution: 30-micron (high resolution) and 4 min exposure time.
Eruption
The results were exported to Osirix® image analysis software. The position of the 12 molars of each rat was measured on coronal plane slices. To measure the amount of eruption, we used stable landmarks. In the mandible we used the mandibular canal and in the maxilla, the roof of the palate above the follicular sac (Figure 1). The outline of the canal and of the follicular sac were traced and the tip of the palatal cusp marked. In the maxilla, the tracing was copied to subsequent days and positioned to the roof of the alveolar process. The tooth position was measured between the center of the tracing and the tip of the cusp. The daily eruption velocity was obtained by calculating the difference of tooth position between two subsequent measurements and dividing by the number of days in between. In addition, we identified the day the tooth pierced the gingiva (start of pre-occlusal phase) and the first occlusal contact (start of functional phase) and used this information to determine the three phases of eruption: pre-emergent, pre-occlusal and functional. The beginning of the pre-occlusal phase was determined by the day the tooth pierced the gingiva. This measurement was validated to intra-oral photos of the rats ranging from 16 to 28 days to verify accuracy of the method. Occlusal contact was determined by at least one cusp-to-cusp contact between antagonist molars. The opening of the jaws through muscle relaxation during anesthesia was prevented with a tight elastic attached around the snout.
Illustration of measurements performed to calculate to position of the upper and lower jaws, example of the first molars. Tracing of the mandibular canal and the maxillary follicular sac and dots corresponding to the tip of the cusps are in black and white. The tracing of the follicular sac was performed on pre-emergent stage molars. The distance between the dot and the center of the tracings was measured to record to position and calculate eruption velocity.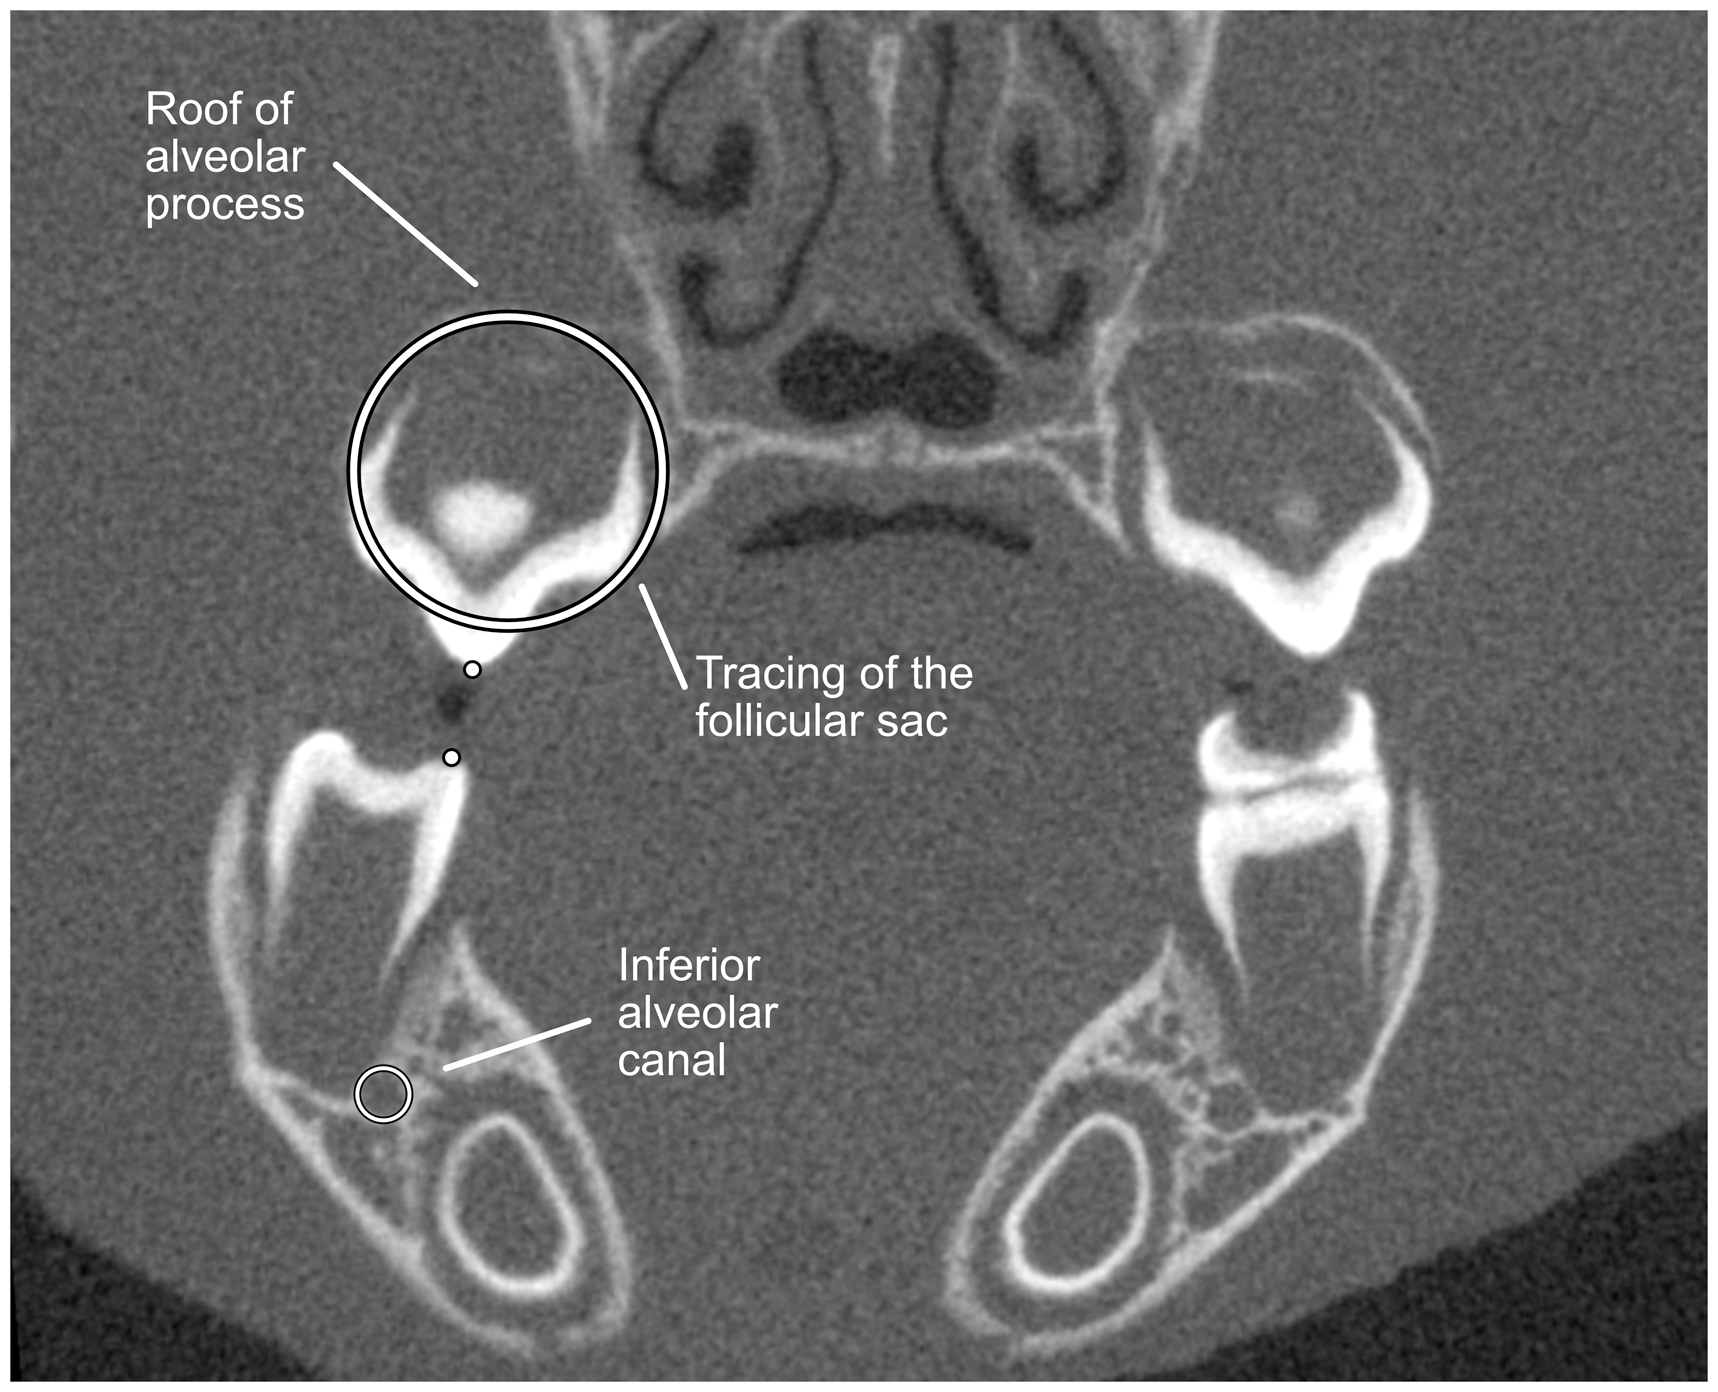
Statistics
For all statistical analyses SPSS Statistics software for Windows, version 24.0 (IBM Corp., Armonk, NY, USA) was used. The eruption and occlusion days were analyzed using analysis of variance (ANOVA) with the variables sex[F/M], side[L/R], jaw[U/L] (only for eruption) and molar[1,2,3], and the levels of the latter were compared with a Sidak post hoc test. We also performed a Pearson’s correlation test between the weight and the day of eruption as well as weight and occlusion day. Interaction effects between the levels of different variables were determined with a one-way ANOVA by rearranging the molar and jaw variables into one dummy variable. The tooth position was tested using ANOVA with variables sex[F/M], side[L/R], molar[1,2,3] and a Sidak post hoc test. The eruption velocity was tested with a mixed-model ANOVA with the variables sex[F/M], side[L/R], molar[1,2,3], jaw[U/L] and eruption_stage[pre-emergent, pre-occlusal, functional] and a Sidak post hoc test was used.
Error of the method
The weight of experimental rats was compared with controls with a two-way ANOVA. Cohen’s Kappa statistic was run to determine if there was agreement between intra-oral photos and micro-CT images on the eruption stage of the teeth (i.e., pre-emergent or post-emergent). To assess the error of the method of the occlusion day, the measurement was repeated twice with a 1-week interval. The systematic error was calculated with a paired t-test on the repeated measures, the random error with the Dahlberg formula and a coefficient of correlation was also performed. 11
Results
Evaluation of errors in the experimental model
Mean weight and first molar position of control compared with experimental rats at 18 and 28 days of age. Control and experimental groups were compared with two-way analysis of variance.
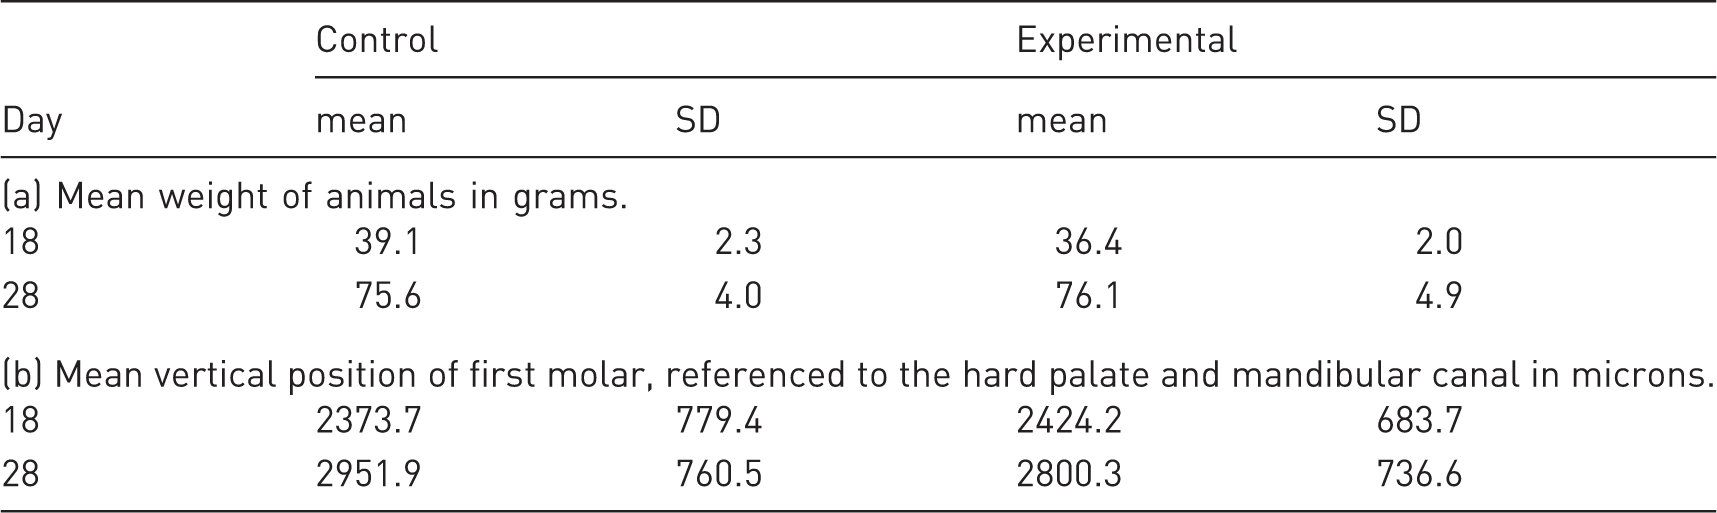
SD: standard deviation
The measurement method for the first appearance of the tooth in the oral cavity (time of eruption) was validated by the Cohen’s Kappa test, which showed a strong agreement between the clinical situation (intra-oral photo as the gold standard) and the micro-CT analysis, κ = 0.885 (95% confidence interval (CI), 0.785 to 0.963), p < 0.001.
Concerning the occlusion day identification, no systematic error was detected (p = 0.657), the random error was 0.14 days and the coefficient of correlation was 0.999.
Eruption and occlusion age
Average age of eruption, age of occlusion, and duration of pre-occlusal eruption period in males and females.
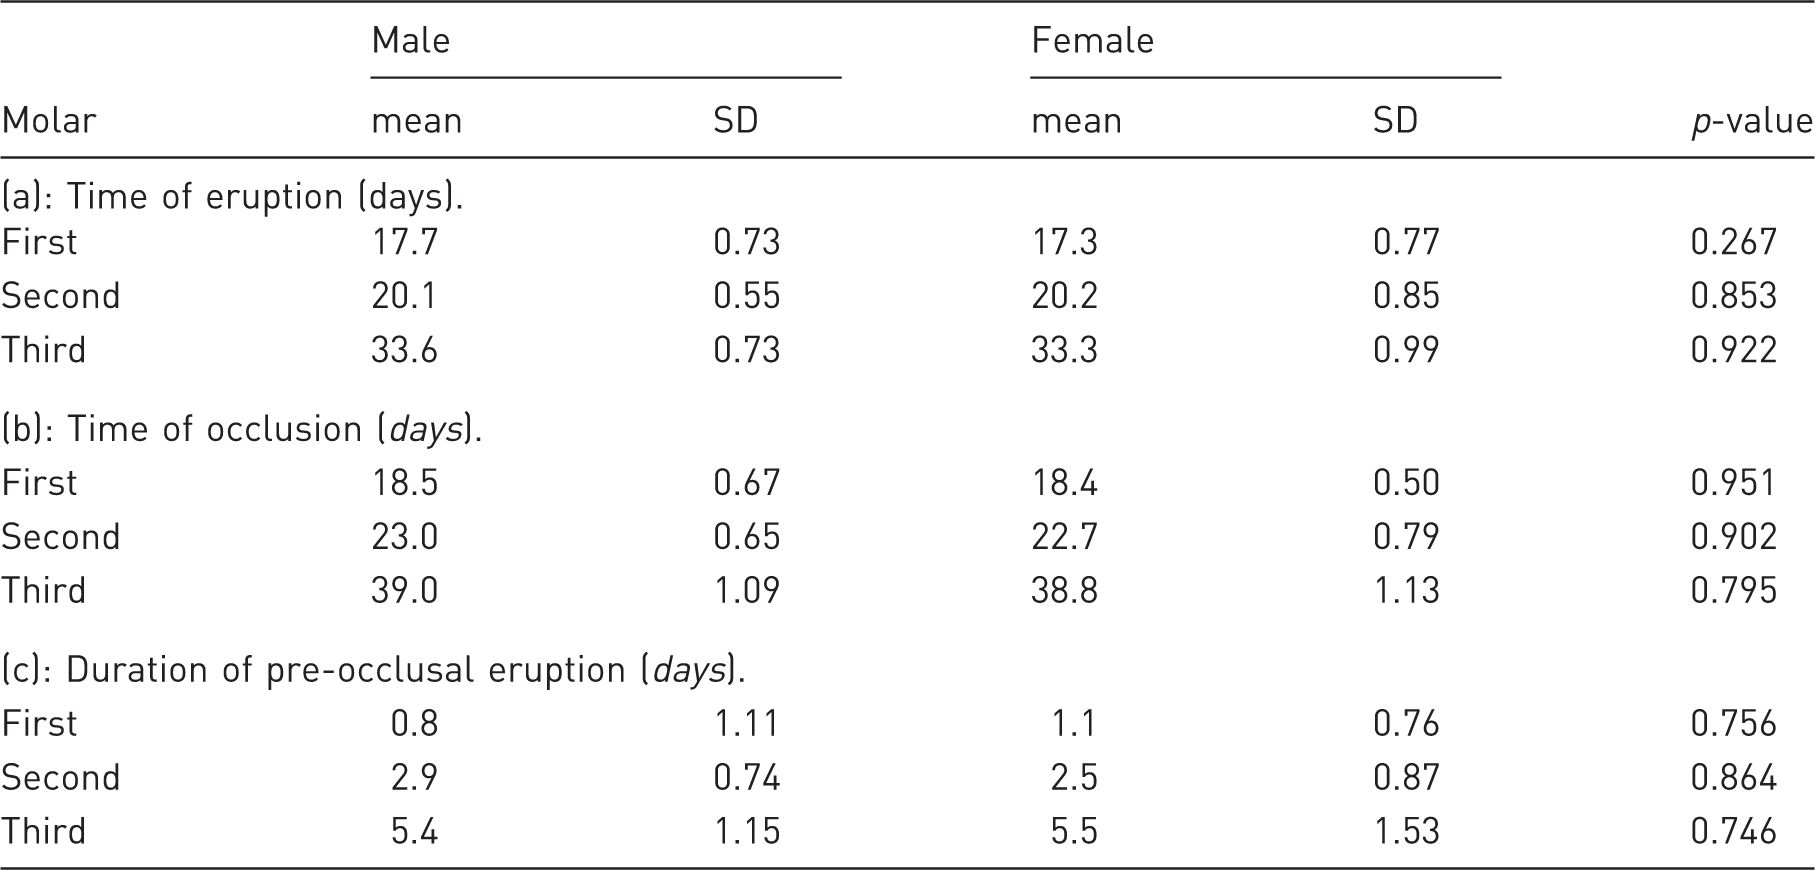
SD: standard deviation
On average, the occlusion age for the first molar was day 19, the second molar was day 23 and the third was day 39 (Table 2(b)). The ANOVA analysis showed a significant effect only in the variable molar (p < 0.001) indicating that all molars occluded on different days and no interaction between sex, side, and molar. No statistically significant correlation was found between the occlusion day and the weight of the animals.
Concerning the duration of the pre-occlusal eruption, the first molar had the shortest eruption period, the second was approximately two- to three-times longer than the first molar and the third approximately five- to six-times longer than the first molar (Table 2(c)). The ANOVA analysis and Sidak post hoc test revealed a significant difference between all three molars (p < 0.001) but no differences between sex and side.
Tooth eruption velocity
The eruption velocity of the first molar was the highest at 90.9 microns/day (standard error (se) = 12.80), followed by the second molar at 65.9 microns/day (se = 5.80) and the lowest was the third at 47.0 microns/day (se = 3.28); all differences were statistically significant (p < 0.001). Averaging the three molars, the pre-occlusal phase had the highest velocity at 97.2 microns/day (se = 1.72), the pre-emergent was 84.9 (se = 2.29) and the functional was the lowest at 21.7 (se = 0.45). The differences between the three phases were statistically significant (p < 0.001).
Average eruption velocity and standard deviation of pre-emergent, pre-occlusal, and post-occlusal phases.
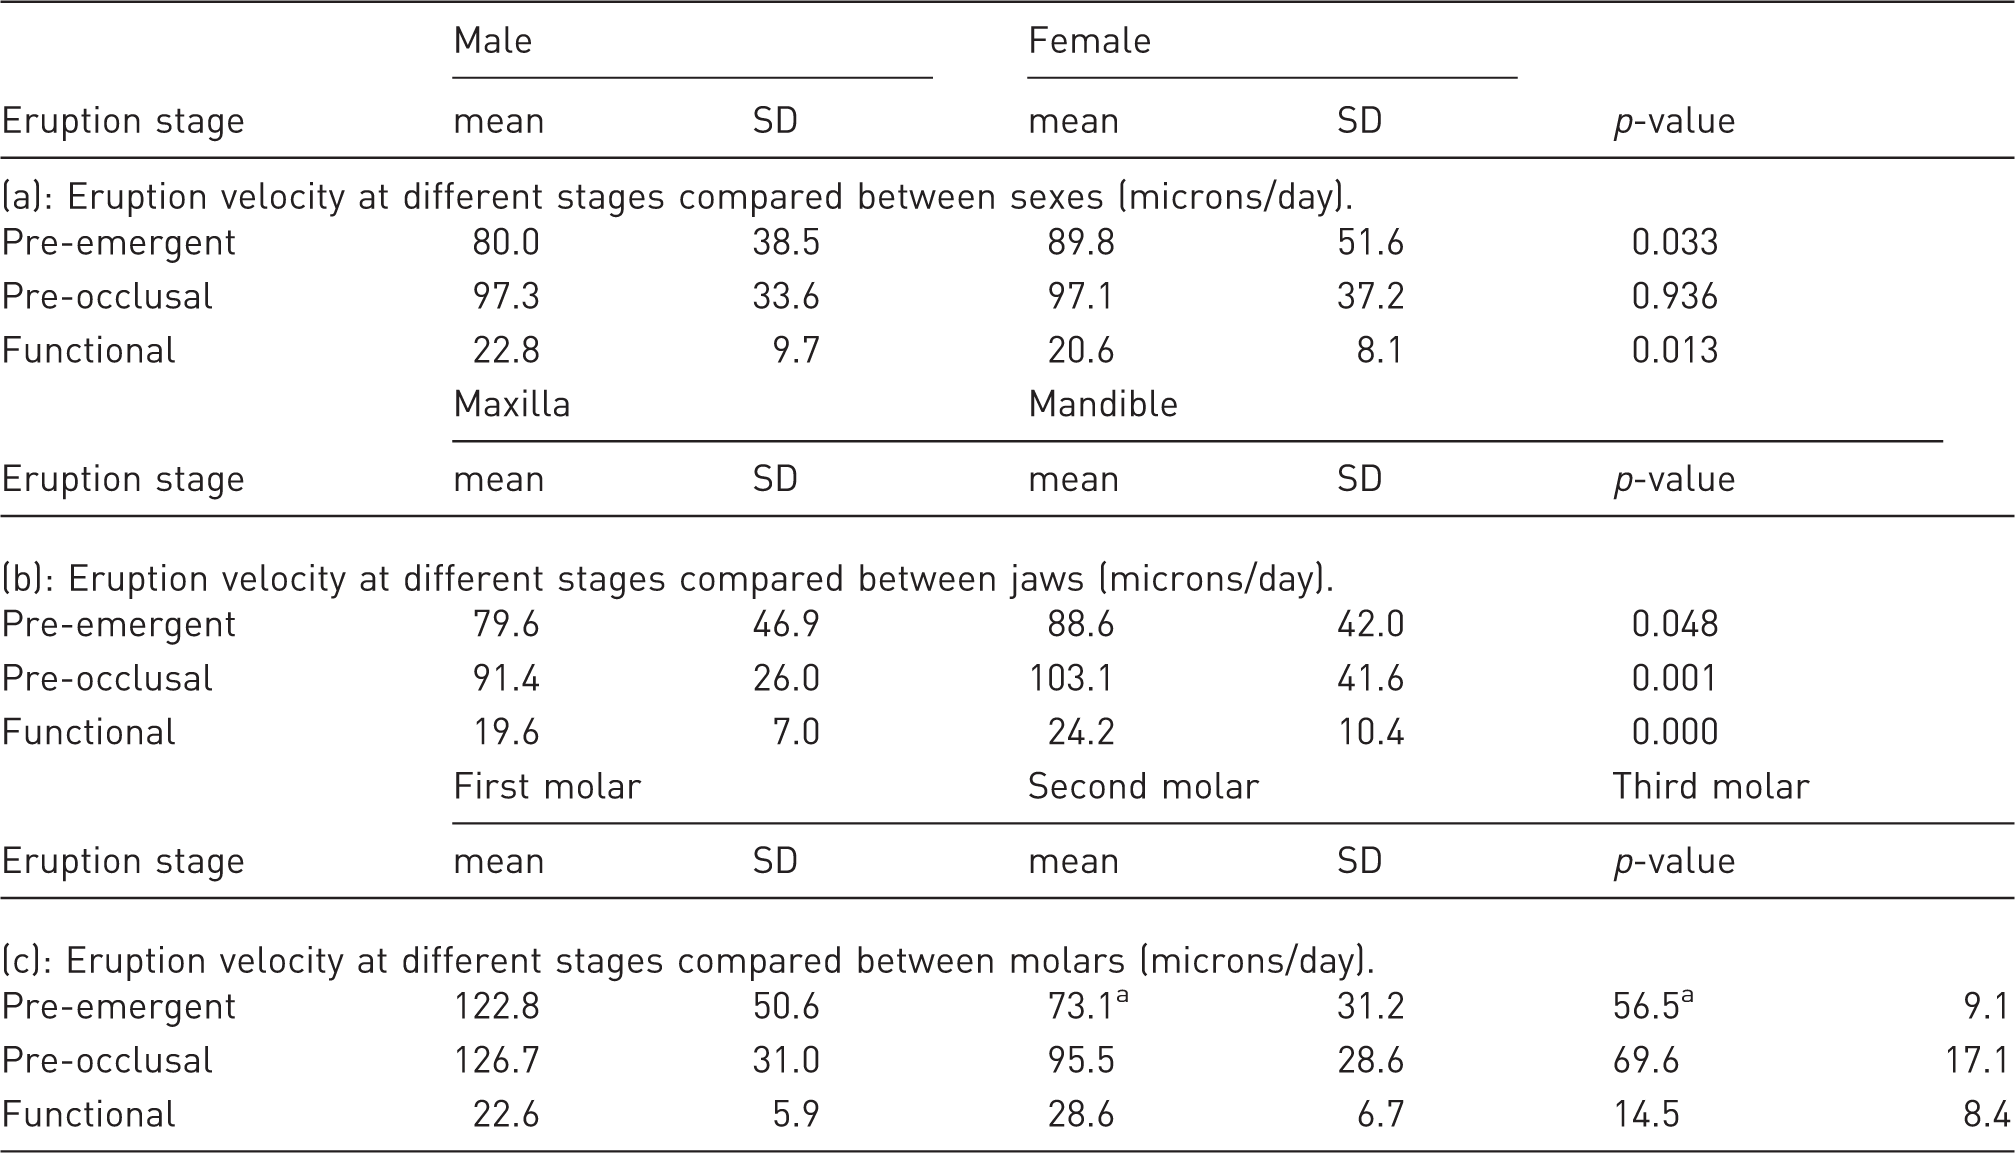
SD: standard deviation
All row-wise p-values p < 0.001 except ap = 0.003.
Discussion
The aim of this study was to establish the precise time of eruption day, occlusion day and eruption velocities of albino Wistar rat molars by following the eruption longitudinally with in vivo micro-CT scans from 15 to 70 days of age. The first molar erupted on day 17 and occluded on day 18 with an overall velocity of 90.9 microns/day, the second molar erupted on day 20 and occluded on day 23 with an overall velocity of 65.9 microns/day, and the third molar erupted on day 33 and occluded on day 39 with an overall velocity of 47.0 microns/day. To ensure that the repeated anesthesia and micro-CT scanning did not affect the general and dental development of the rats, we compared the average weight and vertical tooth position of the experimental rats with control rats that were not exposed to the repeated procedure. Our findings indicated no significant differences between the control and experimental groups, neither in weight nor in tooth eruption. Our findings validate this longitudinal micro-CT approach for following tooth eruption in rats as an alternative to the traditional cross-sectional model.
The variation of the eruption and occlusion day ranged between ± 1 day, showing that there was a high range of variation between animals. For the most part, this variation could not be attributed to the side, jaw, sex, or weight of the animals with the exception of the third molar where the mandibular molars erupted a half a day sooner than the maxillary molars. This finding is contrary to Hoffman and Schour 7 who stated all the maxillary molars to erupt one day later than the mandibular. The eruption process being a complex multifactorial process, the precise prediction of eruption and occlusion days is not possible with simple factors such as weight or sex. Thus, planning of experiments that concern the pre-occlusal eruption must take into account and compensate for this variation either by monitoring the eruption with in vivo micro-CT, increasing the number of animals or choosing to study the second or third molar where the pre-occlusal eruption time is longer.
Although Hoffman and Schour 7 have previously described the day of eruption and of first occlusion, their data show discrepancies with later studies. The eruption day of the first molar is stated as day 19, as opposed to Grier and Wise 9 who found it to be day 17 and Wise et al. 10 day 18. Furthermore, the period between the first molar and second molar eruption varies between 3 days after the first molar 7 and 7 days. 10 Our study brings a more precise description of eruption and occlusion day, including the standard deviations of the measurements, which tend to indicate that most of the differences between studies probably arises from the physiologic variations. Different strains of albino rat could also be an influencing factor but this hypothesis is not retained because both studies used the same Harlan Sprague-Dawley strains.9,10 Another hypothesis is the variation in environmental conditions such as housing and social conditions which can influence tooth eruption through stem cells or epigenetic markers. Our results are in line with eruption and occlusion days cited by other publications when we include the physiologic variability. In general, the eruption times that we observed were shorter than Hoffman and Schour 7 but the eruption rates were rather similar. 8
The eruption of the first and second molars occurred 3 days apart while the third molar erupted approximately 2 weeks after the second molar. The duration of the pre-occlusal phase showed a linear increase from the first to the third molar, with an increment of approximately 2 days, indicating that the eruption rate must decrease. Indeed, our results show a decrease of eruption rate from first to third molars in both the pre-emergent and pre-occlusal phases. The duration of eruption is 2–3 times longer in second molar and 5–6 times in the third compared with the first molar, however the difference in eruption rate is only 1.3 times and 1.8 times respectively. This difference between duration of eruption and eruption velocity between the three molars can be explained by the continuous eruption of the adjacent molars, which continue to increase the alveolar bone height and thus increase the eruption distance to the occlusal plane. If this functional eruption is taken into account, the pre-occlusal eruption velocity difference explains most of the difference observed between the three molars in pre-occlusal eruption duration. Due to the morphology of the rat jaws, the alveolar height needs to develop taller in the mesial region compared with the distal. In other words, this variation of eruption velocity may be a key factor for the control of lower face vertical growth, (i.e., the difference between short- and long-face tendencies). 12
In the functional phase, the differences between the molars is smaller and the second molar has the highest rate. The teeth remain in occlusion during the functional period by means of the functional eruption, which is necessary for compensating the vertical skeletal growth and the occlusal wear. 12 Progressively the skeletal growth decreases as the animal approaches its adult size and the functional eruption increasingly serves to compensate for occlusal wear. The functional eruption is a particularly important process to understand because it is linked to many pathologies: anterior and lateral open bite, overeruption of unopposed teeth and occlusal height differences with implant supported restorations.13–15 The underlying mechanisms of the post-emergent eruption and their regulators have not been identified, but the main tissues involved are the alveolar bone and the periodontal ligament. The alveolar bone remodeling rate might be a limiting factor to eruption through the attachments to the tooth via supracrestal collagen fibers, 16 but most likely only well into adulthood when overall growth potential is low. The periodontal ligament on other hand may have the capacity to change the eruption rate through signaling pathways in response to local occlusal conditions. There may also be preprogrammed genetic differences in between the different molars that define the overall eruption rate depending on the amount of alveolar bone growth that is necessary in a given region. Most likely, both of these mechanisms exist simultaneously, with the genetic component being the source of eruption potential and the occlusal stimuli acting on it as a regulator.
One limitation of this study is that the results apply only to one strain of rats (Wistar) and therefore the conclusion cannot be assumed to be exact for other strains, although they can serve as general guidelines.
This data improves our knowledge of the eruption pattern of rat molars and may serve in the planning of future studies related to the post-emergent eruption. Our current understanding of this mechanism is incomplete and needs further investigation and the rat is well-adapted model. Furthermore, we have shown that repeated in vivo micro-CT scanning is an effective way to study tooth eruption with a longitudinal design.
Footnotes
Declaration of Conflicting Interests
The author(s) declared no potential conflicts of interest with respect to the research, authorship, and/or publication of this article.
Funding
The author(s) disclosed receipt of the following financial support for the research, authorship, and/or publication of this article: Schweizerischer Nationalfonds zur Förderung der Wissenschaftlichen Forschung, (Grant/Award Number: ‘31003A_144202').