
Abstract
The dog is a widely-used model for conducting metabolic studies. This is mainly due to its large size and its physiology which is relatively similar to that of humans. Here, we attempted to optimize a postprandial metabolic study protocol used in dogs. Following acclimatization, female mongrel dogs underwent 9 h profiling for time-course baseline plasma data on triglyceride, adrenocorticotropic hormone (ACTH) and cortisol levels. One week later, carotid and jugular catheters were surgically inserted for sampling and infusions. Initial post-operative care, based on the literature (Protocol 1), consisted of analgesia (buprenorphine every 8–12 h and 2–3 doses/day of acepromazine), restriction by Pavlov harness within cages, and a two- to three-day recovery period. Throughout the experiment, dogs received a lipid tracer diluted in 5% bovine serum albumin (BSA). Compared with baseline, animals vomited (n = 6/6) and exhibited high ACTH + cortisol levels (stress biomarkers), resulting in blunted triglyceride peak levels. To avoid these undesirable effects, post-operative care was modified (Protocol 2) as follows: animals (n = 19) were given a single dose of buprenorphine and no acepromazine, were unrestrained and free to move within cages, the recovery period was extended to seven days, and the lipid tracer was diluted in 0.002% versus 5% BSA. Using this modified protocol, postprandial plasma-triglyceride and ACTH/cortisol patterns were similar to baseline values. Controlling for stressors, as well as for factors which may alter proper digestion, is critical for all postprandial metabolic studies. Our results show that an optimized postprandial metabolic protocol used in dogs reduces experimental variability, while improving animal care and comfort.
Over the past few years, several metabolic studies have suggested a role for lipotoxicity in the development of metabolic anomalies in human disorders such as insulin resistance, metabolic syndrome and type 2 diabetes (T2D). 1 Lipotoxicity refers to the deleterious consequences brought on by an excessive exposure of non-adipose tissues to non-esterified fatty acids (NEFAs) versus exposure solely to a disproportionate fat mass. 2 Indeed, lipotoxicity results from defective adipose tissue storage, which explains why it is also observed in lean individuals. 3 This concept is currently shared by several hypotheses relating to the development of cardiometabolic disorders. 1 Human studies are curtailed by the fact that it is not ethically permissible to expose humans to frequent metabolic samplings, invasive in vivo measurements, and/or ex vivo assessments. Reliable animal models are therefore essential for the comprehensive study of the complex mechanisms underlying organ lipotoxicity.
Dogs have long been used as an animal model to study human metabolic diseases. 4 The use of dog models, as opposed to rodent models, as an experimental analog of human metabolic disorders is supported by the fact that many endocrine disorders, such as T2D, 5 are common to humans and dogs. 6 Indeed, obesity and insulin resistance develop in both species following excessive carbohydrate 7 or fat intake.8–10 Because of its large size compared with rodents, the dog model also facilitates the use of relatively invasive protocols which are otherwise much more delicate to conduct in small animals such as rodents. Humans and dogs also share a greater degree of genetic homology than do humans and rodents. This thus allows for the better extrapolation of dog results to humans and thus the further supported development of human clinical studies.5,11
Dog model metabolic protocols usually entail the use of surgically-inserted catheters. Importantly, unbiased observation of animal metabolism requires that the study animal physiology should remain unchanged throughout experimental procedures. It is thus crucial that animals do not experience stressors or significant adverse effects attributable to experimental infusions or medications. Experimental challenges are to be expected with the use of any new animal model. The aim of this study was to optimize experimental conditions for assessing fasting and postprandial fatty-acid metabolism in conscious and fully awake dogs, with a particular focus on stressors, sedatives and analgesic drugs, as well as on the concentration of bovine serum albumin (BSA) in infusions and the extent of the post-surgery recovery period.
Materials and methods
Animals
This animal model was developed to support lipotoxicity studies by several groups of investigators at our institution. Adult female mongrel Labrador dogs were obtained from a local kennel. Throughout the study, dogs were housed in individual pens under controlled temperature (21℃) and lighting conditions (12 h–12 h light–dark cycle). Animals were under the care of a certified veterinarian. Dogs included in this study were considered healthy as determined by routine physical examination by the veterinarian and normal canine results12,13 for body temperature (39.0 ± 0.5℃), hematocrit (>35%), stools, hepatic and renal function tests, white and red blood cell counts, glucose levels (<9 mmol/L), and plasma triglyceride (TG) levels (<0.5 mmol/L). Animals were at least one year old, had an initial mean body weight of 26 ± 1 kg, were free of parasites and other infestations, and were neither gravid nor lactating. All procedures were approved by the Institutional Animal Care and Ethics Review Committee and performed according to the guidelines published by the Canadian Council on Animal Care in science (CCAC).
Experimental procedures (Figure 1)
Acclimatization phase
Upon arrival and over two to three weeks until surgery, the dogs were acclimatized to their environment, under strict diet and controlled food intake. This period allowed animal technicians to better detect any modification in behavior and possible signs of pain/discomfort. They were fed according to the National Research Council recommendations for canine maintenance, i.e. 132 kcal of metabolizable energy per kilogram of body weight. Meals composed of dry Purina dog chow (Nestlé Purina, Mississauga, ON, Canada) were presented once daily at 09:00 h and removed one hour later. All dogs consumed the entire offered meal within 3–5 min. Food intake was measured daily and body weight was recorded twice a week during the entire study. Weight stabilization was obtained following calibration of the caloric intake.
Experimental timeline schedule. The white arrow indicates the events beginning with the arrival of the dogs until the day of the experiment. Black arrows are detailed timelines of profile and experimentation days. Time points from −30 to 9 h and −510 to 540 min represent the blood sampling times, with vertical lines illustrating different important events associated with the procedures.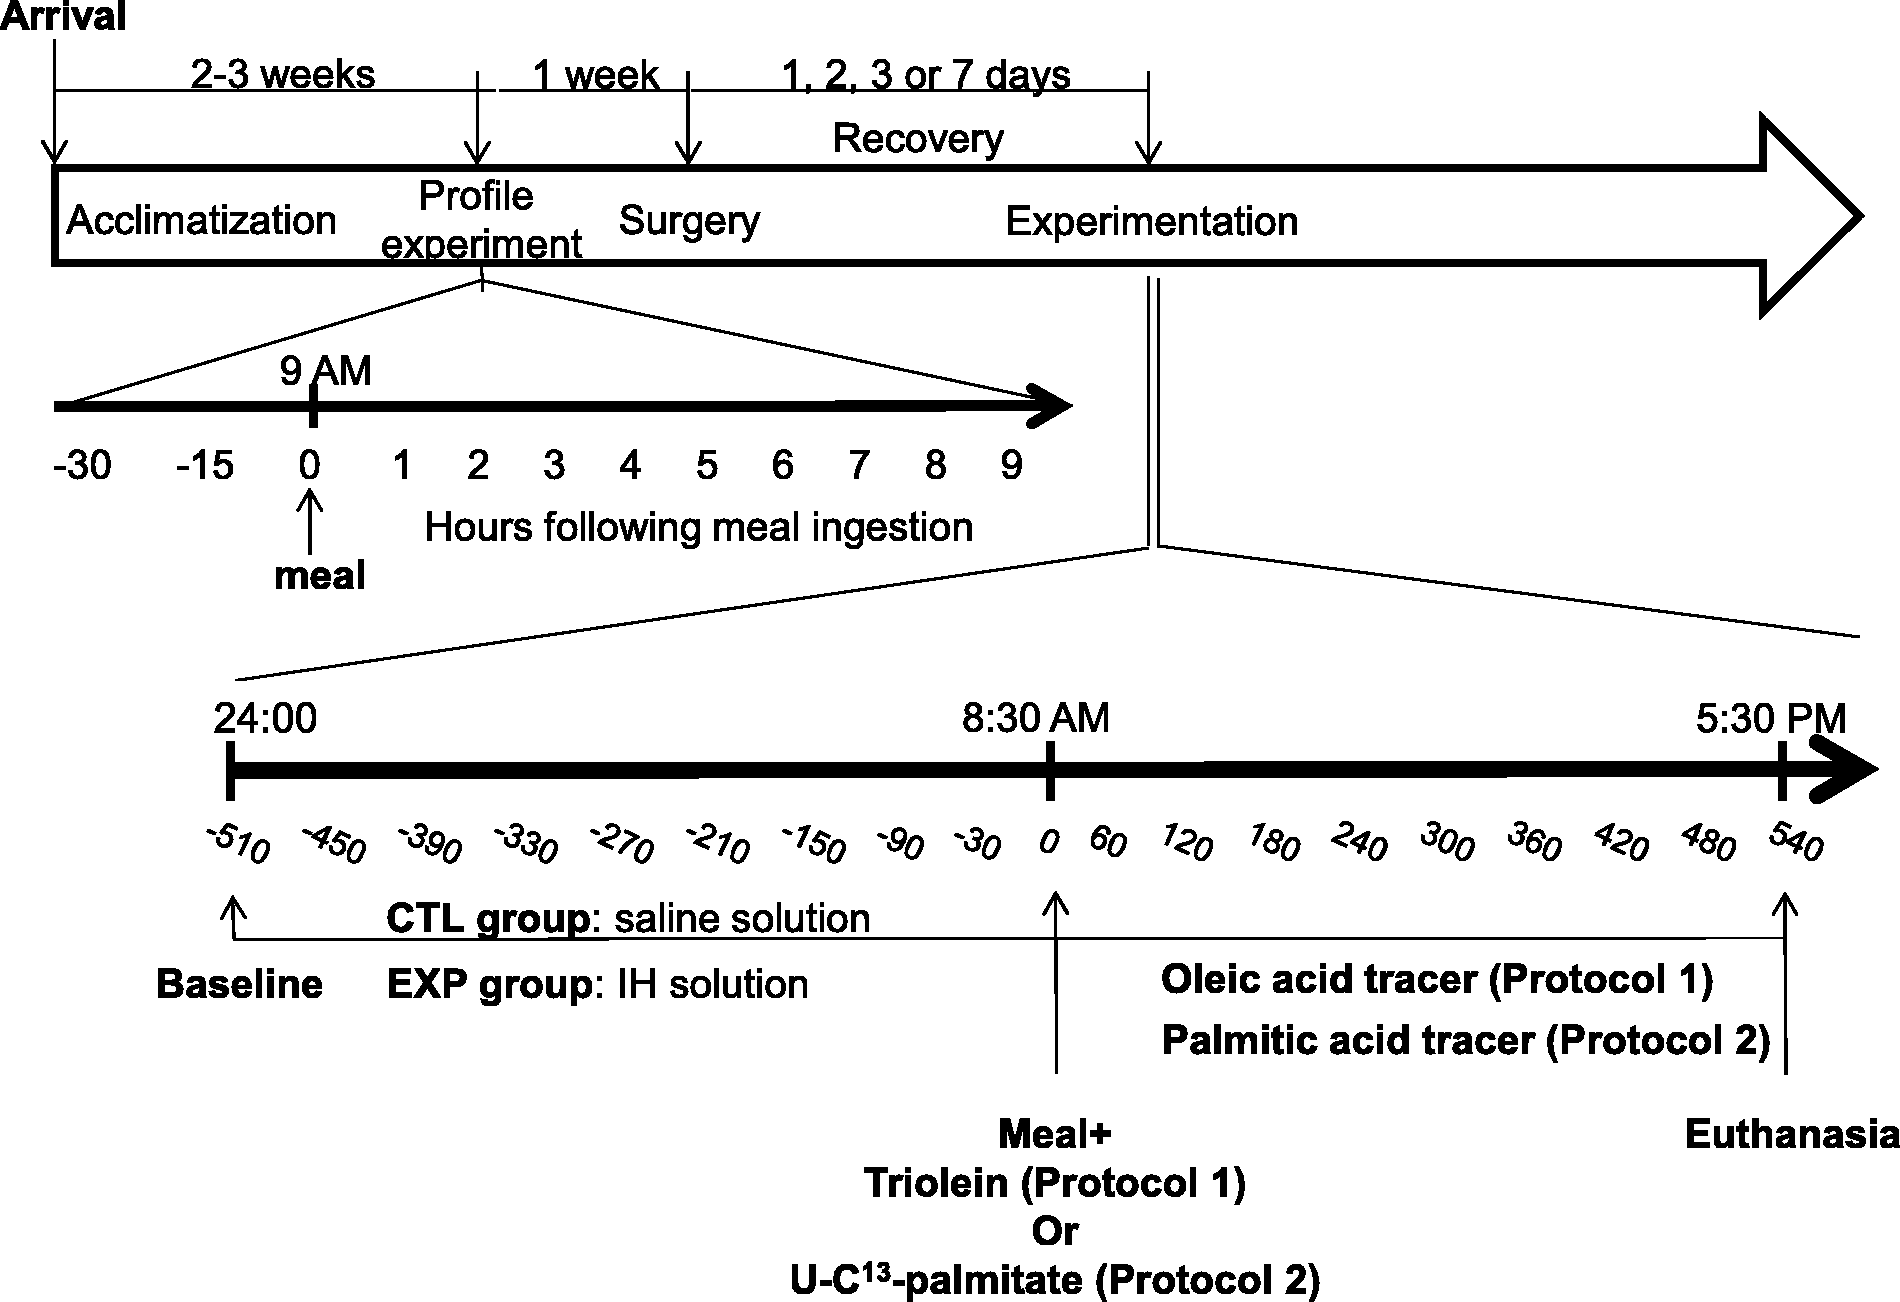
To ascertain normal and basal metabolic (TGs) and stress (adrenocorticotropic hormone [ACTH] and cortisol) status, a profile assessment was conducted under normal conditions one week prior to surgery. A 20–22 gauge catheter was surgically inserted into the cephalic vein and, to prevent clotting, was frequently flushed with a saline–heparin solution (1000 U/mL, Hepalean; Organon, Toronto, ON, Canada). Dogs were then offered a meal at 09:00 h, as described above. Blood samples were drawn under fasting state, 30 and 15 min before feeding, and every hour for 9 h after feeding. Samples were stored at −80℃ until they were assayed.
Pre-surgery and surgical procedures
Main anthropometric and biochemical characteristics of animals at baseline on the day (D0) preceding the surgery.
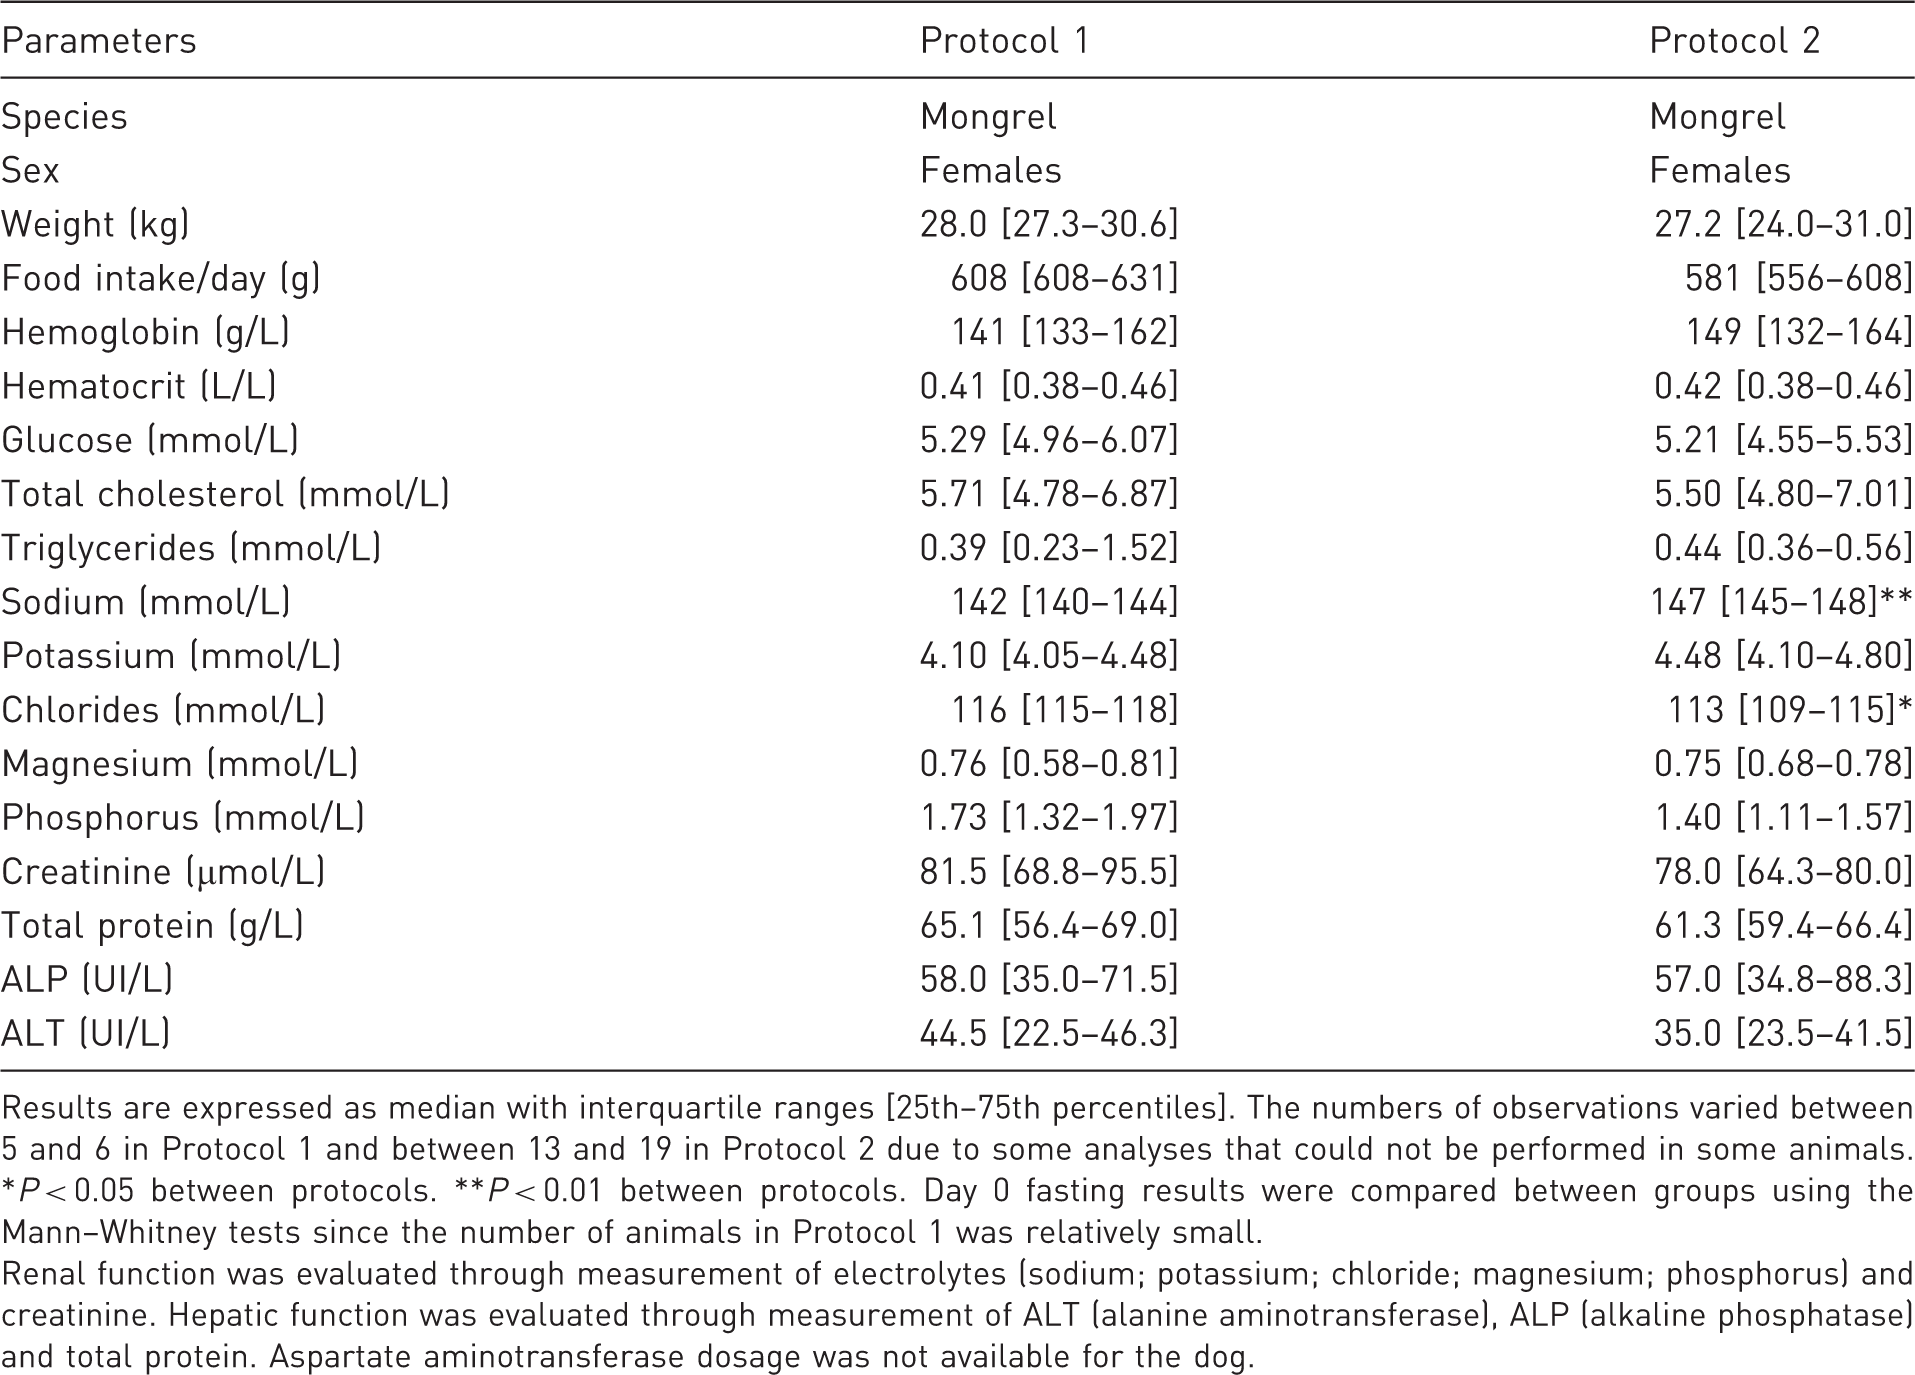
Results are expressed as median with interquartile ranges [25th–75th percentiles]. The numbers of observations varied between 5 and 6 in Protocol 1 and between 13 and 19 in Protocol 2 due to some analyses that could not be performed in some animals. *P < 0.05 between protocols. **P < 0.01 between protocols. Day 0 fasting results were compared between groups using the Mann–Whitney tests since the number of animals in Protocol 1 was relatively small.
Renal function was evaluated through measurement of electrolytes (sodium; potassium; chloride; magnesium; phosphorus) and creatinine. Hepatic function was evaluated through measurement of ALT (alanine aminotransferase), ALP (alkaline phosphatase) and total protein. Aspartate aminotransferase dosage was not available for the dog.
Surgical procedures were adapted from Giacca and colleagues 14 and optimized as follows. Two pre-mounted catheters (Silastic catheter, 0.03 in ID × 0.065 in OD for jugular, 0.04 in ID × 0.085in OD for carotid; Dow Corning, Midland, MI, USA) with PRN (BD luer-lock adapter with short ¾ inch offset flow path; BD, San Jose, CA, USA) were inserted into the carotid artery and jugular vein respectively for sampling and perfusion. PRN is a port adapter, connected to the distal end of the catheter, serving as an access line to the remaining catheter which is internalized under the skin. Following surgery, the dogs were equipped with an Elizabethan collar and a jacket (Lomir, Notre Dame de l'Île Perrot, QC, Canada) adapted to their morphology in order to prevent dislodging the PRN and catheters.
Post-surgery recovery
Main biochemical characteristics of five animals included in Protocol 2 during the post-surgery week.
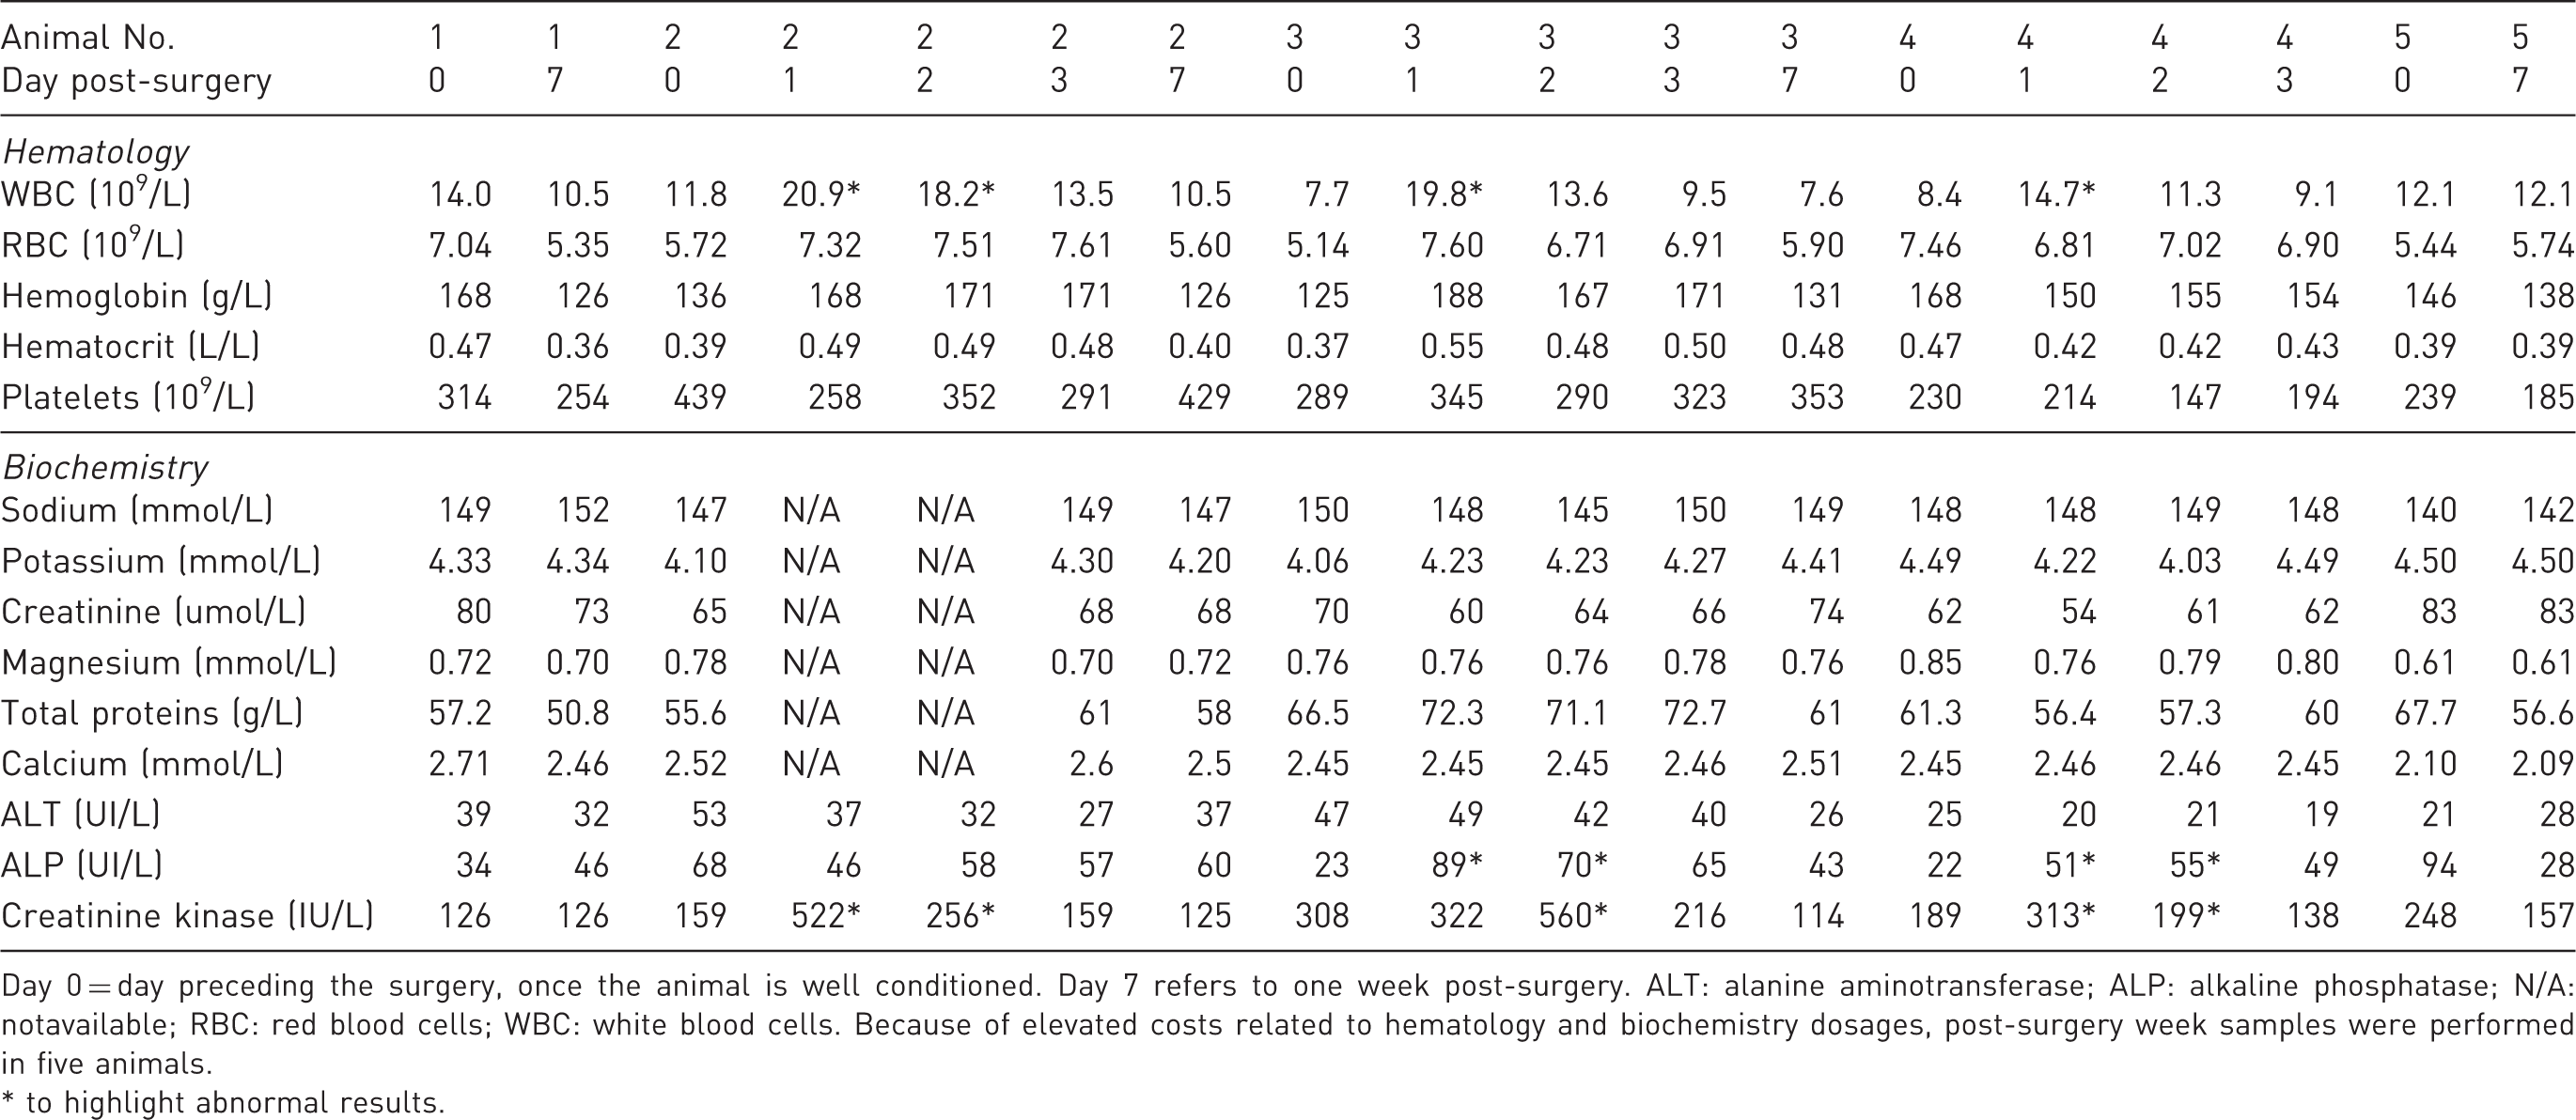
Day 0 = day preceding the surgery, once the animal is well conditioned. Day 7 refers to one week post-surgery. ALT: alanine aminotransferase; ALP: alkaline phosphatase; N/A: notavailable; RBC: red blood cells; WBC: white blood cells. Because of elevated costs related to hematology and biochemistry dosages, post-surgery week samples were performed in five animals.
* to highlight abnormal results.
Experimentation
The extent of the recovery period, following surgery and prior to experimentation, varied according to the protocol used (see below). For each protocol, dogs were split into two groups: the control group received an 8 h continuous infusion (24:00 h to 08:00 h [Figure 1]) of a normal saline solution, while those in the experimental group were infused, over the same period, with Intralipid 20% (0.02 mL/kg/min; Baxter), a TG emulsion combined with heparin (IH, 0.5 U/kg/min; Sandoz, Boucherville, QC, Canada). Heparin activates endothelial lipoprotein lipase which catalyzes the hydrolysis of infused TGs into NEFAs and glycerol. At 08:30 h, the dogs were fed their regular chow and infused 10 min later with various tracers for the ensuing 9 h postprandial period, in order to assess postprandial metabolism. Infused solutions were prepared under sterile conditions. Blood samples were drawn from the catheter in the carotid artery 30 and 15 min prior to the initial infusion in order to determine steady-state parameters, 30 and 15 min before feeding (i.e. 8 h later), and every hour thereafter over the 9 h postprandial period (i.e. starting at the time of feeding). These blood samples were used to measure TGs, ACTH, cortisol and NEFAs. Following blood sampling, animals were sedated with a mixture of acepromazine (0.25 mg/kg subcutaneously) and heparin (5000 U; Sandoz), anesthetized 30 min later with sodium pentobarbital (25 mg/kg intravenously; Vétoquinol Canada Inc) and the beating heart was then quickly removed. Necropsy was performed to confirm the position of implanted vascular catheters and to collect organs and tissues for future use.
Protocol 1
Following surgery, animals received intramuscular doses of buprenorphine (0.02 mg/kg) every 8 to 12 h for 48 h, as postoperative analgesic treatment. In addition, dogs which exhibited signs of agitation on the day of the metabolic study received subcutaneous doses of acepromazine (0.1 mg/kg, 2 to 3 doses/day). These drugs have been widely used in dogs as per the literature.12,15,16 Experiments started 2–3 days after surgery. Dogs were kept in their pens, and restrained by a Pavlov harness (hammock) for the duration of the metabolic study. In this protocol, an isotopic intravenous oleic–acid tracer ([11, 11-D2] oleic acid; Cambridge Isotope Laboratories, Andover, MA, USA) was diluted in a 5% BSA solution and infused at a rate of 0.22 µmol/kg/min, to determine postprandial NEFA turnover. A molar ratio of 1 mole of BSA for 3 moles of oleic–acid tracer was maintained to ensure proper conjugation of oleic acid to BSA. This isotopic tracer infusion was adapted to the dog model based on results obtained from our human protocol and from reports on canine models in the literature. 17 Triolein (9, 10-3H, 300 µCi; Cambridge Isotope Laboratories) was added to the dog’s meal to determine postprandial metabolism of dietary TGs, as previously described in clinical human studies. 18
Main differences between Protocol 1 and Protocol 2.
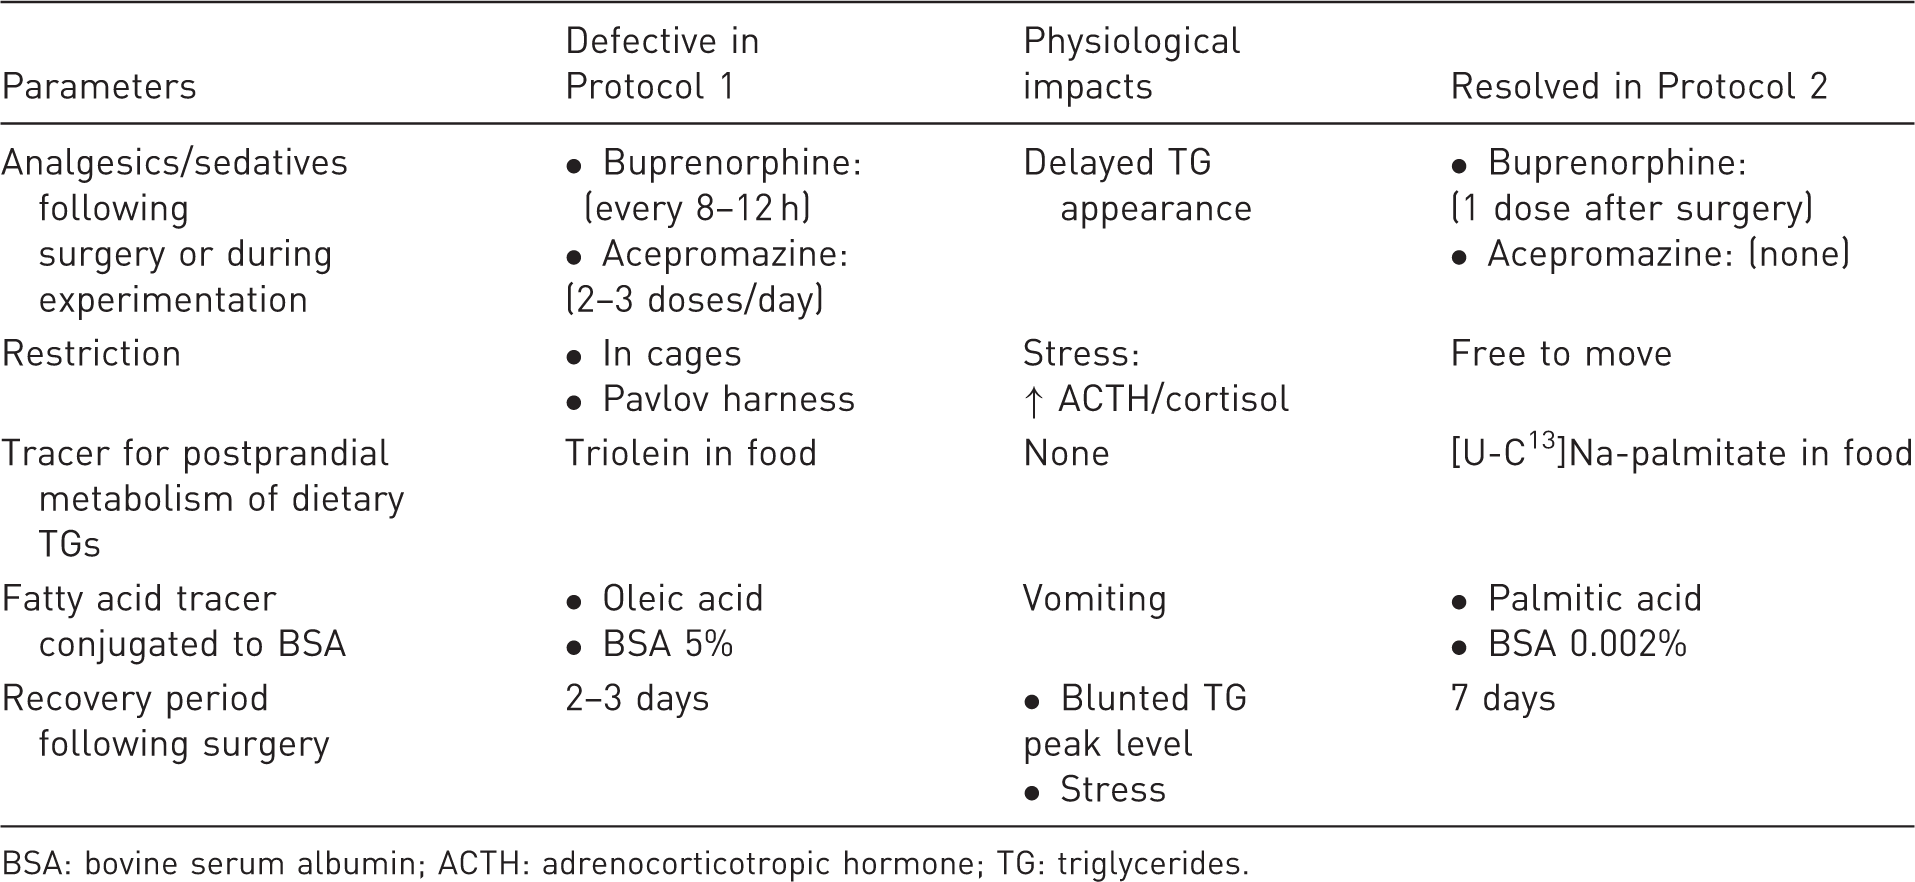
BSA: bovine serum albumin; ACTH: adrenocorticotropic hormone; TG: triglycerides.
Protocol 2
In the revised protocol (Protocol 2), dogs received a single dose of buprenorphine (0.02 mg/kg) immediately at the end of surgery, in order to control post-operative pain. No acepromazine sedation was used, as opposed to the original protocol. Post-surgery recovery was extended to seven days. Experiments were conducted in a quiet procedure room, using individual transport cages where dogs were free to move 360° around by themselves. A palmitic-acid radioactive tracer ([9, 10-3H] K palmitate; 2 µCi/min; Cambridge Isotope Laboratories) was used in lieu of the oleic–acid tracer. Since this compound is radioactive, a much smaller amount was required. It was thus diluted in a 0.002% BSA solution at a molar ratio of 1 BSA to 3 palmitic-acid molecules. [U-C13]Na-palmitate (3.6 mol/kg; Cambridge Isotope Laboratories), instead of triolein, was added to the food.
Physical and behavioral evaluation
Eleven point-based physical evaluation conducted daily by the veterinarian.
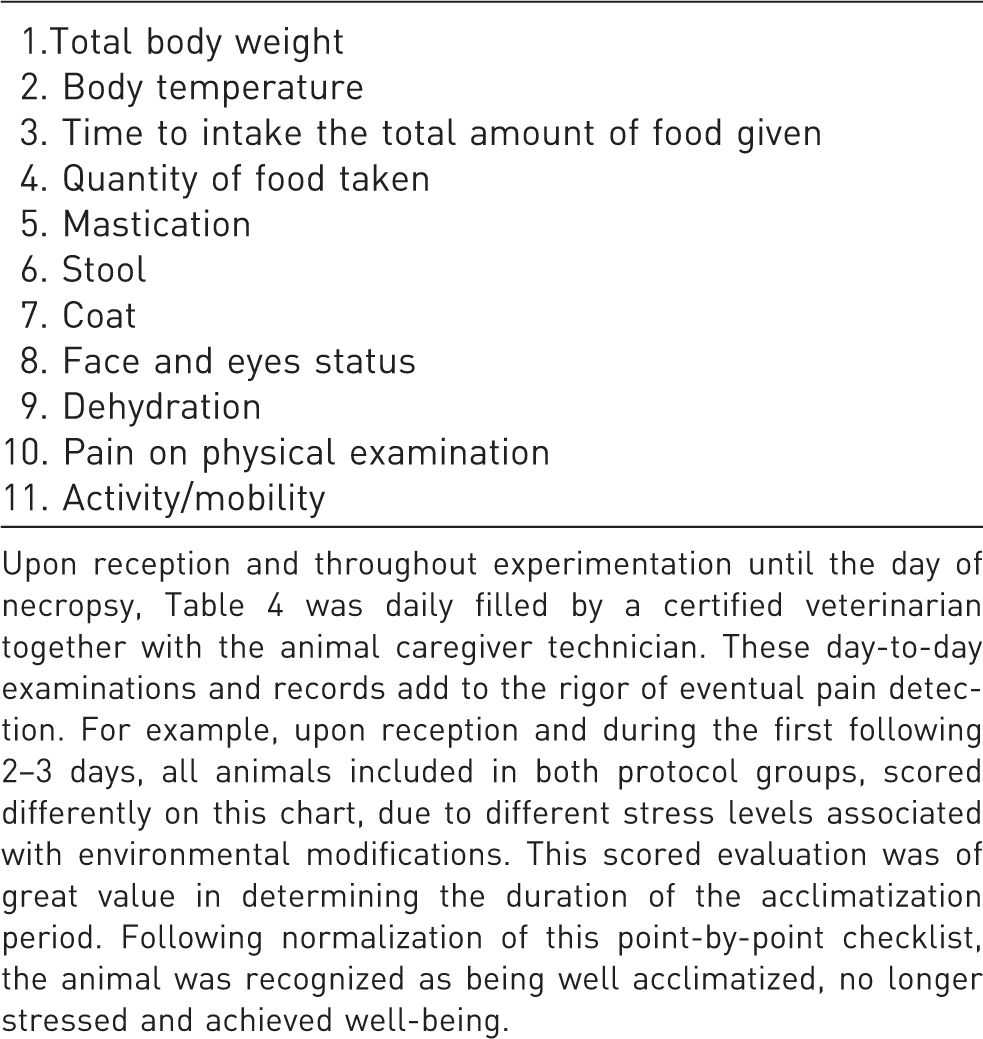
Upon reception and throughout experimentation until the day of necropsy, Table 4 was daily filled by a certified veterinarian together with the animal caregiver technician. These day-to-day examinations and records add to the rigor of eventual pain detection. For example, upon reception and during the first following 2–3 days, all animals included in both protocol groups, scored differently on this chart, due to different stress levels associated with environmental modifications. This scored evaluation was of great value in determining the duration of the acclimatization period. Following normalization of this point-by-point checklist, the animal was recognized as being well acclimatized, no longer stressed and achieved well-being.
Eleven point-based behavioral evaluation conducted daily by the veterinarian.
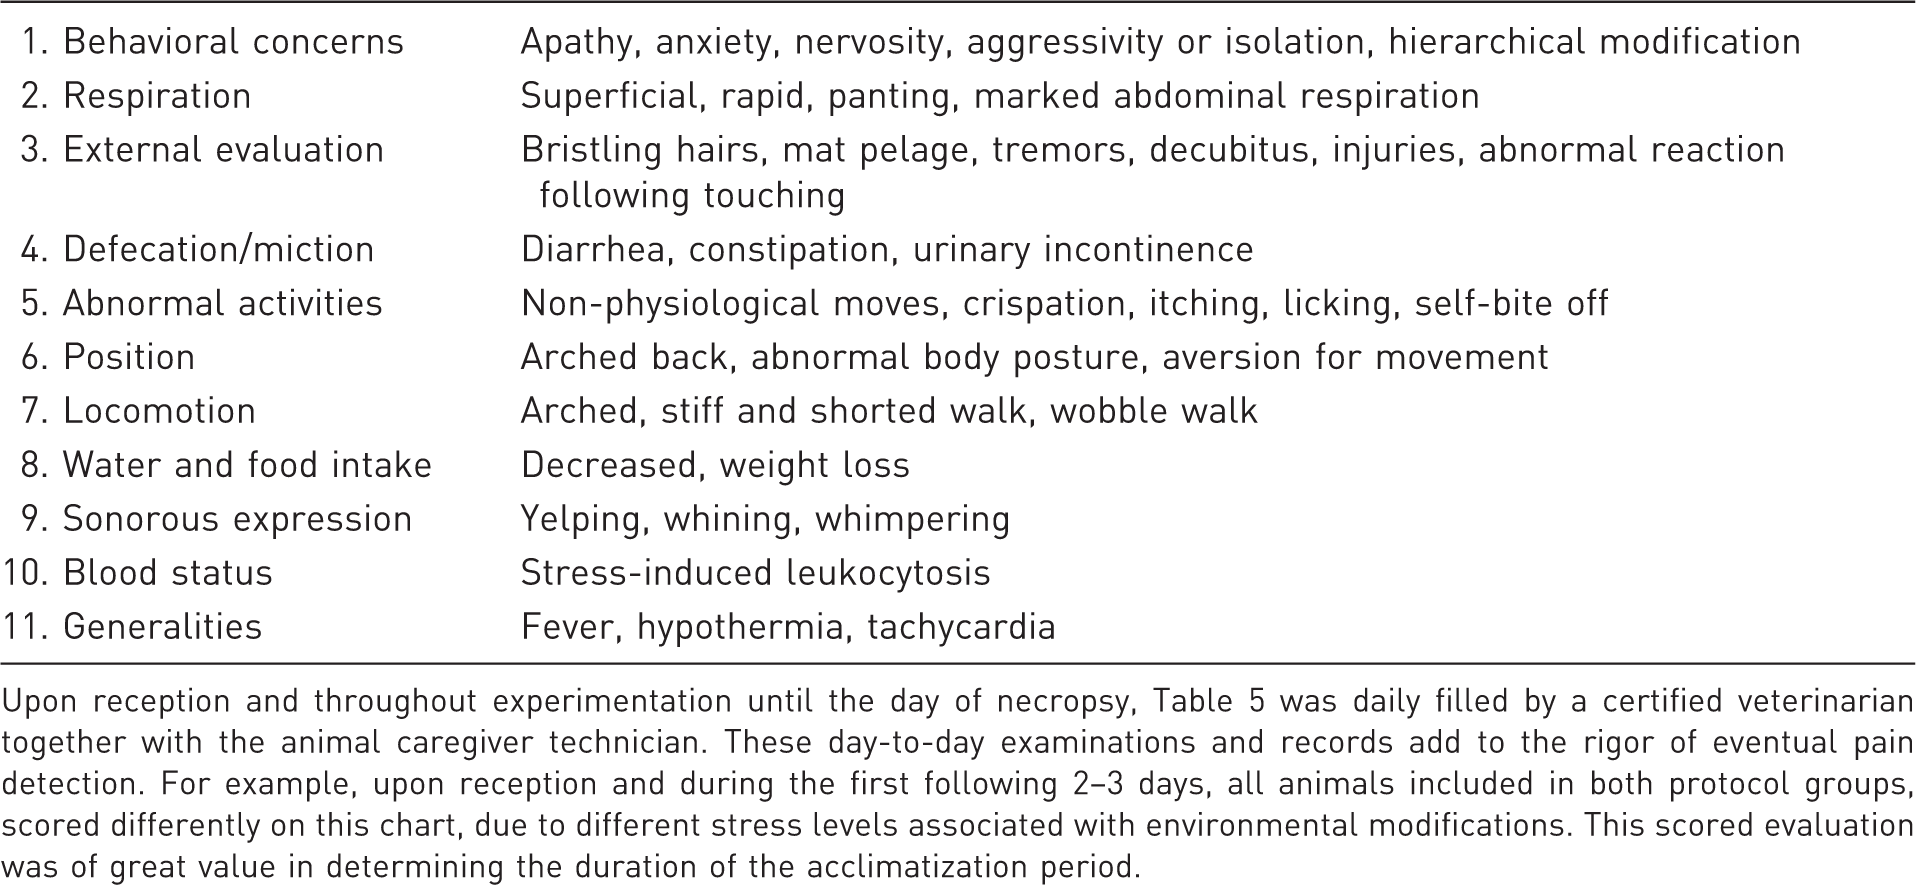
Upon reception and throughout experimentation until the day of necropsy, Table 5 was daily filled by a certified veterinarian together with the animal caregiver technician. These day-to-day examinations and records add to the rigor of eventual pain detection. For example, upon reception and during the first following 2–3 days, all animals included in both protocol groups, scored differently on this chart, due to different stress levels associated with environmental modifications. This scored evaluation was of great value in determining the duration of the acclimatization period.
Biochemical and metabolic analyses
Following collection, blood samples were transferred on ice in tubes containing EDTA as an anticoagulant, Trasylol (EMD Millipore, Billerica, MA, USA) to inhibit proteolysis, and Orlistat (Roche, Mississauga, ON, Canada) to prevent in vitro lipolysis. For determination of cortisol and ACTH levels, blood samples were collected in K2-EDTA tubes, centrifuged following collection, and the plasma was stored at −80℃ until assayed.
Plasma glucose concentration was determined using the glucose oxidase method (Raichem, San Diego, CA, USA). Plasma cortisol concentrations were determined according to a radioimmunoassay (RIA) method using a human antibody (MP Biomedicals, Santa Ana, CA, USA) previously adapted in our own laboratory for dog plasma against a dog-derived control. ACTH plasma was measured using a commercial RIA kit (Immunocorp, MP Biomedicals) adapted in our laboratory for dog plasma. Total NEFAs were quantified in plasma using a commercially available colorimetric assay based on the acylation of coenzyme A (CoA) (NEFA C kit; Wako Chemicals, Neuss, Germany). Fasting total cholesterol and plasma TG concentrations were determined using a colorimetric assay (respectively, Johnson & Johnson Clinical Diagnostics, Rochester, NY, USA; Trig/GB, Boehringer Mannheim/Roche Diagnostics, Indianapolis, IN, USA). In blood samples, hemoglobin and hematocrit were measured on an ABL 835 Flex blood gas analyzer combined to oximetry. Sodium, potassium and chloride were measured using an ion-selective electrode. Magnesium, total proteins, creatinine kinase and alkaline phosphatase (ALP) were measured using a colorimetric assay. Alanine aminotransferase (ALT) was measured by a standardized ultraviolet (UV) test, phosphorus by photometry and creatinine by using an enzymatic method. These analytes were measured by the Core Clinical Biochemistry Laboratory of the Centre Hospitalier Universitaire de Sherbrooke (CHUS). Complete blood counts were measured by the CHUS Core Clinical Hematological Laboratory (Sherbrooke, QC, Canada).
Plasma [U-13C]K-palmitate enrichment was measured following addition of heptadecanoic acid, as an internal standard, to plasma and mixed with acetone. Following centrifugation, the supernatant was mixed with hexane and re-centrifuged. Samples were evaporated and pellets were resuspended in a mixture of imidazole, N-methyl-N-T-butyldimethylsilyl trifluoroacetamide, 1% tert-butyldimetyl chlorosilane and N,N-dimethylformamide as derivative reagent. Samples were then injected onto an Agilent Technologies DB-5MS column, 30 m × 0.25 mm, film 0.25 µm with monitoring of ions 255 (C16:0), 271 (C16:0 M + 16) and 269 (C17, internal standard). Standard curves were generated for C16:0 M + 16 enrichment by using purified standards at known concentrations. Analyses were conducted using a GC Agilent 7890A system coupled to Tandem Mass Spectrometry (Quattro micro mass spectrometer; Waters, Milford, MA, USA). The intra- and inter-assay coefficients of variation were respectively 4% and 7% for all assays. Results are reported as the fraction of 13C-enriched plasma palmitate relative to the total amount of tracer ingested with food. Chemicals were purchased from Sigma-Aldrich (St Louis, MO, USA), EMD Millipore (Billerica, MA, USA), and Chromatographic Specialities (Brockville, ON, Canada).
Statistical analyses
Results were obtained from a total of six animals under Protocol 1, and 19 animals under Protocol 2. Profile experiments were performed in 17 of the 19 dogs under Protocol 2. IH (n = 6) and saline (n = 5) infusion experiments were reliable in 11 animals: NEFA levels and plasma tracer enrichment were therefore measured only in these dogs. Data not normally distributed are expressed as median with interquartile range (25th–75th percentiles). Statistical analyses are fully described in the legend of each table and figure shown. Analyses were performed using either GraphPad software version 6.02 (San Diego, CA, USA) or SAS software version 9.1 (SAS Institute Inc, Cary, NC, USA). All P values were considered significant at an α level of 0.05.
Results
Baseline characteristics of dogs on the day prior to surgery are shown in Table 1. Briefly, female mongrel dogs were all of the same age and weight. Animals included in Protocol 2 had non-clinically significant higher plasma sodium (P = 0.007) and lower chloride (P = 0.01) concentrations compared with those animals in Protocol 1. Other hematological and biochemical results were similar between groups and protocols, and were within normal ranges. However, following Protocol 1, all dogs (6/6) vomited and frequently scored positive for physical and behavioral parameters described in Tables 4 and 5. Dogs were agitated at the time of experimentation, which complicated the execution of technical procedures. These results suggested that these animals presented discomfort and pain, prompting us to modify the protocol. Fortunately, none of the 19 dogs included in Protocol 2 presented any vomiting, diarrhea or lethargy. Additionally, every animal ate its entire meal within 5 min, suggesting appropriate pain control. In addition, the unrestrained animals were calmer during experimental procedures as demonstrated by the normal scores for clinical parameters (Tables 4 and 5). To further assess whether animals included in Protocol 2 experienced adequate post-surgical analgesia and ascertain their degree of recovery, five animals were sampled on different days over the week between surgery and experimentation in order to assess biochemistry and hematology panels (Table 2). Table 2 shows that parameters most associated with pain control are white blood cell count (WBC), ALP and creatinine kinase. Indeed, these parameters frequently increased on day 1 post-surgery, stabilized by day 3 and normalized by day 7.
Postprandial excursion of TG levels is illustrated in Figure 2. As shown, on profile day (i.e. one week prior to surgery), TG levels (Figure 2) gradually increased following meal intake (i.e. time point 0) and peaked at 120 min. TG excursion was significantly blunted under experimental Protocol 1, with levels not peaking before 420 to 540 min. Protocol 2 restored the normal pattern of TG excursion. We found no significant difference in TG levels observed on profile day and in Protocol 2. TG excursion at 120 min was significantly lower in Protocol 1, compared with that observed on profile day and in Protocol 2 (Figure 2).
Evolution of plasma triglyceride concentrations during the postprandial period in dogs. Profile values (discontinuous line with circles) represent mean canine triglyceride levels during a 9 h period under the same conditions as during experimental day, but performed one week prior to surgery. Protocol 1 (full line with squares) and Protocol 2 (dotted line with triangles) are the results observed during the experimental day under each of these protocols. Point −510 is the first sampling time performed just prior to the start of the overnight perfusion in Protocols 1 and 2. Results are reported as mean ± SEM. Profile, n = 17; Protocol 1, n = 6; Protocol 2, n = 20. In the box on the right, P values were determined by repeated measures analysis of covariance (ANCOVA) using a linear model and corrected for multiple comparisons using post-hoc Tukey tests. ANCOVA analyses were verified for normality of the distribution of continuous variables and residuals. At time 120 min: P < 0.0001, Protocol 1 versus Profile (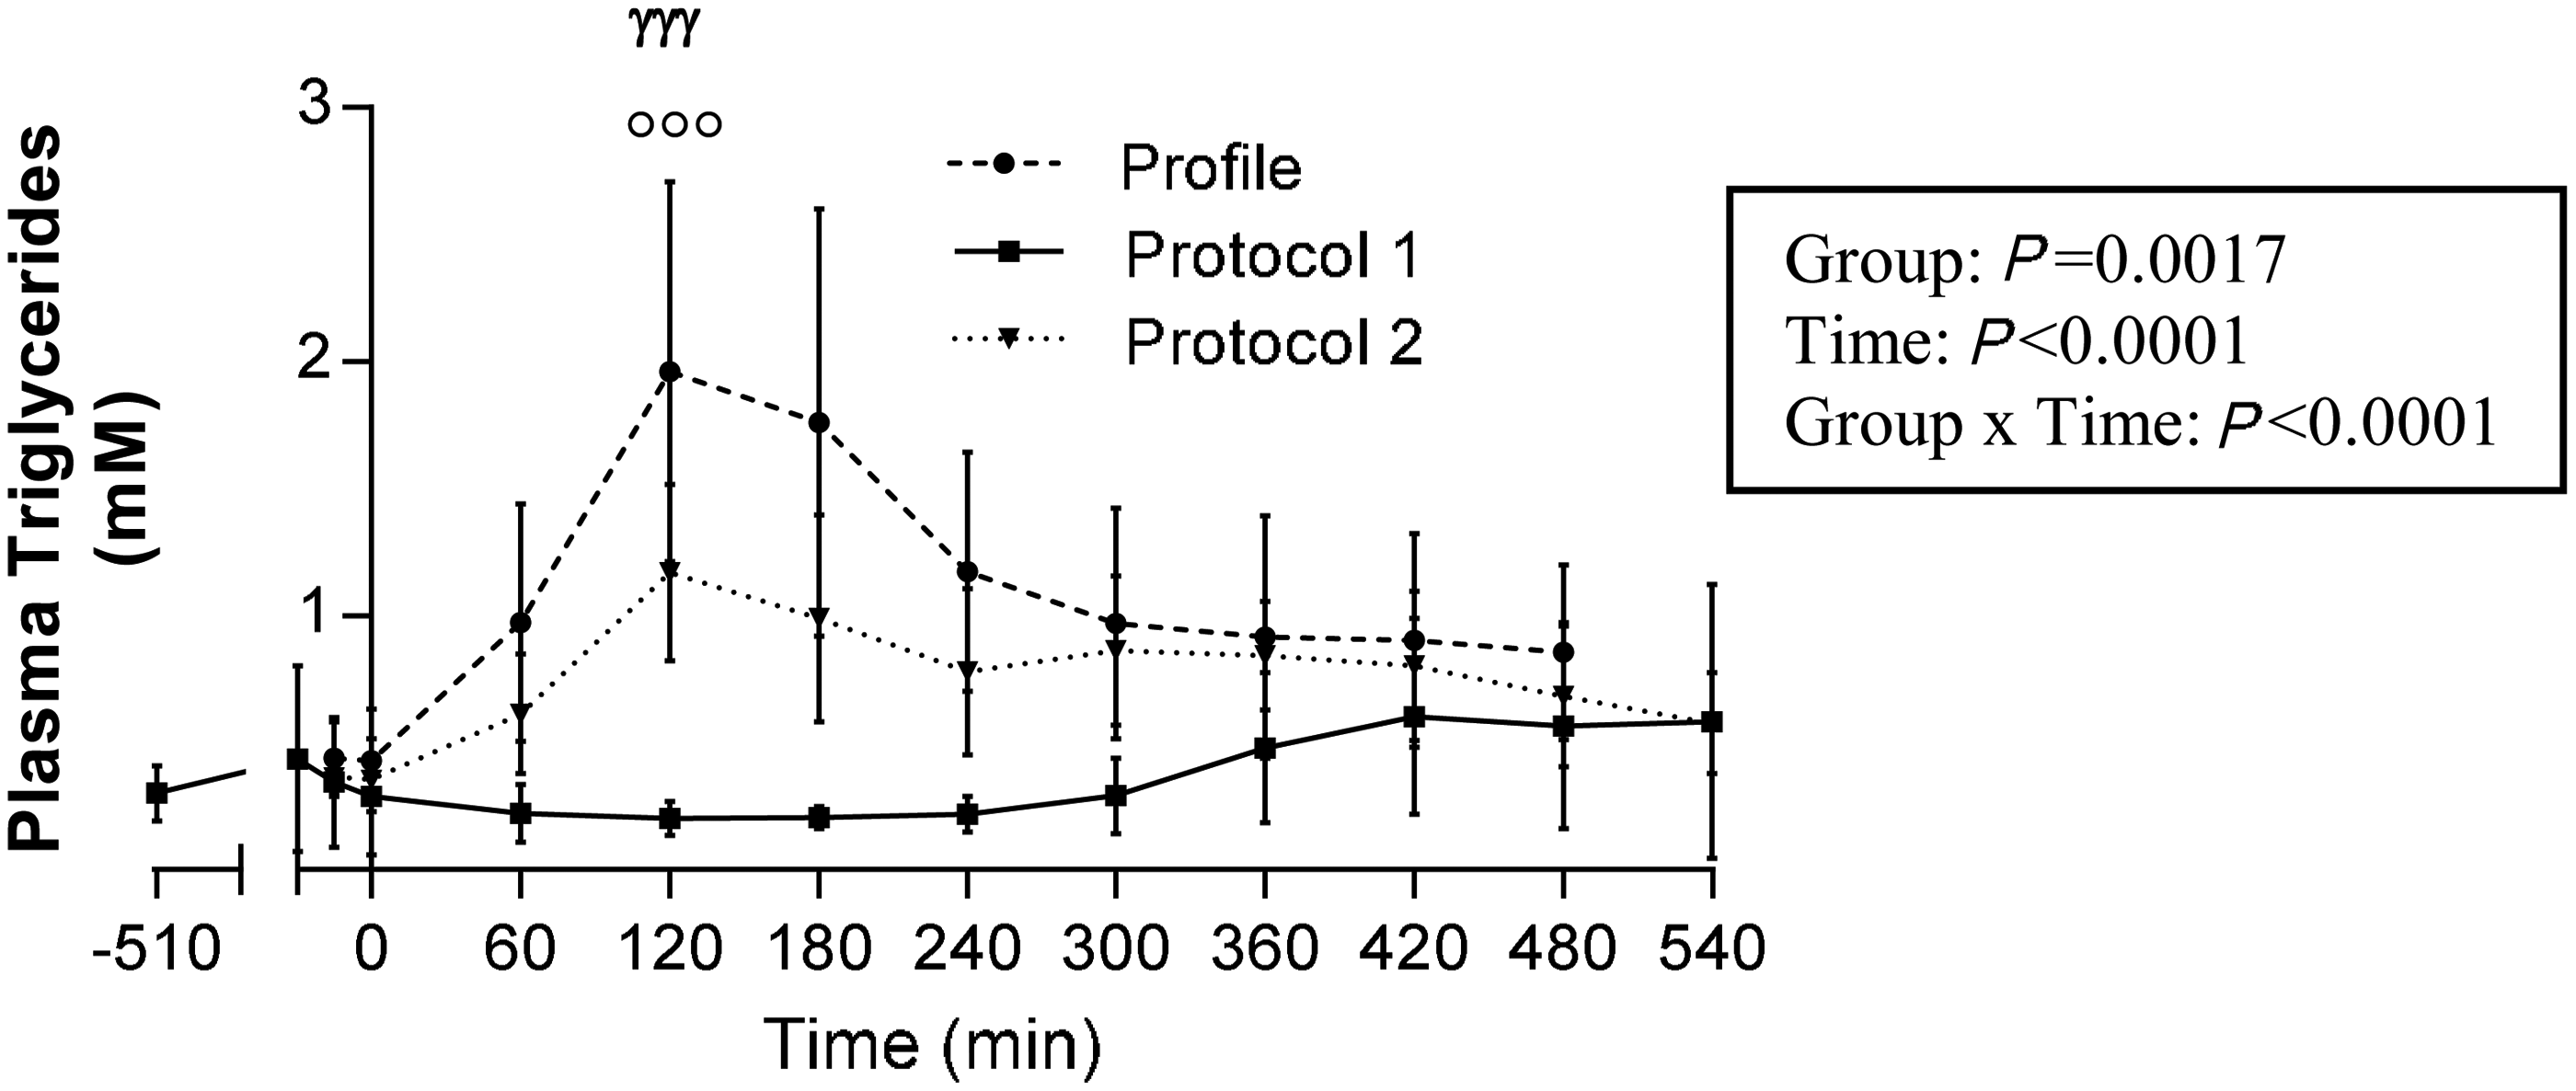
The two main hormonal markers of stress response are shown in Figure 3. On profile day, both ACTH (Figure 3a) and cortisol (Figure 3b) levels were constant and low throughout the entire day. However, under Protocol 1, both hormone levels rose postprandially and peaked at 180 min. Accordingly, at 180 min, cortisol levels were significantly higher under Protocol 1 than on profile day (P < 0.0001). By contrast, under Protocol 2, ACTH and cortisol levels remained normal throughout the experiment. Indeed, at 180 min, ACTH and cortisol levels were significantly lower in Protocol 2 than in Protocol 1 (P = 0.03 and P = 0.0006, respectively).
Evolution of plasma adrenocorticotropic hormone (ACTH) (a) and cortisol (b) concentrations during the postprandial period in dogs. The profile values (discontinuous line with circles) represent mean canine cortisol levels during a 9 h period under same conditions as during experimental day, but performed one week prior to surgery. Protocol 1 (full line with squares) and Protocol 2 (dotted line with triangles) are the results observed during the experimental day under each of these protocols. Point −510 is the first sampling time performed just prior to the start of the overnight perfusion in Protocols 1 and 2. Results are reported as mean ± SEM. Profile, n = 17; Protocol 1, n = 6; Protocol 2, n = 20. In the box on the right, P values were determined by repeated measures analysis of covariance (ANCOVA) using a linear model and corrected for multiple comparisons using post-hoc Tukey tests. ANCOVA analyses were verified for normality of the distribution of continuous variables and residuals. At time 180 min: (a) P = 0.148, Protocol 1 versus Profile; P = 0.861, Protocol 2 versus Profile; P < 0.03, Protocol 1 versus Protocol 2 (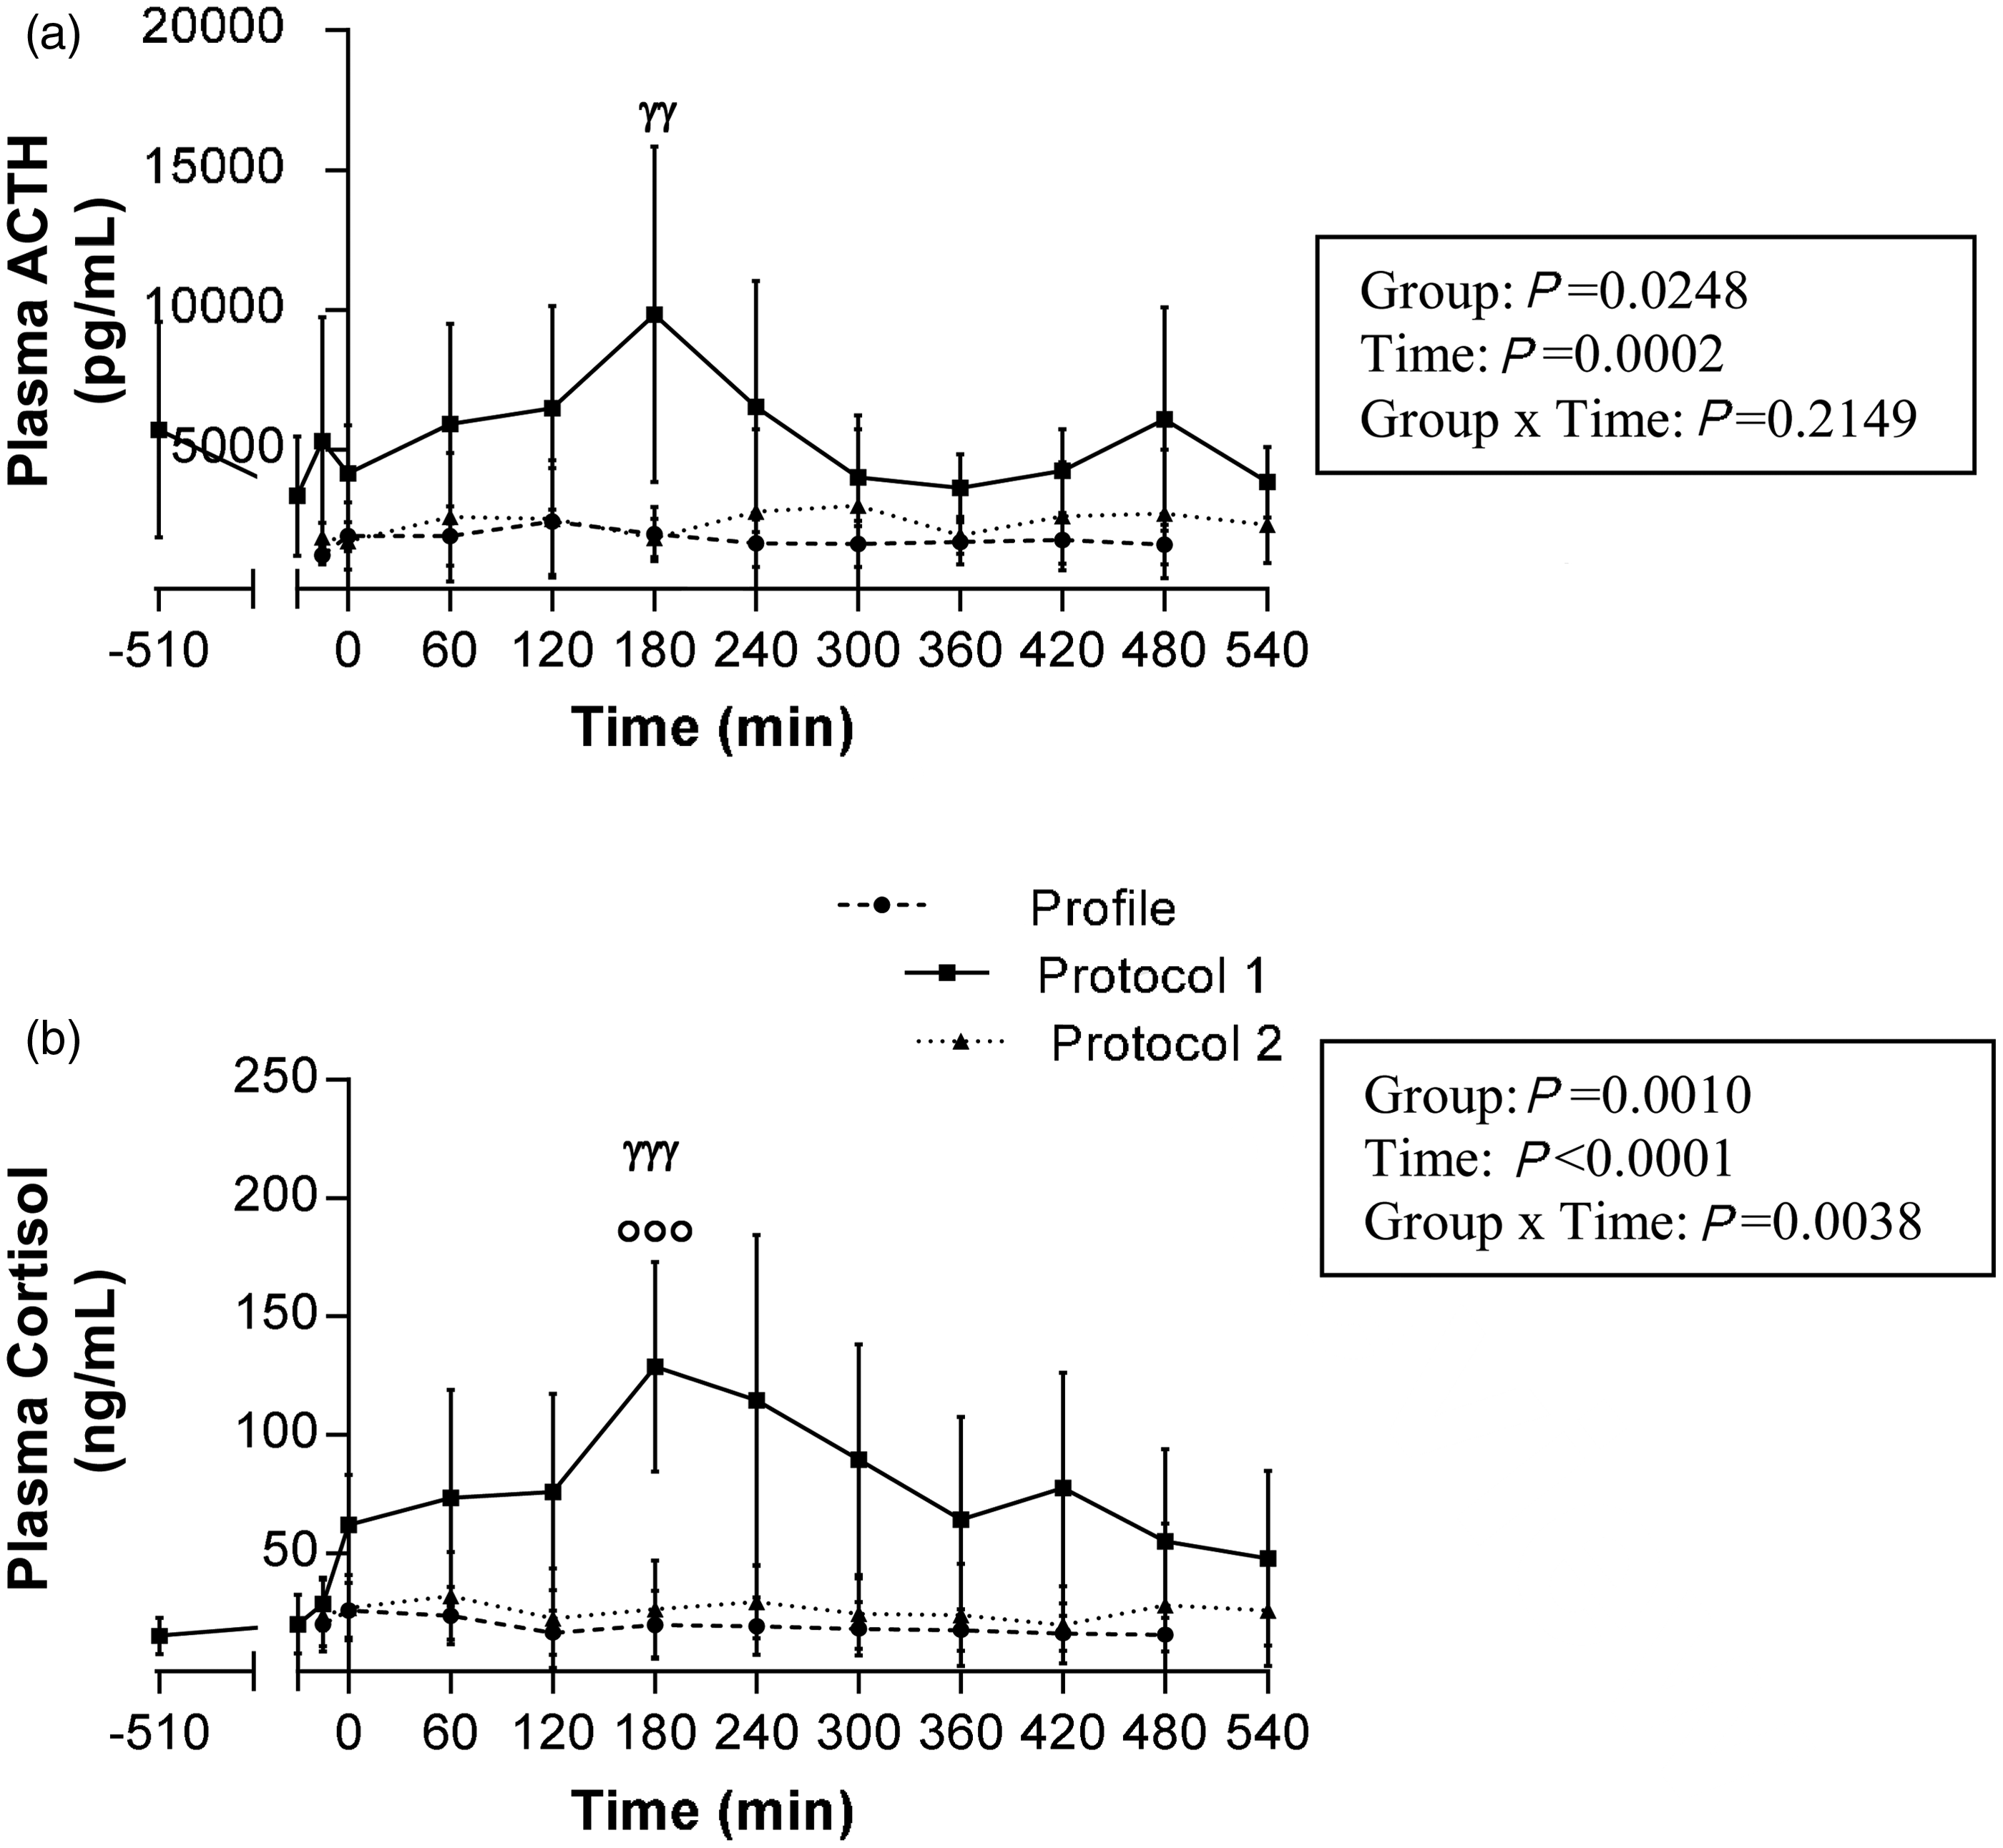
In order to determine whether the revised procedures of Protocol 2 adequately assessed postprandial TG metabolism, it was essential to first determine whether the palmitate tracer was efficiently absorbed and detectable in the circulation. Figure 4 shows postprandial enrichment of [U-13C]K-palmitate tracer under Protocol 2. Following ingestion, the percentage of tracer found in plasma peaked at 6.73% at 120 min (P = 0.004 from time 0), corresponding to the postprandial TG peak, and then decreased back to control levels. As Protocol 1 resulted in vomiting, tracer enrichment results were not considered valid.
Percentage of [U-C13] palmitic acid plasma enrichment during the postprandial period under Protocol 2 in dogs. Results are reported as the percentage of plasma palmitate tracer enrichment relative to the total amount of tracer administered in the food. Results are expressed as median with interquartile range including 11 dogs (saline group; n = 5; Intralipid–heparin; n = 6) for each sample point under Protocol 2. **P = 0.004 at time 120 versus 0 min and ***P = 0.001 at time 120 versus 540 min. Since NEFA levels were measured in only 11 dogs, non-parametrical tests were used to compare postprandial [U-C13] palmitate plasma enrichment with time (paired Wilcoxon signed rank tests).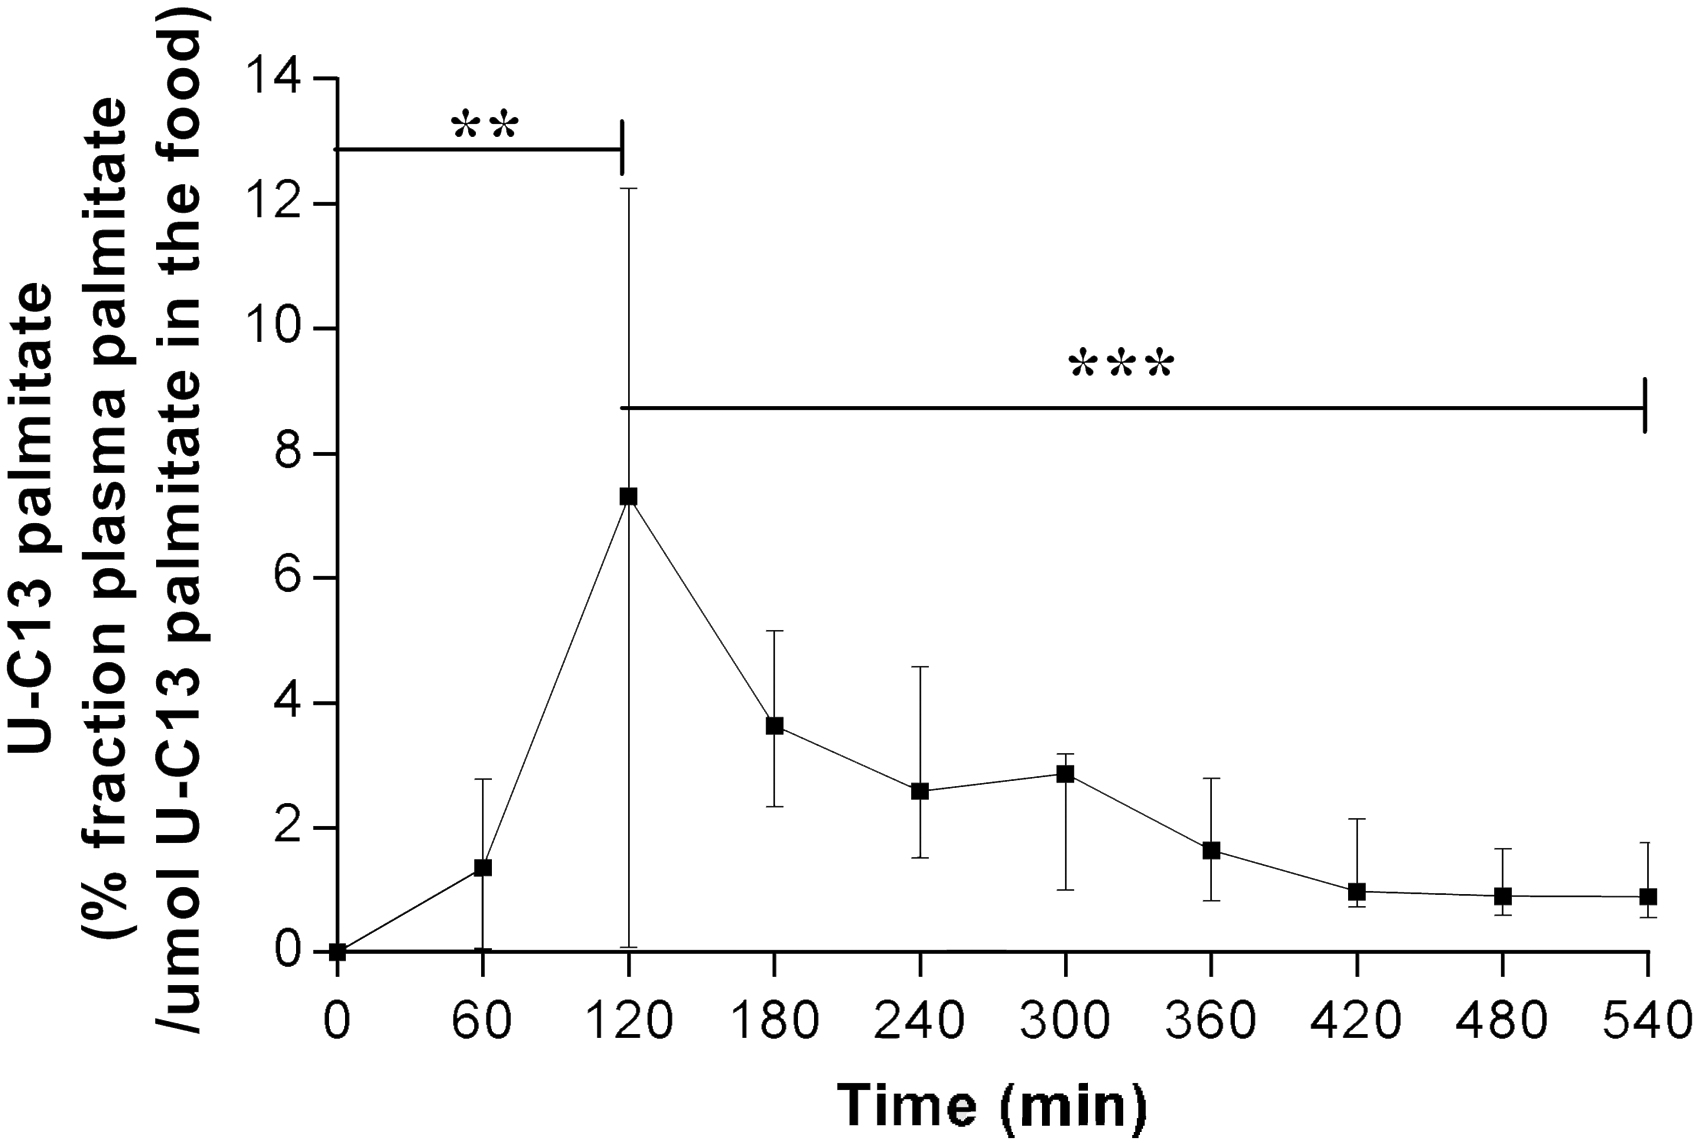
Similarly, NEFA measurements were not considered valid under experimental Protocol 1 either. Figure 5 shows mean NEFA levels following IH versus saline–heparin (Saline) infusion under Protocol 2. As shown, plasma NEFA concentrations were 1.9-fold higher in IH-infused dogs than in Saline-infused dogs, during both nighttime and the postprandial period (P = 0.02, Figure 5a; and P = 0.004, Figure 5b; respectively).
Mean non-esterified fatty acid (NEFA) levels in dogs undergoing Protocol 2. (a) Night period (−510 to 0 min) and (b) Postprandial period (0 to 540 min). Results were analyzed individually for each animal and then combined as a mean of each time point corrected for their respective baseline steady-state levels (at time −510 min). Results are reported according to the experimental group; i.e. saline (n = 5) versus Intralipid–heparin (IH) (n = 6). Results are expressed as median with interquartile ranges (25th–75th percentiles). Since plasma tracer enrichments were measured in only 11 dogs, non-parametrical tests were used to compare NEFA mean-to-baseline ratios between groups (unpaired Mann–Whitney tests, Figure 5). (a) *P = 0.02, (b)**P = 0.004.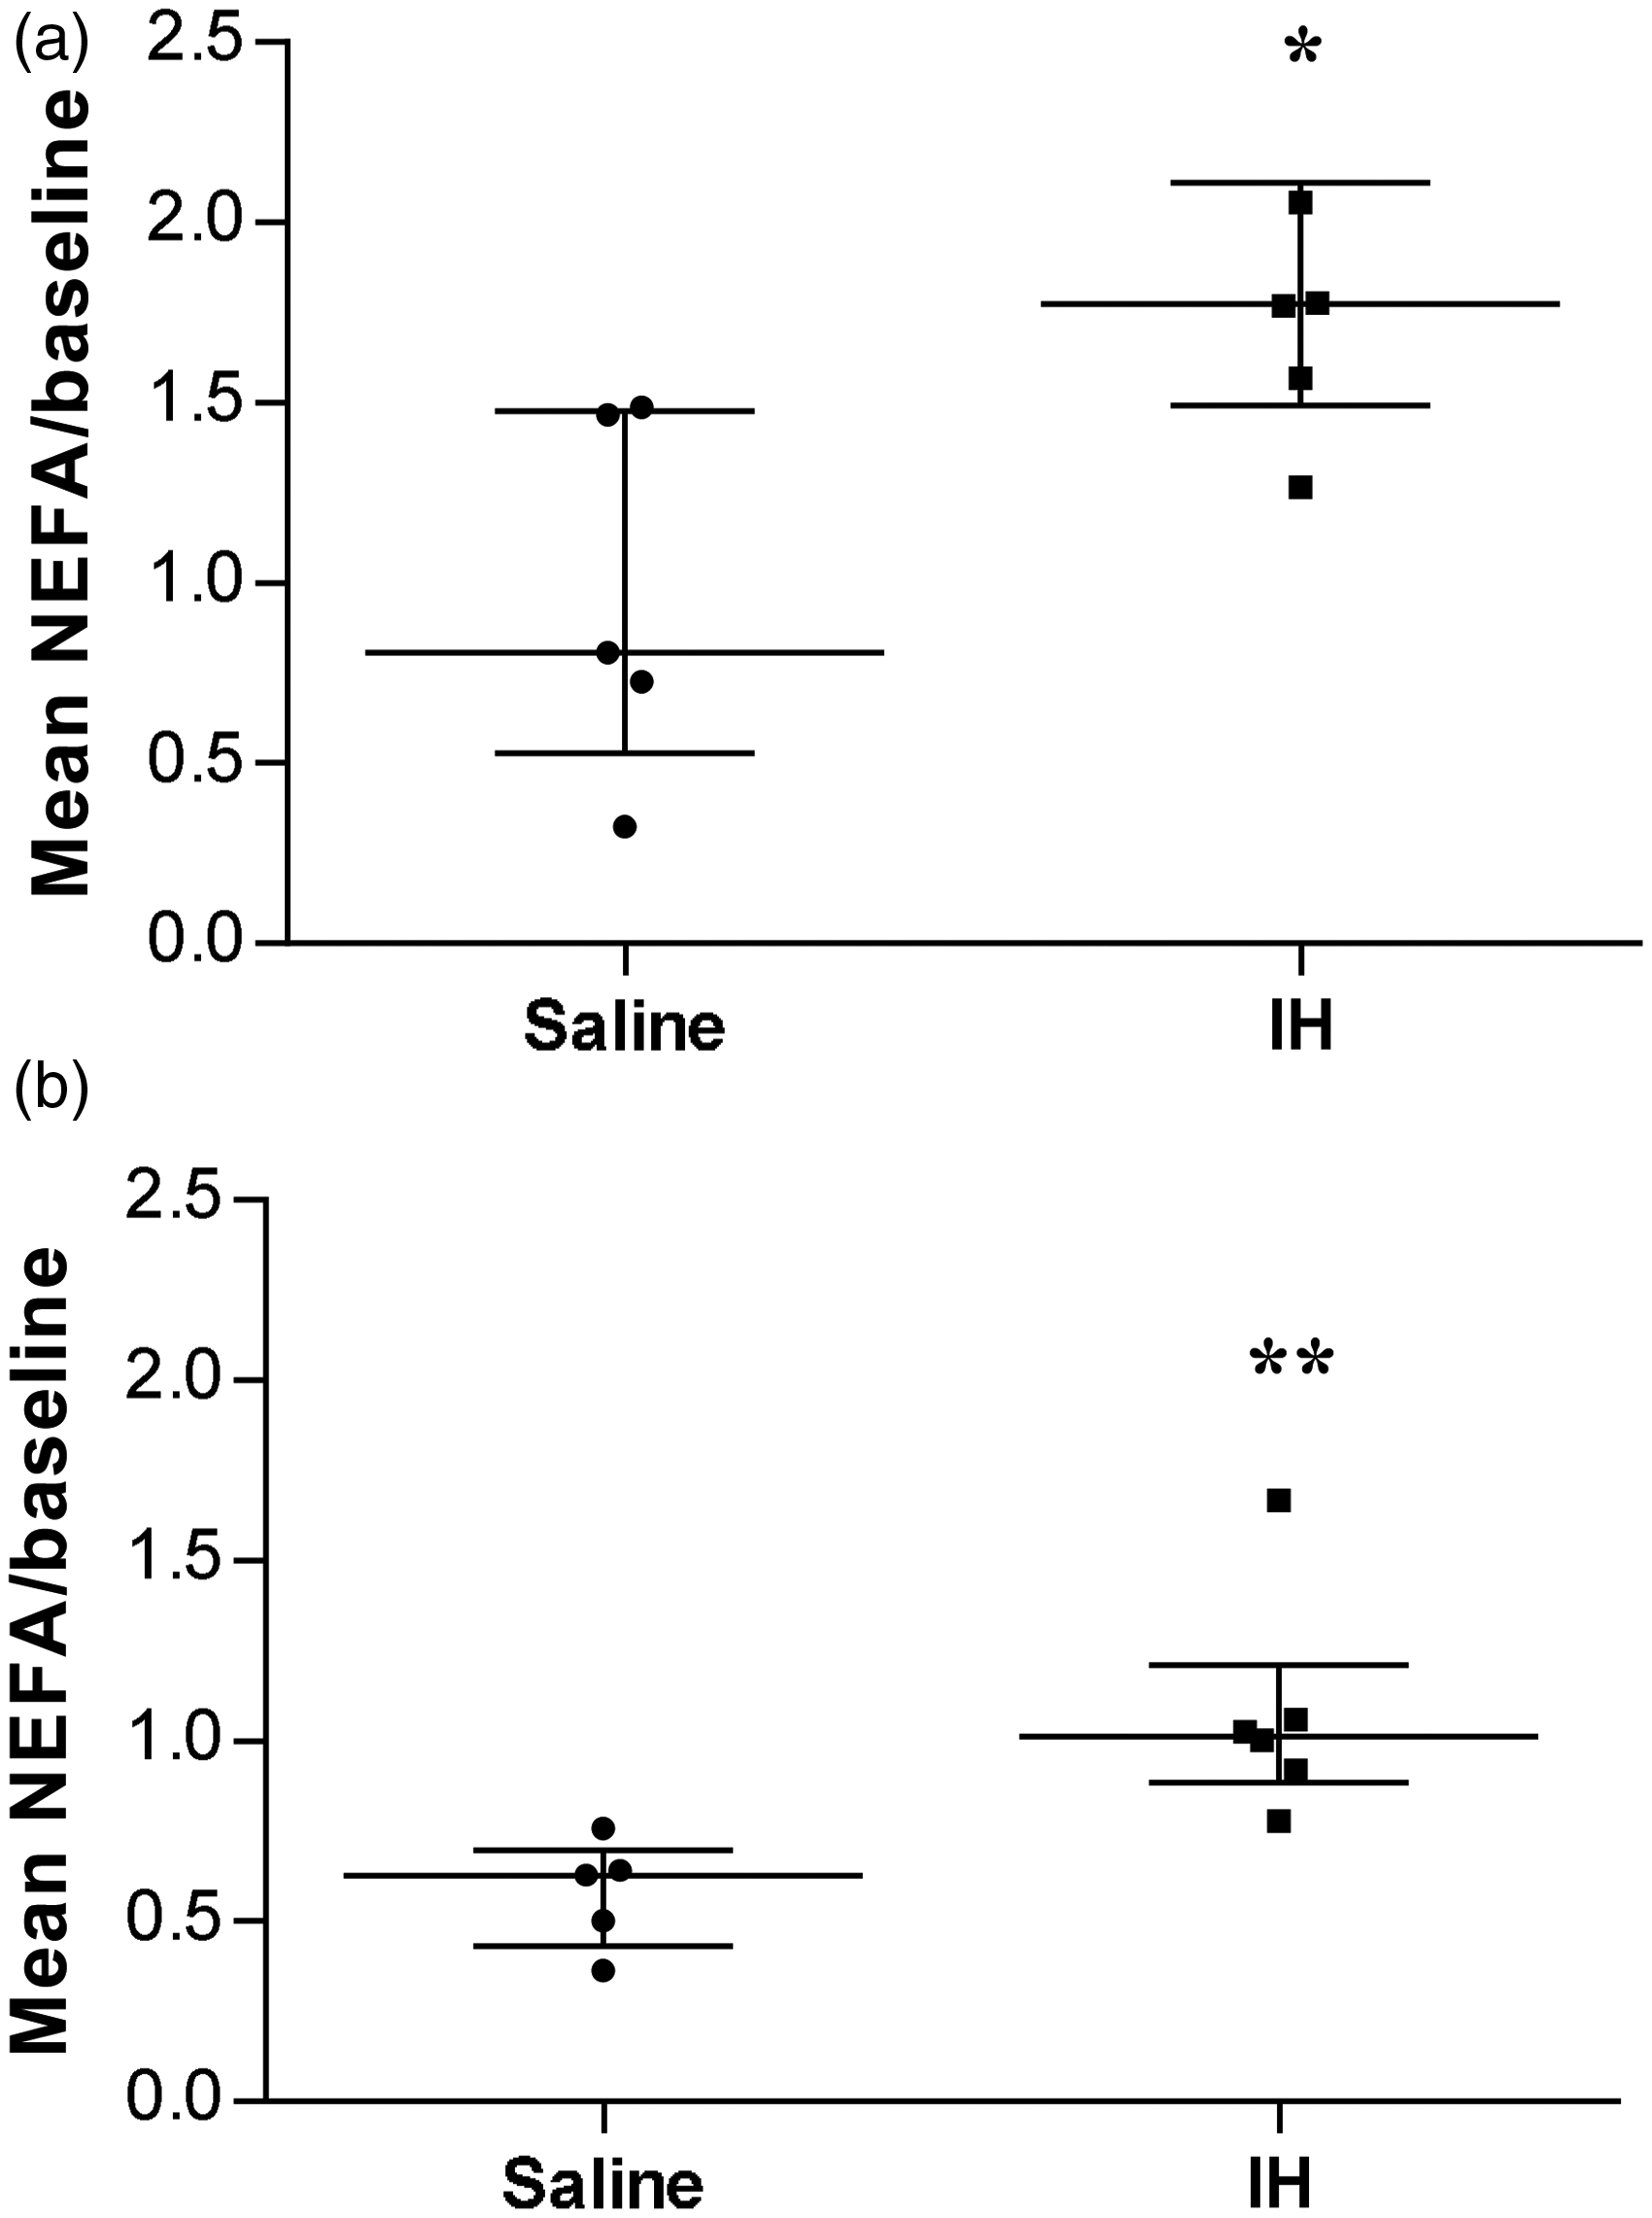
Discussion
In using a female dog model, we have shown that it is feasible to enrich circulating plasma with an orally-administered NEFA tracer and thus experimentally increase circulating NEFA levels. The former and the latter are both key experimental conditions to enable the adequate assessment of fasting and postprandial metabolism. This in turn allows for the determination of the impacts of lipotoxicity. Despite inherent challenges and difficulties associated with optimizing an animal metabolic protocol, we came up with a reliable and reproducible protocol for the purpose of pursuing our research objectives, consistent with all applicable animal research ethics and animal care guidelines.
The main differences observed between the original and optimized protocols mostly resided in the extent of the post-surgical recovery window, and the use of acepromazine and buprenorphine to calm the animal during and after surgery. In rodents, the recovery period lasts until biochemistry and blood counts have all returned to baseline values. Here, we observed that dogs had increased WBC counts as well as a rise in hepatic and renal enzymes one day post-surgery. These observations were most likely attributable, at least in part, to the stresses of surgery, general anesthesia and post-operative pain. Return to baseline parameters was observable within two or three days following surgery. This explains why metabolic studies were performed a few days after surgery in the original protocol, also minimizing the risks of post-surgery complications or self-inflicted wounds due to the presence of PRN on the animal’s backside. Despite apparent complete recovery under Protocol 1, dogs nonetheless displayed significantly higher levels of the stress hormones cortisol and ACTH on the experiment day. One possible explanation for this was that the animals were restrained in their cages with a Pavlov harness. To control for this, experiments were delayed a total of seven days following surgery in Protocol 2 and dogs were allowed to recover, unrestrained, in their individual transport cages. This may have contributed to normalizing stress hormone levels during the experiments under Protocol 2, as well as other clinical factors as outlined hereafter.
Regarding post-surgical analgesia, studies have shown that acepromazine reduces gastroesophageal sphincter pressure in dogs 22 and that it may also depress intestinal motility by reducing electrical activity of the intestine and increasing volume transit. 23 Indeed, these studies have reported that total gastric emptying time was significantly prolonged and that intestinal motility was decreased. 24 These findings may explain the delayed appearance of TG postprandially in Protocol 1, which was associated with gastric symptoms in dogs. However, no effect of acepromazine was found on either postprandial glucose or insulin patterns, as both baseline profile values and plasmatic values during experimentation were similar between the original and modified versions of the protocol (data not shown). These findings corroborate data from the Bergman group 25,26 showing that the use of acepromazine (0.1 mg/kg subcutaneously) as a sedative, 30 min prior to starting an intravenous glucose tolerance test, has no effect on glucose metabolism parameters but, by contrast, alters NEFA baseline levels. When planning lipid metabolic studies, the use of acepromazine as a chemical restraint should be avoided, since it may interfere with TG and NEFA assessments, as observed by us under Protocol 1 and as reported by others in the literature.
Because buprenorphine also affects gastrointestinal mechanisms, it could potentially alter outcomes of metabolic studies performed postprandially. Under Protocol 1, dogs received intramuscular buprenorphine (0.02 mg/kg) injections, every 8 to 12 h, on the days following surgery. A high rate of vomiting was observed in this group of dogs (100%). Even though a direct link between administration of buprenorphine and increased vomiting has not been established, several publications have reported similar side-effects in various mammalian species.27–29 These side-effects are more likely caused by buprenorphine than by acepromazine because while the latter reduces gastric emptying, it is not reported to cause vomiting. Data from the literature suggest that meloxicam may minimize post-surgical pain with minimal risks of gastrointestinal ileus, 24 thus providing an alternative to the use of buprenorphine. However, due to the absence of data on the potential side-effects of meloxicam on metabolism, buprenorphine was nevertheless used in Protocol 2, albeit in a single dose immediately following surgery. No side-effects were observed. As stated previously, nausea and vomiting are critical problems in any study aimed at assessing the dynamics of metabolic parameters postprandially, and thus deserves careful consideration when tracers are to be administrated orally, as was the case here.
The use of BSA, which is required to properly complex the tracer, has been shown to act as a potent allergen in dogs.25–27,30,31 However, Yoshii and colleagues suggest that, in conscious dogs, two consecutive exposures to BSA (5.5%) as a conjugate for the purpose of oleate infusions, causes no apparent allergic reaction. 17 In Protocol 1, we observed that a single exposure to a similar concentration of BSA (5%) provoked an allergic reaction resulting in vomiting. One solution would have been to complex the tracer with canine serum albumin, as used previously. 32 However, canine serum albumin was unavailable at the time we conducted our study. A tracer that could be conjugated to a much lower dose of serum albumin of foreign origin, i.e. the radioactive palmitic tracer conjugated to 0.002% BSA, was therefore used instead in Protocol 2. 33 Since vomiting is a critical problem when using orally-administered tracers, the use of a lower BSA concentration was found to be more suitable for this particular type of postprandial metabolic study.
As expected, following the above described modifications to the original protocol, none of the 19 dogs included in Protocol 2 experienced any vomiting, diarrhea or lethargy. This modified protocol therefore achieved better results than did the original with respect to the specific parameters of interest in this particular type of metabolic study. The pattern of postprandial plasma TG levels on the experimental day was similar to that observed on the profile day before the surgery. Moreover, postprandial plasma palmitate-tracer enrichment was detectable with a peak level mimicking TG peak level, confirming that adequate tracer conjugation and absorption had occurred. These observations suggest that Protocol 2 did not affect the dogs’ digestive tracts, as opposed to Protocol 1. Under Protocol 2, IH infusion increased plasma NEFA levels both during fasting at night and during the postprandial period, as expected. Successful overexposure of tissues to NEFA in these dogs thus mimicked the early steps of lipotoxicity. Results suggest that the use of Protocol 2 is feasible for studying the consequences of NEFA-induced lipotoxicity on fasting and postprandial metabolism. Future studies will assess whether increased NEFA levels in this dog model trigger any significant metabolic or other lipotoxic consequences. Since hormonal stress markers essentially remained unchanged on the experimental day, Protocol 2 adequately blunted discomfort and stress levels, and thus prevented some of their potential effects on experimental outcomes.
The developmental steps carried out in this study enabled the successful optimization of the original experimental protocol. Indeed, we obtained reliable and reproducible data related to the specific metabolic indicators of interest in a large animal model. Using this postprandial model of instrumented dogs, we observed that a seven-day post-surgery recovery period, along with the administration of a single dose of buprenorphine immediately following surgery, produced optimal results, while maintaining pre-surgical levels of stress markers. In addition, the decreases in buprenorphine and BSA dosages corrected the previously encountered vomiting issue. Thus, the optimized Protocol 2 allowed us to obtain valid postprandial TG level patterns and appropriate plasmatic enrichment of palmitate tracer. We thus recommend the use of these standardized conditions for postprandial metabolic studies in dogs, as they yield valid and reproducible data in this animal model.
Footnotes
Acknowledgments
The authors would like to thank Jean-Philippe Gagné for his work with surgery and surgical procedure optimization; Lucie Bouffard and Lucie Chouinard for biochemistry measurements and stress parameter determinations; and Catherine Baptiste for help with experiments. The authors would also like to thank Dr Monique Sullivan for her careful editing of the manuscript.
Declarations of conflicting interests
The authors declare no conflict of interest.
Funding
The study was funded by a grant from the Canadian Institutes of Health Research (MOP-97965).