
Abstract
One of the commonly used animal models in fertility, developmental and neurobiological studies is the laboratory rat. The early recognition of rat pregnancy and confirmation of the exact embryonic day are vital. The aim of this study was to investigate the correlation of maternal weight at the time of conception to its increase throughout gestation, aiming to develop a mathematical model, which can be used for the determination of the exact day of pregnancy, set the threshold, and monitor pregnancy from the onset. We studied a total of 173 Wistar rats with a mean body weight of 238.22 ± 34.9 g. After 72 h at the male’s cages, we considered as Day 0 (D0) the day in which a copulatory plug or sperm was found during the vaginal smear examination. After that period the female animals were transferred into their cages, and weight monitoring started 14 days (D14) after D0, until parturition. Based on the statistical analysis, there is a correlation between maternal body weight at D0 and maternal body weight from D14 to D19. Moreover, the average weight gain from D14 to D19 is positively correlated to initial female body weight, while there is no correlation between each pregnant animal’s weight from D14 to D19 and litter size. A mathematical model was developed as a tool for the verification of the day of pregnancy. In conclusion, continuous monitoring of maternal weight after D14 can be a reliable method for the recognition of pregnancy and determination of the exact gestational day.
The laboratory rat is an animal model widely used in fertility, developmental and neurobiological studies. 1 Its placenta is similar to that of humans, 2 and it is thus considered to be an appropriate experimental model for the study of changes taking place during pregnancy.
Pregnancy is a unique biological phenomenon that involves time- and gradient-dependent cues of various embryonic and maternal tissues 3 and, sometimes, of maternal systemic tolerance 4 towards the embryo. Pregnancy has an impact on all tissues and physiological maternal processes, such as maternal cardiovascular 5 and immune system changes, 6 along with maternal weight and other hemodynamic parameters. 5
The early recognition of pregnancy and the confirmation of the exact embryonic day are very important and need to be properly addressed. Taking into consideration that the demand for precisely timed fetuses is increasing, a fast and reliable method of pregnancy evaluation is essential for laboratories and animal facilities.
The commonly used mating detection methods in rat are plug checking and observation of the vaginal smear. In the first case, sexual activity and probable mating are verified in rats by the presence of a copulatory plug in females. This plug fills the female reproductive tract from the vulva to the cervix, and remains for a few hours following copulation, and gradually decreases in size and falls out. 7 Although direct observation of the plug is possible, if it falls out, its detection in the bedding or enrichment material may be troublesome.
The most reliable technique utilizes vaginal lavage and microscopic examination for the presence of sperm; it is however time- and labour-consuming, and is thus not the technique of choice in laboratory-breeding colonies.
As the rat is nocturnal, the main disadvantage of these mating detection methods is the time window the techniques need to be performed in. Whereas one of the basic advantages of the standard pregnancy confirmation methods is the absence of a strict time frame in which the procedure must take place.
Methods of pregnancy confirmation include enlarged lower abdomen and manual palpation,8,9 observation of hair loss around nipples and nipple enlargement,9,10 ultrasonographic examination,11–15 and finally observation of weight gain. The most recent study of weight gain, reported by Mader et al. refers to a study on genetically-engineered mice. 16
These pregnancy detection methods might create mild stress to the animal as a result of intensive handling, or the induction of anesthesia needed for an ultrasonographic examination. The aim of this study was to develop and implement a stress-free, minimal animal handling method for early pregnancy recognition. The proposed method is based on animal weight gain. A mathematical model was also developed as an alternative and refined research tool for the determination of the exact gestational day of Wistar rats housed in individually-ventilated cages (IVCs).
Materials and methods
The study was performed at the animal facility at the Center for Experimental Surgery of the Biomedical Research Foundation of the Academy of Athens (BRFAA). The facility is registered as a ‘breeding’ and ‘experimental’ facility according to Greek Presidential Decree, which harmonizes national legislation with the European Community Directive 2010/63/EU on the Protection of Animals Used for Experimental and Other Scientific Purposes. 17
Animals and housing
A total of 173 female Wistar rats (HsdOla:WI) were used in the study, with body weight being the only selection criterion. The animals had normal estrous cycles, confirmed by consecutive vaginal smear examinations. All the animals were obtained from the breeding colony of the animal facility of BRFAA.
They were housed in 32 Euro standard type III H individual ventilated cages (H-Temp™; Tecniplast, Varese, Italy) under positive pressure and 70 air changes per hour as set by the manufacturer and indicated on the monitoring panel of the air supply and exhaust system (Sealsafe™; Tecniplast, Varese, Italy).
Environment
All the animals were housed in animal rooms under specific pathogen free (SPF) conditions at a room temperature of 24 ± 2℃, relative humidity of 55 ± 10%, a 12 h:12 h light/dark cycle (07:00 to 19:00 h), a light intensity of 300 lux that was measured one meter above the floor in the middle of the room, and a positive air pressure of 0.6 Pa.
All the animals at the facility were screened regularly using a health monitoring program, in accordance with Federation of European Laboratory Animal Science Associations (FELASA) recommendations and were free of a wide range of pathogens including Kilham rat virus, rat parvovirus, Toolan’s H-1 virus, Sendai virus, pneumonia virus of mice, reovirus type III, murine encephalomyelitis virus, sialodacryoadenitis virus, rat minute virus, Hantaan virus, lymphocytic choriomeningitis virus, cilia associated respiratory (CAR) bacillus, mouse adenovirus strains 1 and 2 (MAD 1 and 2), rat rotavirus, rat coronavirus, Mycoplasma pulmonis, Clostridium piliforme, Bordetella bronchiseptica, Pasteurella spp., fur mites, and pinworms. 18
Food, water and bedding
All the rats had ad libitum access to filtered tap water in drinking bottles and a pelleted chow that contained 18.5% protein, 5.5% fat, 4.5% fibre, 6% ash (irradiated vacuum packed, Teklad 2918; Harlan, Milano, Italy).
The bedding in each cage comprised ∼140 g of autoclaved corncob bedding (Rehofix MK 2000; J Rettenmaier & Söhne, Rosenberg, Germany). The cages were cleaned and autoclaved once a week.
Experimental procedure
Two female rats were introduced into the cage of a male rat of proven fertility till the day in which a copulatory plug or sperm was found during the vaginal smear examination. That day was designated as embryonic day 0 (D0), the female was then separated from the male and returned to its cage.
The animals were weighed prior to the mating and continued from day 14 until the end of pregnancy. The digital balance used (DSW200D; DI Delmac Instruments, Athens, Greece) was calibrated prior to each measurement day by using known weights of 100, 5, and 1 g.
Cytological examination of vaginal smears and mating
Vaginal smears of the female rats were taken on consecutive days using the swab smear technique. In brief, a thin cotton swab soaked in methylene blue stain was inserted into the vagina of the female rat to a depth of 2–3 mm and, with mild rotational movements, cells from the vaginal lumen were collected and then transferred to a glass slide. This method is a valuable marker of the stage of preparation of the ovary and uterus for mating and ovulation and was used for the estimation of the exact day of mating. 19 On that day the female animals were weighed and put into the cage of the male.
Statistical methodology
Pearson correlation coefficient was used to examine the correlation of the variables studied.
K-means clustering was performed in order to classify the animals based on their weight distribution and hierarchical unsupervised clustering was used to monitor the changes during the gestation period. The validity of the groups that were formed from the k-means clustering was checked, using discriminant analysis.
Shapiro–Wilk normality test was used to check the normality of the variables tested and Mann–Whitney test to compare the medians of the groups A and B on each day. Equation with the highest R2, measures the trend’s accuracy of fit and was selected for calculation and forecast of the weight and day of the model used.
A flow diagram summarizes the above (see supplementary file which can be found online with this article at http://lan.sagepub.com).
Results
Statistical analysis was performed using the MultipleExperiment Viewer (MeV 8, TIGR, Rockville, MD, USA) 8.0 software.20,21 We examined the correlation of the litter size to the weight of the animal during gestation, where no significant correlation was found (Figure 1) between the weight for each embryonic day from D14 to D19 and the number of embryos (P > 0.1). The same approach was used in order to correlate the initial weight and the number of embryos (P > 0.1). Pearson’s correlation coefficient showed that initial weight was correlated with maternal weight during the gestational days from D14 till D19 (Figure 1).
Pearson correlation coefficient for initial weight and number of embryos correlated with maternal weight for D14 to D19 (n = 173).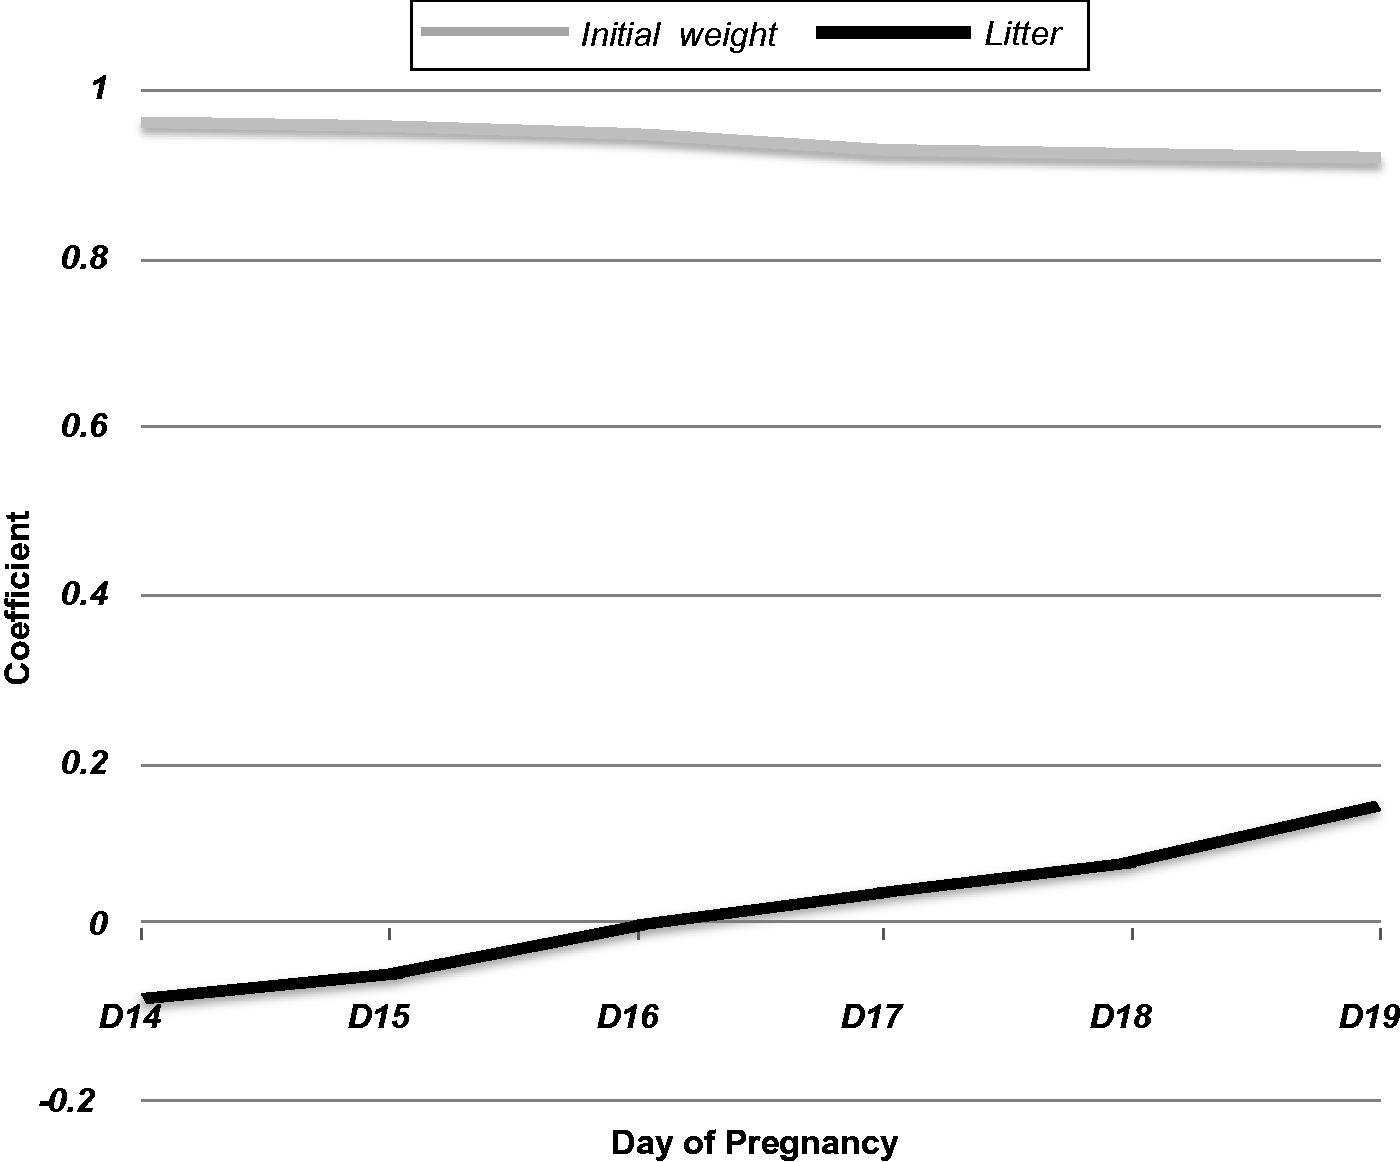
K-means clustering with Euclidean distance was performed in order to classify the animals in groups based on their weights. The analysis depicted two groups. Group A (low initial weight) with body weight from 173.2–239 g (n = 100), and group B (high initial weight) with body weight from 226.4–322 g (n = 73) (Figure 2). Discriminant analysis, based on groups A and B, confirmed 100% separation of the rats into these two groups with the use of k-means algorithm (k = 2).
Pearson correlation coefficient for initial weight and the maternal weight for animals belonging to group A (n = 100) and group B (n = 73) for the gestational days D14 to D19.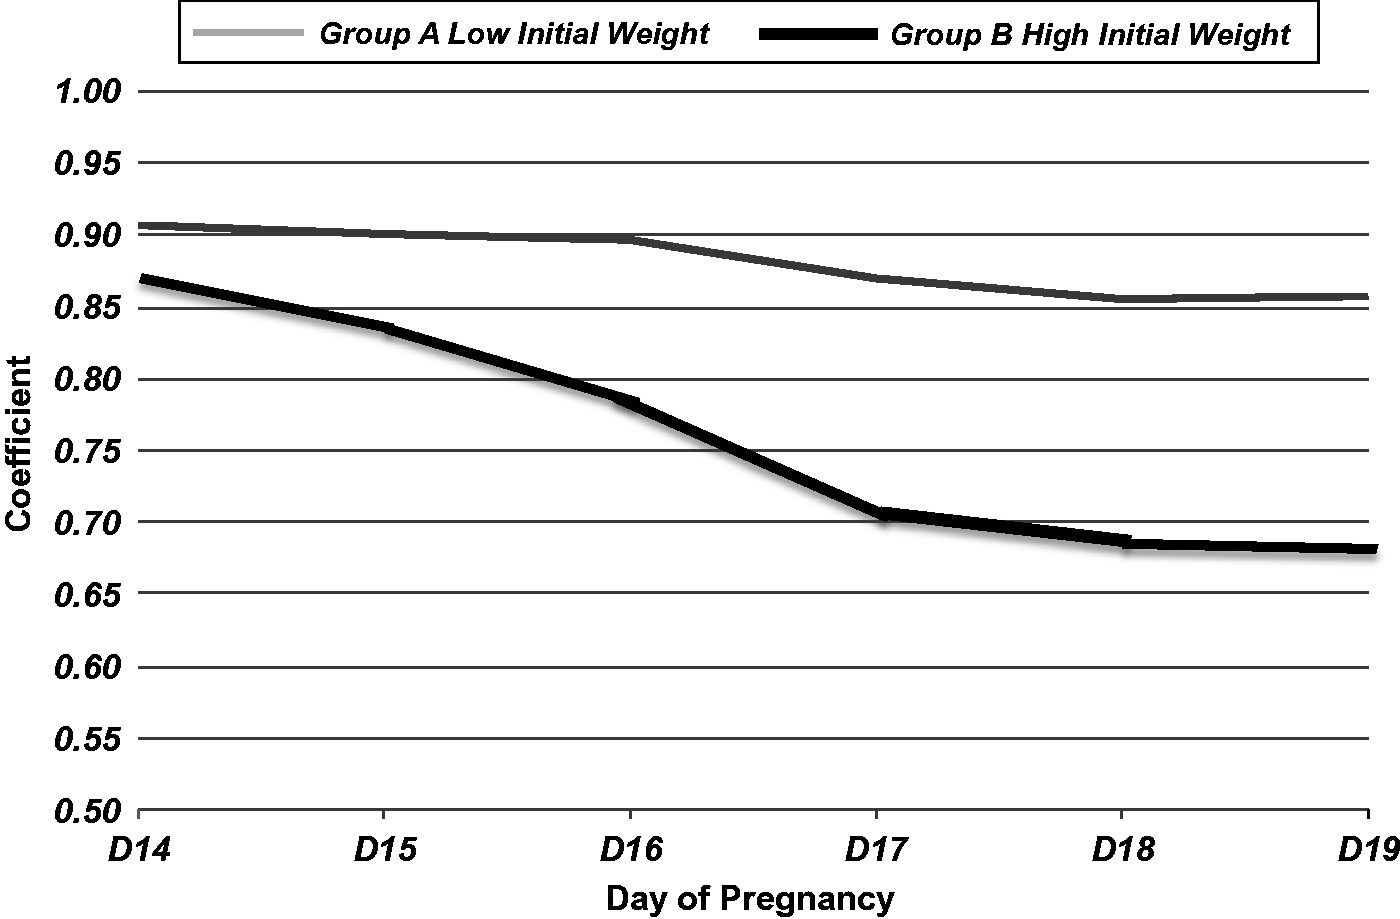
The variables used for the discrimination of the groups were the weight on days D0, D14, D15, D16, D17, D18, D19. The Shapiro–Wilk normality test was used in order to determine the normality of our data. Since not all the groups fulfilled the normality criteria (P < 0.05) Mann–Whitney test was performed.
Correlation analysis was performed in groups A and B. High correlation was identified between the initial maternal weight and the one measured throughout gestation from D14 to D19 (Figure 2).
The average values of each day of pregnancy were examined in order to develop an equation from these correlated values. Both groups were studied also using the R2 criterion of the trend line equations (Figure 3). Several equations were tested and those with the higher R2 were selected for both groups for offering the best prediction value.
21
As shown in Figure 3, the quadratic equation was the one with the best outcome (R2 = 0.9995 for group A and 0.9998 for group B).
Average body weight and the equations derived, for animals belonging to group A (n = 100) and group B (n = 73) for the gestational days D14 to D19. Bars represent the standard deviation of values (STDV).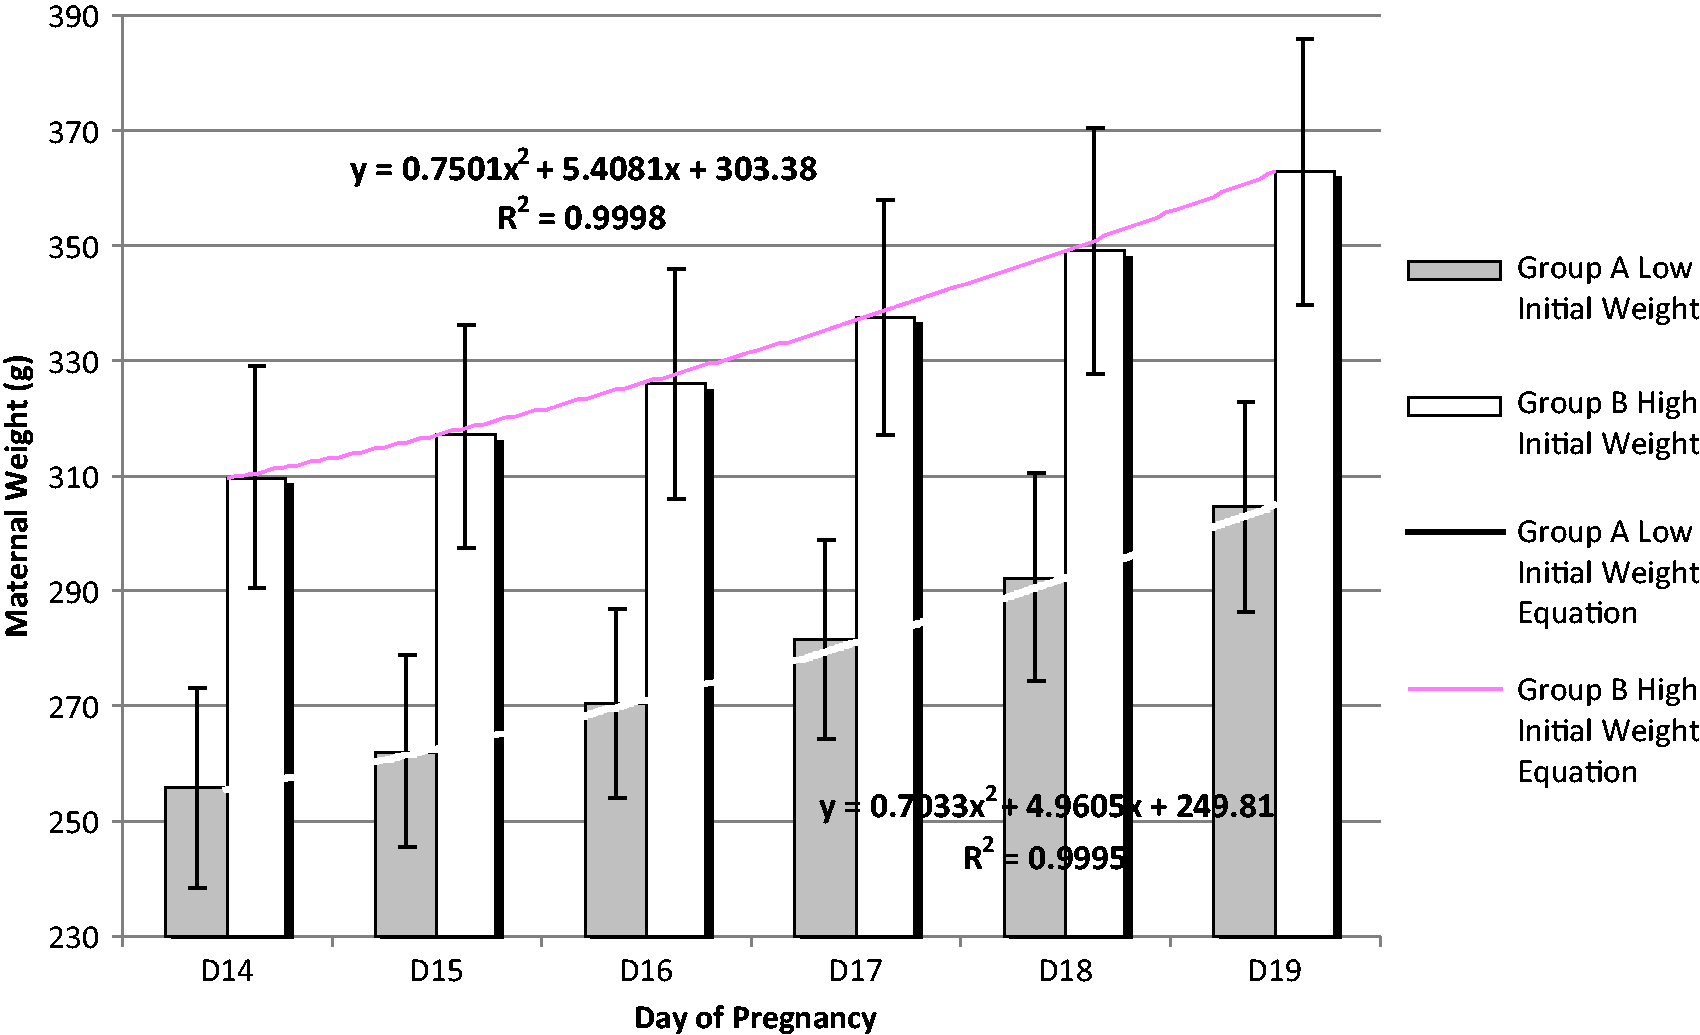
Hierarchical cluster analysis using the Pearson correlation coefficient for calculation of distance metric and average linkage method, was performed in every group.
In order to decide if we could use a parametric test to compare the groups, we employed the Shapiro–Wilk normality tests. Since not all the groups fulfilled the normality criteria (P < 0.05) Mann–Whitney test was performed. These tests resulted in a statistical significant difference between the two groups (P < 0.05) for each day of pregnancy from days D14 to D19.
The same tests were performed for the average percent increase of body weight, for gestational days D14 to D19. Statistical significant differences between the two groups were the result of these tests (P > 0.10) with group A being significantly higher than group B.
The study hypothesis proceeded to investigate the relation of initial maternal weight and its increase throughout gestation. The percentage increase of maternal weight is a simple mathematical transformation that encloses the initial maternal weight and was thus chosen for further examination.
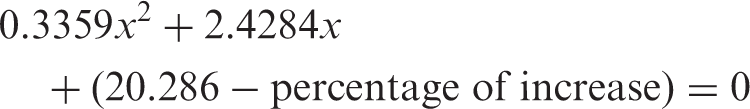
The following equations were created based on the average values of each day of pregnancy in order to examine the trend in each group. Both groups were also studied using the R2 criterion of the trend line equations (Figure 4). Several equations were tested and those with the higher R2 were selected for both groups for offering the best prediction value.
22
As shown in Figure 4, the quadratic equation was the one with the best outcome (R2 = 0.9988 for group A and 0.9997 for group B).
Average percent increase of body weight and the equations accordingly derived, for gestational days D14 to D19 for animals belonging to group A (n = 100) and group B (n = 73). Bars correspond to standard deviation of values (STDV).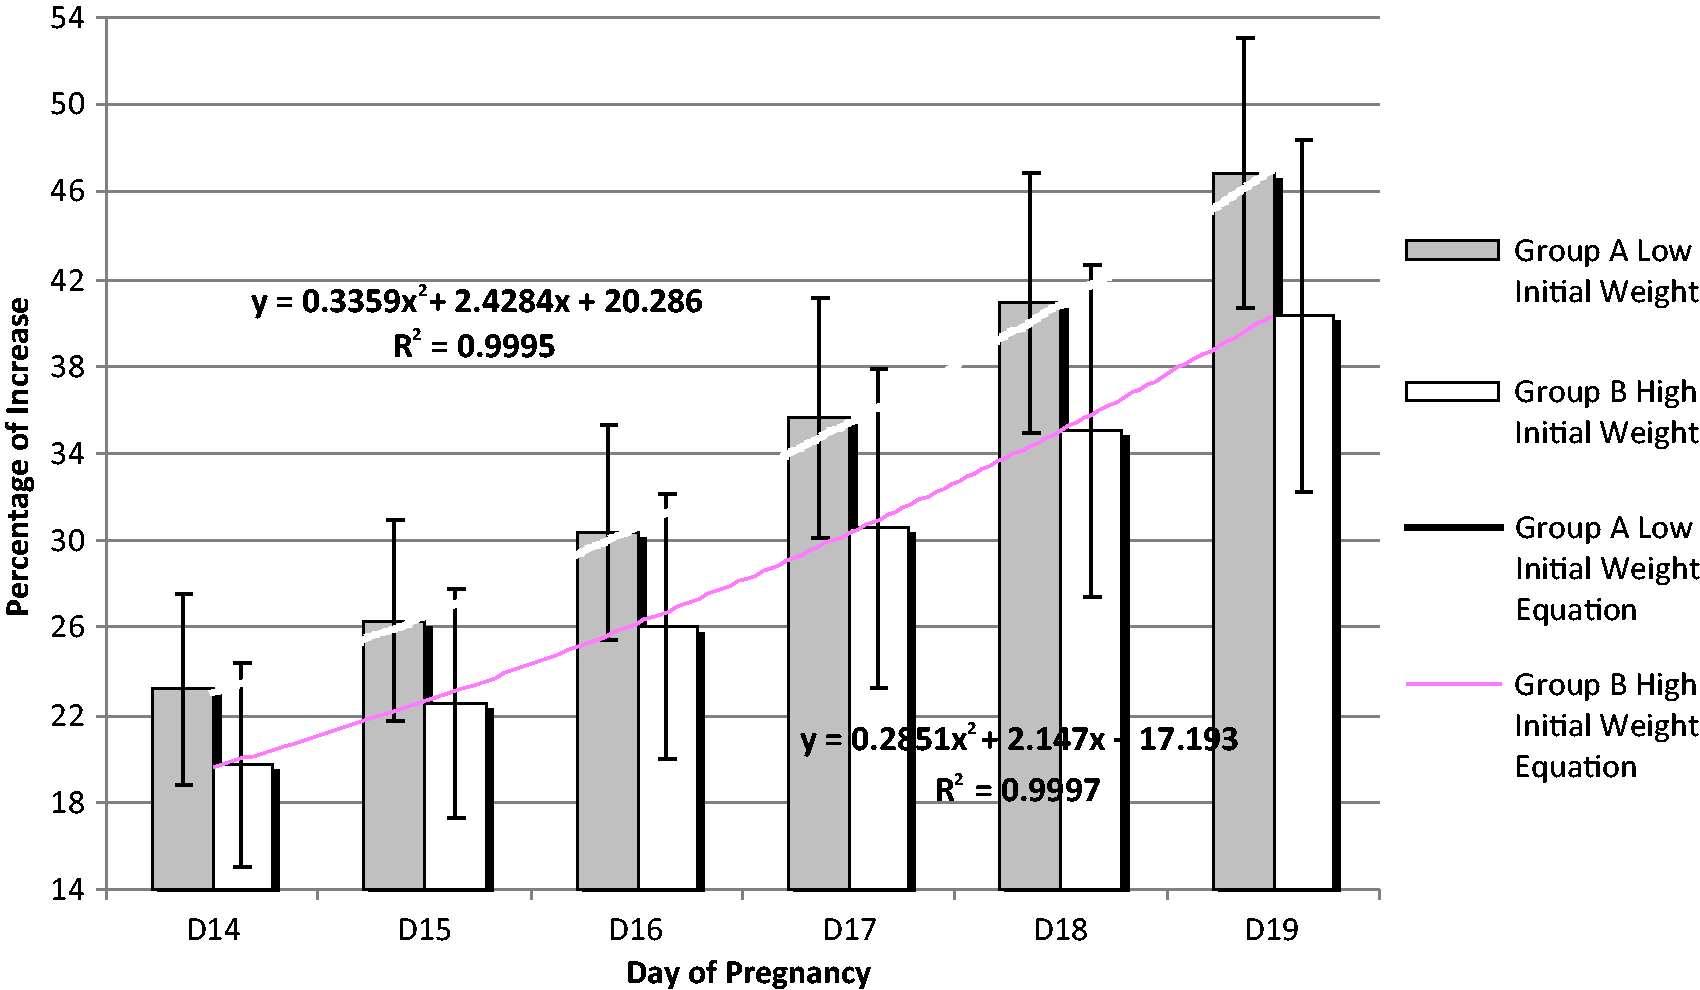
The exact embryonic day can be calculated by solving the following equations, taking into consideration all mathematical rules for the solution of the quadratic equations.
Group A: low initial weight
Group B: high initial weight
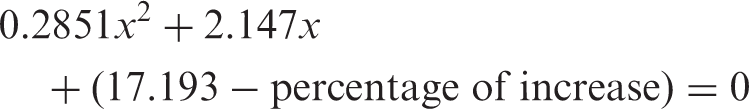
The accepted solution of these equations is governed by known mathematical limitations. Only the positive real root of the equation is accepted.
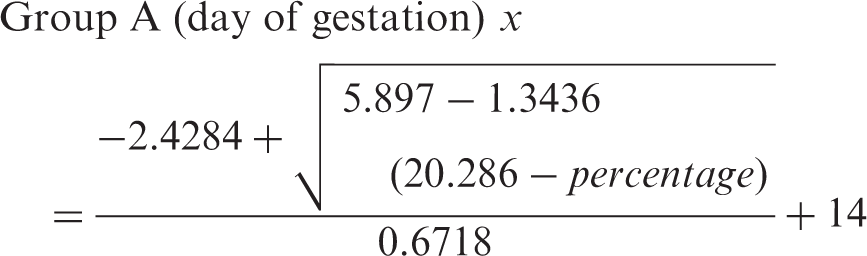
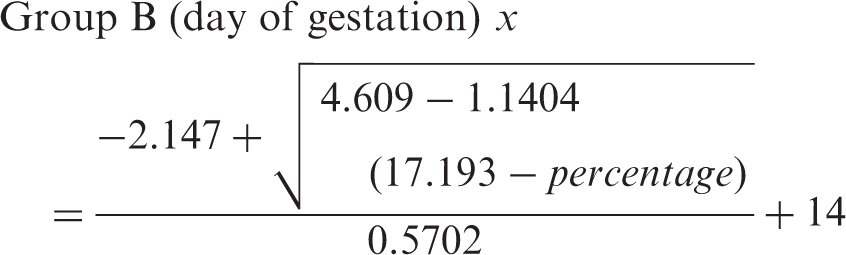
Using this equation we could safely predict the day of gestation for animals that belonged to these two groups.
Discussion
During the past decades embryonic development has been under extensive study,23,24 together with the maternal processes that affect it. Early studies focusing on the immediate uterine environment showed that the local effect of fetuses in the same horn most probably result from mechanical pressure due to the distension of the uterus.25,26
Another study in guinea pigs revealed that mean fetal weight and length decrease, as the number of fetuses in the same horn increases, and as the number of fetuses in the other horn increases. 27 The same researchers concluded that litter size in the same animal model is positively correlated to initial maternal weight at conception; litter size is also independent of maternal age and there is no significant correlation between size and age after correction for weight.
According to the studies of Eckstein and McKeown,27–29 fetal body weight progressively increased with gestational age. When litter size increases, the weight and length of each embryo decreases. Nevertheless, total litter weight increases due to the litter size increase. These studies, however, did not discriminate between the effects of initial maternal body weight due to other possible factors that affect the progress of pregnancy. Supporting literature from Barr et al. 30 reported that the increment of body weight in pregnancy is not correlated to litter size.
The key assumption of the work presented here is that maternal weight throughout the gestational days D14 till D19 is strongly correlated to initial maternal weight. The choice of D14 as the first day of observation derives from the increasing demand for fetuses for various experiments; moreover, the enlargement of nipples in pregnant rats at this day provides morphometric evidence. This piece of information is not always helpful when dealing with previously lactating, pregnant rats. The last reason for choosing days D14 to D19 was the necessity to increase the model’s accuracy, and a good way to achieve this was to narrow down the days of examination.20,21
The advantages of the use of the method proposed are very significant, as first of all the cost is minimal and its applicability is wide. The only necessary instrument is a weighing scale, and the process causes no stress to the animals. Even more importantly, the statistical analysis of the data can be outsourced to another department, if need be, and this extensive collection of data can be used for systematic reviews. This last point is consistent with the 3Rs (replacement, reduction, refinement) which have been gaining ground over recent years.
Another important reason for reconsidering rat pregnancy instead of other rodents, such as mice, is that new strains are now available, and after decades of inbreeding, the existing ones could be different. A literature review reveals large numbers of papers published during the 50 s and 60 s, and even earlier, covering pregnancy.4,25–27,31,32. In the years that followed, all these sets of data were used as a basis for experimental results. However, a bibliographic review reveals a more recent change in how researchers are approaching and evaluating results related to pregnancy in toxicological or other studies.
Our study towards the development of an alternative, refined research tool for the determination of the gestational day of rats concluded with the previously described equations. The use of these equations, resulting from the follow-up of weight gain in 173 Wistar rats, has been the main method used at the Laboratory of Animal Facilities of BRFAA over the last two years. During this period we have had a 100% success rate in pregnancy prediction. Moreover, we have had a 98% success rate in the determination of the exact day of pregnancy, with the other 2% being related to low litter pregnancies (n < 4).
The next step of this study will be the creation of a computer algorithm for the prediction of the exact gestational day. Such software is already widely used in financial analysis and macroeconomic predictions.
Nevertheless the implementation of the method must take into consideration factors such as the composition of food, the strain of the rat or even the housing system itself. Further work is required to find out how these factors affect the development of maternal weight of Wistar rats housed in IVCs.
Footnotes
Acknowledgements
We would like to thank our colleague and friend V Rizou for her assistance during the course of the study.
Funding
This research received no specific grant from any funding agency in the public, commercial, or not-for-profit sectors.
References
Supplementary Material
Please find the following supplemental material available below.
For Open Access articles published under a Creative Commons License, all supplemental material carries the same license as the article it is associated with.
For non-Open Access articles published, all supplemental material carries a non-exclusive license, and permission requests for re-use of supplemental material or any part of supplemental material shall be sent directly to the copyright owner as specified in the copyright notice associated with the article.