
Abstract
Protest is a low-intensity form of political conflict that can precipitate intrastate armed conflict. Data on protests should therefore be informative in systems that provide early warnings of armed conflict. However, since most protests do not escalate to armed conflict, we first need theory to inform our prediction models. We identify three theoretical explanations relating to protest-repression dynamics, political institutions and economic development as the basis for our models. Based on theory, we operationalize nine models and leverage the political Violence Early Warning System (ViEWS) to generate subnational forecasts for intrastate armed conflict in Africa. Results show that protest data substantially improves conflict incidence and onset predictions compared to baseline models that account for conflict history. Moreover, the results underline the centrality of theory for conflict forecasting: our theoretically informed protest models outperform naive models that treat all protests equally.
Keywords
Introduction
Protest is a low-intensity form of political conflict that can precipitate intrastate armed conflict. Data on protests should therefore be informative in systems that provide early warnings of armed conflict. Conflict early-warning systems have become much more advanced over the past years, responding to a rapidly increasing interest from decisionmakers. Performant forecasting systems are important: they can facilitate early action to prevent violence, mitigate the consequences of armed conflict and increase public awareness.
High-quality protest data with live updating schedules are readily available (ACLED; Raleigh et al., 2010), but no studies have persuasively shown they can be useful to predict armed conflict. The main reason for this, we argue, is that most protests do not lead to armed conflict, so naively adding protest data to machine-learning models does not necessarily yield good results (see Hegre et al., 2019: for prediction of conflict incidence with protest data). To succeed in our forecasting task, we need theory to identify which protests have the potential to lead to armed conflict violence. 1 We show that simply entering protest data in a forecasting model without careful modeling of dynamics and context does not yield good predictive performance. We, therefore, build on pre-existing theory on how protests are related to armed conflict and identify three broad theoretical explanations as the basis for our forecasting models. The first underlines how protest-repression dynamics can pave the way for armed conflict. The second and third explanations focus on the political institutions and socio-economic conditions that make armed conflict more likely in the wake of protest.
We operationalize the theoretical explanations and leverage the tools in ViEWS (the political Violence Early-Warning System, Hegre et al., 2019) to evaluate whether protest models improve armed conflict onset and incidence predictions. Our empirical analysis consists of nine model specifications that capture various aspects of the theoretical arguments. We use random forest algorithms to generate predictions of state-based armed conflict at the subnational level for African countries. Models are trained on data from 1997–2016 and predict for 2017–2019.
The evidence shows that forecasting models with information on protest activity do not unequivocally improve armed conflict predictions compared to baseline models accounting for conflict history. In fact, naive protest models, which treat all protests equally, do worse than the baseline, especially for conflict onset. However, theoretically informed models that unpack protest-repression dynamics are better than both the baseline models and naive protest models. There is also ample evidence that the institutional and economic context matters for the relationship between protest and armed conflict. In contrast to previous prediction efforts with protest data, our approach improves both armed conflict onset and incidence forecasts at the subnational level. The results illustrate the importance of building armed conflict forecasting models on solid theoretical foundations.
Overall, the article contributes to peace and conflict research by marrying innovations in theory, data collection and methods for forecasting purposes. We also make several additional contributions. First, efforts to predict and forecast political violence have entered the peace research mainstream (Hegre et al., 2013; Beger, Dorff & Ward, 2016; Hegre et al., 2017; Witmer et al., 2017). Most forecasting models, however, rely on slow-moving ‘structural’ factors, such as income or political institutions, to generate forecasts. Consequently, the models can distinguish countries at risk of violence from those that are not, but they do not help identify where and when violence will break out. Identifying the location and timing of violence in high-risk countries is crucial for conflict mitigation and prevention. Our approach shows that predictive performance of both conflict onset and incidence at the local level can be improved by combining structural factors with event data (Chadefaux, 2014; Chiba & Gleditsch, 2017; Mueller & Rauh, 2018).
Second, although our primary objective is to maximize predictive performance, our approach provides insights into the usefulness of the theoretical arguments we adapt for forecasting purposes. Evaluating a model’s ability to improve prediction for unseen data can complement the ‘p-value’ framework of hypothesis testing (Ward, Greenhill & Bakke, 2010; Schrodt, 2014). Without claiming that we test theoretical arguments in any rigorous meaning of the word, our results show that theoretical explanations help improve the performance of a conflict early-warning system.
Literature review
Forecasting of armed conflict was high on the agenda in peace research in the 1960s and 1970s (e.g. Choucri, 1974). This agenda has seen a renaissance over the past ten years, along with a general surge of forecasting and machine-learning techniques in most scientific fields (see Hegre et al., 2017: for a review). The most well-known armed conflict forecasting models (Goldstone et al., 2010; Ward, Greenhill & Bakke, 2010; Hegre et al., 2013; Bowlsby et al., 2020) are set at the country-year level. They are mainly based on static variables such as income and population. A few models provide forecasts at finer geographic resolutions (Witmer et al., 2017; Hegre et al., 2019, 2021) and some at a more precise temporal scale (Ward et al., 2013; Ward & Beger, 2017; Blair & Sambanis, 2020). Although armed conflict is the prediction target that has received the most attention, relevant studies also seek to forecast coups or irregular leader changes (Bell, 2016a; Ward & Beger, 2017), unrest (Chenoweth & Ulfelder, 2017), or regime change (Morgan, Beger & Glynn, 2019).
Many studies forecast the onset of armed conflict, typically defined as the first year/month of violence in a country above a given threshold after a given number of years/months below the threshold. Other projects forecast the incidence of armed conflict, whether violence is above the threshold irrespective of violence levels in the periods just before. Modeling the onset of new conflict reveals new information but is also a more challenging task. Incidence models, moreover, allow forecasting termination of ongoing conflicts.
Models forecasting protests have been forwarded (Gurr & Lichbach, 1986; Cadena et al., 2015; Chenoweth & Ulfelder, 2017), but not many models use protests to forecast armed conflict. Some make use of event data to forecast conflict (Ward et al., 2013; Chiba & Gleditsch, 2017; Blair & Sambanis, 2020), supplementing the most used static variables. The event data going into these models include information on protests. However, the analyses do not permit distinguishing the importance of protests from other events, including historical events that we define as the dependent variable in our study. Wu & Gerber (e.g. 2018) and Ward et al. (e.g. 2013) use protest data but only in a within-country setting.
Predicting changes in conflict levels was the topic of a recent prediction competition (Hegre, Vesco & Colaresi, 2022). Several contributions suggested new predictors useful for predicting rapid changes (e.g. Hultman, Leis & Nilsson, 2022; Mueller & Rauh, 2022; Oswald & Ohrenhofer, 2022), but none of them tapped into protest data, despite the arguments reviewed below indicating strong links between protest and conflict escalation. As far as we know, only the ViEWS model (Hegre et al., 2019, 2021) makes use of the extensive protest data available in ACLED (Raleigh et al., 2010). That protest model, however, is overly simple, and we show below that it can be considerably improved. The work presented here adds significantly to these efforts by building theoretically founded prediction models.
From protest to armed conflict: Theoretical explanations
Protest can lead to armed conflict through a gradual process in which the tactics and mind-set of radical protesters turn violent or by affecting the opportunity and motivation for large-scale political violence by other armed groups (Tilly, 1978; Della Porta & Diani, 2020; Rød & Weidmann, 2022). Nevertheless, only a minority of protests precede armed conflict. Consequently, theoretical explanations identifying which protests are likely to lead to armed conflict violence are crucial for our prediction task. The theoretical explanations we discuss below help us distinguish protests that increase the risk of armed conflict from protests that do not. Before discussing them, we first define armed conflict and protest.
Our prediction target is state-based armed conflict, defined as the organized use of violence between at least two actors, one of which is the government. Our key predictor, protests, are public gatherings of a group of people opposing the government. Protests can be peaceful or involve a degree of violence, for example, property damage or clashes with government security forces. The main difference between protest and state-based armed conflict is that the latter involves systematic and organized use of armed force by the political opposition. In contrast, violence during protests is spontaneous and military organizations only play a peripheral, if any, role on the opposition side (see also Bartusevičius & Gleditsch, 2019).
Protest-repression dynamics
Protest-repression dynamics influence whether armed conflict emerges in the aftermath of protests. State repression scholars have investigated how dissent affects repression and how repression affects dissent (for a recent overview, see Demeritt, 2016). One key finding is that states respond to dissent with repression. Repressive measures take the form of civil liberties infringements (e.g. censorship, restrictions on freedom of speech or organization) or physical integrity violations (e.g. torture, imprisonment without a fair trial). However, the form and intensity of repression depend on the dissent: violent rioters and peaceful protesters elicit different government responses.
While research has uncovered a fairly robust relationship between dissent and repression (but see Ritter & Conrad, 2016), the impact of repression on dissent is more uncertain. There is empirical support for ‘almost every possible relationship between protest and repression’ (Carey, 2006: 1). Some scholars show that repression discourages dissent (White, 1993; Pierskalla, 2010), while others report that repression encourages it (Sutton, Butcher & Svensson, 2014; Hultquist, 2017). Others show that moderate-intensity repression fuels dissent while high-intensity repression deters dissent (Hibbs, 1973; Mueller, 1990). Moreover, others find that repression leads to the substitution of dissenters’ strategies (Moore, 1998) or has heterogeneous effects over time (Rasler, 1996; Finkel, 2015).
Despite the diverging findings, there are strong reasons to expect that violent, indiscriminate state repression of protests can lead to armed conflict. The theoretical mechanisms leading from protest to armed conflict violence focus on both rational and emotive processes. From a rationalist perspective, repression increases the costs of the protests (Lichbach, 1987). Even when benefits beyond those of participating in protests are high, a violent crackdown increases the uncertainty of success. Therefore, repression may convince protesters that the costs of protests are too high and that violent rebellion is the only way forward. Escalation from peaceful protests to armed conflict is likely to be gradual. Protesters expand their tactical repertoire (e.g. strikes, street demonstrations, property damage, attacks on security forces) by observing failures and successes in interaction with government actors. Similarly, the government adapts its approach depending on protesters’ tactics and the social actors engaged in protests. Della Porta & Diani (2020) show how such an adaptation process can lead to a spiral of violence and counter-violence that culminates in armed conflict.
Emotions also play an essential role. While fear of repression can demobilize citizens (Young et al., 2019), protesters are often aware of potential costs. For example, a Libyan during the Arab Spring remarked that ‘we knew that our attempts to try would be hard and bloody’ (Pearlman, 2013: 389). Emotions such as anger, revenge, contempt and distrust towards the government can lead people to join or support armed rebellion (McCullough, Kurzban & Tabak, 2013; Bartusevičius, van Leeuwen & Petersen, 2020). These emotions can be triggered by violent repression of peaceful protesters, which tends to be perceived as unfair and consequently undermines the moral legitimacy of the government (Wood, 2003; Kalyvas, 2006). They are powerful motivators of action and affect how people prioritize their interests and process information. For example, anger and revenge propel people to take larger risks and attack their opponents, increasing the risk of further violence.
Rational and affective frameworks also explain why the risk of armed conflict involving existing non-state armed groups increases during protest mobilization. When protests are large and sustained over time, they tie up resources and reduce the legitimacy of the government, which opens up opportunities for violence by existing armed challengers. When protests are violently repressed, armed groups can argue that peaceful tactics are doomed to fail. Protests can also increase the motivation for violence by armed non-state actors. Government challengers, such as protest movements and rebel groups, are in competition with each other over local resources and power. When protesters openly confront the government, they simultaneously sharpen the competition with other non-state groups, increasing incentives for these to also challenge the government.
In sum, rational and affective theoretical mechanisms link protest-repression dynamics to political violence. Our ability to predict armed conflict should improve by distinguishing between peaceful and violent protests and unpacking repressive government responses.
Political institutions
Political institutions have important implications for protest and armed conflict. Domestic peace is more likely in democracies than in autocracies and anocracies (Hegre, 2014). Democracy facilitates peaceful resolution of conflicts by allowing the expression of discontent and regular free and fair elections, empowering citizens to affect their future without violence. These institutional guarantees reduce motivations for violent conflict by reducing commitment problems (Boix, 2003; Fearon, 2004; Acemoglu, 2006). Institutional avenues also make escalation from protest to armed conflict unlikely. In democracies, political leaders and citizens see protests as a regular political activity with a low risk of violence. Further, democratically elected bodies are more likely than autocratic leaders to respond to protesters, partly because protesters in democracies often are backed by civil society organizations that influence politics through institutional channels.
Autocratic leaders aim to pre-emptively quell emerging popular threats through structural repression, especially restrictions on civil rights and liberties. However, structural repression often fails, and autocracies are highly prone to armed conflict (Gleditsch & Ruggeri, 2010; Bartusevičius & Skaaning, 2018). When protest occurs in autocracies, it is likely a strong signal of potential violence. The fact that protest occurs despite the high risk of government repression indicates radical discontent with the autocratic regime. Moreover, the chances of an escalating spiral of violence are high when a lack of formal constraints on violent repression is combined with committed protesters, especially when organizational support for protesters is absent (Sutton, Butcher & Svensson, 2014; Ives & Lewis, 2020).
Some non-democratic regimes are more prone to violent protest trajectories than others. Anocracies, a regime type that allows the political opposition to organize and compete for office but lacks effective institutional mechanisms to incorporate the opposition, are vulnerable to both protest and armed conflict (Muller & Weede, 1990; Hegre et al., 2001; Cederman, Hug & Krebs, 2010; Fjelde, 2010; Robertson, 2010). Elections often trigger protest and violence in these regimes (Birch, Daxecker & Höglund, 2020). Regimes often engage in fraud and repression, such as ballot-box stuffing, exclusion of opposition candidates and voter intimidation to avoid losing elections (Hafner-Burton, Hyde & Jablonski, 2014; Rød, 2019). Fraudulent elections serve as focal points for protest by exposing large parts of the population to the same injustice at the same time, creating an ‘imagined community of millions of robbed voters’ (Kuntz & Thompson, 2009: 258). These dynamics often take place in countries where violent groups already exist. Protest during elections, especially in non-democracies, can therefore be a powerful signal of future armed violence.
In sum, compared with democracies, protest in autocracies is a stronger early-warning signal for armed conflict. Protests around elections should also improve predictive performance by signaling an increased risk of armed conflict, especially in non-democratic settings.
Economic development
We expect economic development to reduce the risk of escalation from protests to armed conflict. Economic development refers to how services, manufacturing, and human and financial capital are more critical economic input factors than agricultural land and natural resources. Four key findings underpin our expectation. First, armed conflict is much less likely in high-income countries, independently of protests (Fearon & Laitin, 2003; Boix, 2008; Collier, Hoeffler & Rohner, 2009). Second, to maintain a developed economy, education and pre-existing civil society organizations are typically necessary. These factors strengthen opposition groups, helping them to coordinate mobilization. In turn, the impact of protests increases, and, given a commitment to nonviolence among organizers, minimizes violence and rioting on the protester side, all of this reducing the risk of escalation into violence (Chenoweth & Stephan, 2011).
Third, aspects of economic development, such as dense economic networks that would be curtailed by widespread organized violence, or substantial importance of civil society organizations such as labor unions, help constrain the government from using heavy-handed repression (Hegre, Bernhard & Teorell, 2020). In developed economies, political conflict is unlikely to turn into armed conflict since states are more capable and economic incentives to use violence are weak (Fearon & Laitin, 2003; Boix, 2008; Collier, Hoeffler & Rohner, 2009; Hegre, 2015). Although development may not hinder governments in violent repression, protest dynamics are less likely to escalate into armed conflict in highly developed contexts.
Finally, economic development may insulate nonviolent opposition from opportunistic violence by third-party actors. Governments in developed countries are typically stronger militarily and have better organization and intelligence services (Kocher, 2004; Fearon & Laitin, 2003). As governments and protesters often have a joint interest in marginalizing violent groups, state capacity helps prevent violent groups from exploiting the legitimacy challenges caused by peaceful protests to forward their violent agendas in the wake of protest events. All in all, we expect socio-economic development to dampen the tendency for protests to escalate to armed conflict.
Research design
To optimize an armed conflict prediction model and examine our theoretical expectations, we develop models and evaluate their predicted performance for countries in Africa using the ViEWS early-warning system (Hegre et al., 2019, 2021). Following ViEWS, we specify the empirical models at the PRIO-GRID-month (pgm) level. The spatial units (grid cells) are quadratic cells with a spatial resolution of 0.5 x 0.5 decimal degrees corresponding to approximately 55 x 55 kilometers at the Equator (Tollefsen, Strand & Buhaug, 2012).
Our dependent variables are the monthly incidence and onset of state-based armed conflict. We use data from the UCDP Georeferenced Event Dataset (UCDP GED) v.20.1 (Croicu & Sundberg, 2015; Pettersson & Öberg, 2020) and aggregate the events coded as ‘state-based’ to the pgm level. We use a single-death threshold of violence. The incidence variable (ged_dummy_sb) is coded as 1 if state-based violence occurred, 0 if not. The onset variable (ged_dummy_sb_onset) is coded as 1 if state-based violence occurred and more than six months have passed since violence last occurred in the same cell, 0 if not. 2
We rely on the Armed Conflict Location & Event Data Project (ACLED) to operationalize independent variables measuring protest (Raleigh et al., 2010). We aggregate counts of protests to the pgm level and normalize them by grid cell population. Normalization ensures that our protest indicators do not simply differentiate densely populated grid cells from sparsely populated ones. We distinguish between four categories of protest events: peaceful protests, protests with low-level intervention, protests with excessive force against protesters, Decay maps illustrating the recent history (as of December 2016) of the different types of armed conflict and protest events. Cells coloured in red observed events in late 2016, with green color events about a year earlier, and with purple color no events the past three years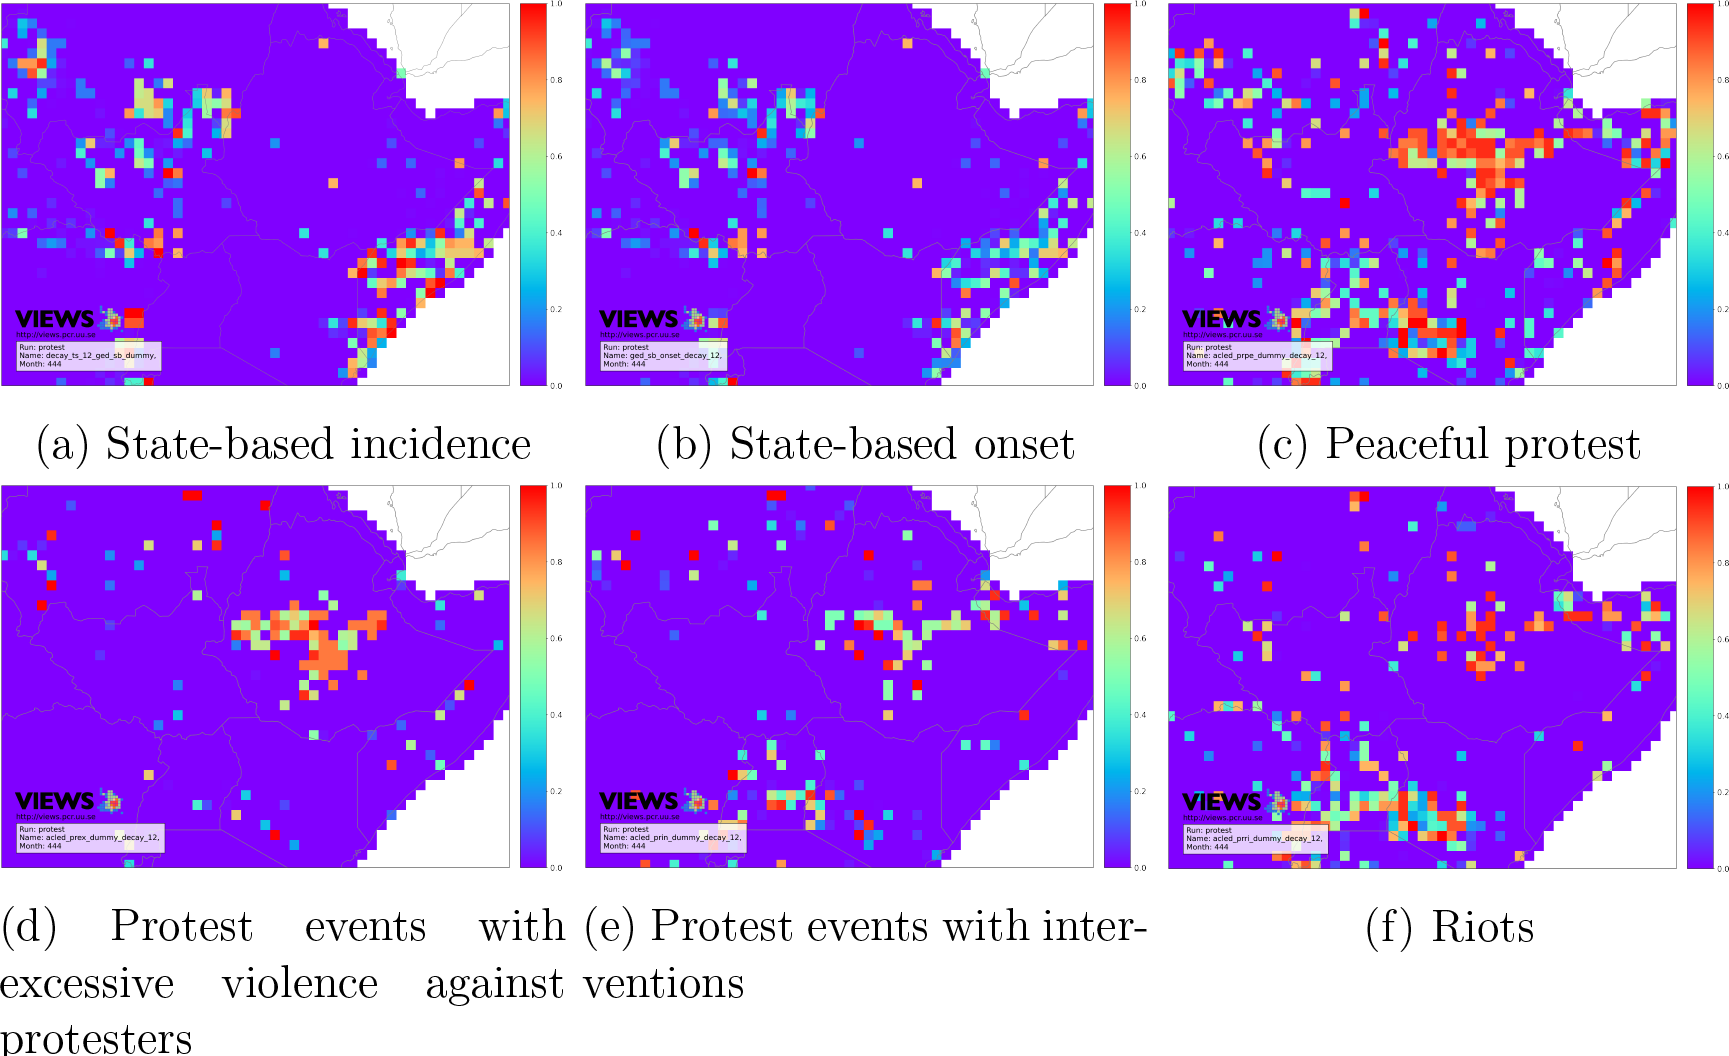
We include variables that capture the temporal and spatial dynamics of protest. For the temporal dimension, we construct decay variables for the time since the last protest events with a halflife of six months and include a one-month lag of protest. Further, we capture the cumulative effect of protest by computing the total number of events in the past three months. For the spatial dimension, we calculate the sum of all protest events for first- and second-order neighbor grid cells. Finally, we construct variables that measure the distance to the nearest protest event during the last three months.
Does this setup allow us to build protest models for armed conflict prediction, or are we simply predicting conflict with different data on conflict? In our view, the protest models we build using ACLED data are distinct from models that capture conflict history based on data from UCDP. First, as discussed in the theoretical section, protest and state-based armed conflict are distinguishable at a conceptual level. Note also that protest repression is conceptually different from armed conflict. Repression occurs when state armed actors use violence against unarmed protesters, whereas armed conflict requires armed actors on both sides. Second, patterns in the data support our conceptual notion of armed conflict and protest as qualitatively different. Figure 1 shows the geographical distribution of armed conflict and protest events focusing on Ethiopia and its neighboring countries. There is some spatial overlap between conflict and protest. However, a closer look reveals that protests are concentrated in urban areas, such as Addis Ababa, while armed conflict is more prevalent in eastern Ethiopia. Moreover, while there is a considerable amount of peaceful protest and even riots in southwest Kenya, armed conflict is absent. Finally, we compare all protest models to a baseline armed conflict history model in the empirical section. If our protest models merely capture conflict history, we would expect a low predictive performance compared to our baseline. These points should eliminate concerns that we are merely predicting conflict using more extensive conflict history data.
To evaluate how protest interacts with contextual factors to affect armed conflict (E2 and E3), we include political institutions and economic development in our models. We measure political institutions at the country level using variables from the Varieties of Democracy (V-Dem) and Rulers, Elections and Irregular Governance (REIGN) datasets (Bell, 2016b; Coppedge et al., 2020). 5 The variables measure level of electoral democracy, civil liberties, the number of months since the last elections took place, and whether an election is scheduled for the coming six months. Finally, we use data on economic development from WorldBank (2019) and Tollefsen, Strand & Buhaug (2012). The indicators measure GDP per capita, GDP per capita growth and unemployment at the country level. We measure the logged gross cell product per capita, infant mortality rate, urban area and agricultural area at the grid cell level.
Model specifications and comparisons
We define nine empirical models (sets of predictors) based on the theoretical explanations (E1, E2, E3) summarized in Table I. Our interest lies in predicting incidence and onset, and we estimate all the models for both outcomes. We compare our models to a hierarchy of benchmark models. For our purpose – to evaluate the value of our theoretically informed models – baseline models should satisfy the following criteria: they should have good predictive performance but also avoid the predictive-modeling analogies to omitted variable and post-treatment bias. 6 In our context, the baseline model should include features that are correlated with both protest and armed conflict, but only if they are not the results of protest in itself. Our initial baseline model only includes information from the prediction outcome (Cranmer & Desmarais, 2017) – i.e. variables measuring conflict history. Research has shown that conflict history models are difficult to outperform (Ward, Greenhill & Bakke, 2010; Hegre et al., 2019), making this a tough baseline model to beat. However, most model comparisons we make are either between models in Table I that all include this baseline and different formulations of the protest models or between richer models compared to the same models without the protest features. We contend that this relatively parsimonious setup allows a robust but transparent demonstration of the value of the protest features for predictive modeling. 7
The first set of models focuses on protest-repression dynamics (M1–M3). Here, we evaluate whether information on recent protest enhances predictive performance compared to the baseline model and whether distinguishing between protest with and without violence further improves armed conflict predictions (E1). We first specify a naive protest model (M1) that includes protest counts and the temporal and spatial transformations of protest information without considering the role of violence by security forces or protesters. 8 We compare the predictive performance of this naive protest model with two models that differentiate between peaceful protests, protest with low-level intervention, and excessive violence by the government or violence by demonstrators. A local protest-repression dynamics model contains this information on the pgm level (M2). We also specify a national protest-repression dynamics model that includes protest variables aggregated to the country level (M3).
Overview of model specifications
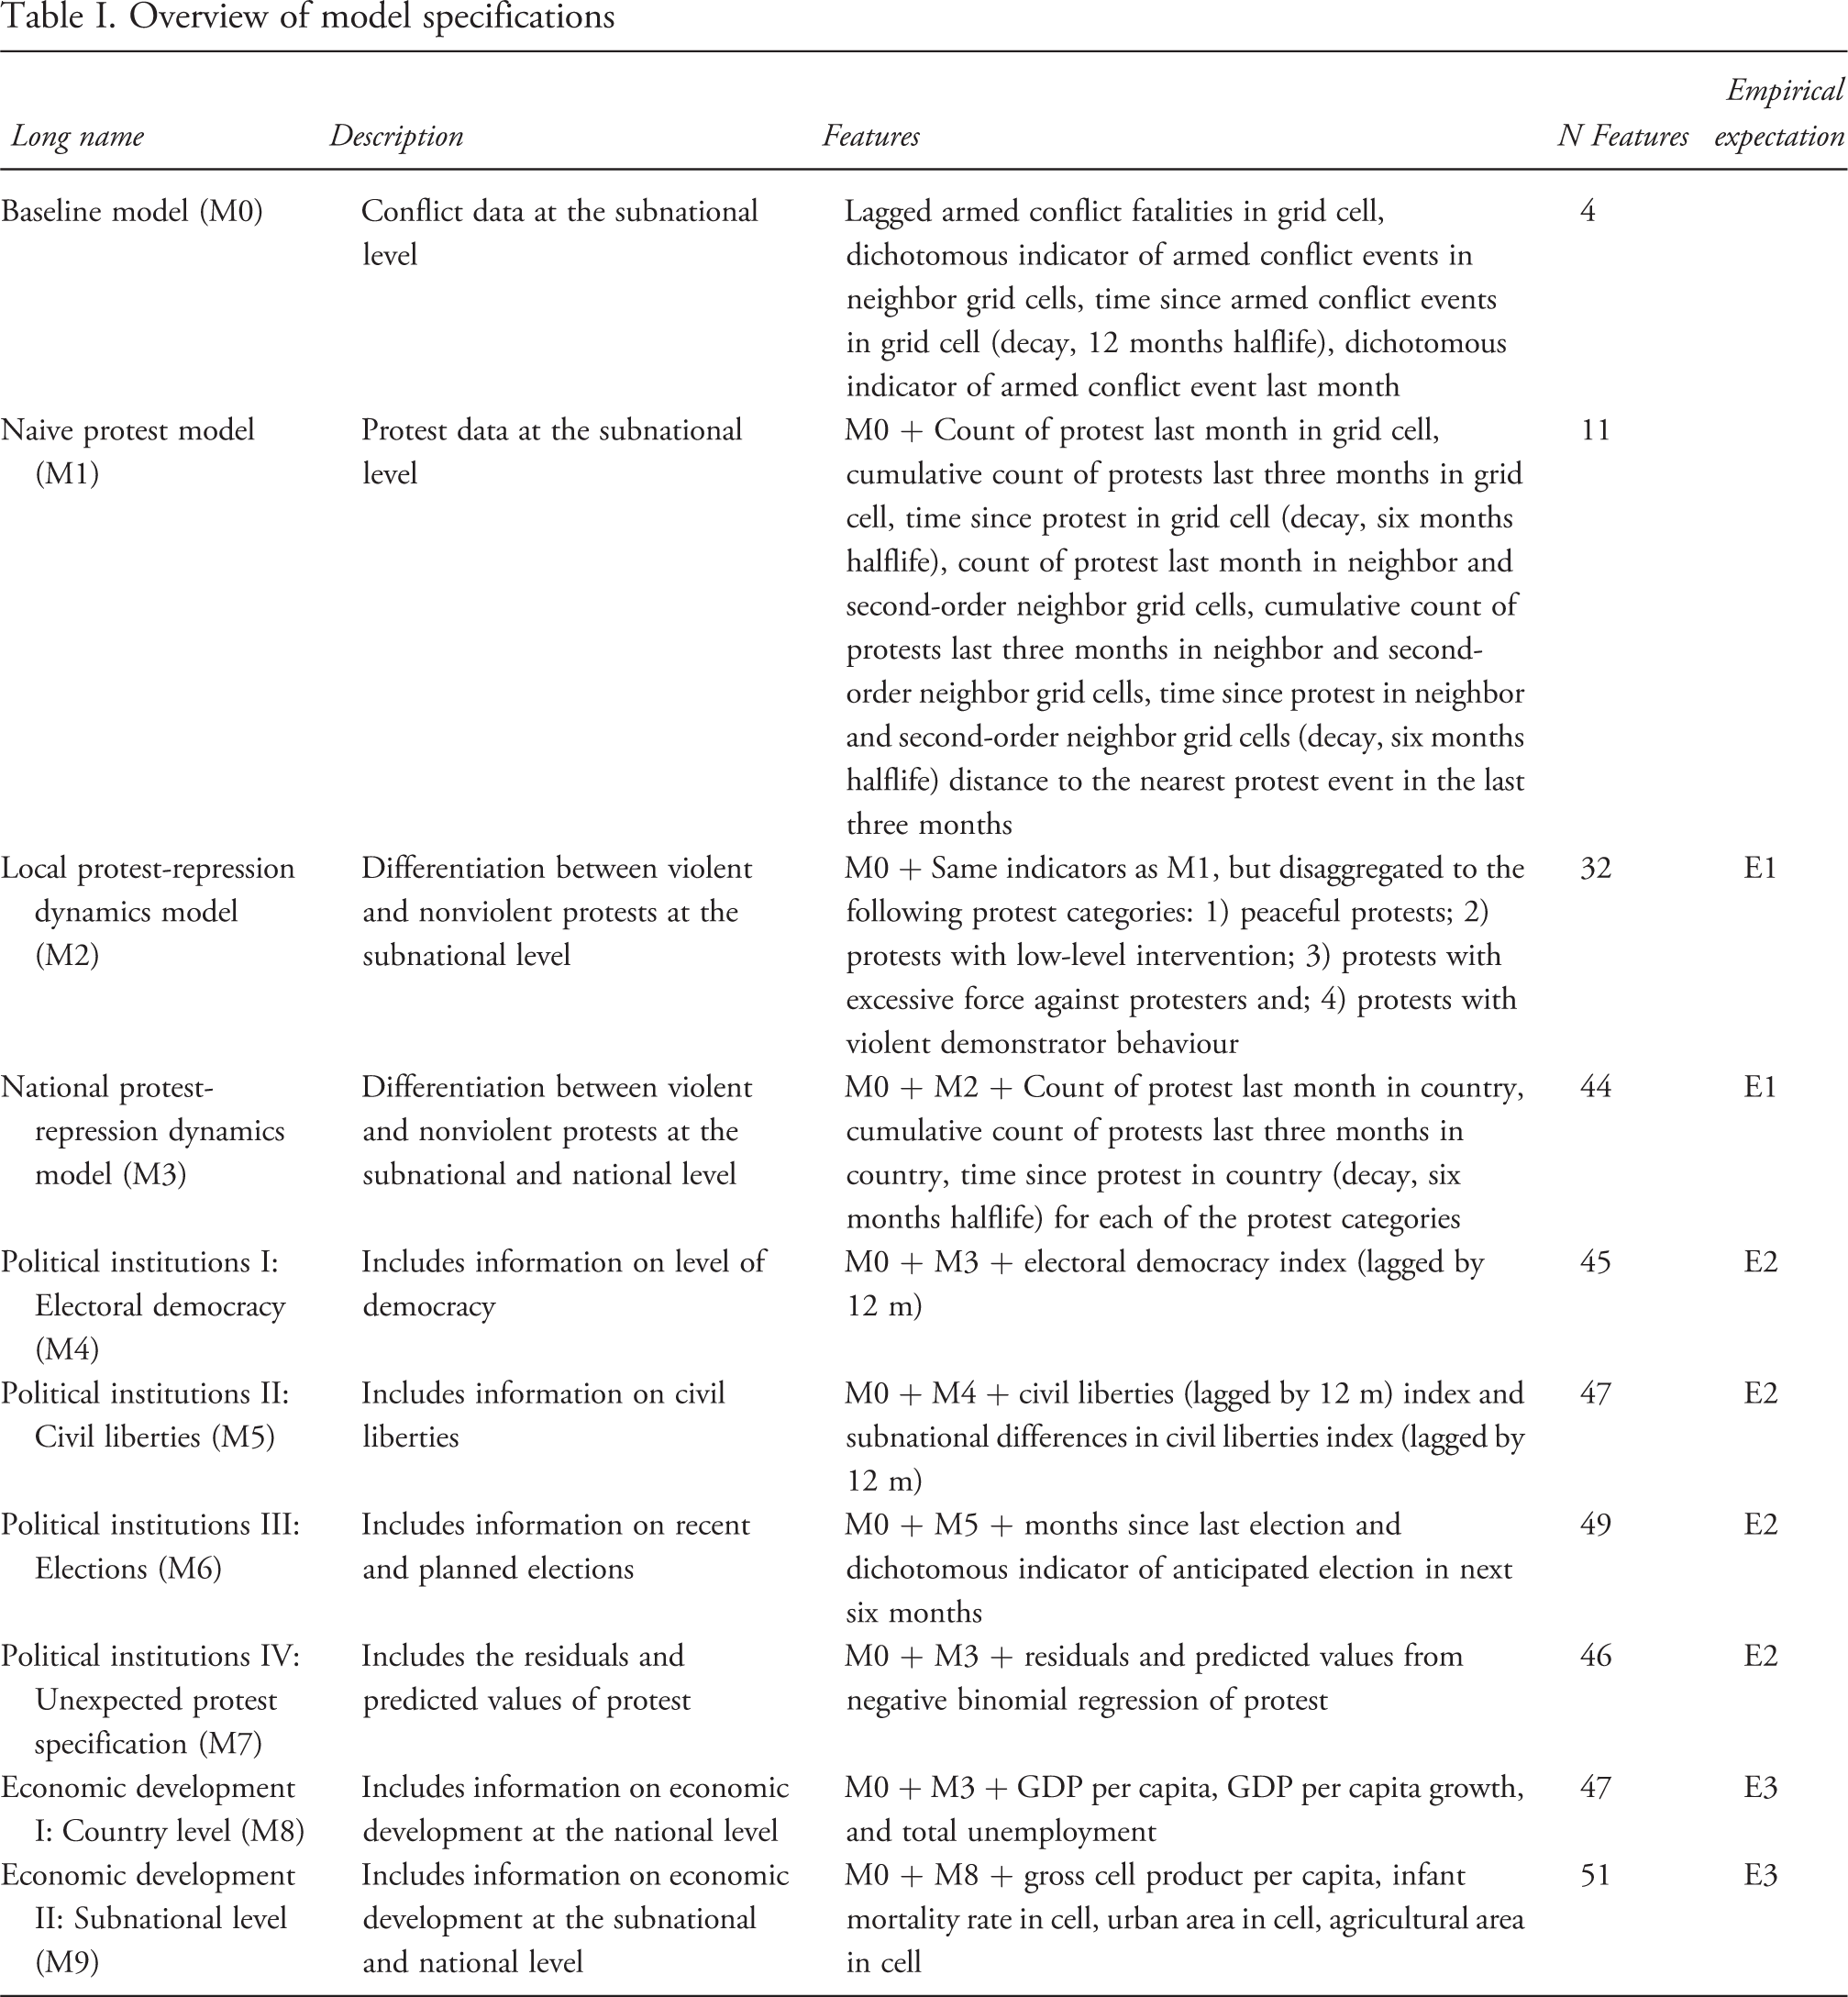
The final set of models incorporates features related to economic development on the national and subnational levels (E3). The first economic development model includes variables measuring GDP per capita, growth and unemployment (M8), whereas the second also incorporates information on gross cell product per capita, local infant mortality rate and urban/agricultural area in grid cells. E3 stipulates that models combining information on protest and economic development outperform models with only protest or economic development variables.
Estimation
We use the random forest classifier (Breiman, 2001) to link the predictors to the outcome. Random forest models have been very successful for forecasting purposes, as they allow for very flexibly modeled relationships between features and the likelihood of the outcomes, including interactive relationships, work well with a large number of features, and have strong built-in procedures to avoid overfitting. Potential interactions between a set of independent variables do not need to be specified but are instead picked up by algorithm due to the recursive structure of building the trees. Interpreting random-forest model results can be challenging. We overcome this challenge by discussing ‘individual conditional expectation’ (ICE) and partial dependence plots. Since the algorithm is computationally intensive with a large number of trees, we ‘asymmetrically’ downsample, i.e. keep all conflict outcomes but sample 30% of all non-conflict observations. For more details, see Online appendix A-2.
We predict for all months from January 2017 to December 2019. We train separate models for different forecasting horizons and show results for predictions
Evaluation
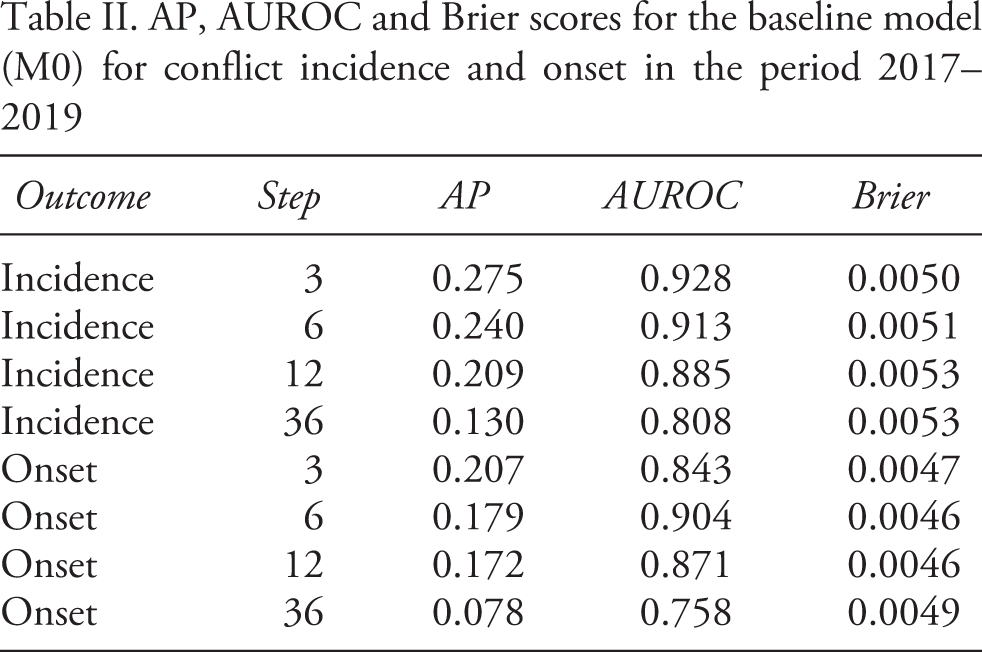
AP, AUROC and Brier scores for the baseline model (M0) for conflict incidence and onset in the period 2017–2019
To measure the effect of including additional features, we compute and compare the percentile bootstrapped confidence intervals by drawing 1,000 samples of prediction-actual pairs, calculating the AP scores for each sample, computing the difference between a baseline and more extensive model specification, and defining the 95% confidence intervals. We also extensively use visualization tools such as maps and PDP/ICE plots to analyze the predictions.
Results
Table II presents the performance of the baseline model (M0) for conflict incidence and onset in AP, AUROC and Brier scores. At time step 3 for incidence/onset, AP is 0.275/0.207, AUROC 0.928/0.843 and Brier 0.0050/0.0047. Although the benchmark model is simple, it is not an easy model to beat. The full ensemble model in Hegre et al. (2019: 166), for instance, has AP of 0.277 averaged across steps, for the same prediction problem – only about 30% better than the incidence baseline model we use here.
Evaluation: Incidence
Our hypotheses specify that including data on protest-repression dynamics on its own (E1) and together with data on political institutions (E2) and economic development (E3) systematically improves armed conflict prediction. Figure 2 reports the AP, AUROC and Brier Performance metrics for armed conflict incidence: AP, AUROC and Brier scores for M0, M1 and M2 at steps 3, 6, 12, 36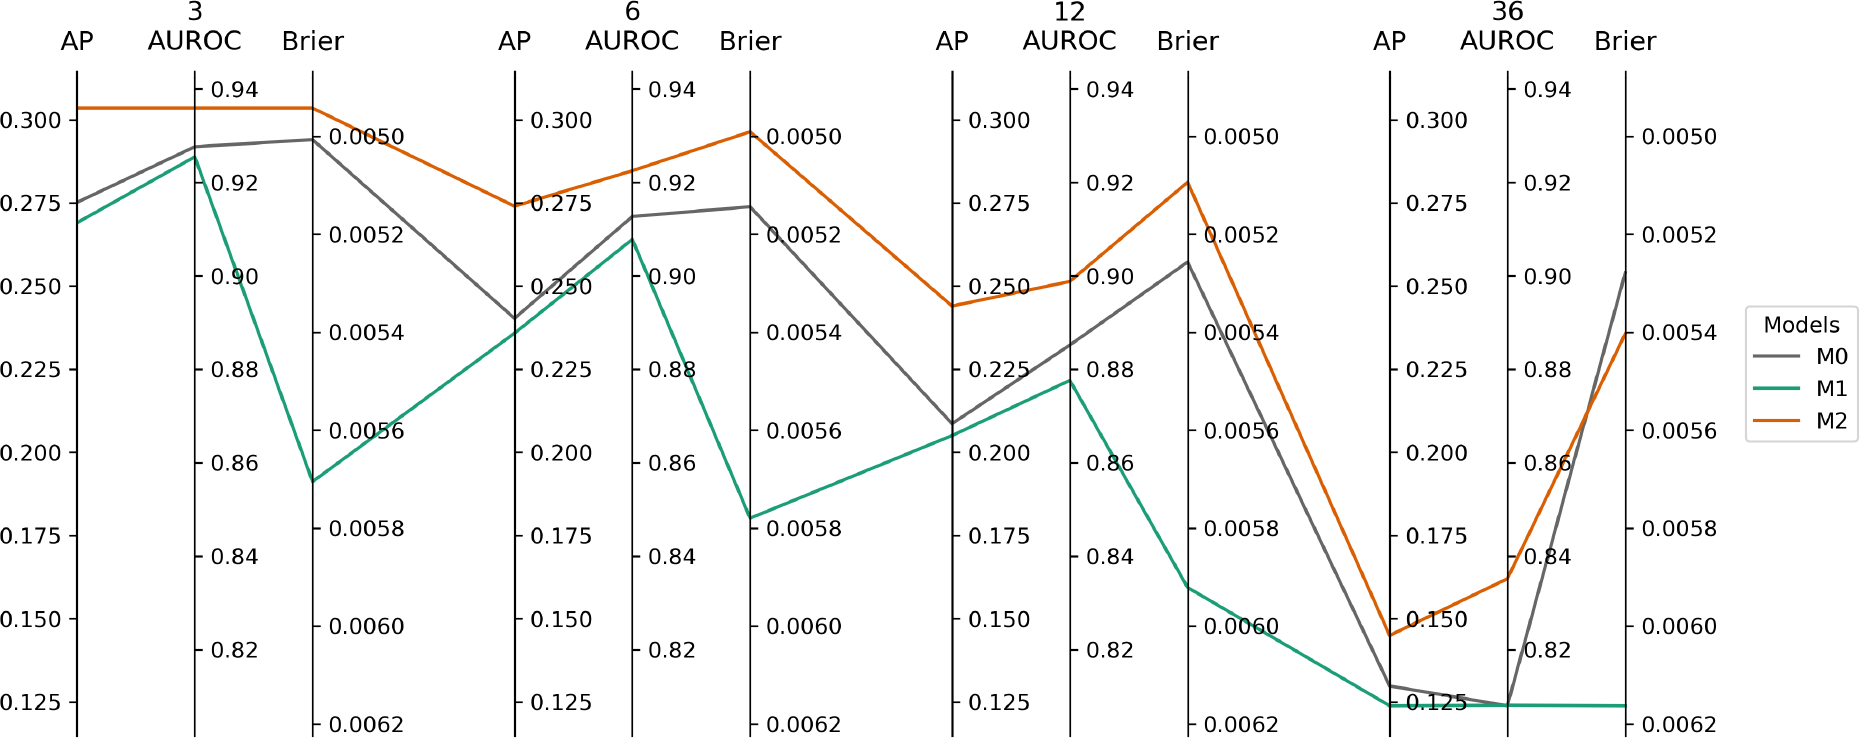
Further, we see a clear and consistent difference in predictive performance between the protest-repression models and the baseline and the naive protest model across metrics and time. AP scores are 0.303 vs 0.275/0.269 (3 months) and 0.144 vs 0.129/0.123 (36 months). These results provide evidence in favor of E1: Models with information on recent protests incorporating protest-repression dynamics improve predictions compared to a naive protest model. The improvement is substantial: On average, across all possible thresholds, the proportion of positive predictions that are correct increases by 12%, from 26.9% to 30.3%.
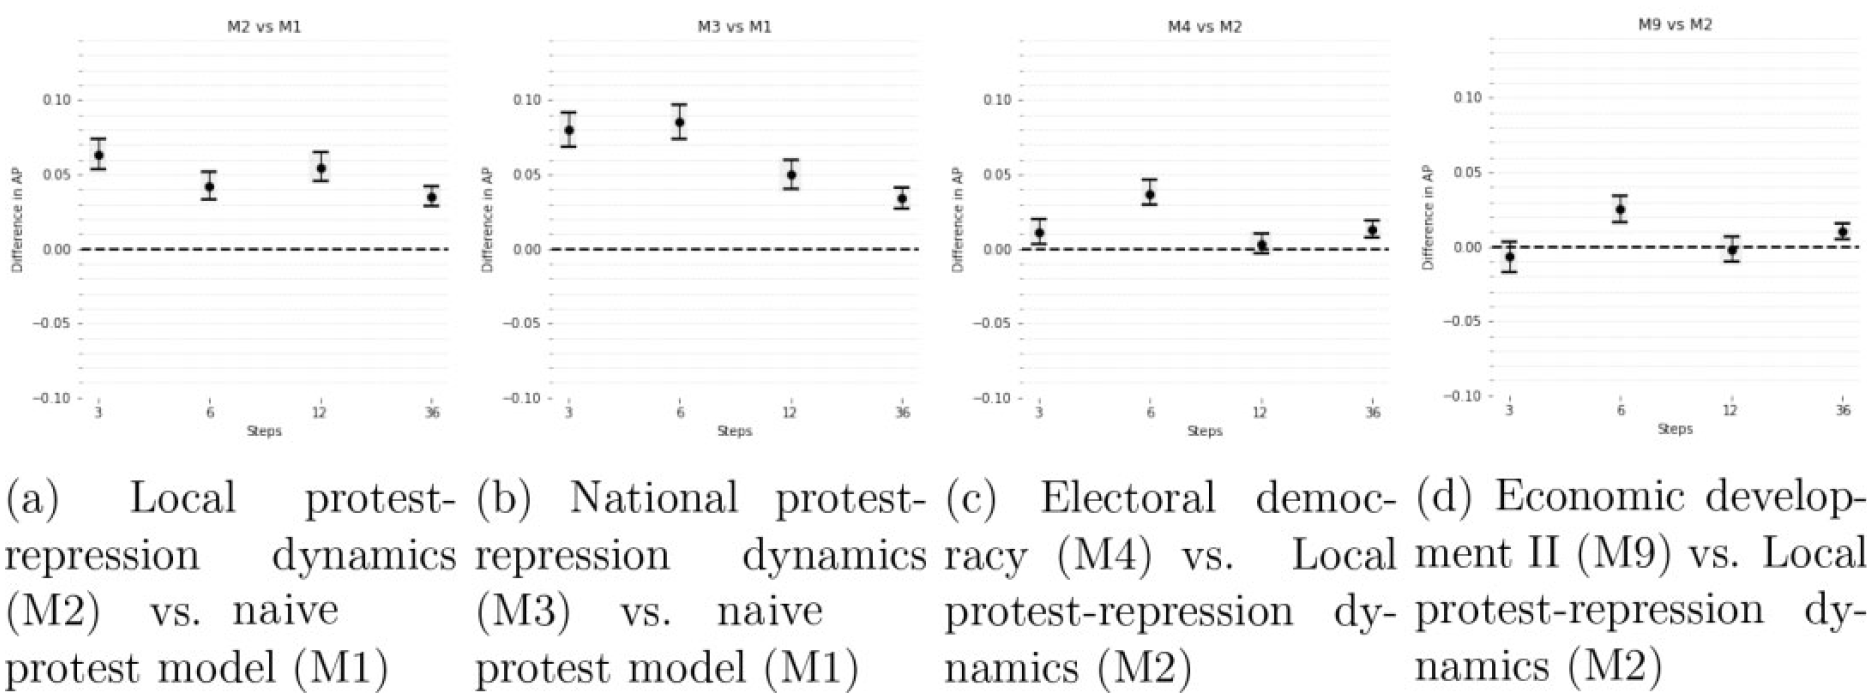
Figures 3, 4 and 5 displays a more rigorous test of expectations E1–E3. Each plot shows the difference in bootstrapped AP scores on the y-axis and time points on the x-axis for the relevant model comparisons. The 95% confidence intervals are computed by drawing 1,000 bootstrapped samples of prediction-actual pairs, taking the difference in AP scores between models for each of these draws, and defining the percentile confidence intervals across 1,000 bootstrapped AP metrics.
Figure 3a compares the naive protest model M1 to the baseline M0. A positive difference in AP indicates that M1 outperforms M0. The plot shows no difference between M0 and M1, indicating that naively adding information on recent protest does not improve armed conflict predictions. Figures 3b and 3c display the same comparison for the protest-repression dynamics models M2 and M3 against M1 as a test of E1. The results strongly support E1: we see consistent increases in AP for the protest-repression dynamics models compared to the naive protest model. 12
We specify two comparison models to test the impact of adding information on political institutions (E2) and economic development (E3). E2 and E3 suggest that models that include protest and political institutions/economic development variables should outperform models with only protest or political institutions/economic development. We, therefore, first compare the protest-repression dynamics model (M2) to each of the more extensive models (M4–M9). Second, we compare M4–M9 to models similar to each of these, except for omitting information on protest-repression dynamics. This second comparison helps isolate differences in predictive performance due to the interplay of protest and political institutions/economic development from Testing E1: Difference of bootstrapped AP scores for armed conflict incidence. See Table I for model details Testing E2: Difference of bootstrapped AP scores for armed conflict incidence. See Table I for model details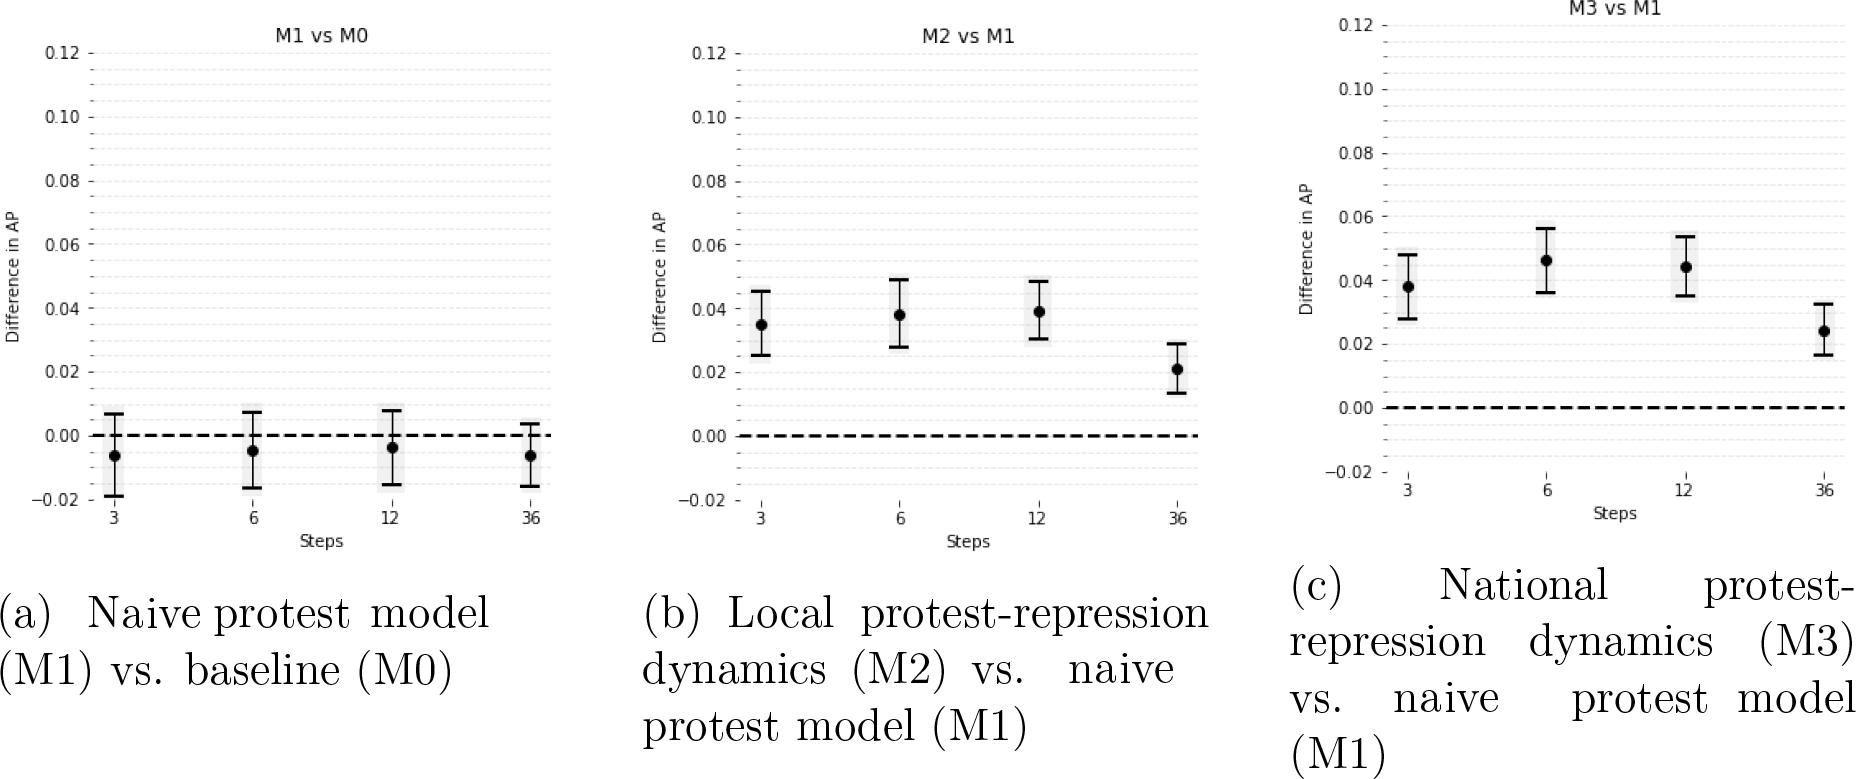
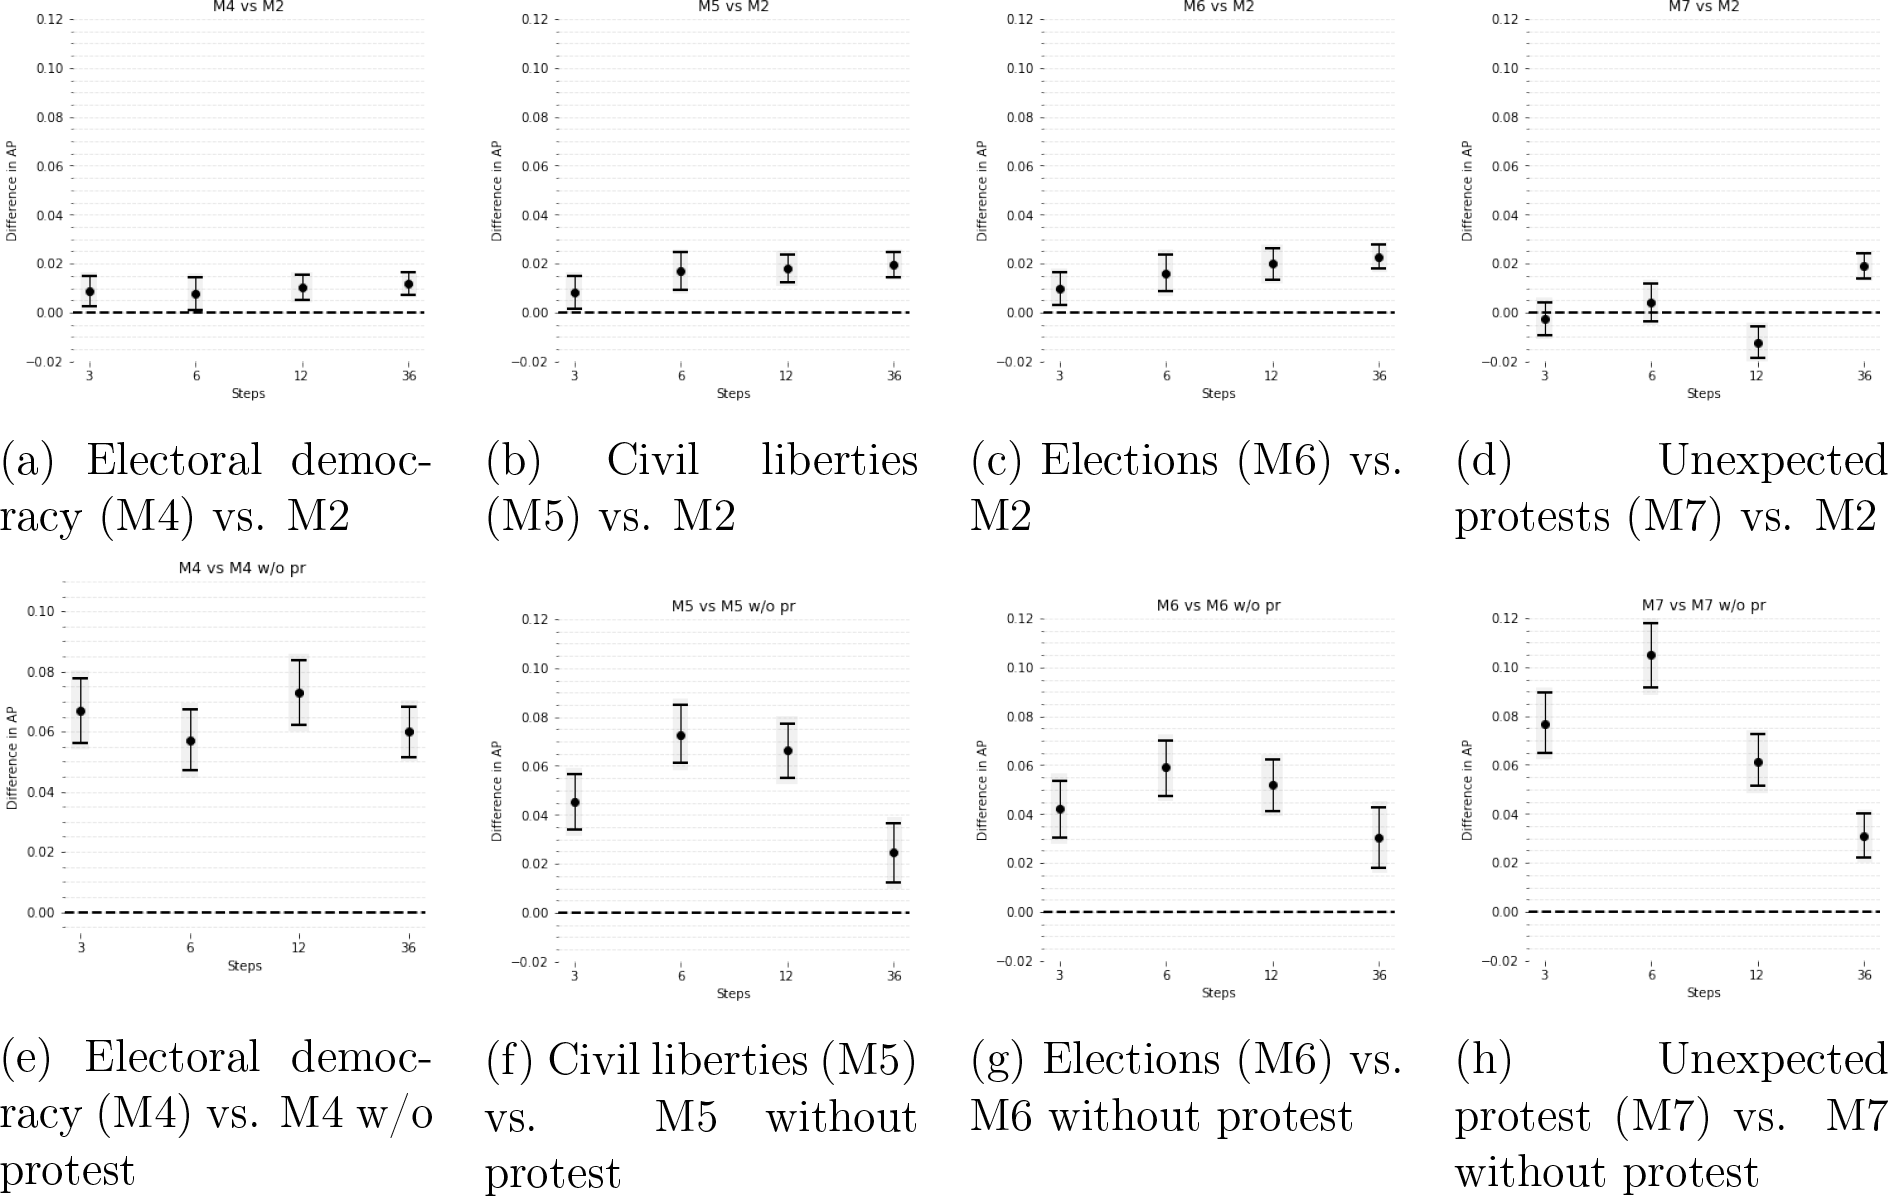
In Figures 4a–4d, we see that adding features for electoral democracy (M4), civil liberties (M5) and elections (M6) to the protest-repression dynamics model (M2) systematically improve predictions. The unexpected protest model (M7), however, does not clearly improve predictive performance relative to M2. Nonetheless, the results overall indicate that political-institutional features can improve protest models. Further, the bottom row (Figures 4e–4h) shows that the performance of all these four models is much better than similar models where all protest features are removed. It Testing E3: Difference of bootstrapped AP scores for armed conflict incidence. See Table I for model details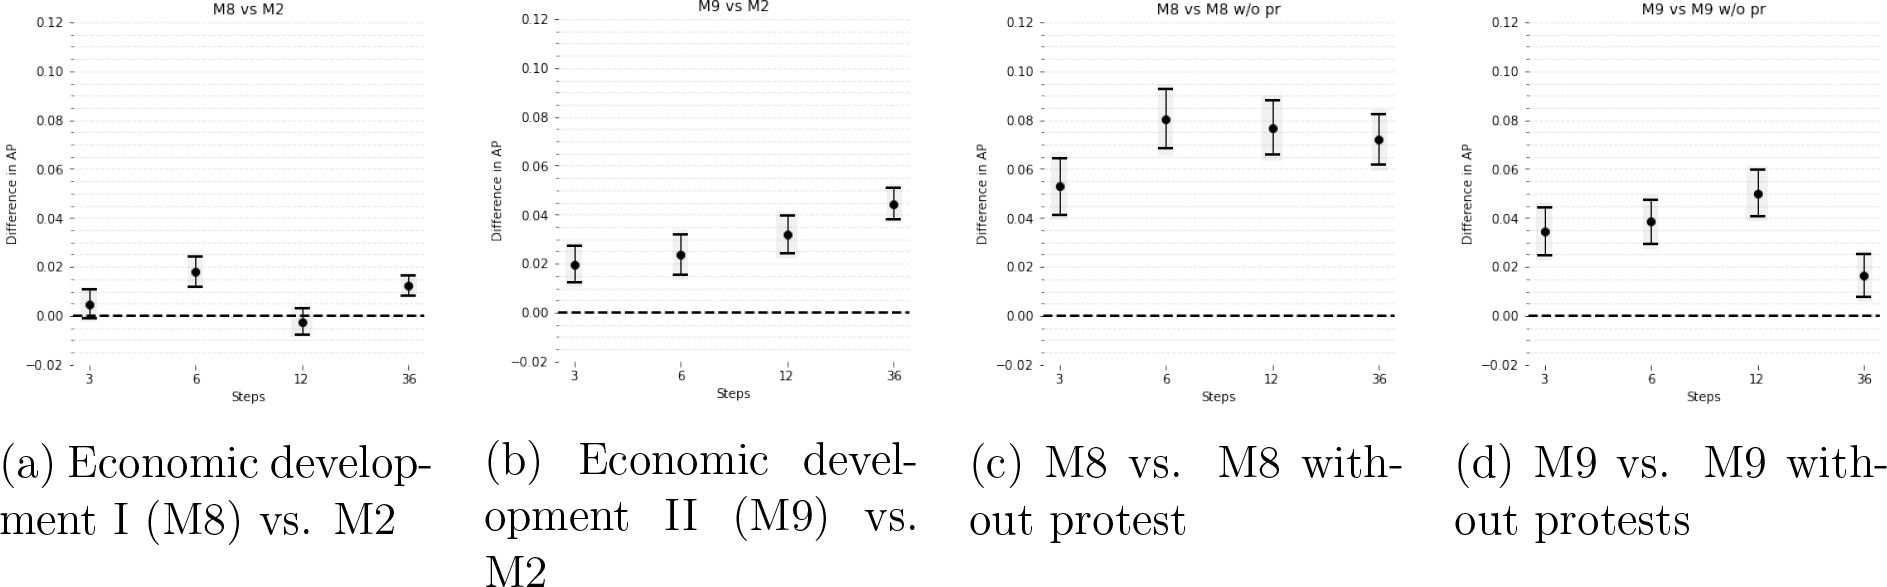
In Figure 5, we plot similar results for empirical expectation E3. Overall, combining protest with economic development features improves predictive performance. The results are more consistent for the local economic development model (M9) than for the corresponding national-level development model (M8).
How do our model specifications change subnational armed conflict predictions? 13 The map in Figure 6a plots the baseline predicted probabilities of conflict incidence for March 2017 for Ethiopia and its neighboring countries for the baseline model (M0) predicting three months into the future. Figure 6a also marks with black dots the actual locations of conflict events in that month. The baseline model shows probabilities higher than 80% in conflict-ridden areas, such as Somalia, but does not always get the exact locations right. Also, note that the model misses conflict events in the eastern part and at the southern borders of South Sudan and conflict events near Lamu in Kenya.
Figures 6b–6d map the difference in predicted probabilities for three of our protest models compared to the baseline. 14 As Figure 6b shows, the local protest-repression model adjusts the predicted probability upwards for most of the locations – three grid cells with actual conflict receive clearly lower predicted probabilities than in the baseline model. Particularly in Somalia, the protest model yields higher predicted probabilities for three out of five false negatives. These improvements are even more clear in Figures 6c and 6d. The development model in particular strengthens predictions in Somalia and Kenya.
The reason for these improvements can be seen in the maps of the distribution of protest events in the region up to December 2016 (Figures 6e and 6f). The area around Mogadishu saw peaceful but also several repressed protest events. The most substantial contribution to false positives is observed in Somaliland, an area that saw a combination of peaceful protests and riots.
Our theoretical expectations suggest that adding information on protest-repression dynamics and economic development improves predictive performance. Our results have provided evidence in favor of these. The theory also suggests clear directionality of effects: protest features are expected to increase conflict probability. In Figure 7, we take a closer look at the direction of effects in the centered ICE/partial dependence (PD) plots based on M9 for predictions three months ahead.
PD plots provide us with information regarding the global relationship between an individual feature and the predicted outcome of interest when all other features are held constant; the ICE lines display instances separately. 15 The y-axis shows the change in the predicted probability of armed conflict. The x-axis displays the values of a feature, here the decay of time since different protest categories (a value of 0 indicates no recent protest, a 1 that protest occurred last month). All plots in Figure 7 indicate that the predicted probability of state-based conflict increases with temporal proximity to all protest categories. The patterns in the figure are consistent with the theoretical arguments linking protest-repression dynamics to armed conflict.
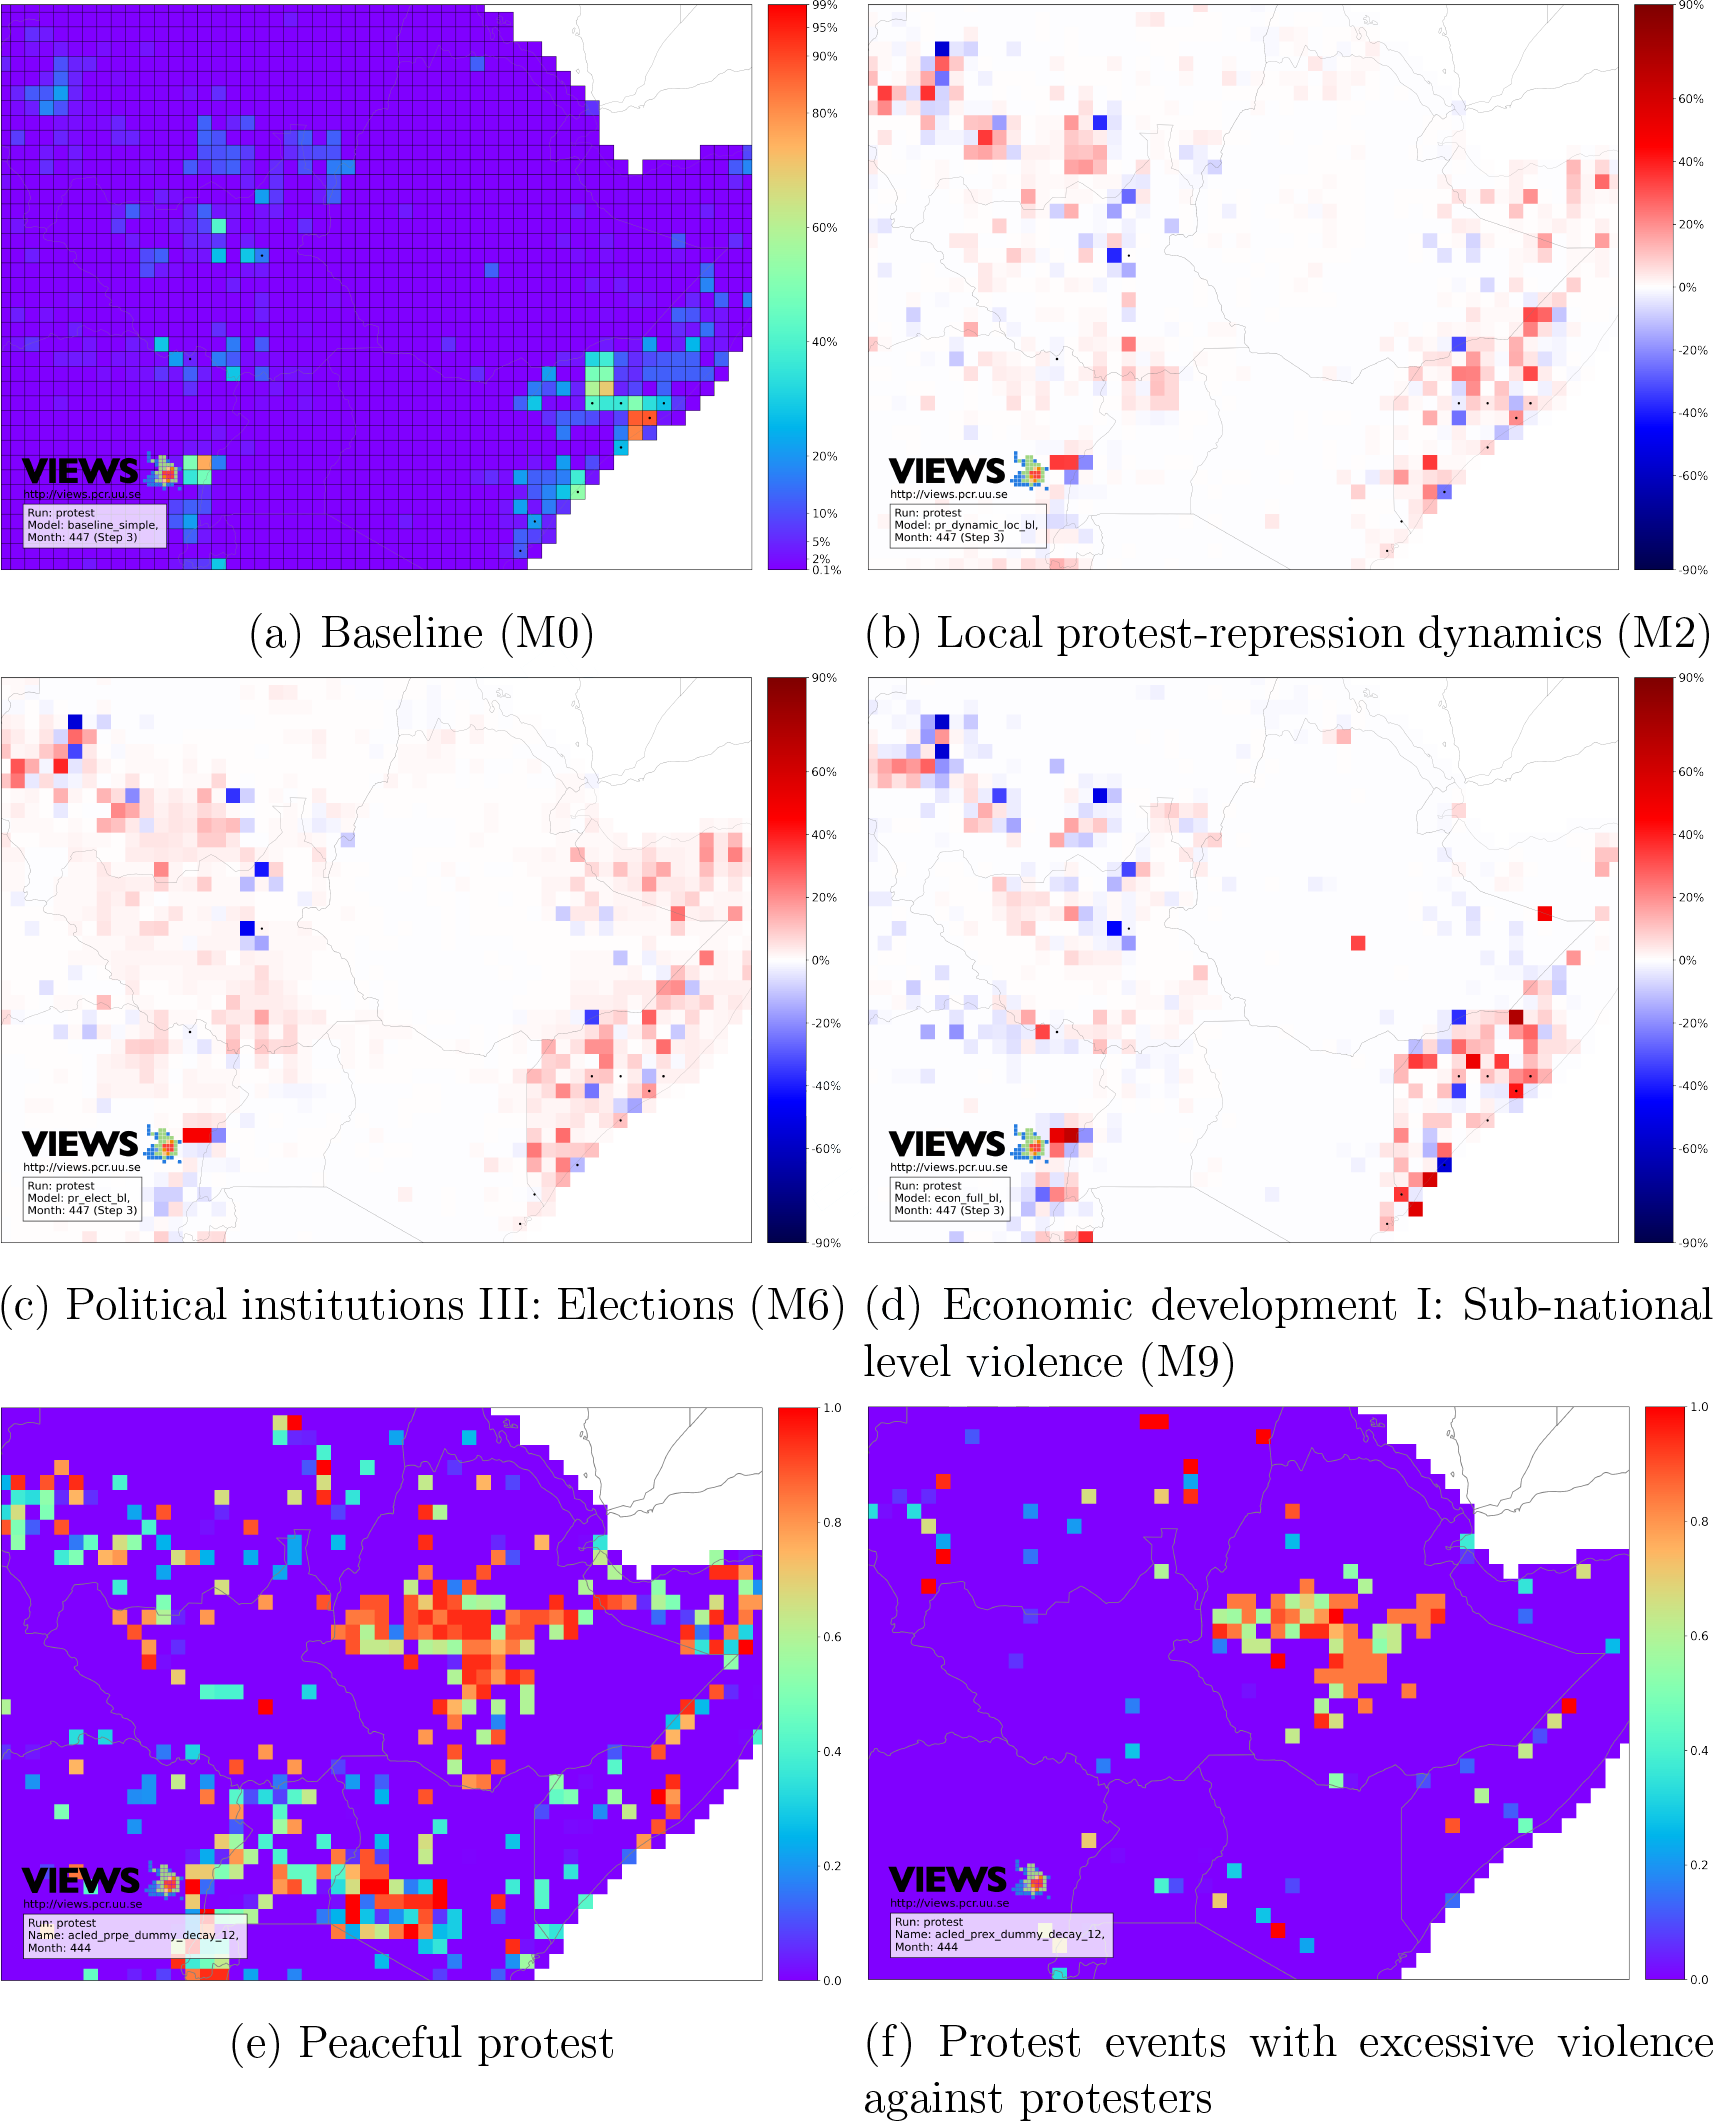
Plots a–d: Differences in predicted probability between baseline and protest models for March 2017 (step = 3). The black triangles indicate where an actual conflict event was observed (based on a window of six months). Plots e–f: Decay maps illustrating the recent history (as of December 2016) of protest. Cells colored in red observed events in late 2016, with green color events about a year earlier, and with purple color no events the past three years
Evaluation: Onset
How does information on protest affect armed conflict onset prediction? In Figure 8, we display key model comparisons for protest onset. Consistent with E1 and the incidence results, we see that the two protest-repression dynamics models (M2 and M3) outperform the naive protest model. In terms of improvement in average precision (AP), the theoretically informed protest models are even more important for onset than for incidence. In particular, when comparing the national Combination of centered ICE and partial dependence plots for predicted armed conflict incidence by local protest-repression dynamics features (Model M9, Step 3) Key results for E1, E2 and E3 for armed conflict onset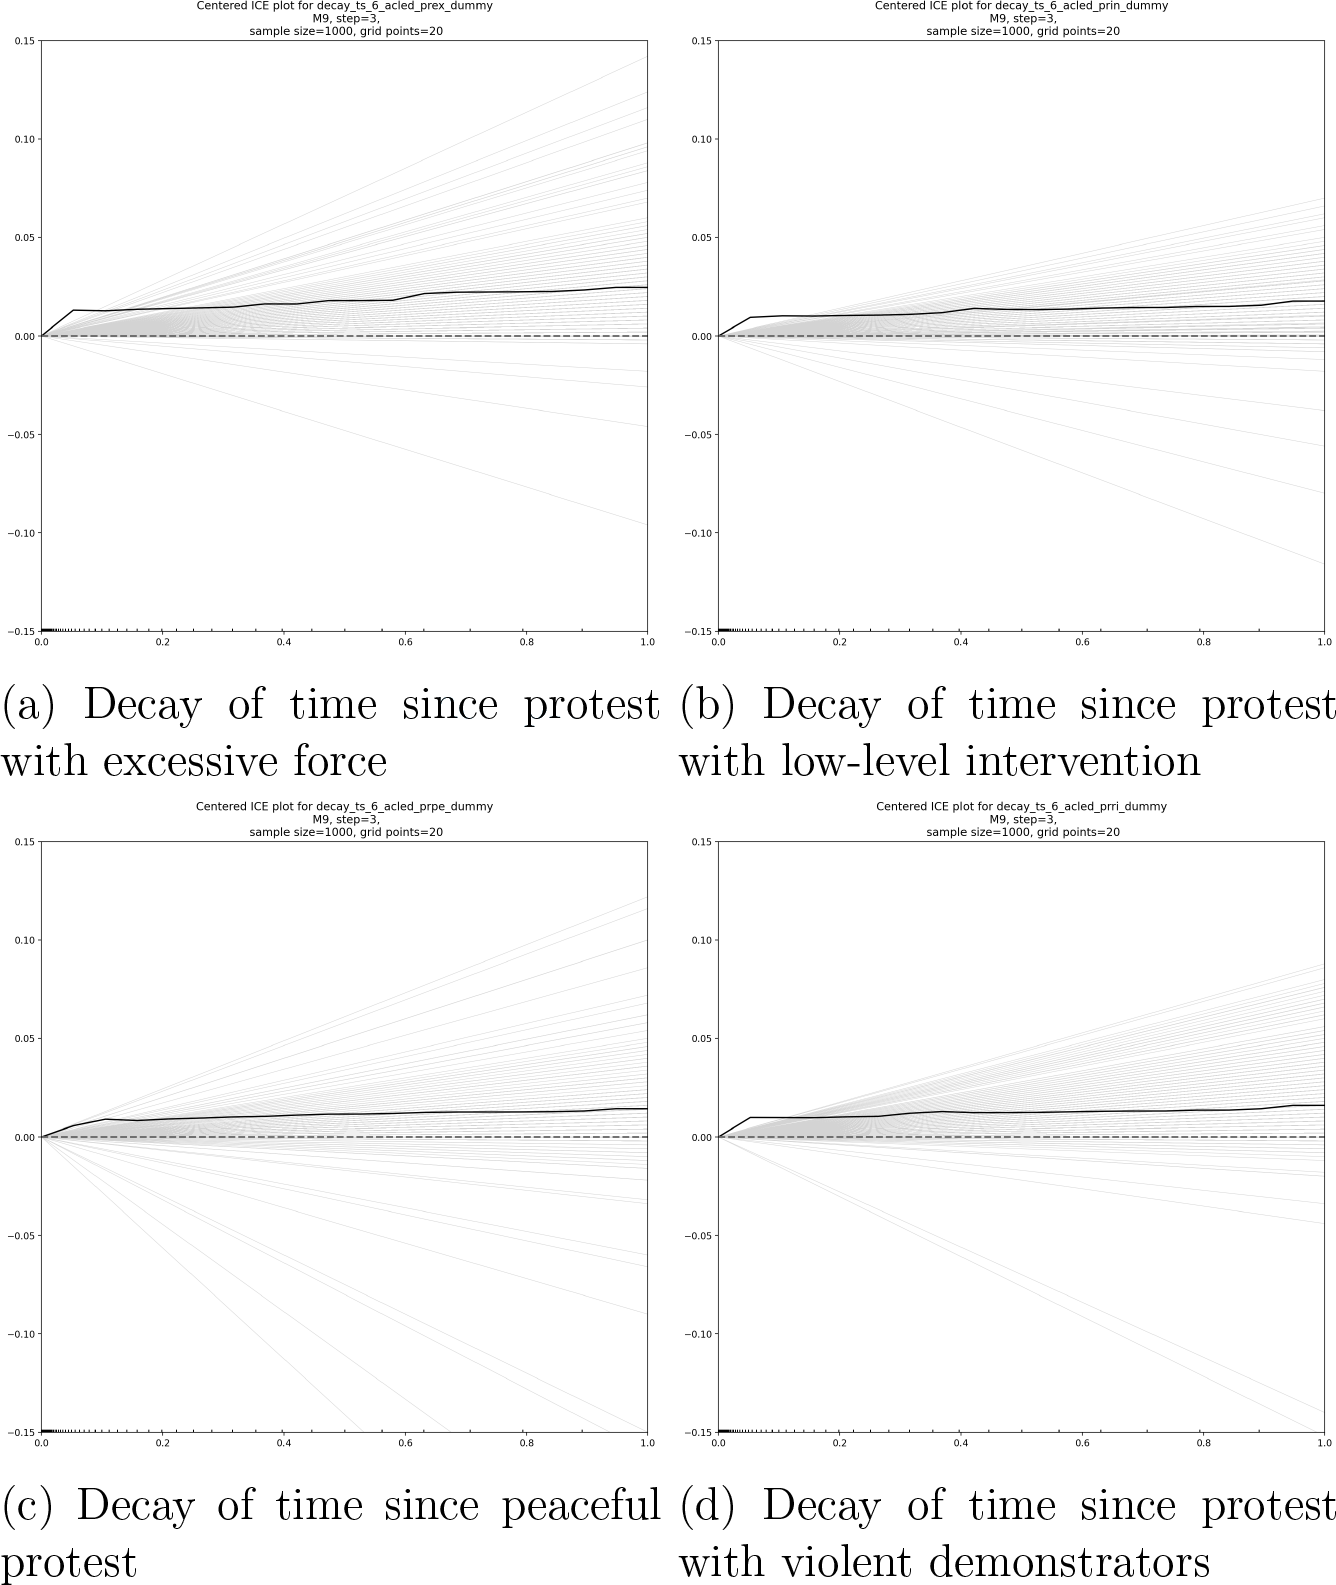
In sum, the combined incidence and onset results suggest strong evidence in favor of E1. Theoretically informed protest models improve our ability to predict armed conflict. We also find considerable evidence for E2 (political institutions) and E3 (economic development), although results vary somewhat depending on model specification and outcome.
Conclusion
Forecasting has entered the mainstream in peace and conflict studies, and policymakers are increasingly interested in conflict early-warning systems. In this article, we have leveraged forecasting tools in the ViEWS system to assess whether data on protest improve early warning of armed conflict.
Our starting point was that protest – a low-intensity form of political conflict – can lead to civil war violence. Protest should therefore be informative for conflict early-warning systems, but no studies have so far convincingly leveraged protest data to improve conflict predictions. Since most protests do not lead to civil war, we turned to theoretical accounts of the dynamics and contexts that increase the potential for armed violence in the wake of protests. The three theoretical explanations we discussed, namely protest-repression dynamics, political institutions and economic development, then guided how we specified our forecasting models.
Our empirical analysis showed that the theoretically informed models of protest outperformed a baseline model that captured conflict history and a naive protest model that treated all protests equally. The evidence also indicates that models that combine information on protest dynamics and the political/economic context in which protests occur outperform models that incorporate these aspects separately. The results are at least as strong when forecasting the onset of conflict as incidence.
Our article shows that event data can be combined with contextual data to improve predictions of where and when armed conflict will occur at the subnational level. This evidence is significant: the development of tools and systems that can identify the location and timing of violence is needed to prevent and mitigate violence. Importantly, our approach underlines that theory has a vital role to play in armed conflict forecasting – atheoretical machine-learning models do not necessarily pick up such patterns without a guide for how to specify them. Theory-driven predictive modeling can be taken further than we have done here by specifying the directionality and functional form of effects and exploring when and where expectations hold. Research teams and decisionmakers need to jointly leverage theory, data and predictive methods to improve existing systems and develop potent new ones.
Footnotes
Acknowledgements
The authors would like to thank Mihai Croicu, Jim Dale, David and the entire ViEWS team for help with data, code and contributing to the analytical tools we use. We would like to thank participants at a PRIO Brownbag, the Conflict Research Society annual conference 2021, the digital AFK Methods workshop in September 2021, and three anonymous reviewers.
Funding
The author(s) disclosed receipt of the following financial support for the research, authorship, and/or publication of this article: The research was funded by the European Research Council, project H2020-ERC-2015-AdG 694640 (ViEWS), Riksbankens Jubileumsfond (project M21-0002 Societies at Risk), MISTRA Geopolitics, and the Swedish Research Council grant nr. 2018-01222. The evaluations were performed on resources provided by the Swedish National Infrastructure for Computing (SNIC) at Uppsala Multidisciplinary Center for Advanced Computational Science (UPPMAX). See ![]() for more information on the project.
for more information on the project.