
Abstract
Platform endorsement is becoming increasingly popular and plays a critical role in online health care platforms by aiding patient choices and shaping doctors’ decisions. Using a unique dataset from a major Chinese online doctor consultation platform, this study applies a generalized synthetic control method to examine the impact of endorsement on patient demand, doctor service pricing, quantity, and quality. The findings show that endorsement significantly increases the price and quantity of paid services, while reducing free services among endorsed doctors. Despite handling higher service volumes, endorsed doctors maintain or improve quality. The endorsement program generates greater revenue for endorsed doctors and the platform, but it raises concerns about equity in health care access due to reduced free service provision for underprivileged patients. The analysis further reveals that the impact of endorsement varies between initial endorsement and reendorsement as well as between high-prosocial and low-prosocial doctors. These findings underscore the nuanced role of information disclosure in shaping doctor behavior and patient access, offering important implications for platform design.
Online health care has surged in popularity among patients and doctors, especially after the COVID-19 pandemic. By 2023, the global online health care market had surpassed $130 billion and is projected to grow at an annual rate of 16.4% from 2023 to 2032 (Global Market Insights 2025). In this evolving health care landscape, online platforms play a pivotal role in enhancing health care access and equity (World Health Organization 2010). By overcoming geographical barriers and optimizing time efficiency, these platforms enable doctors to extend their expertise to a broader patient base through both paid and free consultations. The latter, targeted at underprivileged populations, is a prevalent practice across both developed and developing countries. 1 Consequently, online health care platforms hold the potential to significantly enhance doctors’ service provision and concurrently improve health care access and equity.
Despite this potential, online health care platforms face significant challenges that could hinder their growth. Specifically, the inherent information asymmetry problem in health care (Arrow 1963), amplified by the expanded pool of doctors available on these platforms, makes it difficult for patients to make choices (Natan 2025). Additionally, online platforms provide a new work environment that offers doctors greater flexibility and autonomy, making it challenging to maintain consistent engagement. To mitigate these problems, platforms have introduced “platform endorsement,” using platform-collected data to select and award leading doctors with endorsement badges. This approach is designed not only to assist patients in making informed choices by highlighting leading doctors but also to motivate doctors to enhance their engagement with platforms.
While this method is straightforward and increasingly popular, its effectiveness remains unclear and understudied, especially in contexts where providers can easily adjust multidimensional decisions and face capacity constraints. Intuitively, on the demand side, endorsement may serve as clear quality signals for patients, reducing the need for extensive searches across numerous doctors and various information dimensions. This should lead to increased demand for endorsed doctors, a phenomenon well documented in other online platforms (Bairathi, Zhang, and Lambrecht 2025; Hui et al. 2016).
On the supply side, however, the impact of endorsement is more nuanced, as doctors must make multidimensional decisions about pricing, quantity, quality, and the allocation of effort between free and paid patient groups, with endorsement potentially influencing these decisions through various channels. The first channel is via the demand effect: Increased patient demand may lead to higher prices and a greater number of consultations from endorsed doctors, while its impact on quality could improve or worsen, depending on how the information is disclosed. If the disclosed information is comprehensive and diagnostic (i.e., it meaningfully boosts demand and strengthens doctors’ incentives), quality may improve. Conversely, if only selective quality dimensions are reported or if quality measures are imperfect, doctors may reallocate effort, game the system, or engage in patient selection, potentially worsening the quality of care (Dranove and Jin 2010). The second channel is that endorsement could enhance doctors’ intrinsic incentives (Fracchia, Molina-Millán, and Vicente 2023; Kolstad 2013; O’Flaherty, Sanders, and Whillans 2021), potentially motivating them to improve service quality and assist more free patients. The last consideration is doctors’ capacity constraints (Ching, Hayashi, and Wang 2015), which could introduce a trade-off between quality and quantity (Grieco and McDevitt 2017) as well as between different patient groups (e.g., free vs. paid) (Yoon 2020). The interplay of these channels makes predicting the impact of endorsement on doctors’ decisions inherently ambiguous. Therefore, a comprehensive empirical analysis is necessary to evaluate whether platform endorsement benefits patients overall and how these benefits (or costs) are distributed across different patient groups.
In this article, we empirically examine the impact of platform endorsement on patient demand; doctors’ decisions regarding pricing, quantity, and quality of care; and the allocation of effort between paid and free services, using a unique dataset from a leading online doctor consultation platform in China. The platform's institutional features provide an excellent setting to study the impact of platform endorsement. Since 2013, the platform has endorsed a highly select set of doctors annually based on a proprietary algorithm, awarding them a badge displayed alongside their profile picture. We exploit one of the endorsement events as a quasi-experiment to estimate its causal impact. The platform allows individual doctors to independently decide on pricing, quantity, and quality, including the voluntary provision of free services. This unique setup, rarely observable in other health care settings, enables us to analyze the wide spectrum of behavioral adjustments that doctors can make.
We use a panel dataset of a sample of over 2,000 doctors from 2018–2019. This sample represents “top doctors” who had a reasonable likelihood of being endorsed across 28 medical departments. Our dataset includes proprietary platform data that capture doctors’ decisions on pricing, quantity, and certain dimensions of quality. Importantly, we combine this proprietary data with third-party scraped data that record detailed consultation message exchanges between patients and doctors, offering more comprehensive quality measures. Within this sample, we identify doctors who were endorsed at the beginning of 2019 as the treatment group while doctors who were not yet endorsed serve as the control group. In the analysis, we use the generalized synthetic control (GSC) method to construct a synthetic control group to impute counterfactual outcomes for endorsed doctors. This method allows us to estimate the treatment effects by comparing observed outcomes of endorsed doctors against these counterfactuals. We validate the required assumptions for this method—including parallel trends, no anticipation, and the stable unit treatment value assumption (SUTVA)—through both institutional details and empirical tests.
We begin our analysis by examining the impact of platform endorsement on the price and quantity of both paid and free services provided by newly endorsed doctors. We find that endorsement has a significantly large impact, leading to an 8.7% higher price and a 19.7% higher quantity of paid services among newly endorsed doctors. However, the increase in paid service provision is accompanied by a 35.2% reduction in free service provision on average, as endorsed doctors reallocate efforts from free to paid services. When the changes in paid and free service quantities are combined, platform endorsement leads to a 5.7% increase in total service provision provided by newly endorsed doctors. These findings suggest that endorsement acts as a positive quality signal, which boosts paid patient demand for newly endorsed doctors. This enables paid service price premiums and increases paid service provision. However, the shift from free to paid service provision disproportionately affects underprivileged patients who rely on free services provided by high-quality doctors.
Next, we examine the impact of platform endorsement on service quality provided by newly endorsed doctors. Leveraging data on patient reviews, detailed message exchanges in messaging consultations, and waiting time and duration for phone call consultations, we construct 11 quality measures specific to the online consultation context, covering aspects such as message volume, informational support, emotional support, and patient gratitude. Across these 11 measures, we find consistent evidence that, despite the increase of services provided, newly endorsed doctors maintain or even improve their service quality postendorsement. This finding is crucial because it shows that platform endorsement incentivizes leading doctors to provide more services without compromising their service quality. We also examine the impact of reendorsement and find that while the quality signal effect of reendorsement is modest, reendorsed doctors maintain or slightly enhance their service quality, suggesting endorsement's role in driving quality improvement through enhanced intrinsic motivation.
Aggregating the results from individual doctors, we discuss the overall impact of endorsement at the platform level. For each endorsed doctor, the increase in price and quantity of paid services generates an additional average annual revenue of $6,971, which is approximately half the average annual salary of a doctor in China. At the platform level, this translates to an additional 44,000 paid services and a significant additional $1.1 million in annual revenue. However, this financial benefit comes at the cost of a substantial decrease in the provision of free services. Our estimates suggest that the shift from free to paid services among endorsed doctors has resulted in 27,000 fewer free consultations annually for underprivileged patients, which is a 3.8% decrease at the platform level. Although the platform's total service volume increased, this decline in free services could hurt the platform's reputation, as free health care provision plays a critical role in enhancing the platform's corporate social responsibility (CSR) image and brand equity. 2 Finally, the observation that endorsed doctors either maintain or improve the quality of care, while unendorsed doctors make no significant quality changes, suggests that platform endorsement has a neutral or positive impact on quality at the platform level. Expanding the currently small-scale endorsement program could further amplify its effects on patients, doctors, and the platform.
Since the reduction of free services is a concern for both the platform and society, we further explore the heterogeneous effects of endorsement across doctors, focusing on those with different levels of prosocial behavior before being endorsed. We categorize doctors into two groups: “high-prosocial doctors” and “low-prosocial doctors,” defined by their provision of free services relative to the median during the pretreatment period. Interestingly, we find that the reduction in free services postendorsement is primarily driven by high-prosocial doctors. After being endorsed, these high-prosocial doctors tend to avoid significant price increases and focus on improving quality. The quality signals triggered by platform endorsement, combined with relatively stable prices, lead to a surge in paid patient demand. To meet the increased demand for paid services, these doctors reduce their voluntary free service provision due to capacity constraints. In contrast, low-prosocial doctors tend to respond to endorsement by significantly raising prices while keeping other margins—such as the quantity of paid and free services and quality of care—unchanged. These findings suggest that both intrinsic motivation and capacity constraints are important considerations in evaluating the impact of endorsement.
Our study offers valuable and timely insights for health care platforms and beyond. For platform managers, our findings demonstrate the benefits of endorsement programs as a type of information disclosure. Endorsement serves as a strong quality signal to patients, increases doctor engagement, and enhances platform revenue. However, our findings caution that endorsement may shift doctors’ efforts from free to paid services, harming underprivileged patients. Refining the program to better maintain or incentivize doctors’ prosocial commitments could improve health care equity. Beyond health care, our study offers valuable insights for mixed-model platforms that allow for both free and paid services or content. While these platforms are growing in popularity and increasingly adopting information disclosure tools, prior research has primarily focused on their impact in either paid-only or free-only settings. This is particularly relevant for platforms in legal consultation, education, and content sharing. Our findings, showing that endorsement results in a crowding-out effect of paid services on free services, underscore the importance of evaluating how such tools impact the balance between paid and free offerings, different user groups, and platform growth.
The rest of the article is organized as follows: We first discuss how our research contributes to the existing literature, then describe the institutional setting and data. Next, we present the empirical strategy, main findings, and robustness checks. We then examine the platform-level impact and the heterogeneous effects of endorsement between high- and low-prosocial doctors. Finally, we summarize key findings, discuss implications, and acknowledge study limitations.
Related Literature
This research contributes to four streams of literature. First, this article is closely related to the extensive literature on how consumers respond to different types of disclosed information, particularly in health care, where information asymmetry is pronounced due to its nature as a credence good. Common disclosures in health care include provider metrics such as mortality and readmission rates (Avdic et al. 2019; Cutler, Huckman, and Landrum 2004), patient health outcomes (Gutacker et al. 2016), satisfaction rates (Avdic et al. 2019), drug efficacy (Ching et al. 2016), and composite quality indices such as report cards and ranking lists (Dafny and Dranove 2008; Jin and Sorensen 2006; Pope 2009; Santos, Gravelle, and Propper 2017), all of which drive demand responses. More recently, patient-generated ratings and reviews have gained prominence, with higher ratings attracting more patients (Bensnes and Huitfeldt 2021; Brown et al. 2025; Chartock 2023; Chen and Lee 2024; Xu, Armony, and Ghose 2021), resonating with findings from experience good markets (Chevalier and Mayzlin 2006; Anderson and Magruder 2012). This article contributes to this literature in two ways. First, it examines how information disclosure influences patient decisions in an online setting, unlike most prior studies that focus on offline contexts. In online settings, patients face a significantly expanded choice set, leading to greater decision difficulty (Natan 2025). Second, it examines a new type of information disclosure in health care: platform endorsement. The endorsement, awarded by platforms using proprietary algorithms and data, differs from provider- or patient-generated information by aggregating multiple data sources. The binary design of the endorsement may result in different market responses compared with traditional continuous measures such as ratings and reviews (Vatter 2025).
Second, our study also speaks to the literature on the other side of the market: the supply-side response to information disclosure. With the well-documented demand effect from information disclosure, returns to quality are expected to rise, incentivizing providers to improve quality. This theoretical reasoning drives policymakers and platform managers to leverage such tools to promote competition along quality. However, quality improvement is not guaranteed because it depends on how information is disclosed. If the disclosed information is comprehensive and diagnostic (i.e., it significantly enhances patient demand and provides strong incentives for doctors), service quality is likely to improve. However, if the disclosure is incomplete or quality metrics are imperfect, doctors may reallocate their efforts strategically, manipulate reported outcomes, or selectively treat patients, potentially leading to worsened quality (Dranove and Jin 2010; Vatter 2025). Existing empirical evidence on whether providers improve quality in response to disclosure also remains mixed. On the one hand, some studies have documented quality improvement by providers in response to disclosure (Bennear and Olmstead 2008; Jin and Leslie 2003). On the other hand, information disclosure in health care may lead to effort reallocation, which could negatively affect disadvantaged patients (Dranove et al. 2003; Lu 2012; Werner and Asch 2005). Our study extends this literature by examining the impact of information disclosure on providers’ multidimensional decisions—price, quantity, and quality—including the provision of free services, an often-overlooked aspect of doctors’ behavior. 3 This focus distinguishes our work from most existing studies, which typically concentrate on the quality aspect only. Our study paints a more comprehensive picture of the impact of information disclosure across a wider spectrum of doctors’ decisions.
Third, our research contributes to the literature on health care providers’ responses to information disclosure explicitly considering intrinsic motivation and capacity constraints—two important and salient features of the health care domain. Previous studies suggest that, in addition to monetary payoffs, health care providers’ behavior is influenced by intrinsic motivation to benefit patients. Information disclosure enhances this motivation by encouraging providers to meet high public expectations (Fracchia, Molina-Millán, and Vicente 2023; O’Flaherty, Sanders, and Whillans 2021) and by providing providers with a better sense of their own performance compared with peers (Kolstad 2013). At the same time, providers’ reactions to information disclosure are affected by capacity constraints (Ching, Hayashi, and Wang 2015), potentially leading to congestion among high-quality providers. This congestion has been shown to increase waiting time (Chartock 2023) and reduce effort for urgent patients (Yoon 2020). In addition to quantity reallocation, capacity constraints could further introduce a trade-off between quality and quantity (Grieco and McDevitt 2017). Our study makes a novel contribution by being the first to investigate the net impact of information disclosure on health care providers’ behavior when both intrinsic motivation and capacity constraints are present, whereas prior studies have typically considered these two factors in isolation. We provide evidence of intrinsic motivation, as high-prosocial endorsed doctors enhance the quality of their paid services without raising prices. At the same time, we demonstrate that when both intrinsic motivation and capacity constraints are present, information disclosure leads these doctors to increase their paid services, thereby crowding out their free service provision and hurting disadvantaged patients. Our study underscores the importance of considering both intrinsic motivation and capacity constraints in designing more effective information disclosure tools, with significant implications for health care access and equity.
Lastly, our study relates to the literature on the market outcomes of platform endorsement, or similar tools such as platform certification and awards, which have become increasingly popular in digital platforms. Previous research has predominantly focused on two scenarios: free-only service settings or paid-only service settings. In free-only settings, tools similar to platform endorsement have been shown to incentivize voluntary editors to stay on Wikipedia (Gallus 2017), boost engagement on user-generated content platforms like Reddit (Burtch et al. 2022), and increase content creation on image-sharing platforms (Huang, Kaul, and Narayanan 2022; Huang and Narayanan 2021). Conversely, in paid-only settings, endorsement-like tools have been shown to consistently increase paid service offerings in various domains like eBay (Elfenbein, Fisman, and McManus 2015; Hui et al. 2016), Airbnb (Dewan, Kim, and Nian 2023), and online freelancing (Bairathi, Zhang, and Lambrecht 2025). Our study contributes to this literature by being the first to investigate the impact of endorsement in a setting where both free and paid services coexist. As more platforms across various domains, including legal services, online learning, and content-sharing, adopt this mixed free-paid environment, our study underscores the importance of considering the substitution between free and paid services as a result of platform endorsement and its heterogeneous consequences for various user groups.
Institutional Setting
The online health care sector in China has experienced rapid growth over the past decade. Online doctor consultations constitute a significant component in this sector, generating around 1.4 billion USD in revenue in 2024 (Statista 2025). Prior to the onset of the COVID-19 pandemic, these consultations were primarily provided by third-party platforms (Cheng et al. 2022). These platforms serve patients across the country, providing them with the convenience of consulting doctors remotely. By the end of 2023, the number of active users seeking such consultations reached 414 million (CAICT 2024). The limited accessibility and lengthy waiting times in public hospitals have driven patients toward online doctor consultations.
We focus on one of the leading third-party online doctor consultation platforms in China, Haodf (www.haodf.com), which translates to “Good Doctor” in English. Established in 2006, the platform has attracted nearly 280,000 licensed doctors to register by 2024, accounting for over 10% of all licensed doctors employed by hospitals in the country. Haodf stands out among other online doctor consultation platforms in China due to the exceptional quality of its registered doctors, with approximately 73% of these doctors being affiliated with top-tier public hospitals. These doctors are highly skilled, experienced, and often leading figures in their respective fields by contributing to medical research and staying at the forefront of the health care industry. The platform offers a wide range of medical specialties, spanning 28 departments (see Web Appendix Figure W1 for the list of departments and service volume distribution across departments). By 2024, the platform had served a cumulative of 89 million patients, facilitating approximately 50 million doctor consultations in 2023 alone (China Economic Net 2024). Notably, the platform provided a daily average of 10,000 free online consultations to underprivileged patients during the COVID-19 pandemic period (China Daily 2020).
Consultation Process
To register on the platform, doctors must hold two qualifications necessary for legal medical practice in China: the Medical Practitioner's License and the Doctor's Qualification Certificate. Additionally, they must maintain a full-time affiliation with a hospital. As a result, online consultations are typically conducted outside regular working hours (see Web Appendix Figure W2). On the patient side, registration requires a cell phone number for verification purposes. Patients use the platform for various reasons, such as promptly consulting on minor health issues and seeking second opinions.
Once registered, both patients and doctors can engage through two primary service types: paid and free. In paid services, patients select their preferred doctor and consultation format, with 95% of requests accepted by doctors within 12 hours. Free services, however, involve patients submitting their requests without the option to select a doctor. Since demand for free services far exceeds supply, over one-third of free service requests remain unanswered for more than seven days. The significant uncertainty about whether, when, and by whom these requests will be answered makes free services predominantly used by underprivileged patients, a pattern confirmed in our discussions with the platform director and doctors. For doctors, paid services provide financial compensation, while free services, despite the lack of monetary rewards, hold intrinsic value for doctors committed to providing health care services to the underprivileged.
To initiate a consultation, patients must submit a detailed form with medical information such as age, gender, medical history, symptoms, and any specific questions for the doctor. Once the request is submitted, the patient waits for a doctor to accept the consultation. Following the consultation, patients can leave reviews for the doctor. During the sample period, health insurance providers did not offer reimbursements for online consultations, making patients responsible for all costs.
Paid services are available in two formats: messaging and phone call consultations. Messaging consultations allow patients to exchange medical information, such as scan results and test reports, via text and images on the platform's app portals. There are two messaging packages: package 1 offers a 48-hour exchange period with unlimited messaging, while package 2 limits the number of messages that the patient can send. Phone call consultations enable live discussions between patients and doctors, typically lasting around eight minutes, and are conducted through the app. In both formats, doctors can set and adjust their service prices, with the platform deducting a fixed percentage of revenue. Free services are offered only through messaging, with limits on the number of messages patients can send.
The Endorsement Program
To assist patients in their search for an appropriate doctor, the platform provides detailed information on each doctor. The search result page displays key details such as a doctor's name, medical and academic positions, affiliated hospital, department, average rating, specialty, and price. For more comprehensive information, patients can click into a doctor's profile page, which showcases additional details like service type, education level, patients’ reviews, and the number of consultations conducted.
Despite providing detailed information, the platform acknowledges that many patients still face challenges in making decisions, especially when many doctors possess similar attributes. For example, online ratings are not very informative, with over 97% of ratings being positive across all doctors in our sample. To facilitate the decision-making process for patients and to encourage leading doctors to continuously improve their practices and engage with the platform, the platform introduced the “Good Doctor of the Year” endorsement program in 2013. This program uses extensive data sourced from both patients and doctors to calculate an aggregate metric. The platform then, based on this metric, awards a select group of doctors at the beginning of a year with a badge that is prominently displayed on the platform. While the specific selection algorithm remains proprietary, factors considered include service volume, waiting time, and patients’ reviews from the previous year. The platform allocates a fixed quota of endorsements for each of the 28 departments, ranging from 3 to 20, roughly proportionate to the total number of registered doctors for each department. This endorsement program is highly selective, with less than .3% of doctors ever receiving an endorsement badge. Importantly, the endorsement status does not directly enter the platform's ranking algorithm, which uses different criteria and updates frequently based on short-term factors. In contrast, endorsements are awarded annually and emphasize long-term performance. However, an endorsement may impact the service volume a doctor provides, which could, in turn, indirectly affect the doctor's ranking. Therefore, in our analysis, we quantify the overall impact of platform endorsement, implicitly accounting for its indirect effects through ranking.
Once a doctor receives the endorsement, the platform attaches a badge to the doctor's profile picture, which appears on both the search result page and the doctor's profile page. However, patients cannot filter search results specifically based on whether doctors have received endorsements. This badge reflects the total number of “Good Doctor of the Year” endorsements a doctor has received and, once awarded, remains permanently on the doctor's profile. Figure 1, Panel A, illustrates a new endorsement scenario, where a doctor goes from having no endorsement to receiving the first one. Panel B shows a reendorsement scenario, where a doctor's number of endorsements increases from one to two. Since the change from having no badge to receiving one is more noticeable to patients, we begin by analyzing this group of doctors. We examine the impact of reendorsement subsequently.
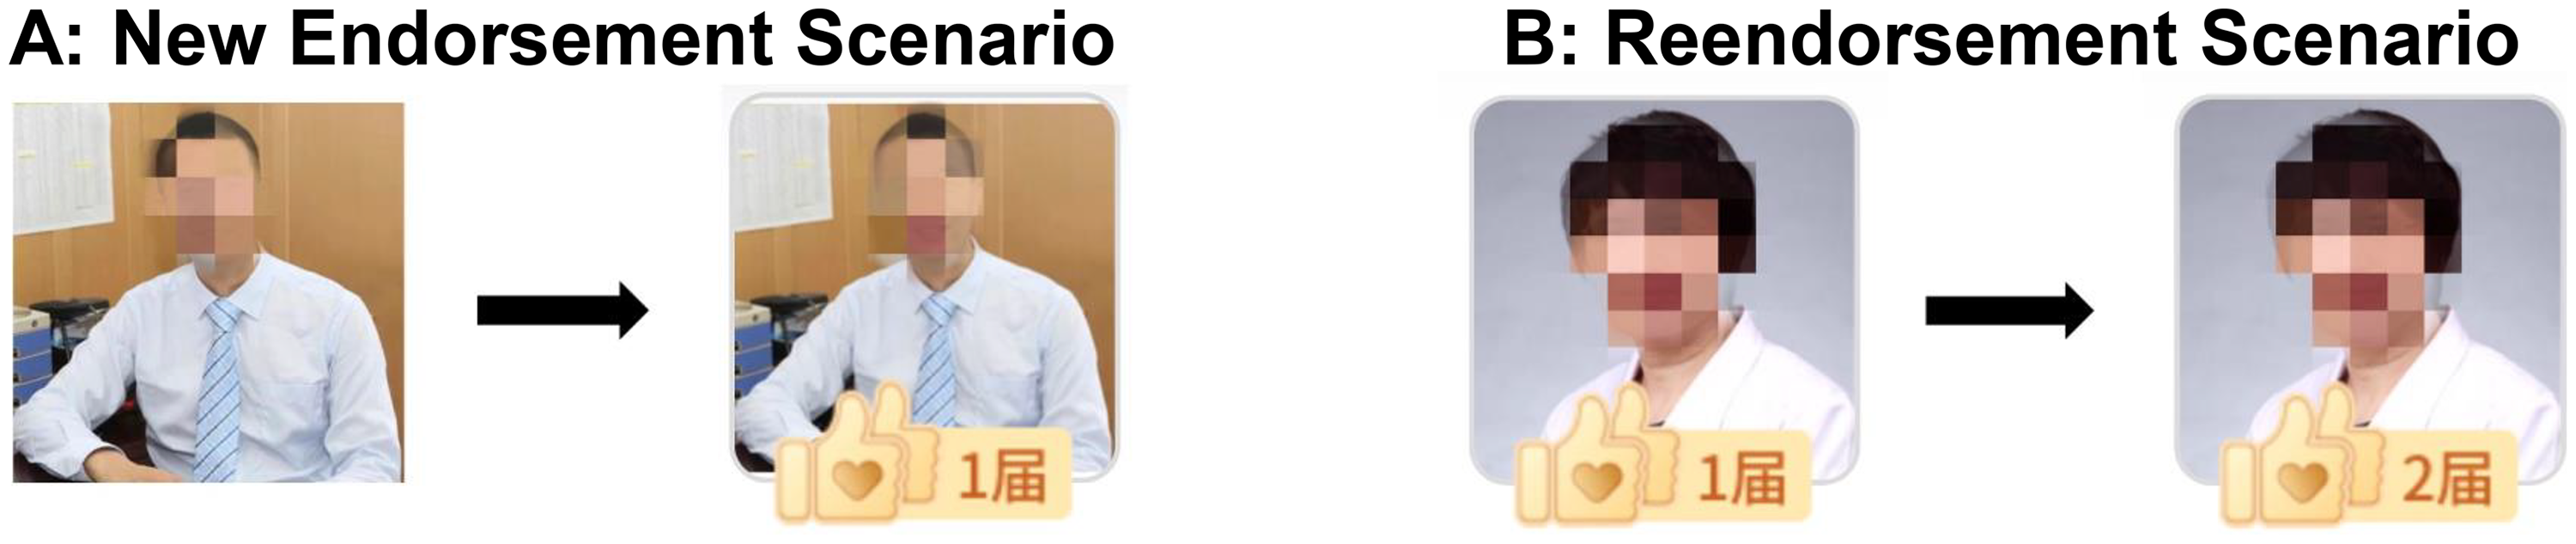
Endorsement Badge.
Data
To study the impact of platform endorsement, we obtain proprietary data from the platform and supplement it with additional data scraped by a third-party data provider. The combined data cover a wide range of outcomes, including price, service type, service quantity, and service quality. We provide details on each type of data in detail next.
Proprietary Data
We use proprietary data from the platform covering the period from January 1, 2018, to December 31, 2019. The main focus is the “Good Doctor of 2018” endorsement, which was based on doctors’ performances in 2018 and announced at the beginning of the second week of 2019. The endorsement targeted the top doctors in each department, with the number of recipients per department ranging from 3 to 20. For our study, the platform provided a sample of the top 100 doctors in each of the 28 departments, chosen based on the same proprietary algorithm used for endorsement. This sample selection process ensures that every doctor in our sample was a leading figure in their respective department and had a reasonable chance of being endorsed. After excluding doctors with invalid IDs, our sample size is 2,752. Of these, 377 doctors were endorsed with the “Good Doctor of 2018” badge at the start of 2019. Among them, 156 were first-time recipients, forming the main treatment group, and 221 were reendorsed, forming the treatment group for later reendorsement analysis. The 2,073 doctors who had not received any endorsement by 2019 serve as the control group. The two-year sample period includes 53 weeks of pretreatment and 51 weeks of posttreatment data.
The first set of information in the proprietary data is related to doctor characteristics. In our main sample, the doctors’ average age is 45.3 years, 71% are male, 50% hold a Ph.D. degree, 98% are affiliated with tertiary hospitals, and 38% hold chief doctor titles while the remainder hold associate chief doctor titles. On average, they have been providing services on the platform for six years. Additional details on minimums, maximums, and standard deviations for doctor characteristics are presented in Web Appendix Table W1.
The second set of information is related to services, recorded at the consultation level. The data allow us to observe whether a patient request was accepted by the selected doctor. For accepted consultations, detailed information is available, including service type (paid vs. free, messaging vs. phone call), service price, purchase time, and patient demographics (age, gender, and city of residence). We also have data on the consultation start time. For messaging consultations, the start time matches the purchase time, as these begin immediately upon confirmation. For phone call consultations, a separate start time is recorded, allowing us to calculate waiting time as the interval between purchase and start time. After each consultation, patients can opt to leave a review, choosing a positive or negative rating and providing review text. We capture both the ratings and review text for each doctor in our sample throughout the study period.
Supplemental Data
In addition to the proprietary data, we also gather additional data scraped from the platform by a third party. A distinctive feature of this platform is that it displays all previous messages exchanged (excluding any personal or sensitive information) between patients and doctors in the messaging consultations on each doctor's profile page. The platform discloses this information for several purposes, including providing patients with similar symptoms with insights from past advice given by doctors, enabling patients to assess a doctor's consultation style and quality, and serving as a monitoring tool for doctors’ interactions.
A screenshot illustrating how these consultation records are displayed on the platform app is provided in Web Appendix Figure W3. Based on these data, we observe full consultation threads from messaging consultations conducted by doctors in our sample throughout the study period, including transcribed voice messages when present. For our main sample, we observe around 1 million messaging consultation records. On average, each doctor has about 470 messaging consultation records in our data.
This dataset directly records the consultation process between doctors and patients, providing a unique opportunity to develop quality measures tailored specifically to online consultations. These measures are described in detail next.
Summary Statistics
In our sample, services offered by doctors can be categorized into free or paid. Free services constitute 18.6% of the total while paid services make up the remaining 81.4%. Within the paid services, there is further subdivision: 63.7% are for messaging consultation package 1 with a 48-hour limit, 13.1% are for messaging consultation package 2 with a limit on the number of messages, and the remaining 23.2% are for phone call consultations. We aggregate the data into a doctor-week panel. Our main analysis includes the newly endorsed and control doctors. Table 1 reports the descriptive statistics.
Descriptive Statistics.
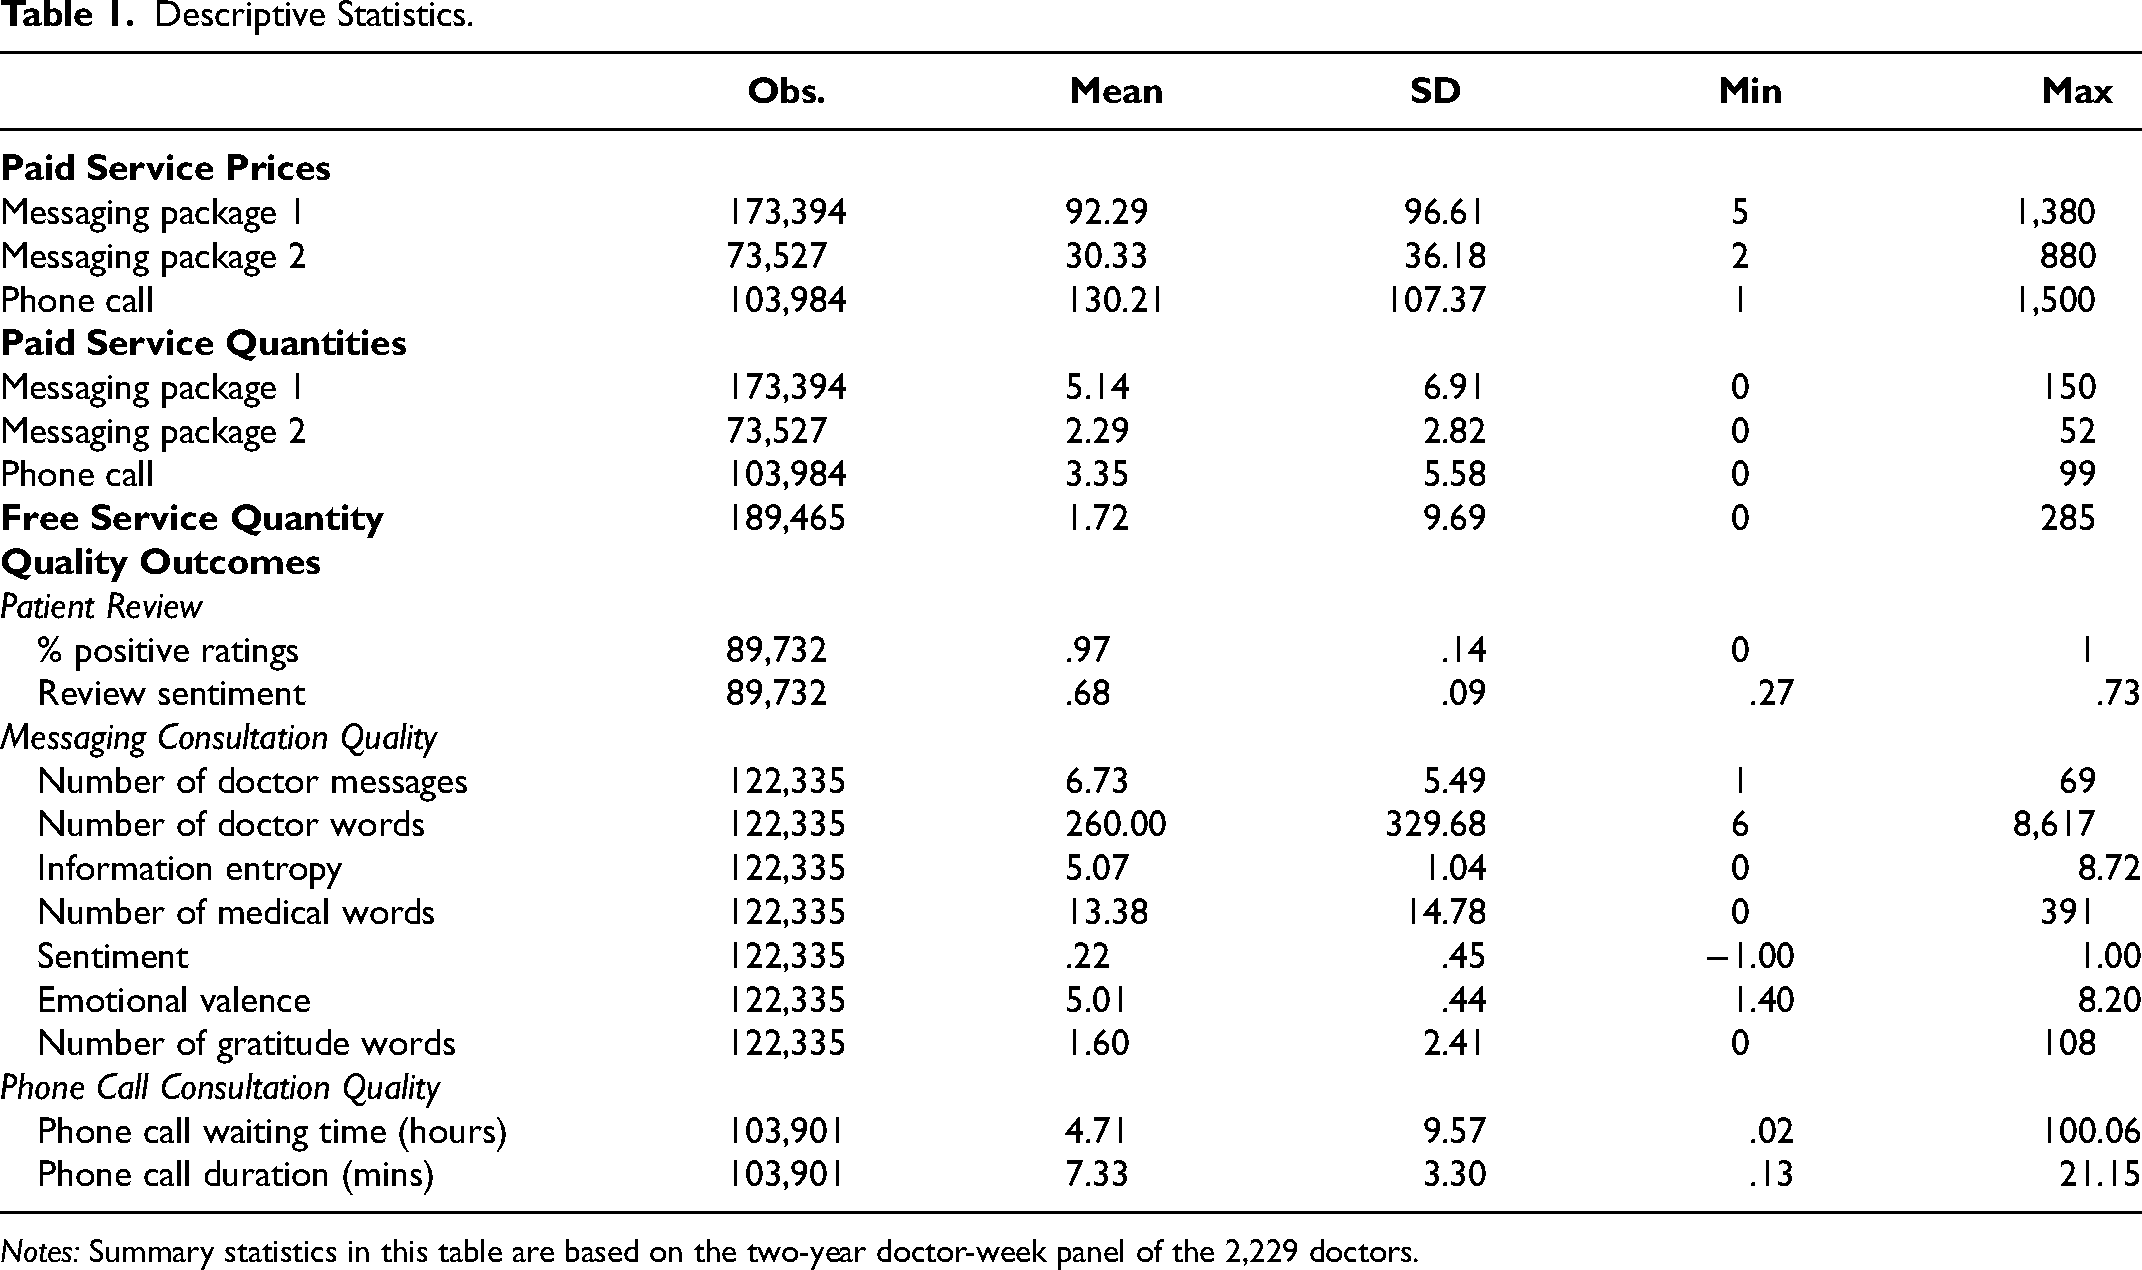
Notes: Summary statistics in this table are based on the two-year doctor-week panel of the 2,229 doctors.
We start by reporting prices for three different types of paid services. For messaging package 1, the average price is about 92.29 yuan. For messaging package 2, the average price is about 30.33 yuan. Notably, phone call consultations command a higher average price of around 130.21 yuan. Regarding the number of consultations, doctors provide 5.14 messaging package 1 consultations, 2.29 messaging package 2 consultations, 3.35 phone call consultations, and 1.72 free consultations per week, on average.
We construct 11 quality measures to capture the service quality of doctor consultations, grouped into three categories: patient reviews (2 measures), messaging consultations (7 measures), and phone call consultations (2 measures).
For patient reviews, we calculate each doctor's weekly average percentage of positive ratings (binary positive/negative) and the average sentiment score of written reviews, ranging from −1 (most negative) to 1 (most positive). On average, 97% of patient ratings are positive and the sentiment score is .68.
For messaging consultations, we build on prior work in online health care communication to capture three key dimensions of doctor–patient interactions (Li and Qin 2025; Yan and Tan 2014; Zhang and Zhang 2025; Zhang et al. 2025): (1) the quantity of doctor messages, (2) the informational and emotional content of doctor messages, and (3) patients’ in-consultation expressions of gratitude.
Quantity provides a baseline measure of how actively a doctor devotes to a consultation. We measure it using the number of messages sent and the total word count per consultation.
Informational support reflects the degree to which doctors provide factual, diagnostic, and treatment-related information that helps patients understand and manage their conditions. It captures the cognitive and substantive dimension of communication. We measure it using (1) information entropy and (2) the number of medical terms used. Specifically, information entropy, calculated using Shannon's formula, gauges the diversity of word use within messages. Higher entropy indicates a more varied vocabulary and broader informational coverage, whereas lower entropy reflects more repetitive or narrowly focused communication. A high-entropy consultation may address multiple symptoms, diagnoses, and treatment options, whereas a low-entropy consultation may repeatedly emphasize a single issue. Higher entropy may therefore signal greater effort from the doctor. Detailed examples are provided in Web Appendix B.
Emotional support captures the affective quality of doctor communication—the extent to which doctors express empathy, reassurance, encouragement, and understanding. We measure it using (1) message sentiment and (2) emotional valence. Sentiment ranges from −1 (most negative) to 1 (most positive), reflecting the overall tone of messages. Emotional valence captures the intensity and frequency of emotionally charged words, ranging from 1 (highly negative) to 9 (highly positive), with 5 representing a neutral tone. Together, these indicators reflect how doctors combine warmth and empathy with informational delivery to foster a supportive interaction.
Patient gratitude captures real-time expressions of appreciation. We measure it by counting gratitude-related words used by patients during consultations, providing a behavioral signal of perceived care quality. A detailed description of variable construction is provided in Web Appendix B.
On average, doctors send 6.73 messages per consultation, comprising 260 words in total, of which 13.38 are medical terms; messages exhibit an average information entropy of 5.07, an average sentiment of .22, and an average emotional valence of 5.01. Patients, in turn, express an average of 1.6 gratitude-related words per consultation.
For phone call consultations, we measure waiting time—the interval between booking and the start of the call—and call duration. A longer waiting time indicates slower service, whereas a longer call duration reflects greater doctor engagement and effort. On average, phone consultations involve a 4.71-hour waiting time and last 7.33 minutes.
Note that our doctor-week panel is unbalanced with varying numbers of observations across variables. This is because, for a given type of paid consultation, there were weeks when a doctor did not provide any services. This could be due to either a lack of patient demand for the doctor or the doctor's unavailability. Since it is unclear whether missing observations result from a lack of demand or supply, we retain them as missing to minimize measurement errors. However, if a patient requests a paid service and the doctor declines, the consultation count in Table 1 is recorded as zero. To assess the potential impact of missing values, we examine whether they systematically differ between the treated and control groups in the pretreatment and posttreatment periods. Our regression analysis, presented in Web Appendix Table W7, finds no statistically significant differences, suggesting that missing value patterns are comparable between the two groups and unlikely to affect our main results.
Empirical Strategy
Econometric Model
We aim to estimate the causal effects of platform endorsement on patient demand and doctors’ behaviors for endorsed doctors. Simply comparing the outcomes of endorsed doctors before and after endorsement may suffer from confounding time trends. Thus, we use data from the control group and employ a synthetic control approach (Abadie 2021; Abadie, Diamond, and Hainmueller 2010, 2015). Specifically, we employ the GSC method proposed by Xu (2017).
The central idea behind synthetic control methods is to use nontreated units to establish a comparable “synthetic control” unit for each treated unit. The synthetic control unit is constructed by using a weighted combination of the nontreated units, where the weights are selected such that they produce a synthetic control that closely mirrors the pretreatment trend of the outcome variable for the treated unit. Once the synthetic control is established, its posttreatment trajectory serves as the counterfactual prediction for the treated unit, providing a more accurate comparison compared with the original control. Because of its ability to alleviate the concern of unobserved confounders, the synthetic control method has been widely applied in recent marketing research (e.g., Levine and Seiler 2023; Lovett, Peres, and Xu 2019; Pattabhiramaiah, Sriram, and Manchanda 2019; Puranam, Kadiyali, and Narayan 2021; Zhang et al. 2025). Building on the standard synthetic control method, the GSC method provides a generalized version by allowing the number of treated units to be more than one, which can accommodate multiple treated units in our context.
With the GSC method, we use the following specification with interactive fixed effects (Bai 2009):
Based on this approach, the average treatment effect on the treated (ATT) in week t in the posttreatment period, 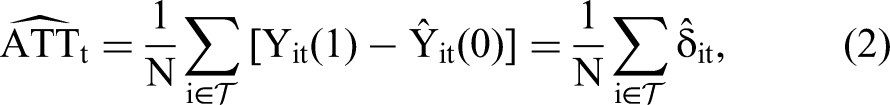
Identifying Assumptions
The validity of the GSC estimator relies on three key assumptions: parallel trends, no anticipation, and the SUTVA. We discuss each of these assumptions next.
The parallel trends assumption posits that the treated and synthetic control groups would have exhibited parallel trends in the absence of treatment, meaning that no unobserved confounders would cause different trends between the two groups. To assess whether the GSC approach strengthens parallel trends, we compare all outcome variables between the treated and (synthetic) control groups during the pretreatment period. Summary statistics and data patterns for the treated versus original control groups are presented in Web Appendix Table W4 and the left column of Figure W4, while comparisons between the treated and synthetic control groups are shown in Web Appendix Table W5 and the right column of Figure W4. The results show that the synthetic control group closely tracks the treated group's trends in the pretreatment period, suggesting that the synthetic control group is a valid counterfactual.
The second assumption, no anticipation, suggests that individuals in the treated and control groups do not change their behaviors differently in response to a treatment before it occurs. This assumption could be a concern, for example, if the treated group raised their prices or changed their free service provision in anticipation of being more likely to receive endorsement before the endorsement announcement. However, such scenarios are unlikely because the selection criteria are not disclosed to the doctors, leaving them uncertain about whether they will be endorsed. Furthermore, as we explain in detail in Web Appendix E, there is no evidence that doctors have accumulated implicit knowledge of the endorsement selection criteria over time and attempted to game the system. Lastly, pretreatment trends between the two groups, as shown in the left column of Web Appendix Figure W4, indicate no differential behavior across 14 outcome variables prior to the intervention, suggesting no clear violation of this assumption.
The third assumption, SUTVA, implies no spillover of platform endorsement onto the control group (i.e., unendorsed doctors). We address this assumption through institutional and model-free evidence. We discuss free and paid services in turn. For free services, this assumption could be violated if endorsement leads endorsed doctors to reduce free services, which are then provided by unendorsed doctors. However, this is unlikely because patient requests are pooled across all doctors, and the demand for free services significantly exceeds supply by an order of magnitude. Thus, whether endorsed doctors provide more or fewer free services should not substantially affect the availability of free services that could be provided by unendorsed doctors. This is supported by the model-free evidence that there is no increase in the number of free services provided by unendorsed doctors after the treatment (see Web Appendix Figure W5). For paid services, SUTVA could be violated if endorsement shifts demand from unendorsed to endorsed doctors. To address this, we plot the number of paid services provided by unendorsed doctors before and after treatment. Web Appendix Figure W6 shows a stable trend during the sample period, indicating no evidence of spillover. In addition to the institutional and model-free evidence, we further conduct two regression analyses related to this assumption, which we detail in the “Robustness” section.
Main Effects
In this section, we examine the impact of platform endorsement on endorsed doctors across key market outcomes. We begin by analyzing the impact of endorsement on paid service price and quantity, followed by showing its impact on free service provision. Next, we evaluate its impact on service quality across 11 dimensions. Additionally, we perform several robustness checks to validate our findings.
Impact on Paid Service Price and Quantity
We begin by analyzing the impact of platform endorsement on the price and quantity of paid services provided by endorsed doctors. In theory, if platform endorsement effectively signals quality to patients, it shifts the demand curve outward. This outward shift increases the equilibrium quantity as well as the equilibrium price. The magnitude of these increases depends on the slope of the supply curve, which is an empirical question. To test this, we use the regression framework outlined in Equation 1, analyzing data at the doctor-service-week level. We include week fixed effects and doctor-service fixed effects to account for temporal shocks and time-invariant differences at the doctor-service level.
Figure 2 presents the estimated average treatment effects on logged prices (left) and logged quantity (right) among endorsed doctors for each week. Because these effects are estimated at the week level, there are 104 weekly point estimates, represented by black dots. The gray area around these dots indicates the corresponding bootstrapped confidence interval. The dashed vertical line marks the start of the treatment. Pretreatment estimates hovering around zero indicate a good match between synthetic control doctors and endorsed doctors, suggesting that the GSC method has adequately accounted for both observed and unobserved attributes to ensure parallel trends. We find that platform endorsement leads to an immediate increase in paid service quantity for endorsed doctors. This increase is driven by both higher patient requests and higher doctors’ acceptance rates (see Web Appendix Figure W8). In response, endorsed doctors gradually raised their prices during the first six months following endorsement, with prices stabilizing in the subsequent six months. Over the entire posttreatment period, platform endorsement results in a significant 19.7% (SE = 7.3%, p = .007) increase in paid service quantity and an 8.7% (SE = 4.4%, p = .047) increase in paid service price. This corresponds to a price increase from 102 to 111 yuan and a rise in the average number of paid consultations per week for an endorsed doctor from 27.2 to 32.6. Importantly, the price increase is not simply due to a shift toward providing more consultations in higher-priced tiers; rather, it is driven mainly by price increases within tiers, particularly for phone call consultations (see Web Appendix Figure W9).
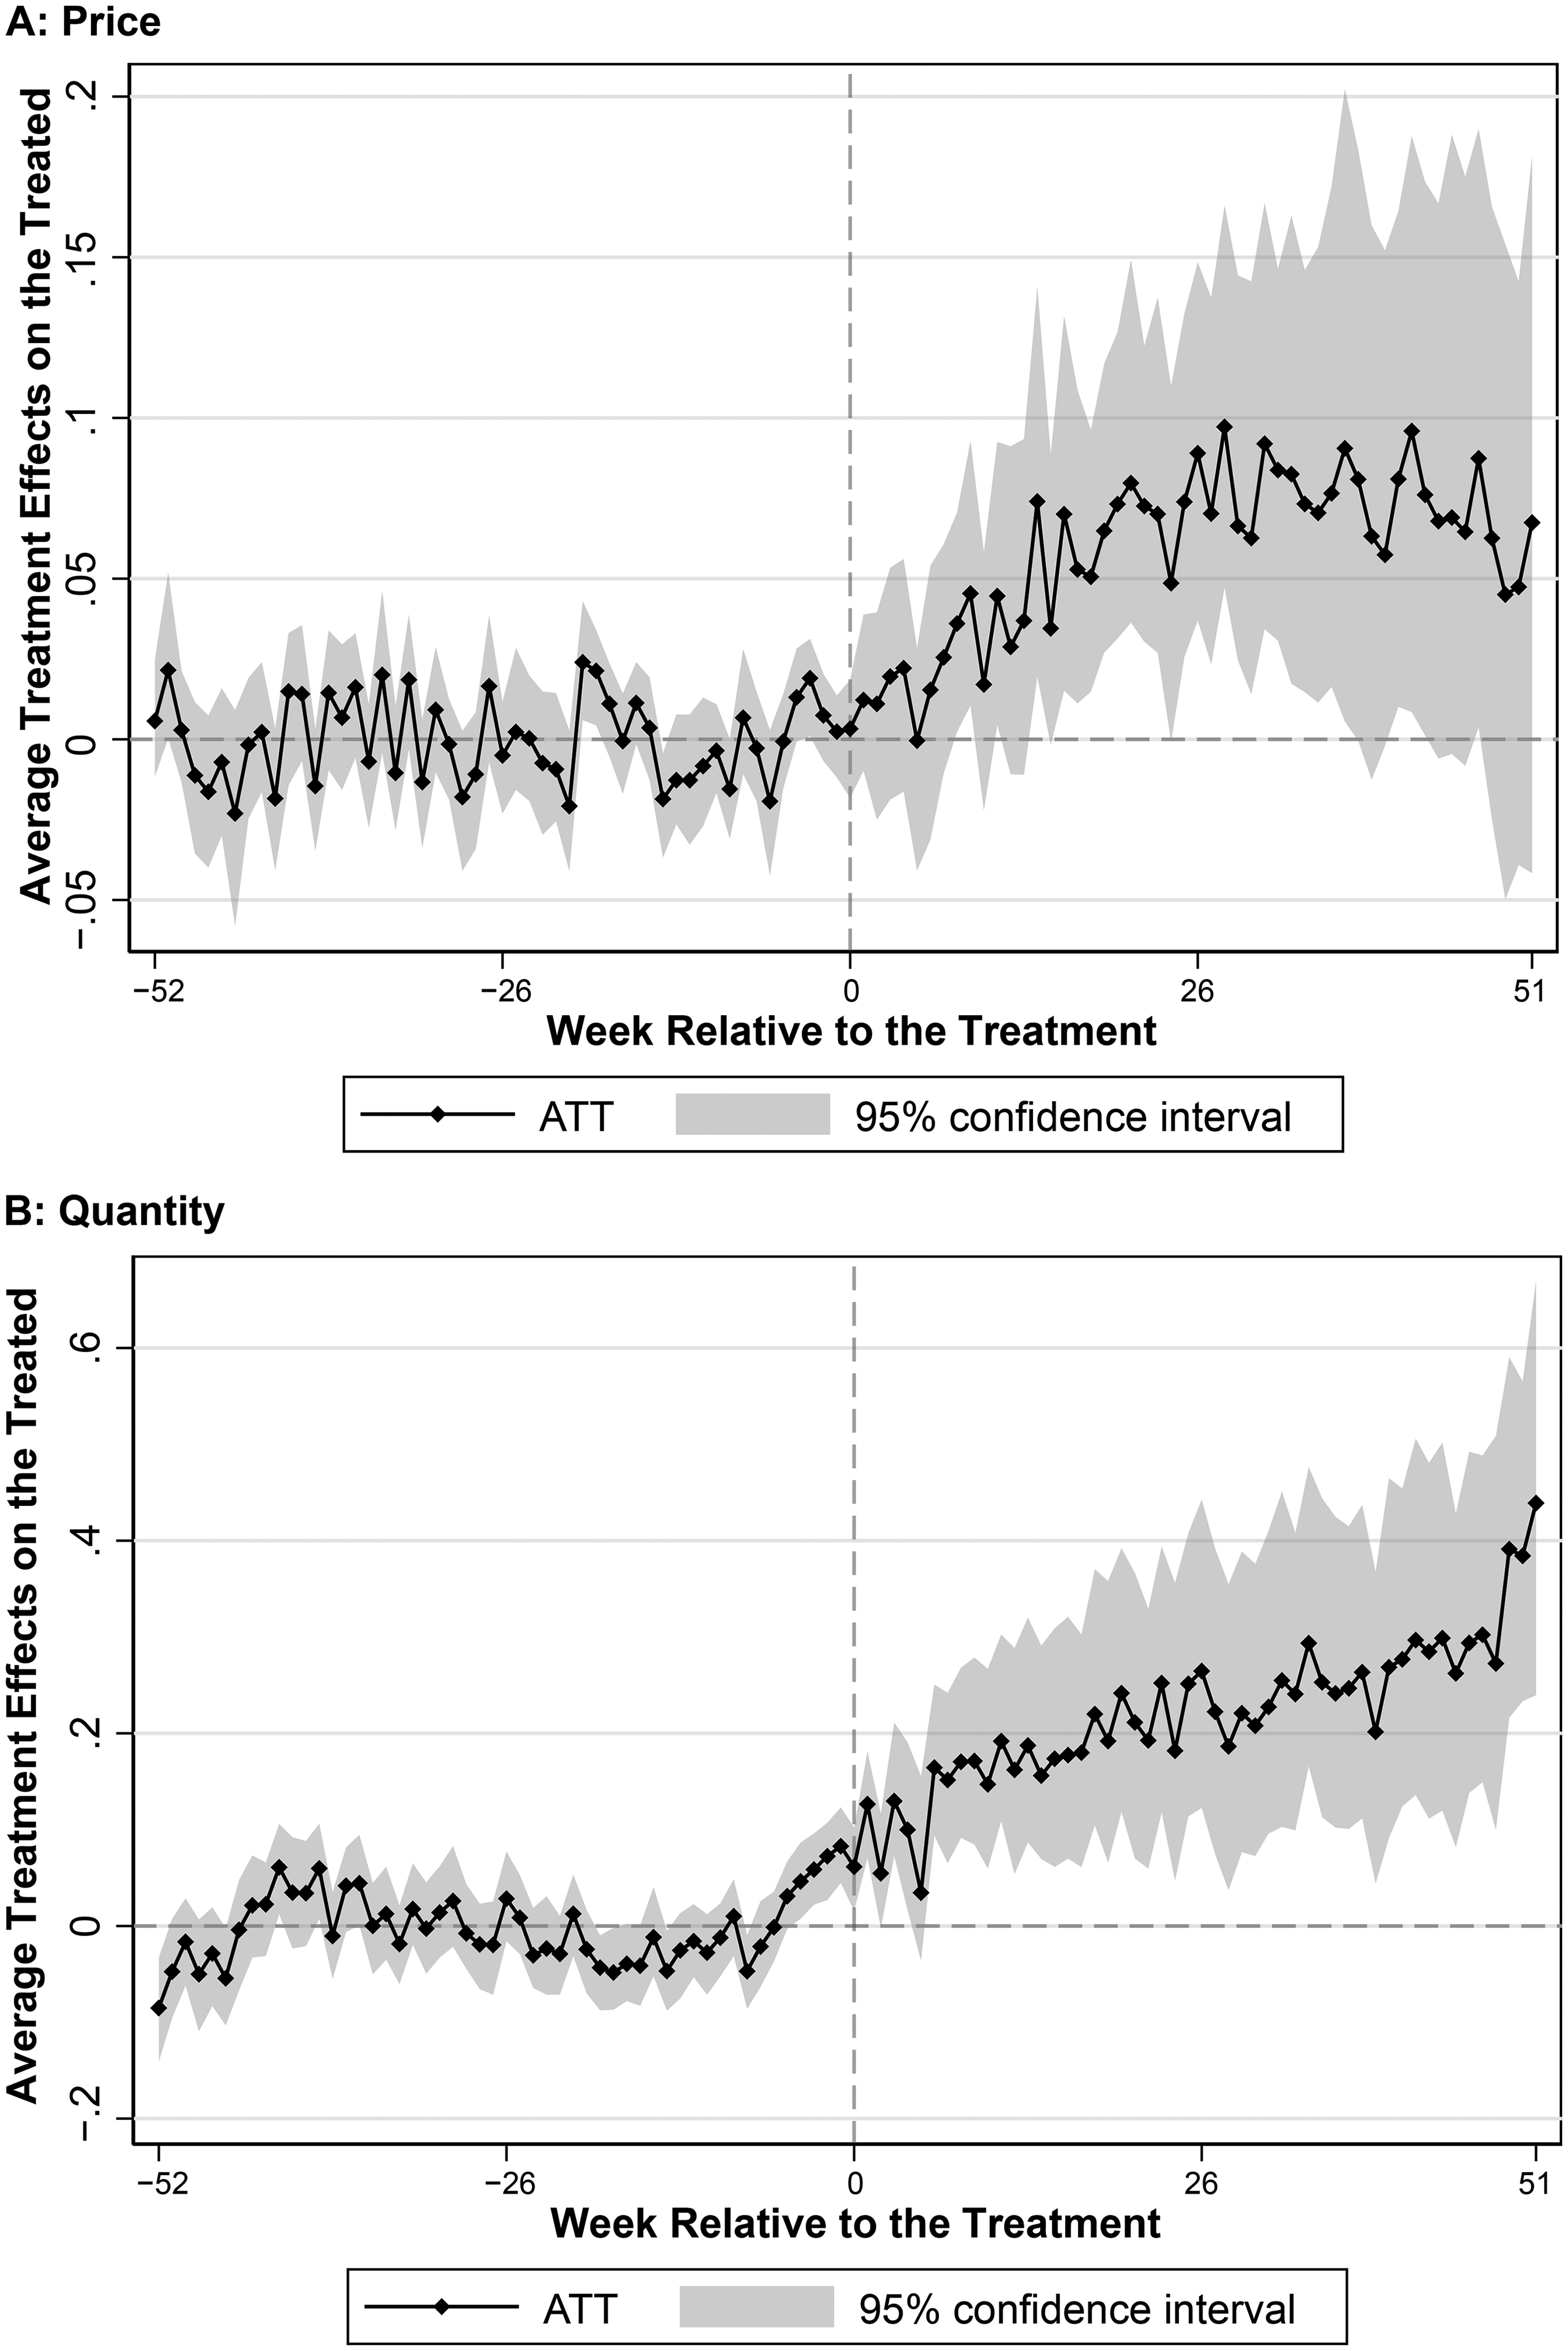
Impact of Endorsement on Paid Service Price and Quantity.
These findings convey two key implications. First, on the patient side, platform endorsement indeed serves as a strong quality signal and shifts the demand curve outward. Second, on the doctor side, the resulting increase in both price and quantity suggests that the doctor supply curve in paid services is upward-sloping. Consequently, the increased patient demand leads to both a price premium and greater service provision by endorsed doctors.
Impact on Free Service Quantity
So far, we have shown that platform endorsement boosts demand for endorsed doctors and significantly increases the price and quantity of paid services. Next, we examine its impact on endorsed doctors’ provision of free services.
Note that unlike paid services, where doctor pricing, patient requests, and doctors’ acceptance collectively determine the quantity, changes in the quantity of free services reflect only the doctor's voluntary supply. This is because in free services patients cannot choose doctors; instead, doctors decide whether to pick up a free patient request from a public pool. Moreover, demand for free services far exceeds supply.
In theory, the impact of platform endorsement on free service provision by endorsed doctors could go in either direction. On the one hand, an increase in paid service provision may crowd out the time that endorsed doctors have for free service provision. On the other hand, endorsement itself could enhance doctors’ intrinsic motivation to serve underprivileged patients (Fracchia, Molina-Millán, and Vicente 2023; Kolstad 2013; O’Flaherty, Sanders, and Whillans 2021), potentially leading to an increase in free service provision.
Figure 3 presents our result. We find that platform endorsement leads to a significant decrease in the number of free services offered by endorsed doctors. Over the entire posttreatment period, platform endorsement results in a significant 35.2% (SE = 10.3%, p = .001) decrease in free service quantity, corresponding to an average decline in weekly consultations from 9.4 to 6.1 by an endorsed doctor. Importantly, this decline is not due to endorsed doctors strategically increasing free services right before treatment to obtain endorsement and then scaling back afterward; Web Appendix Figure W4 shows similar trends between the two groups prior to endorsement.
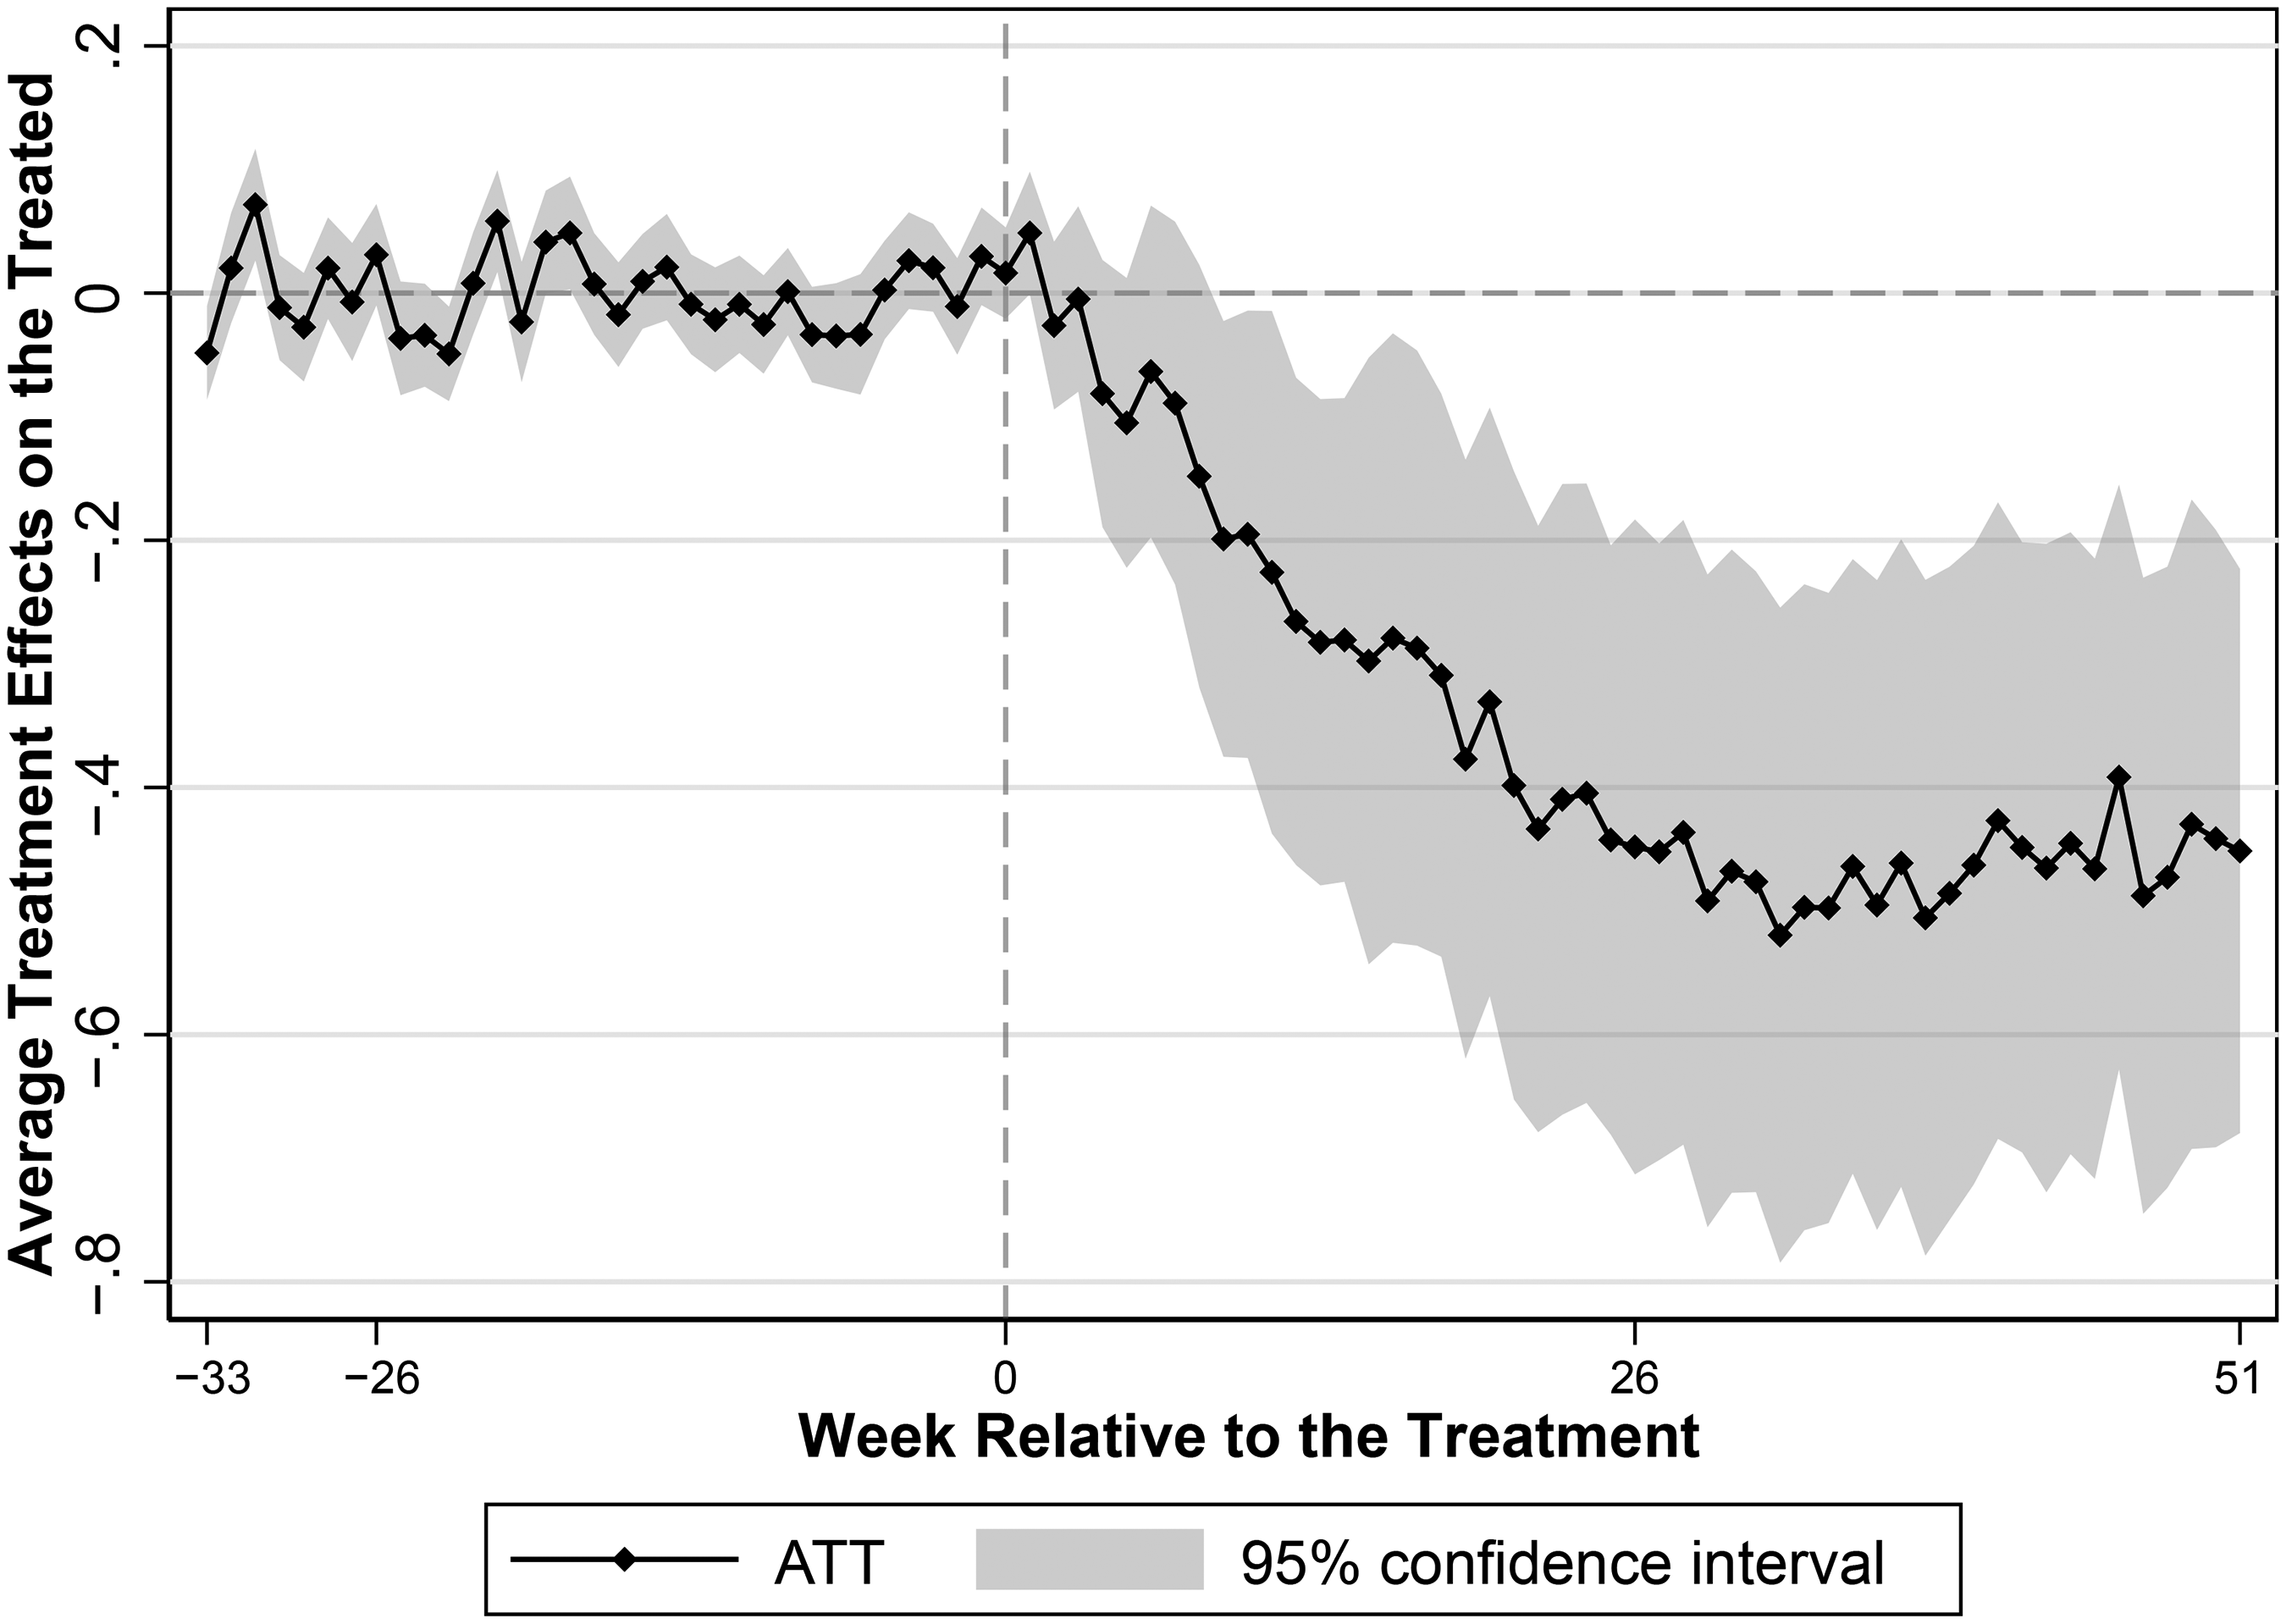
Impact of Endorsement on Free Service Quantity.
The decline in free service provision after endorsement confirms that the increased demand for paid services driven by platform endorsement crowds out endorsed doctors’ voluntary supply of free services. This trend suggests that platform endorsement negatively affects the availability of free services by endorsed doctors, potentially disadvantaging underprivileged patients who constitute the majority of free service users. Combining changes in paid and free service quantities, we find that endorsed doctors increase their total service volume by 5.7%, from an average of 36.6 weekly consultations (27.2 paid + 9.4 free) before endorsement to 38.7 consultations (32.6 paid + 6.1 free) afterward.
Impact on Quality
In this subsection, we extend our analysis beyond price and quantity to examine the quality aspect, which is particularly critical in health care due to its direct impact on patient health outcomes. Unlike product markets, where quality is generally fixed for each item sold, quality in service markets, especially in online health care, can be flexibly adjusted by providers and thus could be strongly influenced by quality incentives created through platform endorsement.
The impact of platform endorsement on service quality of endorsed doctors is theoretically ambiguous. On the one hand, the increase in the total service provision, an outcome of platform endorsement that we have documented, may compel doctors to reduce their service quality. This potential decline occurs because doctors might allocate less time and effort per patient, reflecting the well-documented trade-off between quality and quantity in health care (Grieco and McDevitt 2017). On the other hand, endorsed doctors may strive to improve their service quality, driven by an intrinsic motivation to benefit patients. This motivation is enhanced by public recognition through endorsement badges, which set expectations that doctors feel compelled to meet (Fracchia, Molina-Millán, and Vicente 2023; O’Flaherty, Sanders, and Whillans 2021) and by enabling them to benchmark their performance against peers (Kolstad 2013). Furthermore, as summarized by Dranove and Jin (2010), the impact of information disclosure on quality—whether improved or worsened—depends on how the information is presented and perceived. In our context, the permanent presence of badges on the focal platform may diminish doctors’ incentive to maintain high-quality care over time because they do not face the risk of losing their endorsement.
Assessing the quality of online consultations requires different metrics from evaluating offline consultations. In our context, online consultations primarily serve to provide second opinions from experts or diagnose minor conditions, while final treatment usually takes place offline at hospitals. Thus, using patients’ biomedical metrics is impractical. Instead, we use our extensive dataset to construct 11 dimensions of quality that provide a comprehensive evaluation of the impact of endorsement on service quality. These 11 dimensions are grouped into three categories: quality measures based on patient reviews, quality measures specific to messaging consultations, and quality measures specific to phone call consultations. We present the results for each category in the following subsections.
Quality measures based on patient reviews
Online reviews are widely regarded as a reliable indicator of quality, as noted by Lantzy et al. (2021) and Tellis and Johnson (2007). We therefore examine two review-based indicators: the percentage of positive ratings and the sentiment score of review text. As reported in Table 2, platform endorsement has no statistically significant effect on either metric. We find similar null results when examining whether endorsement influences the likelihood of receiving negative reviews. Crucially, the coefficients are near zero, indicating no evidence of a decline in patients’ perceived quality. This null finding is plausible because 97% of reviews are already positive and many patients choose from prewritten templates, leaving little room for additional improvement, though any meaningful deterioration would still be detectable.
Impact of Endorsement on Patient Review.
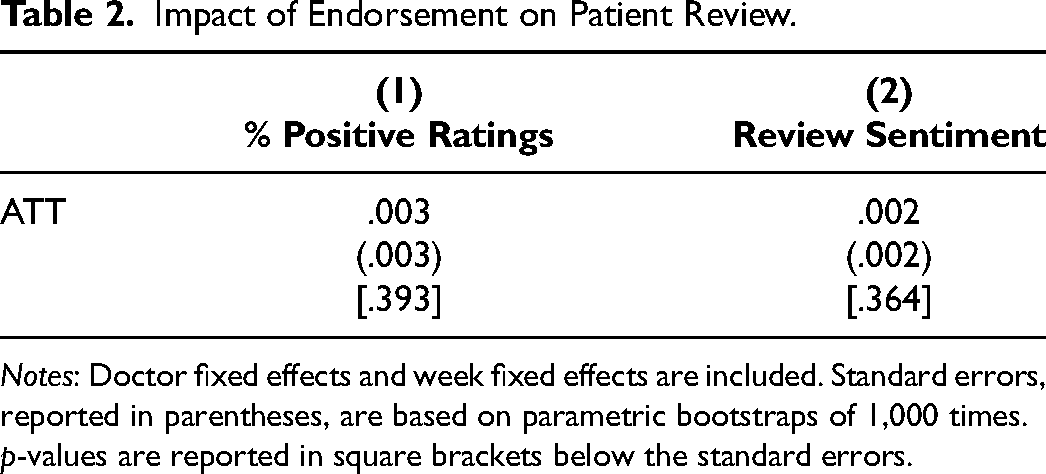
Notes: Doctor fixed effects and week fixed effects are included. Standard errors, reported in parentheses, are based on parametric bootstraps of 1,000 times. p-values are reported in square brackets below the standard errors.
Quality measures specific to messaging consultations
Messaging consultations account for 76.8% of all paid services on the platform, so quality changes in this type are especially important and indicative of overall service quality. Moreover, because we observe the complete exchanges of doctor–patient interactions, we are able to construct rich and nuanced quality metrics for this consultation type. Table 3 presents the effects of endorsement on the seven quality metrics derived from messaging consultation threads. We first examine the quantity of messages through the number of messages sent by doctors and the total word count of these messages. We find that while endorsement does not significantly change the number of messages, it leads to an average 10% increase in word count per consultation (see Columns 1 and 2 of Table 3). This suggests that endorsed doctors provide more elaborate written responses, reflecting greater effort and engagement in consultations. Beyond quantity, we assess the content of messages provided by doctors by examining informational support and emotional support—two key dimensions of content that affect patient outcomes in online medical consultations (Yan and Tan 2014; Zhang and Zhang 2025; Zhang et al. 2025). For informational support, we assess information entropy and the use of medical terms. Information entropy measures the diversity and complexity of topics covered, while medical-term frequency reflects the use of clinically precise language. Columns 3 and 4 of Table 3 show that information entropy increases significantly postendorsement, indicating that doctors’ messages draw on a more diverse vocabulary and cover a broader set of topics. This suggests greater effort in elaborating on multiple aspects during the consultation. There is no significant change in the frequency of medical terms. For emotional support, we assess sentiment score and emotional valence, which capture the overall tone and affective intensity of messages. Columns 5 and 6 of Table 3 show that endorsed doctors significantly improve on both measures, indicating a more supportive communication style postendorsement. Finally, we measure patients’ expressions of gratitude as a direct behavioral signal of perceived quality during the consultation (Palmatier et al. 2009). We find a 6% increase in gratitude words per consultation postendorsement (see Column 7 of Table 3), consistent with the observed improvements in informational and emotional support. 4 Together, these results indicate that endorsement leads to substantive enhancements in the quantity and content of doctors’ messages, which are recognized and appreciated by patients during consultations.
Impact of Endorsement on Quality in Messaging Consultations.
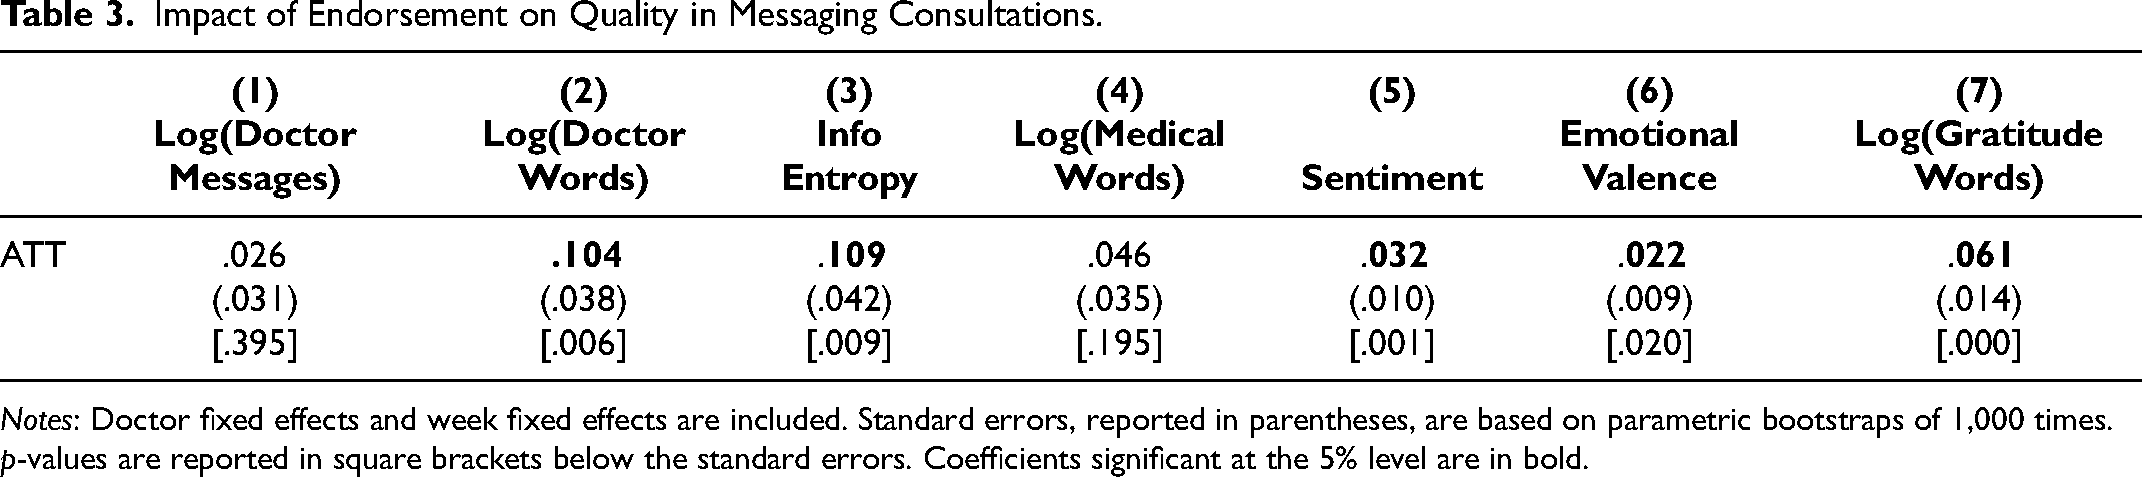
Notes: Doctor fixed effects and week fixed effects are included. Standard errors, reported in parentheses, are based on parametric bootstraps of 1,000 times. p-values are reported in square brackets below the standard errors. Coefficients significant at the 5% level are in bold.
Quality measures specific to phone call consultations
For phone call consultations, we cannot observe the detailed verbal exchanges between doctors and patients, but we do observe two key quality metrics. First, the waiting time from booking to call initiation captures timely access to care. Second, the phone call duration reflects doctors’ effort and the depth of interaction during synchronous encounters. Table 4 reports the estimated effects of endorsement on both metrics. The coefficients are small and statistically insignificant, indicating that endorsement does not lead to changes in either phone call waiting times or call durations.
Impact of Endorsement on Quality in Phone Call Consultations.
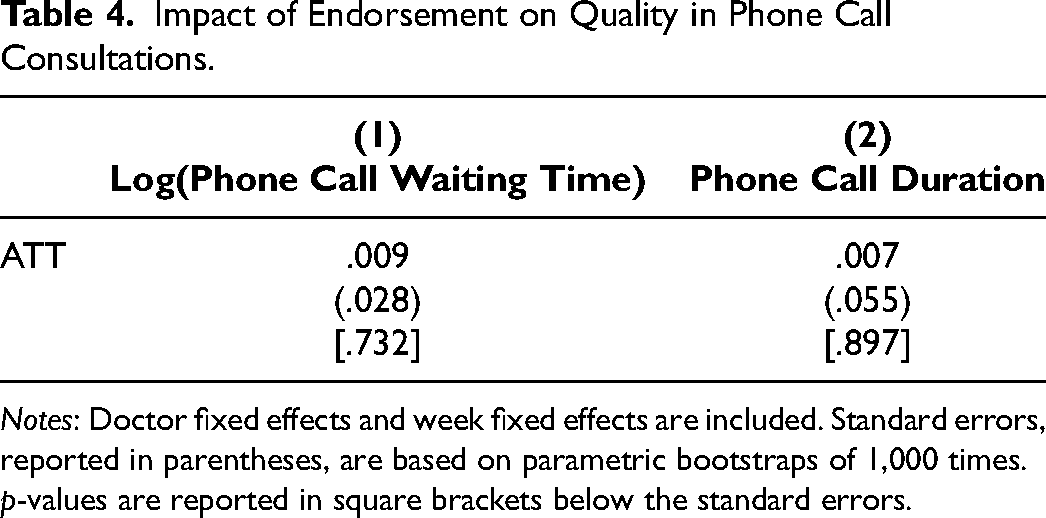
Notes: Doctor fixed effects and week fixed effects are included. Standard errors, reported in parentheses, are based on parametric bootstraps of 1,000 times. p-values are reported in square brackets below the standard errors.
Bringing together the 11 dimensions of quality results, we conclude that endorsed doctors maintain or even enhance their service quality. This conclusion also holds when applying the Bonferroni correction for multiple hypothesis testing or using a single-dimension composite quality measure (see Web Appendix L). These findings suggest that endorsement encourages doctors to uphold high standards of care. Despite increasing their service volume on the platform, there is no evidence suggesting that they compromise the quality provided to individual patients, indicating that the enhanced intrinsic incentive from platform endorsement plays a major role in driving the quality outcome.
Robustness
We perform several robustness checks. First, we assess the impact of missing values on our analysis of price and quantities. For the main analyses, we retain missing values to minimize measurement errors and confirm that their patterns are similar between the treated and control groups when comparing pretreatment and posttreatment periods (see Web Appendix Table W7). In the robustness check, we further address missing values by replacing them with lagged values for paid service price and with zero for paid service quantity, using the GSC method. The rationale for this replacement and the implementation process are detailed in Web Appendix H. The results, presented in Web Appendix Tables W8 and W9, are consistent with our main findings in terms of both economic and statistical significance. Note that missing values are not an issue for free services because free service quantity accurately reflects supply-side provision; a missing free service observation in a week is coded as zero, indicating no supply.
Second, we assess the robustness of our results regarding the choice of functional forms. Instead of logarithmic transformation, we use absolute measures for price and quantity with the GSC method. The findings remain consistent, as shown in Web Appendix Table W10.
Third, we test the robustness of our inference using an alternative standard error calculation proposed by Li and Sonnier (2023) instead of the parametric bootstrap method by Xu (2017). The method in Xu (2017) assumes equal error variances between treatment and control groups, while the alternative approach relaxes this assumption. Our findings remain consistent, with results reported in Web Appendix Table W11.
Fourth, we employ alternative estimation methods to assess the robustness of our main findings. The first alternative method is propensity score matching with difference-in-differences (PSM-DID) (Dehejia and Wahba 2002). PSM-DID identifies a matched control unit for each treated unit based on observed factors, including doctors’ characteristics and the average values of all outcomes during the pretreatment period. The results of the PSM-DID analysis, detailed in Web Appendix Tables W12–W15, demonstrate robustness. However, the PSM-DID method is less preferred because it relies solely on observed characteristics for matching, unlike the GSC method, which also considers unobserved factors. The second alternative method is synthetic difference-in-differences (SDID) (Arkhangelsky et al. 2021). The SDID method accounts for both unit weights and time weights when matching pretreatment trends. Applying this method requires a balanced panel to estimate the time weights accurately. To address this requirement, we replace missing values for prices and quantities, acknowledging the potential for introducing measurement errors. The SDID results are presented in Web Appendix Table W16. While the estimated effects are smaller, likely due to measurement errors introduced by missing value replacement, the key findings remain robust in terms of both directional alignment and statistical significance.
Finally, we assess the robustness of our results concerning the potential violation of SUTVA using two regression analyses. Our first analysis is motivated by Bairathi, Zhang, and Lambrecht (2025), which finds that unendorsed units ranked near endorsed units in search results are most likely to experience negative demand spillover. If such spillover exists in our setting, it could bias our estimated ATT on paid service price and quantity upward. To address this, we exclude from the control group any doctors ranked close to newly endorsed doctors within the same department (e.g., dermatology, pediatrics). A total of 701 doctors are close-ranked and are thus excluded. We reestimate the treatment effects on paid service price, paid service quantity, free service quantity, and the 11 dimensions of quality. The results, shown in Web Appendix Tables W17–W20, remain consistent and robust compared with the main findings. Our second analysis considers the potential for demand spillover or information spillover to occur among doctors affiliated with the same offline hospital. To account for this, we construct a second alternative control group by excluding unendorsed doctors from the same hospitals as endorsed doctors, totaling 976 doctors, thereby minimizing the risk of spillover effects among doctors from the same location. As shown in Web Appendix Tables W21–W24, the results confirm the robustness of our main results.
Impact of Reendorsement
Our analyses thus far have focused on newly endorsed doctors transitioning from having no badge to receiving their first badge. However, to fully understand the impact of platform endorsement, it is also important to examine doctors reendorsed in 2019. For these doctors, the treatment involves an increase in the count displayed on their endorsement badge (e.g., from 1 to 2, as illustrated in the right panel of Figure 1) rather than the initial appearance of the badge. Comparing the effects of endorsement between newly endorsed and reendorsed doctors allows us to disentangle the impact of the badge's initial appearance from the effect of changes in the count displayed on the badge. We present doctor-level characteristics for reendorsed doctors in Web Appendix Table W2 and consultation attributes in Table W3. To examine the impact of reendorsement, we compare this reendorsed group with a synthetic control group using the same GSC regression framework in Equation 1.
The results, shown in Web Appendix Table W25, indicate no significant impact of endorsement on reendorsed doctors regarding the price and quantity of paid services or the quantity of free services. This suggests that a simple increase in the count shown on the endorsement badge does not convey a strong quality signal to patients, resulting in no boost in patient demand or adjustments in doctors’ price setting and service provision. The contrast between the null effects of endorsement on reendorsed doctors and the significant effects observed for newly endorsed doctors implies that what primarily attracts patient requests is the presence of the endorsement badge itself, rather than the specific count shown on the endorsement badge.
Despite the lack of patient response to the increased endorsement count, our analysis of quality measures shows that service quality is not compromised among reendorsed doctors, as shown in Web Appendix Tables W26–W28. In fact, reendorsed doctors reduce phone call waiting times by approximately 8.7% (SE = 2.2%, p = .000), a result that remains valid when applying the Bonferroni correction for multiple hypothesis testing (see Web Appendix Table W33). This suggests that although a higher endorsement count does not send a strong signal to patients, it still motivates doctors to engage with the platform and maintain service quality. The public visibility of the higher count on the endorsement badge may enhance doctors’ intrinsic motivation, highlighting the role of platform endorsement in promoting quality through nonmonetary incentives.
Discussion on Platform-Level Impact of Endorsement
In this section, we discuss the platform-level impact of endorsement building on our doctor-level findings. The overall effect of the program on the platform depends on the net changes among both endorsed and unendorsed doctors. Recall from the previous two sections that (1) newly endorsed doctors significantly increase their provision of paid services at higher prices while reducing the provision of free services, yet maintain or even improve service quality postendorsement, and (2) reendorsed doctors exhibit no significant changes in paid service quantity, price, or free service quantity, although they too maintain or improve quality. We first quantify the changes in price and quantity generated by endorsed doctors and then examine the extent to which these effects are offset or amplified by unendorsed doctors.
We first examine changes in price and quantity at the platform level, which are primarily driven by newly endorsed doctors. The increase in paid service price (from 101 to 111 yuan per consultation) and quantity (from 27.2 to 32.6 consultations per week) generates an additional 45,313 yuan (6,971 USD) in annual revenue for each newly endorsed doctor, roughly half the average annual salary of a full-time doctor in China. 5 Across all 156 newly endorsed doctors, the 5.4 additional consultations per doctor per week total approximately 44,000 extra consultations annually, representing about a 1.5% increase in total paid service volume and contributing around $1.1 million to the platform's annual revenue.
While the endorsement program boosts the platform's revenue, it also leads to approximately 27,000 fewer free consultations from leading doctors (aggregated from an average decline of 3.3 per doctor per week), a 3.8% decrease at the platform level in 2019. This reduction results in a significant benefit loss for underprivileged patients. Valuing each free consultation at 111 yuan—the average price set by endorsed doctors—this shift represents a total loss of roughly 3 million yuan (or .5 million USD) in forgone services. 6 For context, households receiving China's subsistence allowance earn less than 4,200 yuan per year, meaning one consultation with these leading doctors would cost over 2.6% of their annual income, highlighting the financial strain created by the reduction in free care.
These back-of-the-envelope calculations assume that endorsement does not affect the services provided by unendorsed doctors, that is, newly endorsed doctors did not steal demand for paid services from unendorsed doctors, nor did unendorsed doctors increase their provision of free services in response. We provide visual evidence supporting this assumption: Web Appendix Figures W5 and W6 display trends in free and paid services provided by unendorsed doctors in our sample before and after the intervention. The figures do not show visually discernible changes associated with endorsement. We note that Figures W5 and W6 are descriptive and should be interpreted as event-study plots rather than causal estimates. In addition, while these figures do not suggest substantial shifts, we acknowledge that small-scale substitution effects cannot be entirely ruled out.
Further broader platform trends in paid and free service volumes are provided in Web Appendix Figures W10 and W11. This evidence is descriptive rather than causal, as it is not based on a comparison with a control platform. Figure W10 shows an overall upward trend in paid services, suggesting that—even if some substitution occurred—a market expansion effect is also at play. Figure W11 shows a declining trend in total free consultations, consistent with our doctor-level findings that endorsed doctors reduce their provision of free services. This suggests that other doctors on the platform did not fully offset this reduction. 7 Importantly, the reduction in free services involves consultations provided by the platform's leading doctors—those who charge higher prices, deliver higher-quality services, and have elevated visibility. As such, this decline likely has a more pronounced welfare effect on underprivileged patients who benefit most from access to these high-quality services. While the platform's overall service volume increased following the endorsement program, the reduction in free services could weaken the platform's CSR image and brand equity, which are important for business performance.
In terms of quality, our findings indicate that both newly endorsed and reendorsed doctors maintain or even improve their service quality across multiple dimensions. Additionally, we further provide evidence in Web Appendix Figure W7 that there are no significant changes in quality for unendorsed doctors following the endorsement announcement. Taken together, these results suggest that the impact of platform endorsement on service quality is either neutral or positive at the platform level.
Heterogeneous Effects Across Doctors
Our analysis shows that while platform endorsement effectively encourages leading doctors to increase their engagement with the platform, it has a notable downside: a reduction in free services. This decline adversely impacts underprivileged patients and risks harming the platform's CSR image and brand equity. Understanding this decline in free services is critical for both the platform and society. To address this, we examine how platform endorsement impacts different groups of doctors, aiming to provide insights on optimizing the endorsement design to mitigate this issue.
We categorize doctors into two groups: “high-prosocial doctors” and “low-prosocial doctors,” based on their relative provision of free services compared with the median during the pretreatment period. This categorization is based on doctors’ observed prosocial activities instead of their unobserved motives behind these activities. The unobserved motives could be either pure altruism, where doctors genuinely care about the welfare of underprivileged patients (Bénabou and Tirole 2006; Galizzi et al. 2023; Kolstad 2013), or impure altruism, where doctors provide free services in hopes of gaining reputation (Berman and Silver 2022). Importantly, regardless of the underlying motives, the platform's hope is to ensure that information disclosure does not discourage these prosocial activities. We present summary statistics of the two groups of endorsed doctors in Web Appendix Table W29. The two groups are similar across all key attributes, including paid service quantity, age, gender, education, affiliated hospital level, professional title, and platform tenure. However, high-prosocial doctors tend to provide more free services and charge lower prices for paid services compared with low-prosocial doctors.
Table 5 presents the impact of endorsement for each group, revealing contrasting behaviors. High-prosocial doctors, upon receiving endorsement, generally refrain from raising prices for paid services (see Column 1). This pattern, along with their initially lower prices compared with low-prosocial doctors, suggests that high-prosocial doctors may be less financially driven and care more about patient welfare, which may explain their decision not to raise prices to capitalize on the quality signal provided by endorsement. This restraint in pricing, combined with the positive quality signal from endorsement, leads to a significant increase in demand and provision of paid services (see Column 3). However, this growth in paid services comes at the expense of free services (see Column 5), which is driven by capacity constraints. Although doctors are not obligated to accept more paid service requests when patient demand increases, the way paid and free consultations are initiated may encourage them to do so. Paid consultation requests are explicitly directed to specific doctors, who may incur a psychological cost by declining them (Givi and Kirk 2024), whereas free services are not individually targeted and only occur when doctors voluntarily engage with the free service request pool during their available time. Consequently, with limited capacity and rising demand for paid services, high-prosocial doctors are effectively “compelled” to reallocate their time from free to paid services. In contrast, low-prosocial doctors, following endorsement, raise their service prices by approximately 16% (p < .10; see Column 2) while keeping paid and free service quantity unchanged (see Columns 4 and 6).
Heterogeneous Effects on High-Prosocial and Low-Prosocial Doctors.
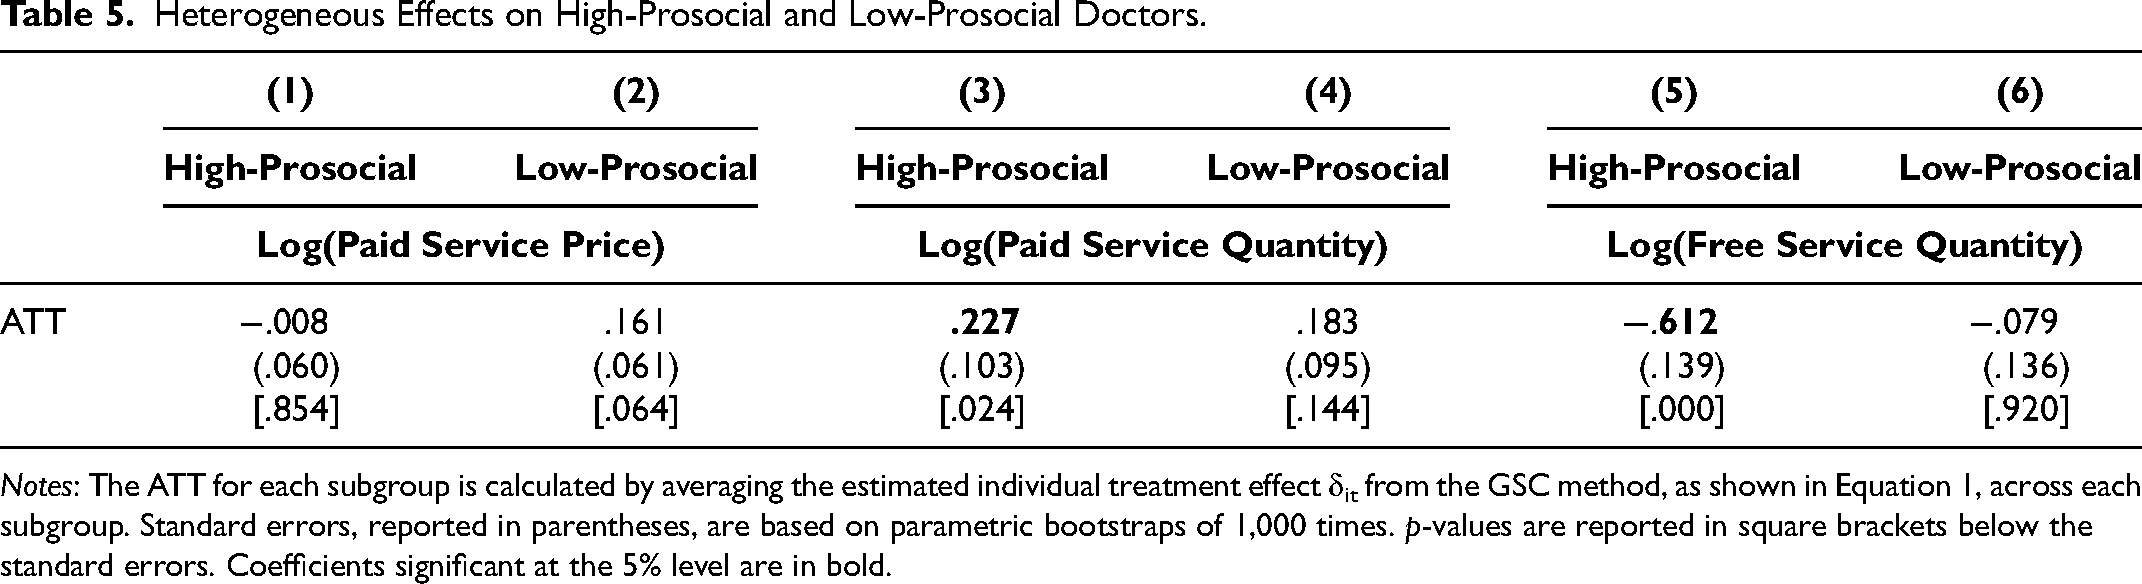
Notes: The ATT for each subgroup is calculated by averaging the estimated individual treatment effect δit from the GSC method, as shown in Equation 1, across each subgroup. Standard errors, reported in parentheses, are based on parametric bootstraps of 1,000 times. p-values are reported in square brackets below the standard errors. Coefficients significant at the 5% level are in bold.
We further validate these findings by using a continuous measure of doctors’ prosocial levels, defined as the share of free services delivered during the pretreatment period. We then examine the correlation between this continuous prosocial measure and the estimated ATTs of endorsement on paid service price, paid service quantity, and free service quantity. The results, presented in Web Appendix Table W30, consistently show that doctors with higher prosocial levels during the pretreatment period tend to increase their paid service price less and provide more paid services, but at the expense of offering fewer free services.
Lastly, we present the results on the impact of endorsement on service quality for the two groups, as shown in Web Appendix Table W31. Our findings indicate that both groups maintain their service quality postendorsement, with high-prosocial doctors showing a significant improvement in messaging consultation quality (robust to Bonferroni correction for multiple hypothesis testing; see Web Appendix Table W34), while low-prosocial doctors show no notable decline in any quality measures. 8 The improvement in service quality by high-prosocial doctors, alongside their unchanged prices and increased service quantity, suggests that the endorsement badge serves as a stronger intrinsic incentive for this group, even though free service provision is reduced due to capacity constraints.
These findings offer insights for improving the design of online health care platforms and similar digital platforms that provide both paid and free services. First, platforms could investigate revising the process of free service initiation by allocating free service requests to individual doctors based on their historical provision of free services and matched expertise rather than relying on voluntary selection from a public pool. Second, the endorsement program could be refined to better recognize and incentivize doctors’ prosocial commitments by placing greater emphasis on free service provision in the endorsement criteria.
Conclusion
Technological advancements and the COVID-19 pandemic have accelerated the adoption of online health care platforms. Unlike offline care, these platforms offer patients a wider choice of doctors, heightening information asymmetry. Ensuring consistent doctor engagement within a highly flexible and autonomous environment is another challenge. To address these issues, many platforms use endorsement programs to highlight top doctors to aid patient choice and incentivize doctor performance. However, how endorsement influences patient demand and doctors’ decisions across multiple behavioral margins has been unclear. This study provides a comprehensive examination.
Our analysis, focused on a major online doctor consultation platform in China, reveals several key insights. First, platform endorsement significantly increases patient demand for endorsed doctors, enabling them to raise prices and expand paid service provision. This results in substantial revenue gains for both the endorsed doctors and the platform. However, this comes at a cost: a notable reduction in free services, which negatively impacts underprivileged patients. These findings highlight a key tension between increasing paid service provision and maintaining access to high-quality free care on the platform. While endorsement drives an increase in total service quantity, we find no evidence that it compromises service quality. In fact, evidence indicates that endorsed doctors maintain or even improve their service quality after endorsement.
The reduction in free services raises concerns about health care equity. Notably, our analysis reveals that this reduction is primarily driven by doctors who exhibit more prosocial behaviors before receiving the endorsement. These doctors, reluctant to increase their prices, face increased demand for paid services but are constrained by their capacity. To meet the increased demand and maintain high-quality care, they reduce their voluntary free service provision. In contrast, doctors who are less prosocial before endorsement raise their prices significantly after being endorsed while keeping the quantity of paid and free services, as well as the quality of care, unchanged.
These findings highlight critical trade-offs in platform endorsement programs. While endorsement improves patient choice and boosts paid service provision, it may disadvantage underprivileged patients by reallocating doctors’ efforts from free to paid services. Platforms designing information disclosure tools must carefully weigh these effects, considering their implications for pricing, service quality, and health care equity. A balanced approach is essential to optimize the benefits of paid and free services while minimizing disparities across patient groups, enabling platforms and policymakers to enhance health care access and equity.
This study has limitations. First, it focuses on a specific endorsement program, and endorsement impacts may differ in contexts with varying criteria or proportions of endorsed doctors. Nonetheless, the broader insight that understanding information disclosure is critical in health care, where doctors make multidimensional decisions, remains relevant. Additionally, we do not examine how online endorsement influences offline service provision. In our context, doctors’ offline work is constrained by employment arrangements, but future research could explore settings where doctors balance online and offline services more flexibly. Lastly, our analysis is limited to data from a single platform and a one-year treatment period. Access to data from a comparable health care platform without an endorsement program, along with a longer observation window, would allow for a more comprehensive investigation of the overall impact of endorsement programs across platforms, their longer-term effects, and broader implications for health care markets. We acknowledge these limitations and suggest them as avenues for future research.
Supplemental Material
sj-pdf-1-mrj-10.1177_00222437251408776 - Supplemental material for Information Disclosure via Platform Endorsement in Online Health Care
Supplemental material, sj-pdf-1-mrj-10.1177_00222437251408776 for Information Disclosure via Platform Endorsement in Online Health Care by Jiajia Zhan, Xu Zhang and Hongqiao Fu in Journal of Marketing Research
Footnotes
Acknowledgments
The authors contributed equally to this work. They thank Carol Propper, Stephan Seiler, Puneet Manchanda, Anja Lambrecht, Kathleen Li, Mimansa Barathi, Xinrong Zhu, Andre Veiga, Jura Liaukonyte, Jonathan Berman, Ena Inesi, and participants at various research seminars and conferences for their helpful comments and feedback. These include Cornell University, University of Toronto, Goethe University Frankfurt, London Business School, the Hong Kong Quantitative Marketing Seminar, University of Warwick, Bocconi University, the 45th Marketing Science Conference, the 12th Choice Symposium, the 2023 UCL-USC Cross-Disciplinary Conference on Digital Platforms, the 2nd Workshop on UK Digital Economics, the 15th Paris Conference on Digital Economics, the 7th Doctoral Workshop on the Economics of Digitization, the EMAC 2024 Annual Conference, the 2024 China Marketing International Conference, the 2024 NBER Summer Institute, and the 2025 MSOM Conference. Special thanks to Yuzhu Wang and Yi Zhang for their excellent research assistance. Any errors are the authors’.
Coeditor
Raghuram Iyengar
Associate Editor
Vrinda Kadiyali
Ethics Approval
The study was approved by the Research Ethics Committee at London Business School (REC1027) and the IRB at Peking University (IRB00001052-21037).
Declaration of Conflicting Interests
The author(s) declared no potential conflicts of interest with respect to the research, authorship, and/or publication of this article.
Funding
The author(s) disclosed receipt of the following financial support for the research, authorship, and/or publication of this article: Xu Zhang acknowledges financial support from the London Business School's Research and Materials Development Fund [RAMD_Zhang_X_24/25_8895 and RAMD_Zhang_X_25/26_2963]. Hongqiao Fu acknowledges financial support from the National Natural Science Foundation of China [grant numbers 72103005 and 72473002] and the Taikang Yicai Public Health and Epidemic Control Fund [grant number 2021015].
Data Availability
An alternative disclosure plan was approved for this article. Due to a nondisclosure agreement, the data that support the findings of this article are not available; however, the code used in the analyses has been shared with the Coeditor and the Data Editor.
Notes
References
Supplementary Material
Please find the following supplemental material available below.
For Open Access articles published under a Creative Commons License, all supplemental material carries the same license as the article it is associated with.
For non-Open Access articles published, all supplemental material carries a non-exclusive license, and permission requests for re-use of supplemental material or any part of supplemental material shall be sent directly to the copyright owner as specified in the copyright notice associated with the article.