
Abstract
The Healthy, Hunger-Free Kids Act (HHFKA) placed strict nutritional mandates on meals served at U.S. public schools. This policy offers a unique opportunity to study household response to a large, exogenous change in healthiness of food available to their children. Did more healthy school meals lead households to substitute toward them, and away from grocery food purchases? Which households were more responsive to the nutritional mandates? And was there any spillover effect on the nutritional quality of their grocery food purchases? The authors document a meaningful decrease in the quantity of grocery food in response to the HHFKA, and a small decrease in quality. Consistent with substitution toward school meals, more of the quantity decrease is attributable to items likely to be purchased for children and categories traditionally associated with breakfast and lunch (the meals served at school). The HHFKA attracted even greater participation from financially constrained and time-constrained households for whom school meals were already important and were now coupled with the additional benefit of healthier food. These findings have important implications for policy makers and researchers, but also for food manufacturers and retailers.
Much recent research in marketing and related fields has attempted to answer an important question: “How can we help consumers eat healthier?” One key stream of literature has examined why consumers purchase unhealthy foods. Oft-cited explanations include insufficient access to healthy foods, financial constraints, time constraints, low nutrition literacy, and the importance of taste. Another important stream of literature has examined actions that could stem the tide, including price changes, advertising bans and taxes on unhealthy foods, new forms of nutrition labels and health symbols, package/portion size reduction and product reformulation, and various types of nudges.
A significant challenge faced by researchers seeking to learn about food choices in the marketplace—or what Haws et al. (2022) refer to as “free-living eating” rather than “lab eating”—is that exogenous shocks to the healthiness of food options available to consumers are rare. One such shock occurred in the United States at the start of the 2012 school year, when the Healthy, Hunger-Free Kids Act (HHFKA) was implemented. It mandated strict and significantly higher nutrition standards for meals provided by the School Breakfast Program and the National School Lunch Program, substantially improving the healthiness of school meals (Cohen and Schwartz 2020; Kinderknecht, Harris, and Jones-Smith 2020).
Detractors of the policy argued that children would dislike the healthier meals, leading to lower participation and/or more wasted food (Winett et al. 2018; Yee 2012). Empirical evidence on whether households shifted toward, or away from, the now-healthier school meals is limited to two sources: year-over-year changes in the number of “meals served” that schools report to the U.S. Department of Agriculture (USDA) in order to be reimbursed, which show a slight increase in the first year after the HHFKA’s nutritional mandates were implemented (USDA Food and Nutrition Service 2024), and studies on participation among small regional samples of schools, which find little to no change in participation (e.g., Bergman et al. 2014). However, causal or generalizable evidence is lacking for the overall effect of the nutrition mandates on participation, heterogeneity in that effect, or spillover effects on grocery purchases.
Marketers, marketing researchers, and policy makers all have an interest in understanding consumers’ response to the HHFKA's stricter nutrition guidelines and, in turn, what that response might say about ways to improve consumers’ food choices. Analyzing response to the HHFKA is especially important at this time, because the rules regarding school meal nutrition standards continue to change, weakening or strengthening depending on which political party is in power (Jacobs 2018; Riley 2023).
This article aims to fill this gap in the literature by (1) studying whether the HHFKA's improved nutrition standards (independent of the act's other changes) resulted in a shift from grocery food purchases toward school meals or vice versa, (2) examining whether the shift changed the healthiness of households’ grocery food shopping, and (3) characterizing which types of households shifted the most toward school meals, to learn why certain households may have availed themselves of the healthier food for their kids in school.
We accomplish this by using the NielsenIQ Homescan Panel of household grocery purchases to estimate changes in the quantity and nutritional quality of grocery food purchases that can be attributed to the policy change. We can infer changes in households’ school meal participation from the changes in the quantity of their grocery food shopping (see Brown [2021], Handbury and Moshary [2021], and Marcus and Yewell [2022] for similar use of grocery purchase data), and changes in the nutritional quality of grocery food shopping inform us about any spillover effects of the policy change. To identify the effect of the HHFKA, we compare changes in the shopping baskets of households with children (who are treated by the policy) and matched control households without children.
There are several benefits to this approach. First, our data come from a national panel and are therefore much more representative of the United States than small, regional samples are. Second, we can measure food quantity and quality at a granular level, versus the monolithic measure of “meals served.” Third, our data on demographics and grocery shopping behavior enable an analysis of the types of households that were most attracted to healthier school meals. And, fourth, quantifying the impact of the policy on grocery food purchases is important in its own right, particularly to manufacturers and retailers.
We find that grocery food quantity (measured as total calories per capita) declined by approximately 6% due to the HHFKA mandates, suggesting that there was a small but meaningful shift toward school meals. Consistent with this, the reduction was driven more by food items that are likelier to be purchased by households with kids, and by breakfast and lunch categories (the two meals offered at school) than other categories. We also find that the nutritional quality of grocery purchases declined slightly, but this decline is much smaller than the increased healthiness of school meals.
Finally, we find that the HHFKA attracted even greater participation from households for whom the preexisting benefits of school meals (time and money savings) were already important and were now coupled with an additional benefit: healthier food for their kids. It had a stronger pull among households with limited time and money, and whose pre-HHFKA grocery food purchases were both of lower quantity and less healthy.
Our study makes important contributions to the growing stream of literature focused on encouraging healthy eating. It is a generalizable, in-market examination of response to a substantial change in the food landscape for families with school-going kids. Compared with studies of nutrition labels, price/tax changes, or package/nutrition changes of individual items, this article's context is unique in that it provides insight into how consumers respond when meal offerings are made substantially healthier overall. The magnitude of response to this policy change is informative not only for those studying policy interventions, but also for retailers and manufacturers, whose sales are directly affected by substitution to or from school meals.
Our examination of heterogeneity in households’ response to the mandates also adds to the policy literature on these mandates, which understandably focuses on poor and underprivileged children. Our work underscores the important role of not just financial constraints, but also time constraints, in shaping response to healthier school meals, information that should be of interest to both policy makers and marketers in the food space.
Our findings should be encouraging to policy makers because (1) making school meals healthier attracted greater participation, rather than turning kids off or merely leaving participation unaffected; (2) for participating kids, any reduction in the healthiness of foods purchased at home was likely dwarfed by the healthiness of school meals; and (3) substitution toward healthier school meals was stronger among busy, low-socioeconomic-status households that purchased less healthy foods at the grocery store, thus benefiting the kids who most need the healthier food.
The Policy Change and Related Literature
Mandated Nutrition Standards Under the HHFKA
The HHFKA was a centerpiece of First Lady Michelle Obama's “Let's Move!” initiative to combat childhood obesity and was signed into law in 2010. This research focuses only on the nutrition standards mandated by Section 208, the first major change to nutrition standards for food served through the National School Lunch Program and School Breakfast Program since their respective introductions in 1946 and 1966. The new standards required that milk served in schools be either fat-free or 1% fat, that more fruit and vegetables be served, and that unhealthy components such as sodium, sugar, and saturated fat be capped. To combat overeating, portion sizes of meals were reduced as well (USDA Food and Nutrition Service 2016).
These changes greatly improved the nutritional content of school meals. Measured using the USDA's Healthy Eating Index (HEI), the healthiness of breakfasts served at school increased from 50% of the maximum score to 71%, and the healthiness of lunches served at schools increased from 58% of the maximum score to 82% (Gearan and Fox 2020). Other studies also reported that consumed foods at school were healthier after the implementation of the HHFKA's nutrition standards (Bergman et al. 2014; Cullen, Chen, and Dave 2015; Kinderknecht, Harris, and Jones-Smith 2020; Schwartz et al. 2015).
Schools were required to implement the revised nutrition guidelines starting from the 2012–2013 school year. We use one year before and one year after the change for our analyses. We specify August 2012 as the treatment start date, since August is the most common back-to-school month in the United States. Thus, our data span the period from August 2011 through July 2013. The policy change rollout was announced to schools in advance of its required implementation, and a large majority of schools were reported to be in compliance with these guidelines shortly after implementation began (Au et al. 2020). To the extent that some specific schools implemented changes to food served early (or late), our results would be rendered conservative, as an early (or late) application of the treatment would reduce the difference between the treatment group's pre- and posttreatment outcome variables.
Crucially, our analysis is not contaminated by the two other changes made by the HHFKA: the national rollout of the Community Eligibility Provision (CEP), which expanded eligibility for free and reduced-price meals, and the nutritional standards for “competitive foods.” Both these changes took effect after our analysis period (the 2014–2015 school year). Thus, our analyses cleanly measure consumers’ response to only the new nutrition standards. 1
Related Literature
Impact of HHFKA nutrition mandates on school meal participation
Much of the research on the HHFKA's nutrition standards has focused on their impact on the healthiness of school meals, as previously noted. Research on the impact on school meal participation is quite limited because it is impractical to get generalizable data on changes in participation. Vaudrin et al. (2018) find no change in schools located in four urban, low-income, high-minority cities in New Jersey, nor do Johnson et al. (2016) in six schools in an urban school district in Washington state. Schwartz et al. (2015) report a reduction in food waste, rather than the increase forecasted by some detractors of the HHFKA. These limited analyses underscore the importance of our first research objective: to quantify the causal impact of the HHFKA's nutrition mandates on the quantity of grocery food purchases by households with school-age kids. We follow in the tradition of researchers like Handbury and Moshary (2021) and Marcus and Yewell (2022), who have investigated the impact of the CEP on household demand for groceries and other related outcomes.
Heterogeneity in the impact of HHFKA's nutrition mandates
We found no prior research that has broadly examined heterogeneity in the effect of the HHFKA's nutrition standards on participation. Research has instead focused on lower-income populations. There is, however, substantial research on the drivers of school meal participation and also a large literature that speaks more generally to drivers of the healthiness of households’ food choices. The intersection of these literatures reveals three potential sources of heterogeneity in response to the HHFKA nutrition mandates: financial constraints, time constraints, and nutrition literacy.
School meal programs were designed to help children from families that cannot afford healthy meals. In line with this objective, a sizable proportion of program participants were eligible for free or reduced-price meals even before the HHFKA was enacted (63% for lunches and 82% for breakfasts in 2009–2010; USDA Food and Nutrition Service 2024). More generally, lack of financial resources is a key barrier to healthy eating (e.g., Daniel 2020; Jetter and Cassady 2006; Ma, Ailawadi, and Grewal 2013) and can lead to food insecurity.
Saving time is one of the most-cited reasons for participating in the school lunch program (Farris et al. 2016). Time-pressured households also have less healthy diets, relying more on convenience foods and less on in-home food preparation (e.g., Jabs and Devine 2006; Rahkovsky and Jo 2018). Households with a single head or two fully employed heads have been shown to rely more on food away from home (Ziol-Guest, DeLeire, and Kalil 2006), and children may eat less healthy food when their mothers work long hours (Hawkins, Cole, and Law 2009).
Households’ nutrition literacy is the third key driver. It encompasses both knowledge about nutrition and the skills to make appropriate dietary decisions and is known to influence the quality of food purchases (Spronk et al. 2014). It also affects school meal participation. For example, among households that were not eligible for free or reduced-price lunches, 61.9% of those who sent kids with lunch from home felt that it would be more nutritious than the options available at school (Farris et al. 2016).
Since these drivers influence both school meal participation and healthy eating, it is not clear a priori what effect they would have on response to the improved nutrition mandates of the HHFKA. Financially constrained and time-constrained households are likely to already have high rates of school meal participation, so their participation may hit a ceiling. Or more of them may participate, attracted by the healthier meals. It is also an empirical question whether the nutritional mandates might attract unconstrained and nutritionally literate households that did not previously participate in school meals, such as the households referenced in Farris et al. (2016) who preferred to pack healthy lunches for their children.
Spillover effects on grocery food quality
We also could not find any research on the impact of the nutrition standards on the healthiness of grocery food purchases. The broader literature on food choice suggests that there is no obvious a priori hypothesis about the existence and direction of any spillover effects. There may be no material food quality changes at home because grocery shopping tends to be habitual with mostly automatic decision-making (e.g., Khare and Inman 2006; Machín et al. 2020; Wood and Neal 2009), and household diets seem to not be very malleable (Hut and Oster 2022).
Alternatively, there may be a positive spillover if repeated exposure to healthier food in school as a normal routine makes children more amenable to healthier options and parents more likely to buy them (Maimaran and Fishbach 2014). Children must try less satiating, calorie-light foods (that may be less palatable) about ten times before developing a taste for them (Birch 1999; Sullivan and Birch 1990). Or there may be a negative spillover if households feel licensed to indulge in less healthy food at home (e.g., Khan and Dhar 2006; Wight et al. 2024), or less obligated to serve healthy food at home, because kids are eating healthier food at school. We test the validity of these propositions with our data, which we describe next.
Data
We make use of two main data sets for our analysis: the NielsenIQ Consumer Panel and the nutrition label data provided by Label Insight. We match the nutrition label data with individual items (i.e., Universal Product Code [UPC]) in the NielsenIQ data, which allows us to measure a household's quantity and quality of grocery food purchases.
Dependent Variables: Grocery Food Quantity and Quality
Our primary measure of food quantity is a household's total calories purchased in a given month, scaled by the number of “adult equivalents” in the household (which is based on the typical calorie needs of different age group[s], following Allcott et al. [2019] and Palazzolo and Pattabhiramaiah [2021]) and also by the number of days in the month. Hereafter, we refer to this as calories per capita for simplicity.
Our primary measure of quality is the Nutrient Profile Score (NPS) from the United Kingdom's Nutrient Profiling Model (Dubois et al. 2021; Poon et al. 2018). This model assigns a score to each UPC based on the volume of three healthy components (protein, fiber, and fruits/vegetables/nuts) and four unhealthy components (saturated fat, sugar, sodium, and calories) per 100 grams. We calculate the NPS as prescribed by the UK Department of Health (2011), with two modifications due to data limitations. We detail the calculation of both measures in Web Appendix A.
We are able to match 56% of purchased UPCs in NielsenIQ's six food departments to the nutrition labels in the Label Insight data. The median and mean daily purchase of calories per capita from matched UPCs in our data set are 597 and 686, respectively. These numbers are reasonable given the match rate and a 2,000-calorie daily diet.
In addition to our two primary measures, we also check robustness with total servings and total grocery food expenditure (which covers all food items, not only the matched UPCs) as alternative measures of quantity and an approximation of the USDA's HEI as an alternative measure of quality (see Web Appendix B).
Sample Selection
The NielsenIQ data provide information about whether households include children in one of three age groups: 0–5 years, 6–12 years, or 13–17 years. Children in the United States are eligible to begin kindergarten if they turn 5 years old by the start of a given school year, or shortly thereafter (Ratnam 2023). Given this threshold, we classify a household as part of our treatment group if they have a child in either of the two older age buckets (6–12 or 13–17 years). Because we cannot be sure whether households with children only in the 0–5 age bucket are treated (in some of these households, children of age 5 will be in school), we exclude such households from our sample. We also exclude households that switch into or out of the treatment group during the time under study (i.e., households whose kids age into the 6–12 group partway through the period under study, or whose kids age out of the 13–17 group in that window). We classify households without children as our control group.
As noted previously, the national rollout of the CEP happened after the period of our analysis. However, six states (Illinois, Kentucky, Michigan, New York, Ohio, West Virginia) and the District of Columbia did enact the CEP during our period of study, so we exclude households in affected counties of these states (using publicly available data from Ruffini [2022]). Because we conduct difference-in-difference (DiD) analyses, we also retain only those households that were present in the NielsenIQ panel at least during the 2012 calendar year, to ensure that we have data both before and after treatment (recall that the treatment began in August 2012). We also drop households that moved between counties during the period under study, as we control for county-specific time trends in our model, and location data are only updated at the end of the calendar year.
This leaves 47,468 households, of which 8,292 are classified as treatment households. We further trim our sample to exclude households that do not have reliable reporting of their food purchases or that may be small business owners making very large purchases. We do this by identifying the 5th and 99th percentile of calories per capita in the treatment group pool and excluding households in both the treatment and control group pools below the 5th percentile value and above the 99th percentile value. 2 We use a stricter cutoff at the low end of calories than at the high end because it appears that underreporting is more common than outliers at the high end of the distribution. These screens bring our sample to 43,220 households, of which 7,795 are treatment households. The full set of screens, along with the number of households excluded by each, are summarized in Table 1. 3
Sample Screens and Resulting Sample Size.
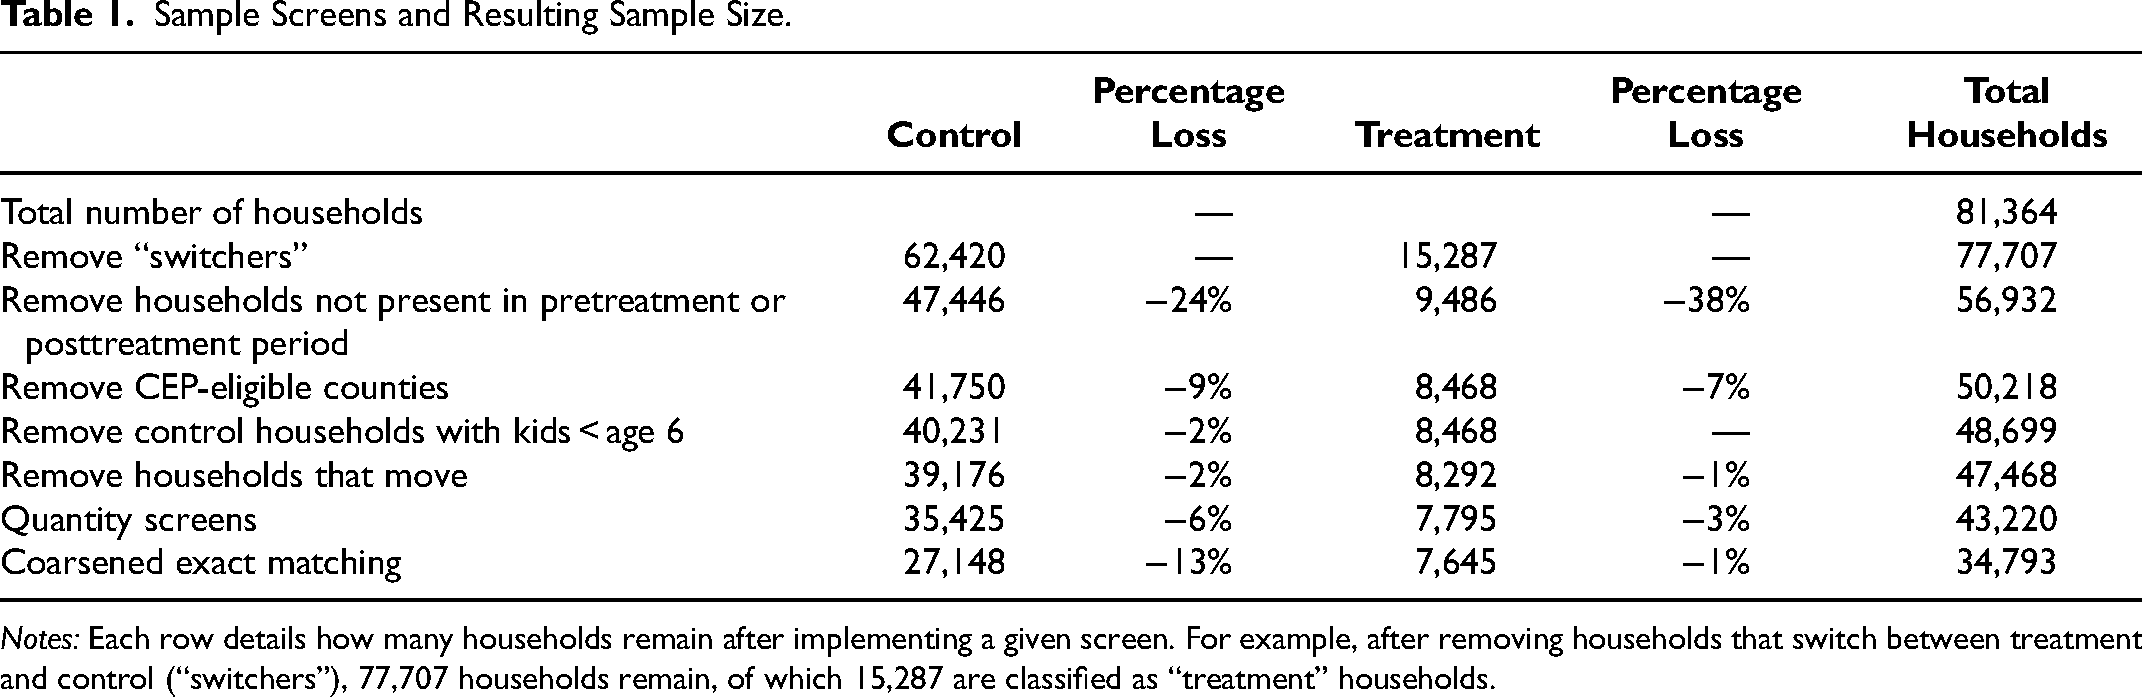
Notes: Each row details how many households remain after implementing a given screen. For example, after removing households that switch between treatment and control (“switchers”), 77,707 households remain, of which 15,287 are classified as “treatment” households.
Identification Strategy
Using households without children as the control group presents a challenge to our identification strategy because households without children may differ from households with children on both observable and unobservable dimensions. We employ coarsened exact matching (Iacus, King, and Porro 2012) for our analyses, matching the control group to the treatment group on key demographic and behavioral variables (e.g., Yan, Miller, and Skiera 2022). The demographic variables are the number of adult household heads; their age, education level, and employment; and the behavioral variables for the two key dimensions of households’ pre-HHFKA grocery food shopping: their average pretreatment quantity (calories per adult equivalent per day) and quality (NPS).
We provide a breakdown of the demographic differences between treatment and control group households before and after matching in Web Appendix A. After matching, the treatment and control groups are well balanced on all the matching variables. Next, 150 treatment households and 8,277 control households that could not be matched are dropped, leaving 7,645 treatment households and 27,148 matched control households for our analyses. We also show results without matching on these variables at all in Web Appendix A for comparison.
In addition to matching, we verify that the parallel trends assumption holds. While we find some differences in the pretreatment shopping baskets of treatment and control households, these differences appear to be a statistical artifact of different seasonal patterns in the purchases of households with and without school-aged children. Households with school-aged children purchase relatively fewer grocery calories per capita during the summer months and around the winter holidays. This seasonal pattern manifests both before and after treatment. We follow (O’Neill et al. 2016) to formally control for these differences in seasonality, and once that is done the parallel trends assumption holds. Complete details are shown in Web Appendix A.
Results: Impact of the HHFKA on the Average Household
Grocery Food Quantity and Quality
We begin by estimating the average response to the HHFKA treatment, using a DiD model of the following form: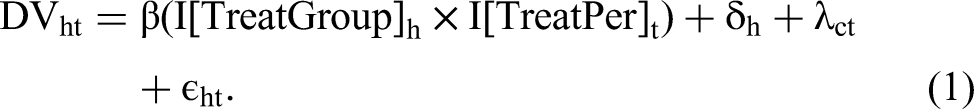
We use the natural logarithm of the calories dependent variable in Equation 1 so that the estimate (when it is small) can be interpreted as the approximate percentage change in the dependent variable. 4 We cluster standard errors at the household level to account for within-household error dependence.
We find that the average household decreased their calories per capita of food purchased at grocery stores by 6.4% in response to the HHFKA's mandated nutrition standards (Table 2). We also find a small reduction (.093) in the nutritional quality of food purchased at the grocery store (Table 2). To put the magnitude of the NPS reduction in perspective, a one-point reduction corresponds to (for example) an additional 4.5 grams of sugar per 100 grams of food (UK Department of Health 2011). A reduction of .093 points, then, corresponds to .42 grams of sugar per 100 grams of food, or about 1.7 extra grams of sugar per day in a 2,000 calorie diet. This may be concerning, as some of the nutrition gains at school may be offset in part by less healthy choices at home.
Mean Effects of HHFKA on Household Food Purchases.
*p < .1.
**p < .05.
***p < .01.
Notes: Standard errors are in parentheses.
We next delve into how the composition of shopping baskets changed, in terms of the quantity and quality of different types of foods. These analyses serve two purposes. First, they provide additional evidence that the reduction in grocery food purchases is likely attributable to substitution toward school meals. Second, they provide some context for how concerned we should be about the observed reduction in grocery food quality.
Quantity and Quality of Different Foods Groups in the Grocery Basket
To address our first purpose, we categorize the grocery foods into two pairs of groups relevant to the topic of study: breakfast and lunch categories versus others, and “kid-friendly” UPCs versus others. Because school meals are a potential substitute for breakfast or lunch, we should expect these foods to show the greatest reduction. We include the following categories from the NielsenIQ “Breakfast and Lunch” data: eggs, milk, yogurt, bagels, breakfast cakes, breakfast food, frozen breakfast food, cereal, doughnuts, breakfast sausage and bacon, fresh bread, and lunch meat. These categories are each strongly associated with breakfast or lunch. We consolidate all other food categories into a broad “other” category, to compare the relative change in breakfast and lunch categories with the change observed for all other foods. 5
Additionally, we categorize individual UPCs of all foods into “kid-friendly” and “not kid-friendly” buckets. “Kid-friendly” UPCs are those purchased considerably more frequently by households with children than by other households. Importantly, kid-friendly UPCs are not purchased only by treatment households, which would have rendered our control group insufficient for these supplemental analyses. Appendix A contains a description of our classification method along with evidence of its face validity.
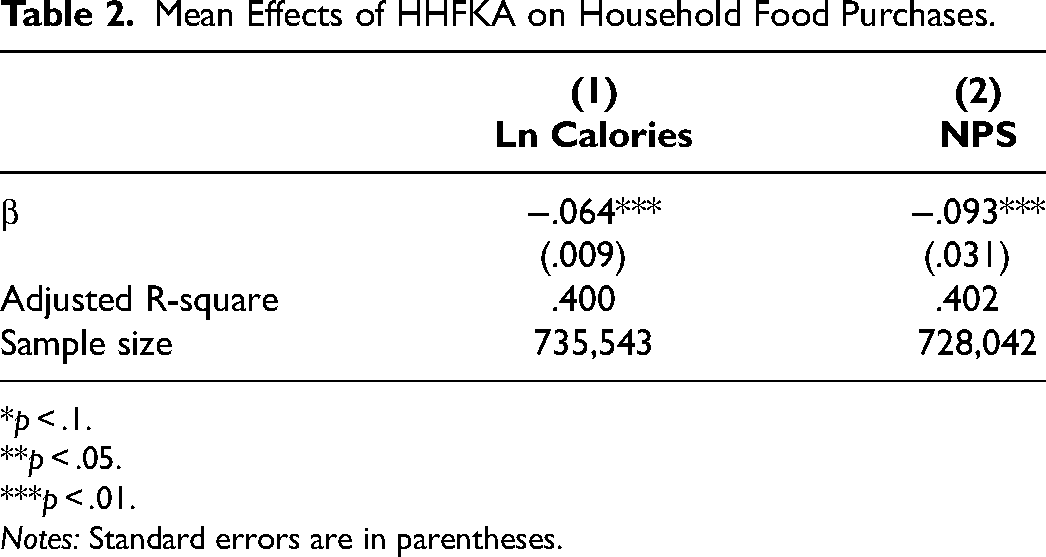
Because households do not purchase in every category every month, category-level quantities have a relatively large number of zeros, and dependent variables should not be log-transformed in the presence of zeros (Chen and Roth 2024). For these analyses, therefore, we construct measures at the household-quarter level of category calories per capita and NPS. 6 We then use these dependent variables in a modified version of Equation 1 (again taking the natural log of calories, and using quarter instead of month as the measure of time) to obtain average treatment effects (ATEs) in each group.
Table 3 shows that the average quantity treatment effect for “kid-friendly” UPCs is more than four times the effect for other UPCs (9.5% vs. 2.1%). The fact that the quantity reduction is so much stronger for foods likely to be purchased for children provides more confidence that the reduction in grocery food reflects HHFKA-induced substitution toward school meals. Also consistent with a substitution toward school meals, we find that households in the treatment group reduced their calories per capita more for categories associated with breakfast and lunch (7.3%), the two meals that can be served at schools, than for other categories (5.5%). 7
ATE for Quantity by Target Audience and Food Group.
*p < .10.
**p < .05.
***p < .01.
Percentage of calories from corresponding group in the average treatment household's shopping basket.
Notes: Standard errors are in parentheses.
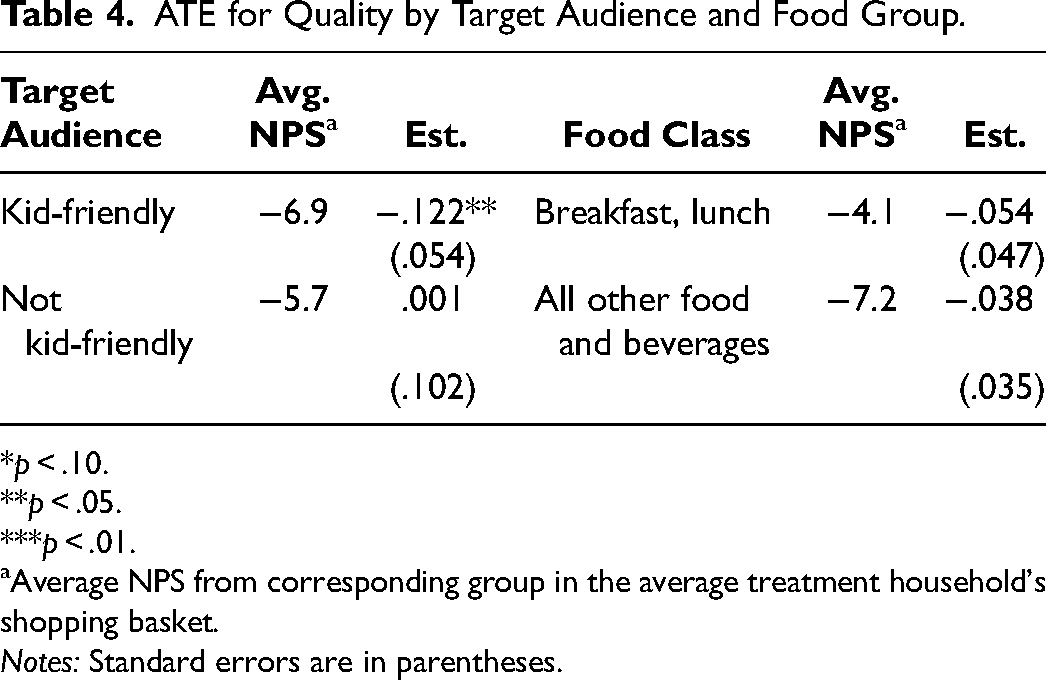
Table 4 presents the corresponding treatment effects for grocery quality. We find that the reduction in grocery quality is strongly driven by kid-friendly UPCs, just as quantity was. In fact, we do not find a statistically significant change in the quality of UPCs that are not kid-friendly. When comparing by category, we do not find a statistically significant change in the nutritional quality of either breakfast and lunch UPCs, or other UPCs, though the estimated effect size for each is still negative and economically small, just as the ATE for the full grocery basket was (−.093). This is suggestive of households continuing their habit-driven shopping at least in categories that are less affected by substitution toward school meals.
ATE for Quality by Target Audience and Food Group.
*p < .10.
**p < .05.
***p < .01.
Average NPS from corresponding group in the average treatment household's shopping basket.
Notes: Standard errors are in parentheses.
Table 4 also presents the average quality for each group measured as the purchase-incidence-weighted average NPS. We note that kid-friendly UPCs are on average somewhat less healthy than others while breakfast and lunch categories are more healthy than others. The reduction in quality of the overall shopping basket may be because the more-healthy products are substituted away to school meals, due to other mechanisms like licensing, or from a combination of both. Our data do not enable us to definitively say which plays a larger role.
To further contextualize the magnitude of the reduction in grocery quality, we conduct a set of calculations to examine how large it is relative to the healthiness of school meals. This also enables an assessment of whether the children who substitute toward school meals are better off, nutritionally.
Comparison of Higher School Meal Quality with Reduced Grocery Quality
The nutritional composition of school meals has been examined in detail by Gearan and Fox (2020), who report the USDA's HEI at the component level (e.g., fruit, vegetables, dairy) for both school breakfasts and lunches. 8 In this section, we compare the reported HEI of these components with corresponding HEI scores for the reduction in nutritional content of groceries.
The general idea behind these calculations is easiest to see with an example. Say that a household purchases 100 fewer calories and 5 fewer grams of saturated fat per day due to the nutrition mandates. We would like to compare the nutritional content of those calories with the calories that presumably replaced them—those coming from school meals. For a given component of the HEI, j, such as saturated fat, we calculate the average household's percentage reduction in that component. We then use that value, along with the 6.4% reduction in the average household's calories purchased, to calculate the quantity of component j per 1,000 calories not purchased due to the nutrition mandate, and the corresponding component-level HEI score.
Not all components of the HEI can be measured using the NielsenIQ data, but six can be: cups of fruit and vegetables, cups of dairy, ounces of “protein foods” (e.g., meat, eggs, beans), ounces of seafood and plant “protein foods” (a subset of all “protein foods”), milligrams of sodium, and grams of saturated fat. These measures make up 50% of the points in the HEI's 100-point scale.
In the first two columns of Table 5, we report the HEI score reported by Gearan and Fox (2020) for each of these four components for (1) school breakfast and (2) lunches, and in the third column we report the HEI score calculated from the NielsenIQ data for (3) the groceries not purchased due to the nutrition mandates. 9 We report the corresponding quantities per 1,000 calories in Columns 4 through 6 (e.g., the groceries not purchased by households in our panel contained 15 grams of saturated fat per 1,000 calories, reported in Column 6, corresponding to an HEI score of 31, reported in Column 3). Details of these calculations are provided in Web Appendix D.
Healthiness of School Meals Versus the Groceries They Were Substituted For.
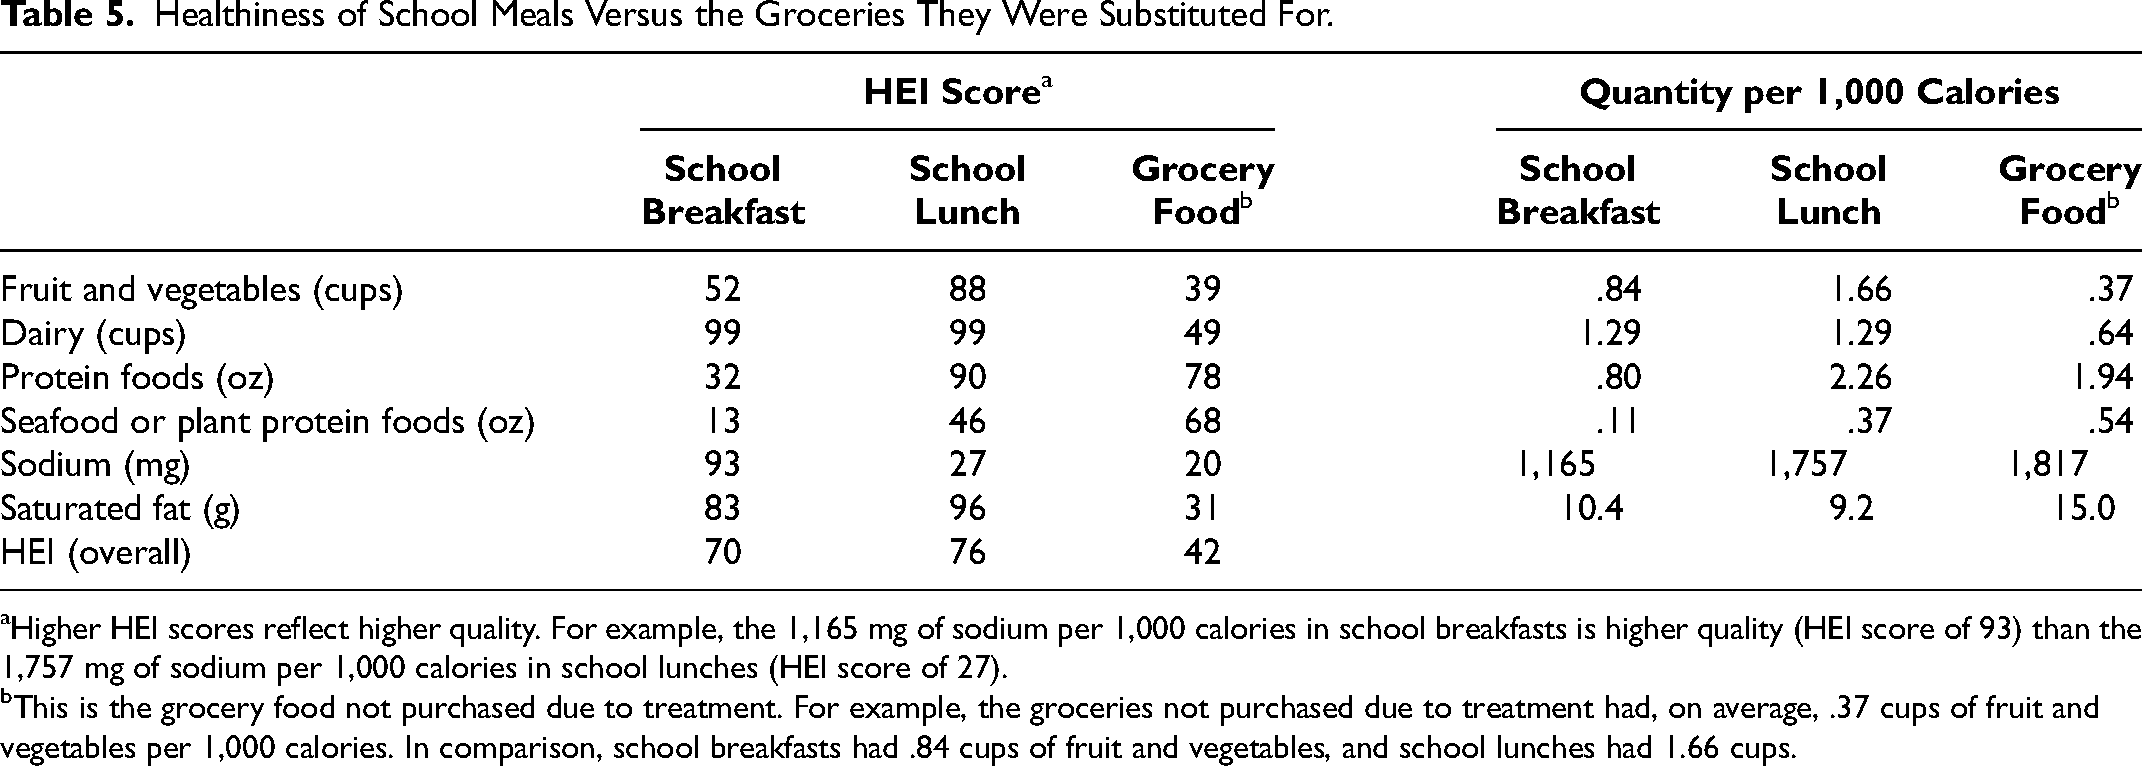
Higher HEI scores reflect higher quality. For example, the 1,165 mg of sodium per 1,000 calories in school breakfasts is higher quality (HEI score of 93) than the 1,757 mg of sodium per 1,000 calories in school lunches (HEI score of 27).
This is the grocery food not purchased due to treatment. For example, the groceries not purchased due to treatment had, on average, .37 cups of fruit and vegetables per 1,000 calories. In comparison, school breakfasts had .84 cups of fruit and vegetables, and school lunches had 1.66 cups.
Table 5 shows that school meals were much lower in sodium and saturated fat and higher in fruit, vegetables, and dairy compared with the food estimated to be removed from grocery baskets. The HEI scores for these components were considerably better in school meals than in the grocery foods substituted for those meals. The improvement for saturated fat is particularly large; grocery food contained about 50% more saturated fat than school meals, and had a much lower HEI score (31, vs. 83 and 96 for school breakfasts and lunches). School breakfasts were lower in protein foods, however. We also compute the overall HEI for school breakfasts, lunches, and groceries not purchased, scaled for the subset of measures available to us. Overall, school breakfasts (70 on the HEI) and lunches (76 on the HEI) were considerably healthier than the calories households did not purchase due to the nutrition mandates (42 on the HEI). It is therefore fair to say that posttreatment healthiness of school meals dwarfs the reduction in healthiness of grocery food purchases along these dimensions.
Which Households Are Changing Their Grocery Food Shopping?
We next examine which households changed their shopping baskets in response to the HHFKA's updated nutritional standards. Health policy research has often been evaluative, for example, seeking to measure the extent to which the HHFKA improved the healthiness of school meals, especially for low-income students. Our goal is more prospective. We leverage the unique shock to the food landscape afforded by the HHFKA to examine who changed their behavior so that we can learn what types of consumers might be more amenable to changing the composition of food they eat in the future, and why they might do so. Our analysis of heterogeneity in treatment response focuses on the three literature-based drivers of school meal participation and healthy eating that we highlighted previously: time constraints, financial constraints, and nutrition literacy. We conduct the heterogeneity analysis in two ways: by introducing moderators into the DiD model of Equation 1 and by estimating a causal forest model. Neither model shows meaningful heterogeneity in the quality effect linked to the observed variables, so we focus our attention on quantity, but we discuss heterogeneity in the quality effect in Web Appendix E.
Measures for Analyses
We compile household-level indicators of these three drivers from the demographic and pretreatment purchase data in NielsenIQ, and a few regional socioeconomic measures from other sources. The variables are discussed subsequently, and their definitions are provided in Table 6.
Model Variables and Definitions.
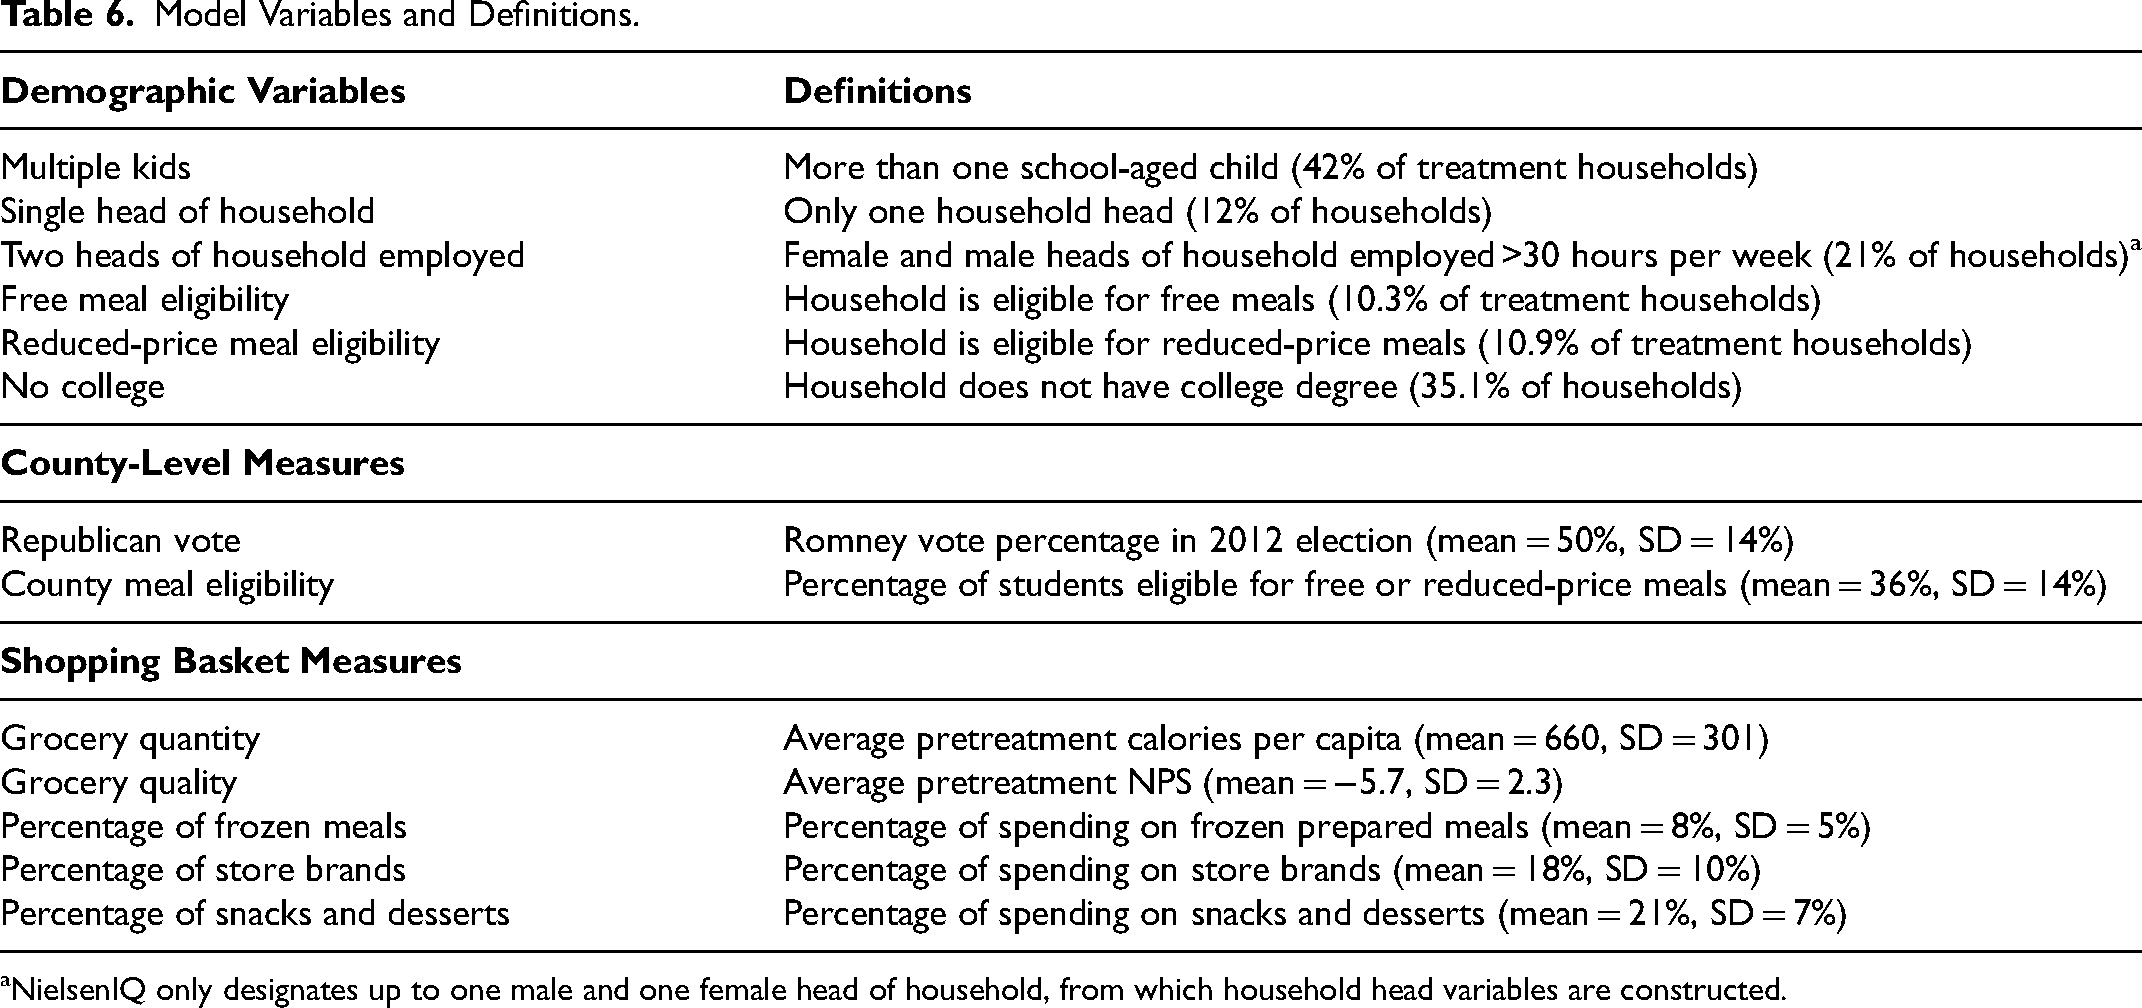
NielsenIQ only designates up to one male and one female head of household, from which household head variables are constructed.
Time constraints
Several demographics in the NielsenIQ data are likely to be associated with time pressure: being a single parent, being fully employed, and having more children (e.g., Ailawadi, Neslin, and Gedenk 2001; Bronnenberg, Klein, and Xu 2023). The propensity to buy more frozen prepared meals (frozen food other than desserts and unprepared meat) in the pretreatment period is also indicative of time pressure.
Financial constraints
Household income is the most commonly used measure of a household's financial capacity. However, whether a household is eligible for free or reduced-price school meals is a measure of financial constraints that is more closely related to our context. We identify each household's eligibility based on their income and household size using the 2011 federal guidelines (USDA Food and Nutrition Service 2011). We also use a county-level measure of school meal eligibility: the percentage of households eligible for free or reduced-price meals in 2011 (from the online data accompanying Ruffini [2022]). 10 In addition, we use the propensity to buy more store brands, which are generally priced substantially below national brands, as a behavioral indicator of financial constraints.
Nutrition literacy
We use the education level of the household as an indicator of preference for and knowledge of nutrition (e.g., Allcott et al. 2019; Hawkins, Cole, and Law 2009; Ma et al. 2011). While education is an imperfect proxy for nutrition knowledge, Allcott et al. (2019) find that education is actually more strongly correlated with the healthiness of households’ shopping baskets than nutrition knowledge is. As a behavioral measure, we also use the household's pretreatment propensity to buy snacks and desserts (which are known to be poor on nutritive value).
Pretreatment grocery food purchases
The quantity (i.e., calories per capita) and quality (NPS) of grocery food purchased by a household before the HHFKA treatment are likely to reflect a combination of these drivers. Specifically, low pretreatment quantity may reflect time pressure as households who have less time are likely to buy less food to prepare at home and rely more on outsourcing meals (e.g., fast food, school meals). Among low-income households, it may also reflect food insecurity due to financial constraints. Low pretreatment quality may reflect time pressure because busy households buy more convenient, prepared foods that are generally less healthy; it may reflect financial constraints because healthy foods tend to be more expensive; and, of course, it may reflect the level of nutrition literacy.
Finally, because the political environment surrounding the HHFKA was divisive, we also include a measure of whether a county voted for Mitt Romney or Barack Obama in the 2012 U.S. presidential election, collected from the MIT Election Data and Science Lab (2018). Doing so helps us explore the role played by political inclination in influencing school meal participation.
Difference-in-Difference Analysis of Heterogeneity
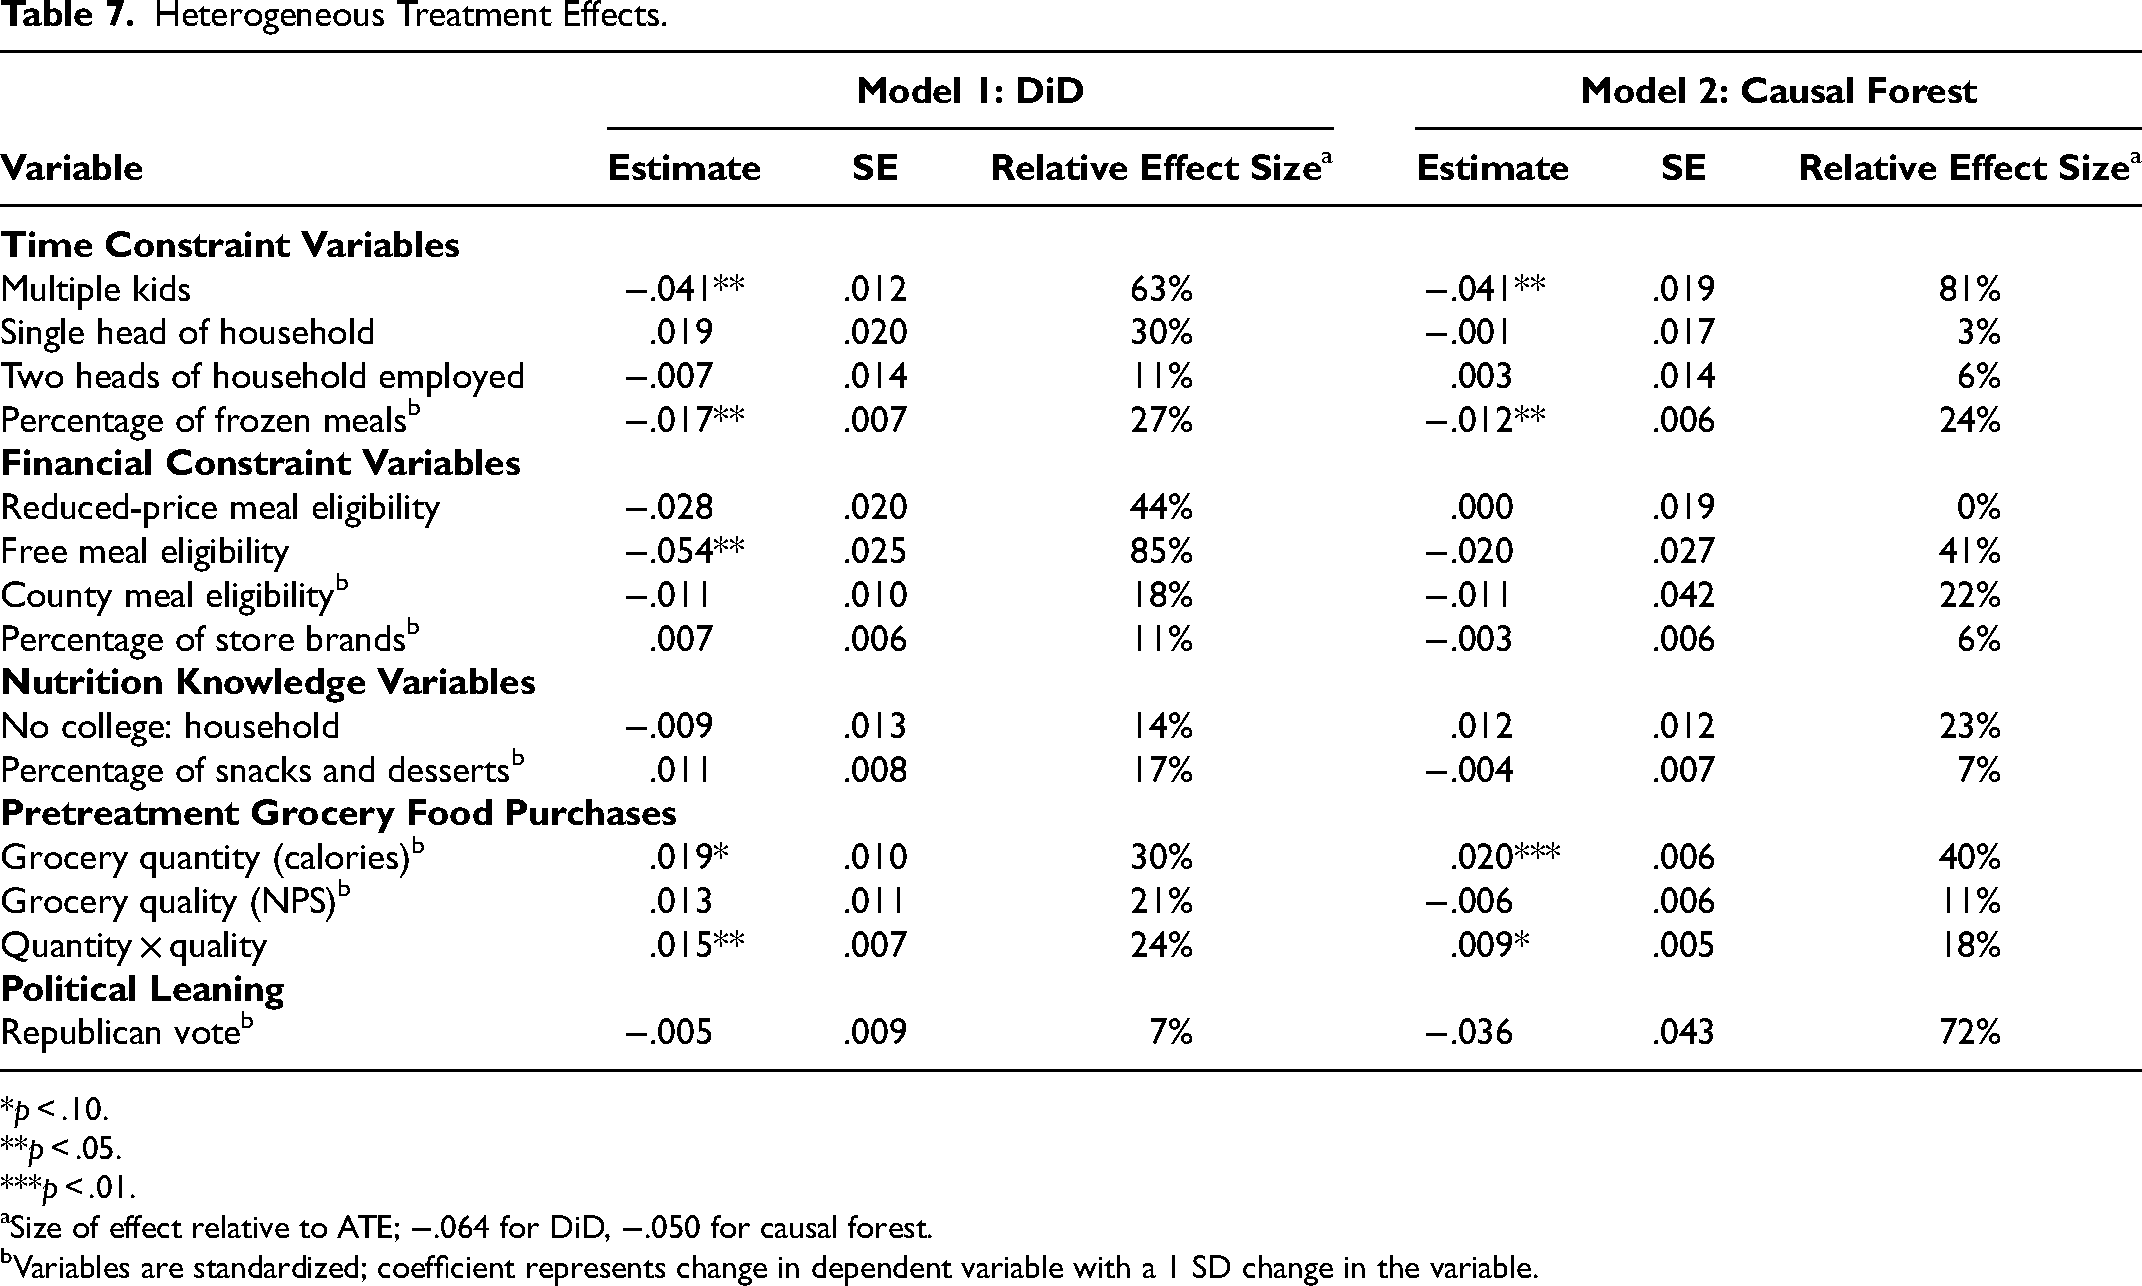
We return to the DiD model in Equation 1 and interact the DiD term with the variables in Table 6. Estimates for these interactions are shown in the Model 1 columns in Table 7. All continuous variables are standardized for ease of interpretation, and standard errors are clustered at the household level as before.
Heterogeneous Treatment Effects.
*p < .10.
**p < .05.
***p < .01.
Size of effect relative to ATE; −.064 for DiD, −.050 for causal forest.
Variables are standardized; coefficient represents change in dependent variable with a 1 SD change in the variable.
In general, behavioral variables are stronger predictors of HHFKA response than demographics, a common pattern that has been documented in many other domains in marketing. A prime example is the strength of previous recency, frequency, and monetary value of purchases as predictive measures of customer response to new retail policies and new channels.
Time constraints are associated with more negative response to treatment, that is, bigger shifts from grocery to school meals. Households with multiple children have an additional 4.1% reduction in grocery quantity, a substantial effect that is about 64% as large as the ATE of −.064. Having multiple children (relative to only one) increases the time burden in the form of care and food preparation, and it also increases the amount of time saved by switching to school meals and away from preparing food at home. Households with a greater reliance on frozen prepared meals also have stronger response to treatment: An increase of one standard deviation in this variable is associated with an additional 1.7% reduction in grocery quantity, which is 27% as large as the average effect. Households that relied less on the grocery store for their calories also responded more strongly to treatment, with a decrease of one standard deviation in pretreatment quantity being associated with a 1.9% additional reduction in posttreatment grocery quantity, 30% of the size of the ATE.
Financial constraints are also associated with a more negative treatment effect. A household's eligibility for free school meals is associated with an additional 5.4% reduction in grocery quantity, which is 85% as large as the average effect.
While neither of our two indicators of nutrition literacy has a significant moderating influence, we do find that households with the least healthy shopping baskets have a stronger response to treatment than others. Specifically, we find that the relationship between treatment effect and pretreatment shopping basket quantity is larger for households that also purchase lower quality groceries in the pretreatment period. Households that are one standard deviation below the mean on both shopping basket quantity and quality reduce their posttreatment grocery quantity by 3.4% more than the average household, a magnitude that is 53% as large as the ATE. We explore the relationship between quantity and quality in additional detail in Web Appendix E.
Recall that household pretreatment shopping basket quantity and quality are likely to be driven by a mix of the three drivers studied. To provide additional context for these relationships, we ran separate regressions of pretreatment quantity and quality on household demographics. The results, reported in Appendix B, support our reasoning. Demographics have a significant association with pretreatment purchases even if they do not directly predict response to treatment. Busier households bought groceries of significantly lower quantity and quality prior to treatment; both of these factors in turn were associated with stronger treatment response. Similarly, lower-income households purchased lower quality groceries. Finally, less-educated households purchased lower quality groceries as well (a pattern associated with a stronger response to treatment), though they also purchased higher quantities of groceries (which is associated with a weaker response to treatment); this mixed relationship between education and pretreatment shopping basket variables is consistent with our finding of no direct relationship between education and treatment response.
Overall, this analysis suggests that the households most drawn to the healthier meals made available by the HHFKA were those who were likely accustomed to outsourcing meals, those who were financially constrained, and those who purchased less healthy food for the home. These households gravitated toward school meals, which now served as a healthy alternative to food at home but also as a time-saving alternative to preparing food for one's own children.
One might expect that these households were already participating in the school meal programs, and that they might not have had much room to further substitute away from the grocery store toward school meals. Instead, we find evidence consistent with greater substitution toward school meals by such households. This is encouraging from a welfare perspective because these are the households that may need the most help achieving a healthy diet. It is also encouraging to find evidence that more of the financially constrained households were drawn toward the now-healthier school meals even without the cost of meals being reduced.
Causal Forest–Based Analysis of Heterogeneity in Treatment Effects
We also conduct a causal forest–based analysis as a robustness check for our heterogeneous DiD results and to see whether it reveals additional sources of heterogeneity. The logic behind the causal forest is to construct, for each treated household, a weighted set of matched control households with similar covariates to obtain individual treatment effects. Unlike traditional matching methods, the causal forest method is both nonparametric and resilient to model misspecification (Wager and Athey 2018). The dependent variable for the causal forest is the difference between the natural log of posttreatment and the natural log of pretreatment calories.
We provide relevant diagnostics linked to our causal forest construction in Appendix C and estimation specifics in Web Appendix E. The ATE for quantity using the causal forest is −.050 (SE = .006), substantively consistent with our DiD-based estimate of −.064 (the 95% confidence intervals for the two estimates overlap). 11 The ATE for quality is almost identical to the DiD-based estimate at −.095 (SE = .019).
The second model in Table 7 examines heterogeneity in individual treatment effects by regressing doubly robust scores for each household on the variables of interest (Chernozhukov et al. 2018). A comparison between the two models in the table shows that there is remarkable consistency between the two sets of estimates, except that eligibility for free meals is not statistically significant in the causal forest analysis. 12
Discussion
In this research, we have studied the impact of the HHFKA's nutrition standards on the grocery food purchases of a large national sample of households. We have examined whether there was substitution away from or toward grocery stores, whether there were any desirable or undesirable changes in the quality of grocery food purchases, and which types of households gravitated most toward the now-healthier school meals. Our findings linked to these three research questions are supported across several robustness checks (detailed in the Web Appendix). They have important implications for marketers, marketing researchers, and policy researchers, which we discuss subsequently.
Substitution Away from Grocery Stores
We find that the HHFKA's improved nutrition mandates alone resulted in a substantial substitution away from grocery food purchases (a 6% reduction in calories, and a 4% reduction in spending). This demonstrates that making the food available for consumption healthier, all else equal, can increase its demand. The magnitude of the effect is quite comparable to that of the CEP, which expanded eligibility for free and reduced-priced meals. Handbury and Moshary (2021) and Marcus and Yewell (2022) find that the CEP led to an average reduction in grocery food spending of 6.6% and 5%, respectively.
From a policy perspective, this finding suggests a significant win. The revised nutrition standards not only made school meals healthier; it made them more popular, even in the absence of expanded eligibility for free or reduced-price meals. Interestingly, while opponents of the HHFKA had predicted a decrease in school meal consumption due to increased nutrition standards (Yee 2012), even proponents had not forecasted an increase, instead typically arguing that participation would hold steady. For marketing researchers, our finding suggests that, at least in the medium run, any negative influence of lay theories such as healthy food being less tasty is more than offset by the positive influence of sustained provision of healthy food, especially in an environment where one's peers are also eating it.
Both retailers and manufacturers were affected by the HHFKA's nutrition mandates, which exerted pressure on grocery sales. The 4.4% reduction in spending among households with kids translates to a roughly 1.4% revenue loss for grocery retailers due to the HHFKA's nutrition mandates. 13 This is a meaningful loss in light of the slim net margins in grocery retail. When faced with similar pressure from the CEP, retailers responded by reducing prices in affected regions (Handbury and Moshary 2021). Here, however, competitive pressure does not come from school meal price reductions, but from major changes to the composition of school meal offerings. Thus, major changes to the composition of what is offered at the grocery store may be needed to bring back sales lost due to the higher nutrition standards, as opposed to the more commonly observed incremental changes to product lines. Relatedly, the school meal program is itself a large revenue source for manufacturers whose products fit the nutritional requirements of the HHFKA. Kraft Heinz attempted to reformulate its Lunchables products to meet the requirements so that they could be part of the school meal program (Newman 2023), and other manufacturers such as Tyson, Yoplait, and Schwan’s participate as well (Schwartz and Maroney 2021).
There are similar recent examples of marketers responding to policy interventions, sometimes, though not always, in ways that can further benefit consumers. Recent research shows that firms have responded to nutrition or warning labels by reformulating their foods to be healthier (Alé-Chilet and Moshary 2022; Barahona, Otero, and Otero 2023; Lim et al. 2020) though the Nutrition Labeling and Education Act–standardized labeling reduced the nutritional quality of food at the grocery store (Moorman, Ferraro, and Huber 2012). Other research shows that some firms also respond to such labels by changing prices, increasing them for labeled products and decreasing them for unlabeled products (Pachali et al. 2023), and respond to soda taxes by reducing their promotion frequency and depth (Keller, Guyt, and Grewal 2024). Our findings on which households responded most strongly to the nutrition mandates, to be discussed next, shed additional light on how manufacturers and retailers might respond to competitive pressure from mandated nutrition standards in ways that could be positive both for the firms and for customers.
Who Substitutes and Why
The profile of households that substituted more toward school meals provides a signal of what types of households might not be currently well served by the options available at the grocery store. These households might be open to changing what they eat in other ways going forward, should suitable options become available. Time-pressured households, who relied less on the grocery stores for their food needs and bought more frozen prepared foods, responded more strongly to treatment. This should be of particular interest to retailers and manufacturers, as well as to those in the policy space. Its implications contrast with recent efforts to promote healthier eating by steering consumers away from premade meals and toward more nutritious options that require greater preparation (Belahsen 2014; Lin and Guthrie 2012; Matsumoto et al. 2021). These initiatives have been promoted by the USDA and received coverage by the Mayo Clinic (2024) and in various media outlets.
Our findings suggest that, instead of summarily discouraging households from relying on convenience food, making healthy and convenient foods more readily available may be a more productive goal. This would also be in line with previous research that finds “convenience enhancements” are more effective at encouraging healthy eating than a battery of alternative nudges (Cadario and Chandon 2020, p. 478). It is also in line with a recent push by some states to allow SNAP (Supplemental Nutrition Assistance Program) benefits to be used for the purchase of hot meals, because SNAP recipients often face barriers to cooking healthy meals at home, including not only time constraints but also a lack of cooking equipment and storage space (USDA Food and Nutrition Service 2021).
The fact that those who substituted most were also previously buying less healthy food underscores the distinction between buying unhealthy food and preferring unhealthy food. Households may want to provide healthy meals for their children but may not have the knowledge, money, or time to do so at home (recall that lower education, lower income, and time constraints were all associated with lower pretreatment grocery quality). Their greater level of substitution toward school meals is encouraging, as they had the most to gain from eating healthier meals. It also suggests that these households’ tendency to purchase less healthy foods at the grocery store is not fait accompli. The fact that financially constrained households also gravitated more strongly toward the now-healthier school meals is interesting, given that the CEP had not yet reduced the price of meals for these households in the period under study.
It is notable that financially constrained and time-constrained households would be expected to already have higher levels of participation before the nutrition standards were changed. Yet, they gravitated more strongly toward school meals due to the change. The fact that substitution toward the healthier school meals was not more uniform across households is a positive finding. The HHFKA represents an expensive undertaking by the federal government to improve the nutritiousness of the food served to children. While the goal of such efforts is to provide healthy food to all kids, the emphasis is rightly on food-insecure, underprivileged children for whom the school meals may be the healthiest they eat. Households with the financial, time, and cognitive resources to provide healthy meals from home and at home substituted at a lower rate into the healthier school meals, suggesting that the government's resources are spent more on helping the subpopulations that need them the most.
Small Impact on Grocery Food Quality
Our finding that there is a small reduction in the nutritional quality of grocery food likely attributable to the policy change also provides food for thought. On the positive side, our calculations suggest that this decline is dwarfed by the gains that children receive by substituting toward school meals. Clearly, however, there is no evidence of a positive spillover: It does not appear that exposure to healthier meals at school led kids and/or their parents to become more open to healthy foods at home, at least during the first year of implementation.
Limitations and Conclusions
Our research has a few limitations owing mainly to the nature of our data. First, we use the presence of school-aged kids in the household as a proxy for a household's opportunity to receive treatment. We do not directly observe household/student-level food provided at school, as no comprehensive database that records such information at the household level currently exists (as far as we know). Access to such data would enable an alternative means of validating our estimates. However, the types of UPCs driving the estimated treatment effect (“kid-friendly” UPCs, those associated with breakfast and lunch) and the robustness of the effect strongly suggest that households’ reduction in grocery purchases does reflect substitution toward school meals. Second, we use observable proxies for time constraints and nutrition knowledge, which are less easily measured by demographics than financial constraints. Moreover, even income may represent more than one driver; scarcity of time and money can tax the bandwidth of low-income households (Mullainathan and Shafir 2013). Third, we do not observe household food purchases from sources other than the grocery store. It is conceivable that the HHFKA's nutrition standards also had an impact on (for example) food purchased at fast-food restaurants.
Our findings are especially timely as the school meal program continues to undergo changes. The landscape of school meal programs continues to fluctuate, as political factions have actively pursued measures to either fortify or relax the regulations governing school meals since the enactment of the HHFKA. The Trump administration aimed to weaken the nutritional guidelines, while the USDA recently announced even more rigorous nutrition standards for school meals (Riley 2023). In the future, Republicans hope to eliminate the CEP (Thakker 2023). Understanding the implications of these policies is crucial for retailers and for manufacturers whose products are sold in their stores, in addition to being crucial for those in the policy space.
In sum, this research leverages a unique opportunity afforded by the HHFKA to shine a light on the types of households that change their shopping basket in response to an essential food option (school breakfasts and lunches) becoming markedly healthier, and documents how their shopping basket changes. Our findings add to a valuable knowledge base that marketers and nutrition policy advocates can utilize in efforts to encourage households to adopt healthier diets.
Supplemental Material
sj-pdf-1-mrj-10.1177_00222437241291481 - Supplemental material for Groceries or School Cafeterias: How Households Respond to School Nutrition Mandates
Supplemental material, sj-pdf-1-mrj-10.1177_00222437241291481 for Groceries or School Cafeterias: How Households Respond to School Nutrition Mandates by Mike Palazzolo, Zoey Hu, Kusum Ailawadi and Adithya Pattabhiramaiah in Journal of Marketing Research
Footnotes
Appendix A: Classification of “Kid-Friendly” UPCs
To identify kid-friendly UPCs, we consider UPCs that have at least 30 purchases in total, so that we can be confident we have sufficient data on which to base the “kid-friendly” label. We calculate the percentage of each UPC's total purchases that are made by households with school-aged kids (i.e., treatment households) versus purchases made by control households. We label as “kid-friendly” the UPCs that fall above the 75th percentile in the distribution of this percentage for treatment households. All other UPCs, including those that are purchased less than 30 times in total, are included in the “all other UPCs” group. Consequently, some UPCs that are targeted at children but infrequently purchased are classified as not “kid-friendly,” making our estimate of the difference between these two groups of UPCs more conservative. This cutoff translates to a purchase rate of kid-friendly UPCs that is about twice as big for treatment households as for control households. Kid-friendly UPCs are critically not UPCs purchased only by treatment households, which would render our control group insufficient for these supplemental analyses. These UPCs make up 38% of treatment household calories and 25% of control household calories.
Our approach—using a reasonable numerical cutoff, as opposed to relying on researcher intuition to identify “kid-friendly” UPCs—has pros and cons. It avoids researcher bias, but also necessarily means some UPCs will actually be UPCs geared toward parents of children, rather than toward children themselves. Nonetheless, the measure of being “kid-friendly” should be strongly correlated with UPCs purchased for children, sufficient for our goal of illustrating that UPCs for children are a strong driver of the reduction in calories we observe.
As a test of the face validity of our classification procedure, we examined the cereal category, in which products are largely well known and in which kid-friendly UPCs are easy to identify by name. The findings suggest that our classification method has strong face validity. The ten cereals most frequently labeled as “kid-friendly UPCs” are kid-branded cereals: Berry Colossal Crunch, Marshmallow Mateys, Frosted Flakes, Cinnamon Toast Crunch, Frosted Mini-Wheats, Life, Cocoa Puffs, Lucky Charms, Apple Jacks, and Cocoa Pops. The categories with the highest and lowest shares of “kid-friendly” UPCs also show face validity. The top five categories, for example, are baby food (36%), breakfast food (34%), dry mixes (tortillas, pasta, and rice; 31%), gum (31%), and pizza (30%). The bottom five categories are yeast (11%), nuts (16%), coffee (17%), canned seafood (17%), and canned fruit (19%).
Appendix B: Association of Demographics With Pretreatment Quantity and Quality
We present here the results from regressions of treatment household h's (1) pretreatment quantity (calories per capita) and (2) pretreatment quality (NPS) on the demographic and socioeconomic variables from Table 7 in the article. Both dependent variables are standardized to easily compare coefficient magnitudes. We see a negative relationship between pretreatment shopping basket quantity and quality and the variables associated with time constraints, suggesting that time constraints reduce households’ reliance on the grocery store and impede the healthiness of their purchases. Income has a negative relationship with the quality of groceries. Finally, less educated households purchased less healthy groceries in the pretreatment period, but relied more on the grocery store for their calories (i.e., consumed a higher quantity of calories).
Appendix C: Causal Forest Diagnostics
Following the approach outlined by Imbens and Rubin (2015), we evaluate the balance of observables between the treatment and control group using the standardized absolute mean differences metric. As shown in Figure C1, our matched treated and control households are largely indistinguishable based on their observed characteristics.
We ensure that our forest is well calibrated using the recommended metrics. A coefficient of 1 for the mean forest prediction measure suggests that the mean forest prediction is correct, while a coefficient of 1 for differential forest prediction additionally suggests that the heterogeneity estimates from the forest are well calibrated. The mean forest prediction of our model for shopping basket quantity is 1.01 (p < .01), and the differential forest prediction metric takes a value of .75 (p < .05), confirming our model's ability to successfully uncover heterogeneous treatment effects (Athey and Wager 2019). We show the distribution of treatment effects for quantity across households in Figure C2. A full description of the data and estimation approach can be found in Web Appendix E.
Acknowledgments
Researchers' own analyses were calculated (or derived) based in part on data from Nielsen Consumer LLC and marketing databases provided through the NielsenIQ Datasets at the Kilts Center for Marketing Data Center at The University of Chicago Booth School of Business. The conclusions drawn from the NielsenIQ data are those of the researchers and do not reflect the views of NielsenIQ. NielsenIQ is not responsible for, had no role in, and was not involved in analyzing and preparing the results reported herein.
Coeditor
Brett R. Gordon
Associate Editor
Bryan Bollinger
Declaration of Conflicting Interests
The author(s) declared no potential conflicts of interest with respect to the research, authorship, and/or publication of this article.
Funding
The author(s) received no financial support for the research, authorship, and/or publication of this article.
Notes
References
Supplementary Material
Please find the following supplemental material available below.
For Open Access articles published under a Creative Commons License, all supplemental material carries the same license as the article it is associated with.
For non-Open Access articles published, all supplemental material carries a non-exclusive license, and permission requests for re-use of supplemental material or any part of supplemental material shall be sent directly to the copyright owner as specified in the copyright notice associated with the article.