
Abstract
Business-to-business suppliers invest in safety training programs believing that such programs mitigate safety hazards, prevent workplace injuries, and create value for their customers. However, causal evidence of these effects is sparse. Study 1 uses site-level monthly data from a global oil field services company. Exploiting sharp discontinuities in safety training hours due to catastrophic accidents, the authors find that a 10% increase in safety training hours per capita decreases safety hazards per capita by 6.45%–9.57%. Study 2 measures the causal impact of business establishments’ safety training intensity on their workplace injuries: it leverages Local Law 196 requiring workers at construction establishments in New York City to complete at least ten hours of safety training. This legislation reduced injury rates at construction establishments in New York City by .54–.68 percentage points (a 15.56%–18.84% decrease) relative to their counterparts. Study 3, a stated-choice conjoint experiment of business-to-business procurement professionals, documents that the focal supplier's investment in safety training increases the probability of its proposal being selected by those professionals. Collectively, these findings validate the need for suppliers to invest in safety training as a risk-mitigation vehicle that has positive implications for business-to-business buying decisions.
Keywords
In the business-to-business (B2B) buying process, customer/buyer firms (hereinafter, “customers”) evaluate prospective supplier firms (hereinafter, “suppliers”) based on attributes such as quality, on-time delivery, price, and after-sales support (for a review, see Ho, Xu, and Dey [2010]). On the demand side, emerging anecdotal evidence suggests that B2B customers consider suppliers’ safety performance (e.g., low workplace injuries) an important value-added attribute in the B2B buying process. For example, over 750 B2B customers in 20 industries report that they use suppliers' safety performance ratings to mitigate risk in customer–supplier partnerships. 1 , 2 Moreover, descriptive evidence suggests that a supplier's safety performance is positively associated with its service quality (e.g., fewer delays and disruptions in service; Choo and Grabowski 2018), customer value (Mittal et al. 2021; see also Web Appendix A), and firm value (Cohn and Wardlaw 2016). On the supply side, suppliers advertise their commitment to safety when communicating with customers. For example, Weatherford International, an oil field services company, states, “Our vision is to be a company that is [safety] incident free, delivers on our promises to our customers … we lead with a commitment to safety and service quality. It is embedded in our culture and everything we do.” 3
In this research, we measure the value of safety training programs, 4 a prevalent supplier investment that aims to enhance safety performance by mitigating safety hazards and preventing workplace injuries. In 2020, about 41% of publicly traded U.S. companies had invested in safety training programs, 5 seeking the occupational safety training services of a $1.9 billion industry (O’Malley 2023). Despite this belief, two critical questions remain empirically unanswered.
First, it remains unclear whether and to what extent suppliers’ investments in safety training programs mitigate safety hazards and prevent workplace injuries. An industry survey of 1,071 practitioners from 4,425 workplaces shows that companies “struggle to verify the effectiveness of their safety training programs” (Intertek Alchemy 2021). Moreover, although academic studies show that safety training programs encourage employees’ knowledge acquisition and self-reported safety behaviors, they fail to conclusively establish the causal impact of safety training programs on objective safety outcomes such as safety hazards and workplace injuries (for systematic reviews, see Burke et al. [2006, 2011], Cohen and Colligan [1998], and Robson et al. [2012]). Measuring the causal impact of safety training programs on safety outcomes is challenging because analyses with cross-sectional data do not account for unobserved time-invariant characteristics that simultaneously drive safety training and safety outcomes (e.g., persistent differences in training assignments chosen by suppliers). Even with panel data, identification is complicated due to the simultaneity of safety training and the occurrence of hazards and injuries—that is, riskier sites tend to have more intense safety training. 6
Second, it remains unclear whether B2B customers value suppliers’ investments in safety training programs. A prospective supplier's investments in safety training programs may reduce B2B customers’ perceived risk because they demonstrate the supplier's ability to mitigate safety hazards and prevent workplace injuries. As a result, all else equal, B2B customers should be more likely to select the supplier that invests more in safety training. Yet establishing this relationship is challenging. On the one hand, it is prohibitively difficult to run a field experiment to randomize the variation in safety training at the supplier level (Hada 2021). On the other hand, with observational data, it is difficult to identify the effect of suppliers’ safety training investments on customers’ supplier selection because of unit-specific correlated unobservables (Grewal and Sridhar 2021).
Accordingly, we combine two studies with quasi-experimental designs and an online stated-choice conjoint study as summarized in Table 1. Study 1 measures the causal effect of a B2B supplier's safety training intensity (measured as safety training hours per capita) on safety hazards (measured as the number of safety hazards per capita) based on a global oil field services company's site-level monthly data from January 2008 to August 2018. To ameliorate the simultaneity between safety training and safety hazards, we leverage the timing and locations of unexpected catastrophic accidents, which induced a sharp increase in safety training hours as arguably exogenous variation. We establish the exclusion restriction by (1) ruling out alternative channels through which catastrophic accidents may affect hazards and (2) providing evidence that does not suggest the direct effect of catastrophic accidents on hazards. We show that, on average, a 10% increase in monthly safety training hours per capita (.36 hours per person) leads to a 6.45% to 9.57% decrease in monthly safety hazards per capita (17.8 to 26.4 events per site).
Overview of Research Design.
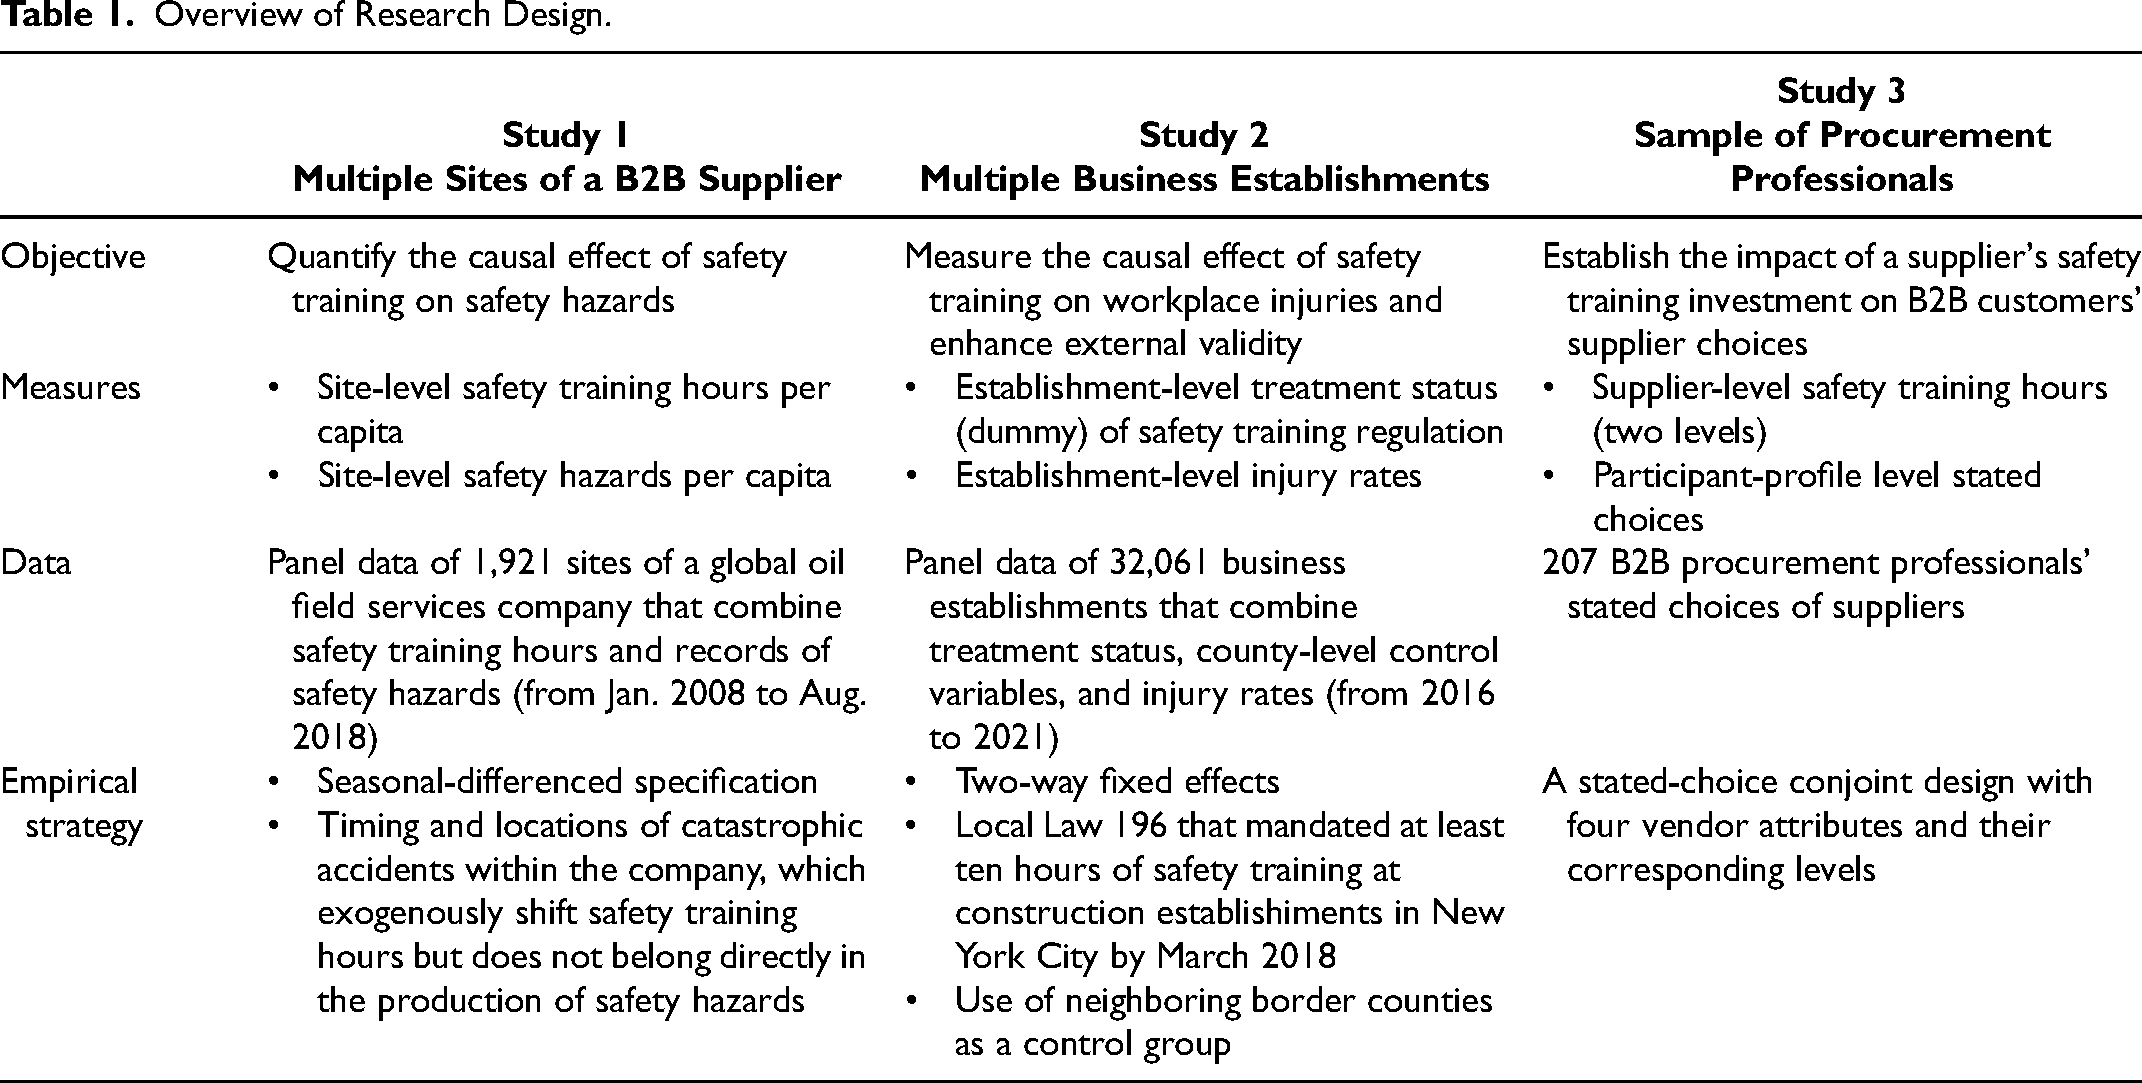
Study 2 uses Local Law 196 in New York City to measure the causal impact of safety training on injury rates at 32,061 business establishments in the state of New York. Local Law 196 required workers at establishments in construction (i.e., the first two digits of the North American Industry Classification System [NAICS] code are 23) in New York City (not in the rest of New York state) to complete at least 10 hours of safety training by March 2018. Employing a difference-in-differences (DID) design, we find that after the law was enacted, injury rates decreased by .54–.68 percentage points (a 15.56%–18.84% decline) at treated establishments in New York City relative to their counterparts.
Study 3 presents a stated-choice conjoint experiment with 207 B2B procurement professionals. In a hypothetical scenario, each participant considered six sets of prospective suppliers of electrical submersible pumping systems in the oil and gas sector (i.e., in total, 12 prospective suppliers) and selected a supplier from each set. We consider four attributes and their corresponding levels in each supplier profile—product quality, after-sales support, safety, and price. We find that along with product quality, price, and after-sales support, a prospective supplier's investment in safety training (measured as safety training hours per employee) increases customers’ willingness to select the supplier.
Collectively, this research makes several contributions to marketing literature and practice. First, we unambiguously measure the causal effects of safety training on mitigating safety hazards (Study 1) and preventing injuries (Study 2). Specifically, these effects have direct financial implications for suppliers. For an average establishment, the conservative return on safety-training investment is 42%. Second, Studies 1 and 2 enhance the generalizability by providing convergent evidence from multiple B2B sectors (e.g., oil field services, construction), different sources of exogenous variation (i.e., catastrophic accidents, regulation), data sources (i.e., proprietary and secondary data), objective outcomes (i.e., safety hazards and injuries), and units of analysis (i.e., sites within a company and business establishments across companies). Third, Study 3 suggests that customers value suppliers’ investments in safety training in the B2B buying process. Thus, investing in safety training is not simply an issue of compliance or cost management. Rather, it can help suppliers claim the benefits that accrue from building a sustainable relationship with their B2B customers. Thus, safety training programs are a critical lever for not only managing human resources but also demonstrating value to customers.
Study 1: Mitigation Effect of Safety Training on Safety Hazards
Institutional Context and Data
We obtained proprietary data from a global oil field services company (hereinafter, “the company”). The company offers technology-based products, services, and solutions to its clients (i.e., B2B customers) for characterization (e.g., field exploration), drilling (e.g., drilling wells, directional drilling control), and production (e.g., pressure pumping, well cementing, reservoir monitoring) activities. For example, at the stage of characterization, the company's employees and/or contractors may perform wireline services (e.g., using a cable to lower tools into oil well holes and gather/transmit data) for the rig leased/owned by the company's clients.
Both the regulatory body and B2B customers demand that the company be accountable for quality, health, safety, and environment; thus, the company tracks information about each facility site (hereinafter, “site”) on a monthly basis. The information includes (1) number of safety training hours; (2) number of catastrophic, major, serious, and light accidents (i.e., unplanned events that result in personal injury); (3) number of safety hazards (i.e., risk events such as near misses and hazardous situations that could have caused personal injury given a slight shift in time or position); and (4) site-level characteristics (e.g., number of employees, number of contractors, energy consumption). We were granted access to monthly data for all sites in North America between January 2008 and August 2018. The company also provided access to cross-sectional attributes of each site such as the activation and deactivation date, business segment served (e.g., various offerings for exploration, drilling, or production activities), function (e.g., office, engineering, operations base), and geographical region. 7 The final data set is an unbalanced panel of 87,071 site-month observations representing 1,921 sites over 128 months.
Measures
Safety training intensity as the independent variable
An essential component of the company's quality, health, safety, and environment practices is its safety training programs that comprise various training modules. These training modules include, but are not limited to, minimum training (e.g., fatigue management, hazard identification), generic training (e.g., emergency response, health, safety, environment awareness, environmental risk assessment), segment-specific training (e.g., observation and intervention, service quality management), and function-specific training (e.g., client contracts risk management, process safety, environmental risk-based standards).
While we do not observe the composition of safety training hours by modules, we observe the total number of monthly safety training hours for each site. This measure has two appealing features. First, safety training hours represent a standard metric tracked by companies in the industry. Second, safety training hours are tracked by industry regulators (Occupational Safety and Health Administration [OSHA] 2015). Table 2 shows that, for an average site with about 24 employees and contractors, the number of monthly safety training hours is 92.61.
Study 1: Summary Statistics (Raw Data).
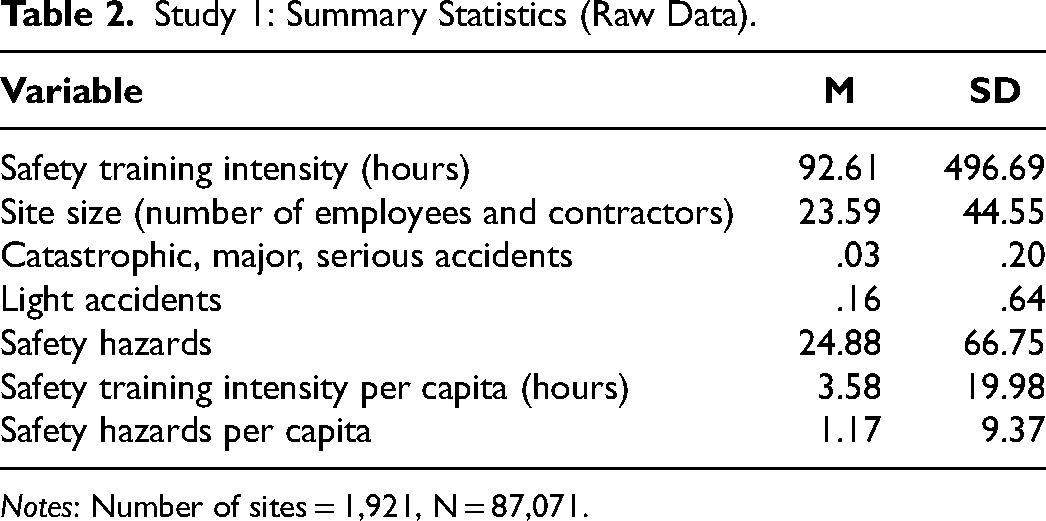
Notes: Number of sites = 1,921, N = 87,071.
Safety hazards as the dependent variable
Next, we elaborate on our choice of the dependent variable. First, safety hazards are risk events that could have caused personal injury. For example, when performing drilling services at a client's facility, a worker may bypass a machine or modify personal protection equipment for comfort. Thus, unlike accidents, safety hazards reflect the risk and represent a critical preventive measure in oil field–servicing activities. According to OSHA, mitigating safety hazards is critical to preventing injuries. 8 Second, access to safety hazards enables us to overcome the challenges with respect to measuring risk associated with oil field–servicing activities. Specifically, Table 2 shows that accidents are relatively rare events (.03 to .16 per month per site), but safety hazards are much more common (24.88 per month per site).
Safety hazards and service quality
By measuring safety hazards on a monthly basis, the company can assess risk and continually improve service quality. Indeed, conversations with safety and quality managers indicate that accidents are closely related to service quality nonconformances in this industry (i.e., deviations from quality standards), and that safety hazards are closely related to service-quality-related risk events. Figure W1 in Web Appendix B depicts service-quality-related risk events against safety hazards across all sites from January 2016 to December 2017 and shows that the trends are very similar. 9 This visual evidence suggests that safety hazards are strongly correlated with service quality.
Per capita operationalization
To alleviate the concern of site-specific heterogeneity (e.g., site size), we follow the literature on policing and crime to operationalize the independent variable as safety training intensity per capita (i.e., total monthly safety training hours divided by the number of employees and contractors) and dependent variable as safety hazards per capita (i.e., total monthly safety hazards divided by the number of employees and contractors) (e.g., Di Tella and Schargrodsky 2004; Draca, Machin, and Witt 2011; Evans and Owens 2007; Levitt 1997; Mello 2019; Weisburst 2019). As shown in Table 2, for an average site, there were around four hours of monthly safety training per capita and a single monthly safety hazard per capita.
Empirical Strategy
As a starting point, we consider an equation, specified in levels, that relates safety hazards per capita to safety training intensity per capita across sites over time:
The first identification challenge is that safety hazards may display a seasonal persistence across sites over time. For example, some sites are more prone to fluctuations due to rig activities and exhibit sharper seasonal patterns in safety hazards. Such a seasonal persistence may affect different sites differently and cannot be captured by site and year-month fixed effects. Accordingly, we follow Draca, Machin, and Witt (2011) to specify the model in seasonal differences (i.e., changes relative to the same month of the previous year) and arrive at:
However, even after accounting for site and year- month fixed effects and seasonal persistence across sites over time, safety training may be determined by safety hazards in an equation analogous to Equation 2. That is, a larger number of safety hazards is likely to increase the marginal productivity of safety training. Therefore, sites with a larger number of safety hazards per capita tend to have a higher level of safety training intensity per capita. To address this concern of simultaneity, we seek an instrument that exogenously shifts safety training intensity but does not belong directly in the production function of safety hazards.
We exploit the variation in the timing and locations of catastrophic accidents as the instrument. By definition, catastrophic accidents are rare and unanticipated events that cause fatalities (e.g., fatality due to heavy vehicle rollover) and, thus, may serve as a valid instrument for two reasons. First, the unpredictability of the occurrence of catastrophic accidents can arguably be used as an exogenous variation. Second, catastrophic accidents should induce changes in safety training intensity since the company needs to conduct a site-level investigation of the causes of these accidents given their high severity. Specifically, OSHA asks employers to assess whether current safety training is inadequate. 10 Our hypothesis is that catastrophic accidents induce a sharp increase in safety training, which can be used to identify the causal effect of safety training on safety hazards under a set of identifying assumptions. Next, we test this hypothesis and examine the identifying assumptions.
Preliminary evidence using two catastrophic accidents in April 2014
We start by examining what happened to safety training intensity per capita before and after April 2014, the year-month in which two catastrophic accidents occurred in two different sites of the company (i.e., treatment sites). The first catastrophic accident was a vehicle accident that occurred in a drilling-operations base during land transport, causing the death of a client's employee and a severe injury to the company's employee. The second catastrophic accident involved a head-on collision in a supply base, causing three fatalities and two injuries. Specifically, we compare the seasonal changes in safety training intensity per capita (Δ12Trainingit) six months before and six months after April 2014 in the treatment sites relative to all other sites (i.e., DID). Accordingly, we estimate the following equation:
After calculating seasonal differences, we have an unbalanced panel of 8,239 site-year-month observations representing 743 sites six months before and six months after April 2014. Column 1 in Table 3 shows that treatment sites experienced a large increase in safety training intensity six months after the catastrophic accidents. Specifically, monthly safety training intensity per capita in treatment sites increased by 30.01 hours relative to control sites (β1 = 30.01, p < .01). This relative increase was driven by an increase of 33.28 hours in the treatment sites and a smaller increase of 3.23 hours in the control sites. 11 We provide initial support of the hypothesis that catastrophic accidents induce a sharp increase in safety training.
Study 1: The Effect of Catastrophic Accidents on Safety Training Intensity and Hazards (Catastrophic Accidents in April 2014).

*p < .10.
**p < .05.
***p < .01.
Notes: Number of sites = 743, N = 8,239. Training indicates safety training intensity per capita, which is defined as the total monthly safety training hours divided by site size. R indicates safety hazards per capita, which is defined as the total number of monthly safety hazards divided by site size. Δ12X indicates the seasonal difference in a variable X and refers to the change in X within a site relative to the same month of the previous year.
Given that catastrophic accidents shift safety training intensity, if safety training mitigates safety hazards, we should also observe a negative relationship between catastrophic accidents and safety hazards. We examine this reduced-form relationship based on the following equation:
Accordingly, we can formally obtain instrumental variables (IV) estimates via the first-stage equation (Equation 5a) and structural equation (Equation 5b) as follows:

Table 4, Panel A, reports results. In Column 1, estimates from a pooled regression (Equation 1) show a statistically significant positive association between safety training and safety hazards (α = .314, p < .01), confirming the concern of simultaneity. In Column 2, estimates from a seasonally differenced model (Equation 2) show a statistically nonsignificant association between safety training and safety hazards (α = .016, p > .10). This suggests that, relative to the pooled regression, a seasonally differenced model does a better job accounting for the upward bias due to unobserved heterogeneity across sites.
Study 1: The Mitigation Effect of Safety Training Intensity on Safety Hazards (Catastrophic Accidents in 2014).

*p < .10. **p < .05. ***p < .01.
Notes : All specifications include year-month fixed effects and are weighted by site size. Standard errors are clustered by site. R indicates safety hazards per capita, which is defined as total number of monthly safety hazards (vs. 1 + total number of monthly safety hazards) divided by site size in Columns 1–4 (vs. Column 5). Training indicates training intensity per capita, which is defined as total monthly safety training hours (vs. 1 + total monthly safety training hours) divided by site size in Columns 1–4 (vs. Column 5). Δ12X indicates the seasonal difference in a variable X and refers to the change in X within a site relative to the same month of the previous year. T is the treatment indicator which equals 1 for sites in which catastrophic accidents occurred, and 0 for all other sites. Post is the postperiod indicator which equals 1 for the six months following April 2014 (May 2014 to October 2014), and 0 for the six months before and in April 2014 (November 2013 to April 2014).
Estimates for Equations 5a and 5b are reported in Columns 3–5. First-stage results (Table 4, Panel B) show that there is a sharp discontinuity in safety training hours due to catastrophic accidents (α1 ranging from .628 to .662, ps < .01). IV estimates (Table 4, Panel A) show that there is a decrease in safety hazards because of increased safety training (α2 ranging from −.672 to −.645, ps < .01). Specifically, Table 4, Panel A, shows that the elasticity of safety hazards with respect to safety training is −.672 (Column 3). After adding control variables, the elasticity is −.662 (Column 4). Finally, the elasticity is −.645 after we add one to safety training intensity per capita and safety hazards per capita before the log transformation to preserve the zeros in the sample (Column 5). The interpretation is that, on average, a 10% increase in monthly safety training hours per capita reduced monthly safety hazards per capita by 6.45%–6.72%.
In addition, we conduct various checks to verify that the results are robust to the inclusion of site-specific trends, models specified in levels, and an alternative definition of the post period that included April 2014 (for details, see Table W3 in Web Appendix B).
Additional evidence using all catastrophic accidents
To alleviate the concern regarding the idiosyncratic nature of catastrophic accidents in 2014, we use all catastrophic accidents that occurred at different sites from January 2008 to August 2018 (e.g., fatalities due to head-on collision, truck rollover, falling from height at a facility, cement truck crushes, and several undisclosed causes).
12
The timing and locations of these catastrophic accidents enable us to estimate the following two-equation system:

Results are reported in Table 5. In Column 1, estimates from a pooled regression (Equation 1) suggest a positive correlation between safety training and safety hazards (simultaneity). In Column 2, estimates show that a seasonally differenced model (Equation 2) is able to adjust the bias downward. In Columns 3 and 4, the IV estimates (Equations 6a and 6b) show that an elasticity of safety hazards with respect to safety training (α2) is in the −.949 to −.957 range.
Study 1: The Mitigation Effect of Safety Training Intensity on Safety Hazards (Catastrophic Accidents Between 2008 and 2018).

*p < .10. **p < .05. ***p < .01.
Notes : All specifications include year-month fixed effects and are weighted by site size. Standard errors are clustered by site. R indicates safety hazards per capita, which is defined as total number of monthly safety hazards divided by site size. Training indicates training intensity per capita, which is defined total monthly safety training hours divided by site size. Δ12X indicates the seasonal difference in a variable X and refers to the change in X relative to the same month of the previous year. T equals 1 if a site experienced a catastrophic accident during the postperiod (i.e., six months following the catastrophic accident), and 0 otherwise.
In summary, Tables 4 and 5 show that the estimated elasticity of safety hazards with respect to safety training is in the range of −.645 to −.957. We evaluate these estimates at the overall sample mean to put them into perspective. Specifically, as the monthly safety training hours per capita at an average site increases by 10% (an additional .36 hours per person), monthly safety hazards per capita decreases by 6.45%–9.57% (or a decrease of .8 [17.8] to 1.1 [26.4] events of safety hazards per person [per site]).
Establishing the exclusion restriction
The identifying assumption could be violated if the treatment is correlated with other shocks occurring at the time of the catastrophic accidents. It is likely that catastrophic accidents could affect not only safety hazards through changes in safety training but also additional channels that require further examination. For example, catastrophic accidents may change the composition of employees (e.g., layoffs due to catastrophic accidents) and/or incur additional safety measures at treatment sites relative to control sites. As a result, the level of exposure to safety hazards might be reduced. Similarly, catastrophic accidents may reshape regular operations at treatment sites relative to control sites, which could have reduced the exposure to safety hazards. To rule out these concerns regarding alternate channels, we test whether catastrophic accidents cause the changes in (1) energy consumption, (2) number of certified drivers, (3) number of vehicles with working monitors, (4) total mileage driven by workers, (5) number of hours worked by employees, and (6) number of hours worked by contractors in the treatment (vs. control) sites. Table 6 shows that there is no evidence of a discontinuity in any of these variables due to catastrophic accidents (ps > .10). These results strengthen the validity of the timing and locations of catastrophic accidents as an instrument for safety training.
Study 1: Ruling Out Alternative Correlated Shocks (Catastrophic Accidents between 2008 and 2018).

*p < .10. **p < .05. ***p < .01.
Notes: Number of sites = 1,124, N = 31,287. All specifications include year-month fixed effects and are weighted by site size. Standard errors are clustered by site. Δ12X indicates the seasonal difference in a variable X and refers to the change in X relative to the same month of the previous year. T equals 1 if a site experienced a catastrophic accident during the postperiod (six months following the catastrophic accident), and 0 otherwise.
Another potential threat to the exclusion restriction is that catastrophic accidents may have a direct impact on safety hazards because such events may be salient in employees’ minds and cause employees to be more cautious, thus reducing safety hazards (i.e., salience effect). Intuitively, a way of measuring this direct effect is to use employees’ awareness of safety at the site-year-month level and examine whether the awareness level is smooth or discontinuous at treatment sites relative to control sites. However, such data are not available. Even if they were, we would not be able to separate the salience effect from our proposed channel because any observed changes in safety awareness could also be driven by increased safety training.
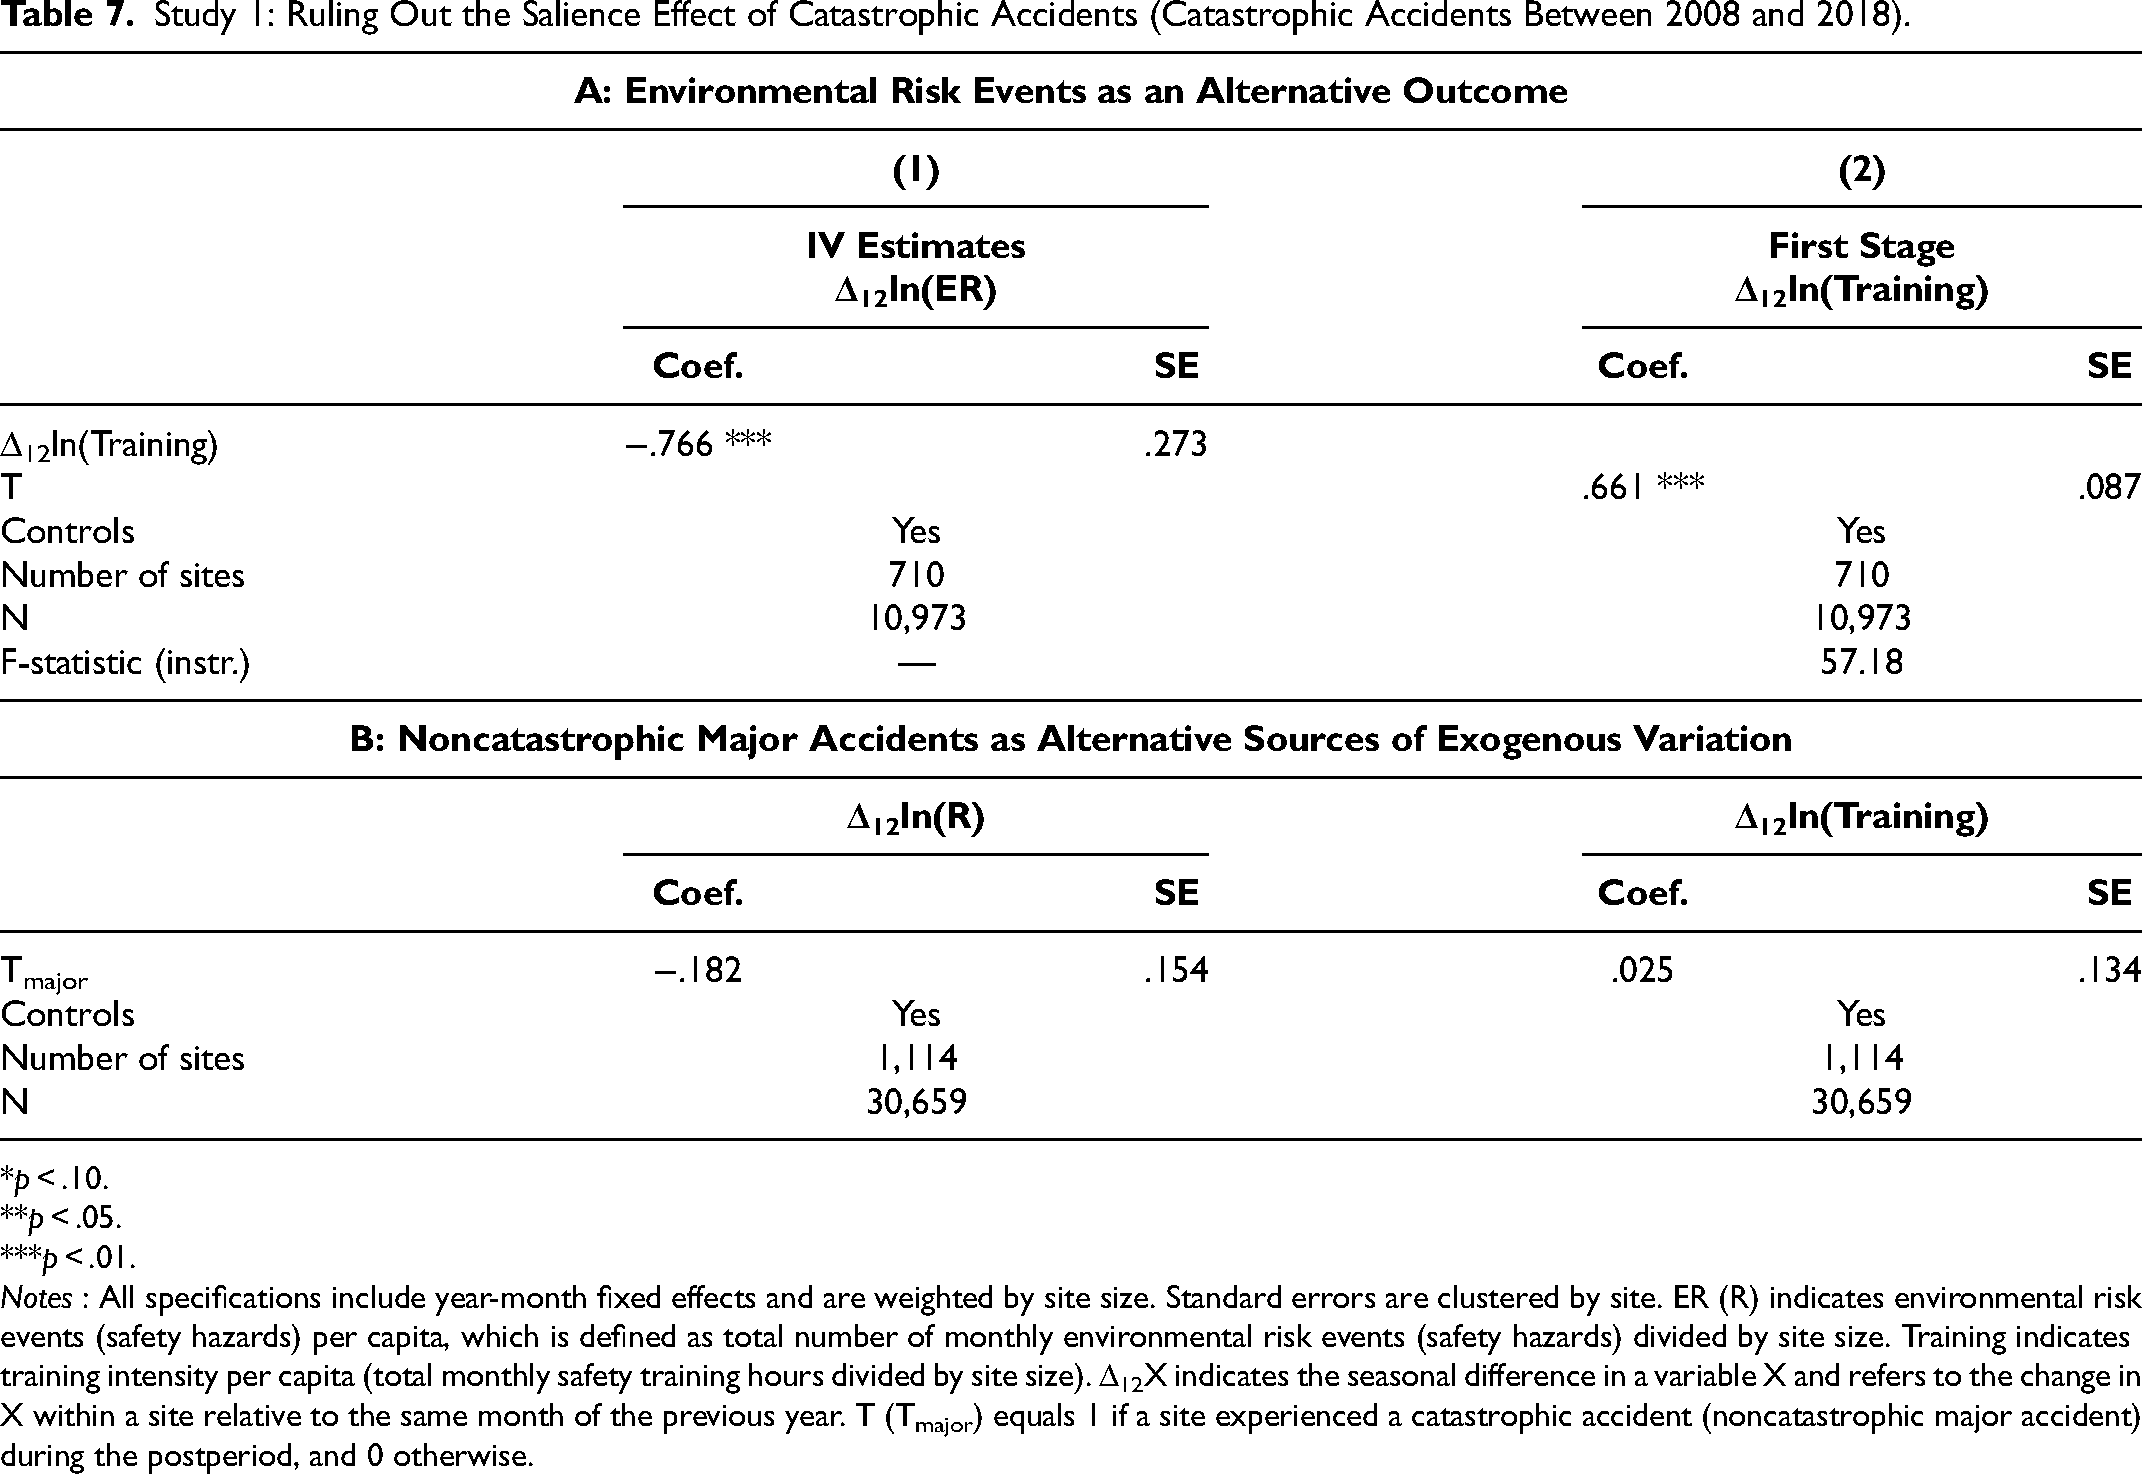
Accordingly, we conducted two supplementary analyses to assess this potential threat. First, our conjecture is that if the dependent variable could document risk events in domains completely different from catastrophic accidents, the salience effect due to catastrophic accidents would be minimal. 13 Given that the catastrophic accidents involve head-on collision, truck rollover, falling from height at a facility, and cement truck crushes, we estimate Equations 6a and 6b with environmental risk events per capita as an alternative dependent variable (e.g., risks associated with exposure to conditions at a site such as radiation and environmental contaminants, among others) in Equation 6b. Table 7, Panel A, shows that, again, there is a sharp discontinuity in safety training hours due to catastrophic accidents (α1 = .661, p < .01). In addition, as the monthly safety training hours per capita increases, monthly environmental risk events per capita decreases (α2 = −.766, p < .01), increasing our confidence in the validity of the instrument. 14
Study 1: Ruling Out the Salience Effect of Catastrophic Accidents (Catastrophic Accidents Between 2008 and 2018).
*p < .10. **p < .05. ***p < .01.
Notes : All specifications include year-month fixed effects and are weighted by site size. Standard errors are clustered by site. ER (R) indicates environmental risk events (safety hazards) per capita, which is defined as total number of monthly environmental risk events (safety hazards) divided by site size. Training indicates training intensity per capita (total monthly safety training hours divided by site size). Δ12X indicates the seasonal difference in a variable X and refers to the change in X within a site relative to the same month of the previous year. T (Tmajor) equals 1 if a site experienced a catastrophic accident (noncatastrophic major accident) during the postperiod, and 0 otherwise.
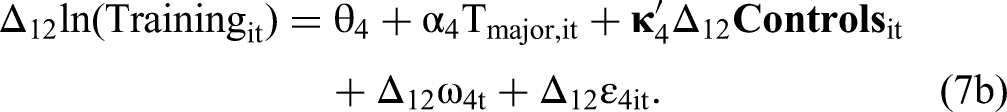
Second, we observe noncatastrophic major accidents that occurred over our sample period across various sites. These events cause severe injuries and are less (more) severe than catastrophic (serious and light) accidents. If the salience effect were at play, we would expect that noncatastrophic major accidents also increase employees’ safety awareness (i.e., employees would be more cautious) and reduce safety hazards, albeit to a lesser extent. We leverage noncatastrophic major accidents as interventions, drop the observations from sites where catastrophic accidents ever occurred, and estimate the following equations:
Discussion
Study 1 used granular site-level data from an oil field services company to study the causal effect of safety training on safety hazards. Yet one might be concerned that our analyses only rely on the company's internal catastrophic accidents as arguably exogenous variation. In Web Appendix C, we present similar data patterns using the Deepwater Horizon oil spill, an industrial disaster that exogenously shifts safety training hours among the company's sites in those business segments affected by the oil spill. Moreover, one might be concerned with this study's external validity. With respect to the independent variable, our quasi-experiment induces the variation in total safety training hours, a common metric tracked by the companies in this industry. Thus, we alleviate the concern regarding the idiosyncratic nature of measures such as completion rates of a specialized training offered by a single company. With respect to the generalizability across different settings, Study 2 strengthens the economic implications of safety training, leverages exogenous variation in safety training induced by a government regulation, and enhances the external validity through industry coverage, measures, and findings.
Study 2: Mitigation Effect of Safety Training on Workplace Injuries
Institutional Context and Data
Safety training regulation in New York City: Local Law 196
Approved by Mayor Bill de Blasio on October 16, 2017, Local Law 196 requires construction workers at sites in all five counties/boroughs in New York City (i.e., New York, Kings, Bronx, Richmond, and Queens) to have 40 hours of Site Safety Training (SST) and an SST worker card. Further, supervisors of the construction workers must have 62 hours of SST supervisor training and an SST supervisor card. 15 The law was implemented in three phases. Phase 1 required construction workers to complete at least 10 hours of safety training by March 1, 2018, which could be satisfied with OSHA’s 10- or 30-hour training courses. Phase 2 required construction workers to have 30 hours of safety training and supervisors to have 62 hours of training by December 1, 2019. Phase 3 required all current construction workers to complete 40 hours of safety training and earn an SST card by March 1, 2021. Notably, the law applies to the construction sector only in New York City and not to the rest of the state. Our research design relies on the exogenous increase in safety training induced by this regulation so that we can examine the causal impact of safety training on workplace injuries. Next, we describe the injury data.
Establishment-level injury data
Since 2016, companies have completed OSHA Form 300A, which collects injury and illness data at their establishments, to comply with OSHA's recordkeeping requirements. OSHA (2001) defines an establishment as “a single physical location where business is conducted or where services or industrial operations are performed” (p. 6135). Each year, Form 300A collects data from establishments that belong to specified NAICS codes in the United States. 16 We compiled data over time from OSHA's Injury Tracking Application, where each row is an establishment-year observation. The data contain a unique establishment identifier, establishment name, establishment location (e.g., address, zip code), NAICS code, annual average number of employees, total hours worked by employees, total number of injuries, total number of illnesses (e.g., skin disorders, respiratory conditions), calendar year in which the injuries and illnesses occurred, and parent company's employer identification number.
Measures
Establishment-level injury rate as the dependent variable
Following Cohn, Nestoriak, and Wardlaw (2021), the dependent variable, injury rate, is computed as the total number of injuries divided by annual average number of employees at each establishment in a year. The analysis uses the number of injuries rather than illnesses because the training modules primarily focus on injury-related topics such as Slip, Trip and Fall Hazard Protection; Ladder Safety; Hand and Power Tool Hazards; and Personal Protective Equipment.
Defining treated and control establishments
First, the county was not identified in the establishment-level injury data, so we use the HUD-USPS ZIP Code Crosswalk file from the Office of Policy Development and Research to identify the county in which each establishment is located. Second, we consider an establishment a treated establishment if it (1) belongs to the construction sector (i.e., the first two digits of its NAICS code are 23) and (2) is located in the counties of New York, Kings, Bronx, Richmond, or Queens in New York City. We define control establishments as those that operate in the rest of counties in the state of New York in the absence of Local Law 196. This control group is a natural starting point because establishments in the same state are subject to the same basic state rules. After removing observations with missing injury rates (N = 278) and those with injury rates higher than 1 (N = 36), we have a sample of 69,374 observations that represent 32,061 establishments from various sectors during 2016–2021. 17
Empirical Strategy
Local Law 196 required construction workers in New York City to complete at least ten hours of safety training by March 1, 2018 (i.e., Phase 1 deadline). Therefore, we define the years on or after (before) 2018 as the postregulation (preregulation) period. We compare the change in injury rates at construction establishments in New York City (i.e., treated establishments) before and after the introduction of the law with the change in injury rates at all other establishments in the rest of the State of New York (i.e., control establishments) in which no such law was introduced. The comparison (i.e., DID) can identify the causal effect of the safety training regulation on injury rates at treated establishments relative to control establishments under the identifying assumptions.
Model-free evidence
The key identifying assumption is that the trend in injury rates would be the same at treated and control establishments in the absence of Local Law 196 (i.e., parallel trend assumption). Although we cannot directly test this assumption, we plot the injury rates at treated and control establishments from 2016 to 2021 to assess whether there is support for the parallel trend assumption. As shown in Figure 1, there is a slight increase in the average injury rates at treated establishments prior to 2018 (i.e., from 3.5% to 3.8%), and the trend is very similar at control establishments over the same period (i.e., from 3.7% to 4.0%). Therefore, Figure 1 provides visual support of the parallel trend assumption. Moreover, the difference in injury rates between treated and control establishments increased after 2018. That is, Local Law 196 led to an increase in safety training hours for construction establishments in New York City, which, in turn, decreased injury rates at treated establishments relative to control establishments.

Study 2: Injury Rates at Treated Versus Control Establishments.
Baseline specification
Formally, we estimate a regression equation to construct DID estimates and standard errors while enabling the inclusion of additional covariates:
Empirical extension with border counties as an alternative control group
We conduct an additional analysis to ensure that treated and control establishments are comparable with respect to county-specific geographic, demographic, and socioeconomic characteristics. Following recent research in marketing that examines the causal impact of government regulation (e.g., Guo, Sriram, and Manchanda 2020; Sen and Tucker 2022), we focus our analysis on establishments in border counties without Local Law 196 as an alternative control group: those in Westchester and Nassau in the state of New York and Middlesex, Union, Hudson, and Bergen in the state of New Jersey (for a visual depiction of the treated vs. border counties, see Figure W3 in Web Appendix D). The identifying assumption is that these establishments are more similar in their unobservable characteristics to those in the treatment group (e.g., the supply of similar worker populations with similar needs). The sample includes 18,962 observations that represent 9,346 establishments from 2016 to 2021. Figure 2 provides visual evidence of the validity of the research design.

Study 2: Injury Rates at Treated Versus Control Establishments in Border Counties.
Results, effect size, and economic implications
Table 8, Panel A, consistently shows the prevention effect of safety training on injury rates across specifications. The baseline results (Column 1) show that Local Law 196 led to a significant decline in injury rates at construction establishments in New York City relative to their counterparts (α = −.0104, p < .01). After adding establishment and year fixed effects (Column 2), the magnitude of estimated treatment effect becomes smaller (α = −.0068, p < .01). The results remain unchanged after the inclusion of time-varying county characteristics (Column 3; α = −.0067, p < .01). Considering establishments in neighboring border counties as the control group, estimated treatment effects remain statistically significant at the 5% level (i.e., ps < .05) and negative, consistent with the main analysis (see Table 8, Panel B).
Study 2: The Effect of Safety Training Regulation on Establishment-Level Injury Rates (Local Law 196 in New York City).

*p < .10. **p < .05. ***p < .01.
Notes: Standard errors are clustered at the county-sector level. T equals 1 for establishments in the five counties in New York City (i.e., New York, Kings, Bronx, Richmond, and Queens), and 0 otherwise. Post equals 1 for years in and after 2018, and 0 otherwise. Neighboring border counties include two counties in the state of New York (Westchester and Nassau) and four counties in the state of New Jersey (Middlesex, Union, Hudson, and Bergen).
To interpret the effect magnitude in a conservative manner, we focus on the estimates reported in Table 8, Columns 2 and 3. Due to Local Law 196, injury rates decreased by .54–.68 percentage points: that is, a 15.56%–18.84% decline (compared with the sample mean). To benchmark the estimates with previous findings, Levine, Toffel, and Johnson (2012) find that randomized inspections reduced injuries by 9.4% in the state of California, and Li and Singleton (2019) find that OSHA's inspections reduced injuries by 20% in the year following inspections. We also compute the effect size as the percent of a standard-deviation decrease in injury rates. The results suggest that the decline in injury rates ranges from 10.57% to 11.97% of a standard deviation.
Companies and policy makers could benefit from interpreting the effectiveness of safety training in a tangible way. For this purpose, we use an average establishment in our data, which has 186 employees. We start with the estimates of safety training investment: according to Local Law 196, construction workers can satisfy the training requirements by completing 10- or 30-hour OSHA training courses. An individual OSHA 10-hour training course typically costs $58–$59 per person, and an individual OSHA 30-hour training course typically costs $159 per person. 18 Therefore, for an average establishment, safety training costs the establishment $10,788 (186 × $58) to $29,574 (186 × $159) per year.
To compute the return, we use the most conservative treatment effect estimate (Column 2 in Table 8, Panel B) and cost per injury from the National Safety Council to assess the financial impact of safety training. Specifically, National Safety Council estimates that cost per medically consulted injury was $44,000 in 2020, and the average workers’ compensation costs for all claims combined in 2018–2019 was $42,008. 19 The use of cost estimates of medically consulted injury is consistent with OSHA's Recordkeeping Requirements, where employers must report serious work-related injuries that require more than first aid. According to Table 8, Panel B (Column 2), after Local Law 196 was enacted, injury rates decreased by .54 percentage points at treated establishments relative to their counterparts. That is, for an average establishment, Local Law 196 led to one fewer injury per year (186 employees × .0054), saving the establishment $42,008 to $44,000. Based on these calculations, a conservative estimate of the return on investment on safety training is 42% (i.e., [$42,008 − $29,574]/$29,574). An alternative to gauging the implication is to compute the total annual savings. There are 437 treated establishments in the estimation sample; thus, Local Law 196 saves treated establishments approximately $18 million (i.e., $42,008 × 437) to $19 million (i.e., $44,000 × 437) per year.
Robustness checks
Figure 3 shows that our results are robust to (1) the inclusion of linear county- and sector-specific time trends that allow treated and control units to follow different trends, (2) the inclusion of county-year fixed effects that account for region-specific shocks in a given year, (3) alternate clustering at the establishment or county level, (4) different sample construction, and (5) the inclusion of additional time-varying controls in the specification with the border counties.

Study 2: Summary of Robustness Checks.
Study 3: Value of Safety Training in the B2B Buying Process
Studies 1 and 2 together provide causal evidence that safety training mitigates safety hazards and prevents injury rates at workplaces. Thus, these two studies suggest that investments in safety training can serve as an effective risk-mitigation vehicle for firms. However, what remains unanswered is whether suppliers’ investments in safety training can create value for their B2B customers in addition to the role of such investments in risk management. Against this background, in Study 3, we conduct a stated-choice conjoint experiment with procurement professionals to examine whether B2B customers value prospective suppliers’ investments in safety training in their B2B buying process.
Data and Sample
We recruited participants through a national marketing research company that provides access to an online panel of managers at B2B companies. Specifically, we recruited 312 participants who reside in the United States, are at least 21 years of age, and serve as a manager (or higher-up role) in their company. Further, to ensure that the participants were knowledgeable about the supplier selection process, we retained 207 B2B managers who stated that they had been involved in procurement activities in the final sample. The demographic information of the participants in the final sample is reported in Table W6 in Web Appendix E.
Study Design for the Stated-Choice Conjoint Experiment
Participants were presented with a cover letter describing the objective of the survey, confidentiality information, and estimated completion time. In designing the scenario, we reviewed requests for proposals and prospective vendors’ responses in the energy sector to simulate a procurement activity as realistic as possible (for the full scenario, see Web Appendix E).
20
The procurement scenario started with the following background information: Imagine you are the Director of Procurement Services of a global energy company headquartered in the United States. You lead a team of specialists that procure products and services for your company’s exploration, drilling, and production operations. Your company has decided to procure electrical submersible pumping (ESP) systems, a solution that helps improve the flow of fluids from wells. Your team is responsible for providing a shortlist of the most qualified vendors to proceed to the proposal stage.
Next, we simulated the prequalification stage by informing participants that suppliers (vendors) were excluded if they did not meet any of the seven initial vendor selection criteria: manufacturing capability, relationship, location, reputation, risk, finance, and substantiality. These criteria have been documented in the literature (Ho, Xu, and Dey 2010) and verified by industry managers. Participants were told that the task was to provide a shortlist of the most qualified vendors to proceed to the proposal stage conditional on those vendors meeting the prequalification criteria.
Participants were then informed that the final task was to evaluate the qualified vendors. To ensure that the vendor selection task was manageable for the participants, we focused on four attributes chosen by reviewing websites of leading providers of ESP systems and consulting with four experts in the B2B buying process. The four attributes are product quality, after-sales support, safety, and price (Ho, Xu, and Dey 2010; Mittal et al. 2021):
Product quality: The vendor's capability of providing ESP systems that improve the flow, uptime, and production. After-sales support: The vendor's capability of providing customized local support for operations, maintenance, and troubleshooting. Safety: The vendor's capability of training its employees to mitigate risk events (e.g., hazards related to electrical shocks, gas leaks, cable damage, fatigue) during installation and ongoing operations of ESP systems. Price: The vendor's quote and information about payment terms.
Specifically, whereas product quality, after-sales support, and safety each had two levels (i.e., low, high), price had three levels (i.e., lower than industry average, at industry average, higher than industry average) to capture potential nonlinearity in price sensitivity (for details, see Table W7 in Web Appendix E). Participants were then instructed that they would be making a series of choices between two hypothetical vendors in each set. Further, before entering the choice tasks, they were asked to evaluate the prospective vendors’ credentials to select the preferred one in each set.
The choice sets were created as follows. With three attributes of two levels each and one attribute of three levels, there are 24 possible vendor profiles. Among all feasible sets of a pair of vendors, we first created an efficient set of 24 choice sets (e.g., Rooderkerk, Van Heerde, and Bijmolt 2011). 21 After removing duplicates and choice sets with a dominating-dominated profile, 16 choice sets were left. To minimize respondent burden, we used six of these choice sets with a balanced design such that each attribute level occurred with an equal frequency (Kuhfeld, Tobias, and Garratt 1994). Thus, each participant evaluated six pairs of prospective vendors and selected their preferred vendor from each pair (six stated choices). 22 The order of the choice sets was randomized within participant. Figure 4 shows one of the choice sets. After completing the stated choice task, participants provided their demographic information and were debriefed.

Study 3: Sample Choice Set Presented to Participants.
Results
Since each of the 207 participants viewed six choice tasks with two vendor profiles in each task, our sample consisted of 2,484 observations (i.e., 207 × 6 × 2). Following Hainmueller, Hopkins, and Yamamoto (2014), we estimate a linear probability model where the dependent variable is a dummy variable indicating whether a given profile was chosen by a participant, and the independent variables are a set of dummies that characterize the profile. We set the “low” level as the baseline for product quality, after-sales support, and safety, and set “high” level as the baseline for price. We include choice-set fixed effects to account for time-invariant systematic differences across the six choice sets. We clustered standard errors at the participant level to account for serial correlation regarding similar attribute valuation within the repeated stated choices of a given participant.
Column 1 in Table 9 shows the results. First, all four attributes drive B2B procurement professionals’ stated vendor selection for ESP systems (ps < .05). Importantly, B2B suppliers’ emphasis on safety training directly influences the consideration probability of their proposals (β = .246, p < .05). Second, the importance weight of safety training with respect to B2B customers’ choice is 20%, compared with product quality (30.6%), after-sales support (22.7%), and price (26.7%). Thus, a supplier's safety training investment appears to provide incremental value to customers over and above attributes such as quality, price, and after-sales support. Finally, we estimated the model as a logistic regression, and the results remained unchanged (Column 2).
Study 3: Drivers of Consideration Probability When Stating a B2B Vendor Preference.

*p < .10.
**p < .05.
***p < .01.
Notes: N = 2,484. Choice-set fixed effects are included in the specification. Standard errors are clustered by participant.
Conclusion
Despite the prevalence of safety-training programs among B2B suppliers, academic research has not precisely measured their impact on their safety outcomes, thereby serving as a plausible source of value for their customers. We quantify the extent to which suppliers’ safety-training programs mitigate safety hazards (Study 1), prevent injuries (Study 2), and affect their customers’ buying decisions (Study 3). Study 1 shows that for an average site, as monthly safety training hours per capita increase by 10% (.36 hours per person), there is a decrease of .8 to 1.1 events of safety hazards per person (a decrease of 17.8 to 26.4 events per site). Study 2 shows that after Local Law 196 was enacted, injury rates decrease by .54 to .68 percentage points (a 15.56%–18.84% decline) at construction establishments in New York City relative to their counterparts—conservatively, return on safety-training investments is 42%. Study 3 establishes a positive relationship between a supplier's investments in safety training and B2B customers’ likelihood of selecting the supplier for product and service provision. Collectively, these results suggest that investing in safety training programs not only mitigates workplace hazards and injuries but also affects B2B customers' buying decisions, accruing potential revenue benefits to suppliers.
For practitioners, this research identifies safety training as a tangible action that mitigates risks, potentially enhances quality, and influences B2B buying decisions. These findings are particularly useful to CMOs who can capitalize on the positive relationship among safety training, workplace safety, and B2B buying in their marketing campaigns. Previous research has shown a symbiotic association between companies’ actions benefiting customers and employees (Willis, Brown, and Prussia 2012). In the same tradition, this research endorses the need for CMOs to work more closely with other functions to improve employee outcomes along with customer outcomes. Further, CEOs can discuss their company's safety training programs not merely to comply with regulatory requirements, but as a core tenet of customer value. For example, in a letter to shareholders, Jeffrey W. Martin, Chairman and CEO of Sempra Energy, stated, “Safety is a foundational value at Sempra Energy, guiding how we serve our customers and communities. … Our operating companies innovated to develop new ways for our employees to continue working safely when the world around us demanded it” (Sempra Energy 2020). Thus, this research provides a roadmap for companies to (1) measure the magnitude of the risk-mitigation effect of safety training, (2) document the return on investment, and (3) demonstrate its impact on B2B buying decisions.
The limitations of our research offer directions for future research. First, while we measure safety training in different ways using different data sources, we only examine safety training as an aggregate metric (i.e., total number of safety training hours). Future research at a more disaggregated level that gathers information on different training types is needed. For example, researchers can investigate the degree to which different training types mitigate hazards and injuries, shedding light on the pragmatic design of safety-training programs. Second, while we focus on quantifying the average treatment effect of safety-training programs, researchers can uncover possible nuances by examining different sources of treatment effect heterogeneity (e.g., industry, company, or site characteristics). Third, although we intend to simulate the B2B buying process in the real world with procurement professionals, we acknowledge that (1) our estimates are based on stated-choice data and (2) the conjoint design presents a hypothetical scenario where procurement professionals need to imagine that their stated supplier choices could be reviewed by the leadership team. Future research may leverage the partnerships with B2B companies to embed the conjoint experiment into the supplier selection process to tie the quality of supplier choices to procurement professionals’ compensation.
Supplemental Material
sj-pdf-1-mrj-10.1177_00222437231222857 - Supplemental material for The Value of Safety Training for Business-to-Business Firms
Supplemental material, sj-pdf-1-mrj-10.1177_00222437231222857 for The Value of Safety Training for Business-to-Business Firms by Yixing Chen, Shrihari Sridhar, Kyuhong Han, Sonam Singh, Vikas Mittal and Taehoon Im in Journal of Marketing Research
Footnotes
Acknowledgments
The authors thank the JMR review team for their guidance. The authors also thank Mahima Hada, Vamsi Kanuri, Alok Kumar, Adithya Pattabhiramaiah, Ananya Sen, and conference and seminar participants at the Journal of Marketing Research Special Issue Conference on Mitigation in Marketing, University of Notre Dame Brown Bag Series, Renmin University of China, London School of Economics and Political Science, University of Iowa, University of Kansas, University of Texas at Austin, Rutgers University, Michigan State University, Syracuse University, and Dartmouth College for their invaluable comments and suggestions. The authors also benefit from insightful conversations with Chris Bechler, John Costello, Shijie Lu, Muzeeb Shaik, Huanhuan Shi, Sriram Somanchi, and Joonhyuk Yang. They thank an anonymous company for providing data used in Study 1 and Qiangming Yan for his help with data sources used in Study 2.
Special Issue Editor
Pradeep Chintagunta
Associate Editor
Yesim Orhun
Declaration of Conflicting Interests
The author(s) declared no potential conflicts of interest with respect to the research, authorship, and/or publication of this article.
Funding
The author(s) disclosed receipt of the following financial support for the research, authorship, and/or publication of this article: This study is partially supported by Mendoza College of Business Faculty Summer Research Grant and Korea University Business School Research Grant.
Notes
References
Supplementary Material
Please find the following supplemental material available below.
For Open Access articles published under a Creative Commons License, all supplemental material carries the same license as the article it is associated with.
For non-Open Access articles published, all supplemental material carries a non-exclusive license, and permission requests for re-use of supplemental material or any part of supplemental material shall be sent directly to the copyright owner as specified in the copyright notice associated with the article.