
Abstract
Excessive monetary compensation and existing contractual agreements of influencers limit the ability of many firms to engage in effective influencer seeding. The authors suggest a forward-looking approach of targeting prospective influencers—while they are still largely unknown (e.g., a few months after their platform registration)—and signing them to endorse the firm in the future (e.g., more than a year later). This approach has the potential to significantly reduce costs. However, as only rarely do newly registered users ultimately become influencers (and as signals are weak), the authors propose a novel framework to cope with this rare-event problem. For empirical demonstration and application, the authors conduct data-based simulations using a data set from a worldwide leading audio platform. Every wave of newly registered users is associated with a profit potential stemming from future endorsements by prospective influencers. With knowledge about the order of magnitude of the return on successful influencer spend, managers applying the framework can extract around 20% of this profit potential (if the return is around three times the spend).
Keywords
During the last two decades, obtaining endorsements by influencers has become increasingly popular in business practice. This form of communication is distinct from online ads (which the platform controls) and focuses on mostly paid endorsements by individuals such as Kylie Jenner—with a reach of well over 400 million people on social media—who are assumed to have an immense impact on potential buyers. Success stories like Jenner's are enabled and facilitated by the rapid rise of user-generated content platforms, and findings from the literature support the importance of seeding such highly connected influencers (e.g., Goldenberg et al. 2009; Hinz et al. 2011). It is therefore no surprise that the global market for paid influencer endorsement is skyrocketing, estimated to reach $21.1 billion in 2023 (Influencer Marketing Hub 2023).
At the same time, the soaring interest in influencer marketing has triggered a cost explosion such that the monetary compensation for endorsements may now exceed most companies’ means. Kylie Jenner, at the high end of the spectrum, charges close to $2 million for a single post (Hopper HQ 2023). Another major development is that sought-after influencers are not willing to accept or not capable of accepting every endorsement request due to conflicts such as contractual agreements with similar firms. These limitations pose a new high barrier or may even render it infeasible for many firms, especially small and medium-sized businesses, to engage in effective influencer seeding.
As a bypass, we suggest in this article targeting prospective influencers—while they are still largely unknown (e.g., a few months after platform registration)—and signing them to endorse the firm in the future (e.g., more than a year later). This has the advantage that the costs are several orders of magnitude lower, because while prospective influencers are still unknown, they can be locked into a low rate that represents their current low network status.
Formulating the forward-looking approach of signing prospective influencers to endorse the firm in the future entails two prediction challenges:
Rare event: In a wave of newly registered users, only a few ultimately become influencers, whereas almost all of them remain unknown, making training a difficult task. Weak signals: Since the time horizon is relatively long due to the endorsement being far in the future, the signals of becoming an influencer are weak.
To address both these challenges, we consider two inherent economic trade-offs that can be illustrated by their two extreme cases. The first revolves around the selection size: At one extreme, one could buy future endorsements from everyone in a wave of newly registered users. This maximizes detection of prospective influencers. However, since only a few in such a wave ultimately become influencers, a large selection size causes high wasted spend, because the predominant majority stays unknown. At the other extreme, one could gamble and buy a future endorsement from only one new user. In this case, the wasted spend would be extremely low, but so would be detection, because such a minimal selection size is unlikely to include one of the few prospective influencers, as detection is overly difficult.
Besides the selection trade-off, there is also a timing trade-off to be addressed: Postponing the time of buying the future endorsement gives richer data and improves detection of prospective influencers, which in turn reduces the wasted spend. However, postponing also implies that many new users are no longer unknown. This drastically reduces the pool of prospective influencers.
To solve the two inherent economic trade-offs, we propose a framework consisting of two phases: a learning phase and an implementation phase. In the learning phase, historical network data are used to learn the influencer market at hand. As a result of this learning phase, the framework provides an information triplet as an output: (1) a concrete buying time t and (2) a concrete selection size s, as well as (3) a concrete model specification m that is used later on, in the implementation phase (the output of the learning phase is not a list of specific individuals since it uses historical network data).
To identify specific individuals, the information triplet (S, m, t) is used as follows in the implementation phase: (1) collect current network data on a wave of newly registered users until the buying time t, (2) apply the model specification m to the data to generate a decreasing ranking of the new users, and (3) select users along this decreasing ranking, where the selection size S indicates the cutoff. This determines when to buy and which new users to buy from.
Exact information about the cost–revenue relations in influencer marketing is not always available (Influencer Marketing Hub 2023). Therefore, we account for two cases: one in which the order of magnitude of the return on successful influencer spend (ROIS) is known, and a second in which it is not known. ROIS is referred to in practice as the “bang for the buck” of an influencer endorsement, an important piece of information of which managers should have at least a sense of the order of magnitude.
We empirically demonstrate and apply this framework using a data set from a worldwide leading audio platform and thereby focus on influencers among audio creators, such as music artists, comedians, and other podcasters, which managers from various companies find to be fertile ground for influencer seeding, in which they buy endorsements in the form of (oral) brand mentions in the audio creators’ content. Therefore, in our empirical demonstration and application, the observable proxy for success is the number of plays. To detect prospective influencers, we incorporate predictors capturing the activities of audio creators as well as their emerging social capital and evaluate a wide range of prediction models.
We find that the dominant models are indeed rare-event models, that is, the logit model using the oversampled training set following the synthetic minority oversampling technique (SMOTE; Chawla et al. 2002), King and Zeng's (2001) oversampling technique including bias correction, and extreme gradient boosting. Concerning dominant predictors, we find that these rare-event models rely on social capital measures in only 20% of cases, because the dominant buying time of buying the future endorsement is six months after platform registration, which is apparently too short to build meaningful social capital. Rather, the outgoing and incoming activities (i.e., the interactivity) serve as a signal.
These dominant model specifications m—which essentially form an efficient frontier—are effective at detecting prospective influencers six months after their platform registration, that is, t = 6 months. With a selection size as small as S = 14, it is possible to get a hit rate of around 20%, which is considered good, given the rare-event nature of the problem and the weak signals. For example, venture capitalists with their risky investments in startups also face a 20% hit rate (which then accounts for 80% of the returns; Thiel and Masters 2014).
Finally, conducting data-based simulations, we show that the proposed framework results in substantial profits, enabling managers (with ROIS knowledge) to extract around 20% of all profits to be made with prospective influencers in a wave of newly registered users, namely for ROIS levels above 280% (at maximum up to 60%, if ROIS is around 1,000%). Without ROIS knowledge, the profit realization is naturally lower, yet still meaningful, around 15%. A naive model with a random selection always results in losses, yielding a (negative) median profit realization of −31%.
We also test robustness related to the influencer definition by using the number of followers instead of the number of plays, and to test sensitivity, we replicate all analyses with other success measures, that is, the top 1% and 2% in addition to the top 1.5% (in terms of both plays and followers). Finally, we test sensitivity related to the discount factor.
Our contribution is predominantly conceptual/managerial: We believe this work triggers a paradigm shift toward a forward-looking approach in influencer marketing by targeting prospective influencers instead of actual ones. At the same time, it provides a framework that formulates this forward-looking approach. We also offer substantive insights from the empirical demonstration and application: It seems that the users who at an early stage actively reach out to other users by following them, sending them private messages, and so forth—and who are at the same time able to trigger reciprocal activities of the same form—are the ones who can eventually build meaningful social capital, and therefore ultimately become influencers. These outgoing and incoming activities (i.e., the interactivity) are the main predictor of prospective influencers, as our findings suggest.
The remainder of the article is organized as follows. In the subsequent sections we present an overview of related literature, followed by a description of the framework and then an empirical demonstration and application. We conclude the article with a discussion of our findings and the framework's limitations.
Background
This work is related to two streams of literature: (1) influencer seeding, which we discuss with a focus on user-generated content platforms, and (2) a purely methodological stream that concentrates on rare-event predictions.
Influencer Seeding
A large body of literature exists on seeding and viral marketing campaigns, providing insights and guidelines, especially for optimal seeding-target choice (e.g., Goldenberg et al. 2021). Within the vast literature on social influence and contagion, it is widely agreed that influencers—from hubs to market mavens (e.g., Goldenberg et al. 2009)—play a central role due to their ability to either accelerate or block dissemination. Some articles do not agree with the influencer paradigm (e.g., Beichert et al. 2023; Chen, Van der Lans, and Phan 2017; Lanz et al. 2019), a debate that falls outside the scope of our article.
In recent years, influencer marketing has aroused great interest, a trend fueled by the emergence of user-generated content platforms. On such platforms, influencers can create a higher exposure relative to unknown users, and thereby are able to influence an exceptional number of their peers, making these influencers powerful seeding targets.
For example, Hinz et al. (2011) show that influencer seeding outperforms two other policies focusing on fringes and bridges. From two small-scale field experiments as well as a viral text-message campaign involving more than 200,000 mobile-phone users, they find high-indegree seeding to be most effective, partially because influencers capitalize on their greater reach and not entirely because they exhibit a higher influence than others. Yoganarasimhan (2012) applies dynamic panel data modeling to compare the same seeding policies using secondary data obtained through crawling of YouTube. In line with Hinz et al. (2011), Yoganarasimhan (2012) finds influencer seeding to be most effective. But recently the costs of influencer endorsements have skyrocketed and can reach hundreds of thousands of dollars (Hopper HQ 2023), or sometimes millions, as in the rare case of Kylie Jenner. Given these high costs, the present article focuses on a new type of seeding target: prospective influencers, that is, users before they accumulate a high indegree and become influencers.
Rare-Event Predictions
In the context of predictions, a common theme is that the prevalence of all possible future outcomes is of the same order of magnitude. However, this is not the case when outcomes include rare events and signals are weak (as in the case of detecting prospective influencers). As a result, applying models such as logit leads to an underestimation of the probability of occurrence. King and Zeng (2001) show that this underestimation is particularly severe if the mean of the binary variable and the number of observations are both small, causing a bias in the intercept of the regression.
To address this issue, Firth (1993) suggests preventing it from arising by penalizing the maximum likelihood estimates with the Jeffreys invariant prior, whereas King and Zeng (2001) propose an oversampling technique including bias correction. Similarly, Chawla et al. (2002) offer an oversampling approach—SMOTE—in which the rare event is oversampled by creating “synthetic” examples.
Extreme gradient (tree) boosting offers a viable alternative to the preceding models, because it is a scalable machine learning system and thus widely used for classification when outcomes include rare events. Deep learning models—such as those that train neural networks using backpropagation—are other high-performing black-box algorithms used for classification tasks.
Naturally, different models can perform better or worse as a function of the data and the dynamics at hand. In this article, and in contrast to previous work, we propose a general framework that is not sensitive to any particular prediction model: any model specification can be used to rank users based on estimated probabilities of becoming an influencer. More specifically, the model specification provides a predicted probability of becoming an influencer for each user, and these scores are used to rank the users in a decreasing order. For a first performance evaluation, we then rely on signal-detection theory to evaluate predictive performance, an approach initially developed by radar researchers as a tool to distinguish meaningful information from noise. Some of the prediction models we evaluate in the empirical part are deep learning, extreme gradient boosting, logistic regression, and rare-event models by Firth (1993) as well as King and Zeng (2001), while also using SMOTE training sets.
Proposed Methodology Rationale
Since prospective influencers are still unknown in the present, they feature two important advantages over actual influencers: (1) they are more receptive to endorsement requests (e.g., Lanz et al. 2019), and (2) they are willing to endorse a brand at a price that is lower by several orders of magnitude; namely, if a user has just a couple hundreds of followers instead of a million followers, then the average cost per branded post drops from tens or hundreds of thousands of dollars to several dozen dollars (Hopper HQ 2023).
The question is therefore as follows: considering the rare-event nature of the problem, how can managers detect and select prospective influencers for future endorsements (e.g., more than a year later)?
The selection is made among new users a few months after their platform registration: given a wave of such newly registered users, the decision revolves around when to buy future endorsements and which new users to buy from. This requires a learning phase to learn the influencer market at hand (using historical network data), and only then one can actually buy future endorsements in the implementation phase (using current network data).
More specifically, when using historical network data in the learning phase of the framework procedure, two inherent economic trade-offs arise. First is the timing trade-off, which concerns when to buy: postponing comes with richer data (improving the detection of prospective influencers and thus decreasing wasted spend), but also a smaller pool of prospective influencers, because many new users are no longer unknown. Similarly, in the selection trade-off, which concerns which new users to buy from, selecting more new users improves detection but also increases wasted spend (and vice versa).
Solving these two trade-offs in the learning phase gives an information triplet (S, m, t) as an output for the implementation phase: (1) a concrete buying time t (solving the timing trade-off) and (2) a concrete selection size S, as well as (3) a concrete model specification m (solving the selection trade-off). Hence the learning phase of the framework procedure (Steps 1 to 3) does not point out specific individuals.
The information triplet finds its use in the implementation phase (Step 4), namely for use on current network data. More specifically, in the implementation phase, (1) fresh data are collected on a wave of newly registered users until the buying time t, before (2) applying the model specification m to generate a decreasing ranking of the new users, where (3) the selection size S indicates the cutoff along this decreasing ranking. Therefore, the information triplet from the learning phase effectively determines when to buy and which new users to buy from in the implementation phase.
Challenges and Assumptions
The proposed framework entails challenges and relies on certain assumptions, which we detail in the following sections.
Prediction challenges
Since typically only a few newly registered users ultimately become influencers (almost all of them stay unknown, which includes churning creators), the task is a rare-event prediction. In addition, as the time horizon of the future endorsement is relatively long (i.e., more than a year), the signals of becoming an influencer are weak.
Data-collection challenge
In the learning phase, the models must be trained on historical network data that span at least the time horizon of the future endorsement (i.e., more than a year), namely starting with a wave of newly registered users and ending when influencers have emerged (where the number of successes, i.e., new users becoming influencers, is small). As opposed to the historical network data, the current network data in the implementation phase span a much shorter period, where the buying time from the triplet (resulting from the learning phase) defines the data-collection time frame (i.e., a few months after the new users’ platform registration). In fact, the span of the current network data is on the order of months, and in the case of the historical network data it is on the order of years. It follows that the information about who ultimately becomes an influencer is not available in the current network data.
Data-relevance assumption
Since the time horizon of the future endorsement is on the order of years (i.e., more than a year), the models must be trained on historical network data with at least the same length, containing the same variables. Therefore, we assume that the achieved predictive performance based on the past has relevance to the expected performance in the future of more than a year ahead (note that this is an implicit assumption in predictions in general). Due to the weak signals and fluctuations caused by small numbers and zeros at an early stage—especially when trying to account for short-term time trends—we aggregate the data on the monthly level.
Manager assumption
Although there may be other objectives (e.g., philanthropy), here we assume that the manager is interested in financial success and does not take into account uncertainty; hence the manager's objective is to maximize expected profits.
ROIS assumption
We account for two types of managers, namely, managers with and without ROIS knowledge. However, we do not assume that an informed manager has exact ROIS knowledge; we only assume that the manager knows the order of magnitude of the ROIS. This general idea about the bang for the buck may come from industry reports or, most likely, from internal sources such as past influencer marketing campaigns, in which influencer endorsements were paid for (costs) and their impact on sales tracked through coupon-redemption codes or personalized affiliate links (revenues; e.g., Haenlein and Libai 2017; Influencer Marketing Hub 2023). These codes or links embedded in the influencer endorsement allow for the attribution of any given sale on a proprietary platform to a given influencer, because unique codes and links are provided to influencers, with coupon codes being particularly effective because they are a cookieless tracking solution. Note that independent of ROIS knowledge, the objective of maximizing expected profits holds.
Proxy assumption
We assume that there are observable proxies of financial success—such as network status (e.g., followers) or content-consumption level—which are positively correlated with revenues, a common assumption in the seeding literature (e.g., Hughes, Swaminathan, and Brooks 2019). Another assumption is the discrimination between future success and failure in a wave of newly registered users by means of a threshold, that is, top x% in terms of eventual network status or content-consumption level. Naturally, given a new user who ultimately becomes an influencer (i.e., more than a year later) and is thus a success, the revenues vary according to the network status or content-consumption level that the user ultimately reaches. Here we assume that a manager can approximate these revenues using the order of magnitude of the average ROIS.
Cost assumption
Since in a wave of newly registered users everyone is still unknown, we assume the cost of a single future endorsement to be low—that is, at most on the order of hundreds of dollars (Hopper HQ 2023)—and approximately uniform. Another assumption is that these new users accept endorsement contracts (e.g., Lanz et al. 2019) and that the contracts are enforceable, particularly since influencers face legal actions as well as reputation risks if they do not adhere to contractual agreements. Finally, we assume absence of elasticity between cost and revenues: the low and approximately uniform cost changes neither the revenues from the future endorsement nor the new user's probability of either becoming an influencer or staying unknown. Note that this uniform cost could also include several future endorsements, instead of just one, or even a future on top to further increase the returns (and hence ROIS). Importantly, we assume that the signing of prospective influencers remains private information by means of contractual agreements, ruling out another potential source of elasticity.
These challenges and assumptions are the starting point of the proposed framework. For convenience and clarity, we outline its procedure as a sequence of steps, which Figure 1 summarizes.

Flow Chart of the Framework Procedure.
Learning Phase (Using Historical Network Data)
Step 1: Calculating the Probability of Detection and False Discovery
In this first step, the main task is to calculate (1) the probability of detection PD(S, m, t) and (2) the probability of false discovery PF(S, m, t). For this first performance evaluation of information triplets for the detection of prospective influencers, historical network data are used. These data consist of three points in time, where time is measured in months: (1) the time t = 0 of platform registration, (2) the buying time t when the future endorsements are bought (e.g., 3 to 12 months after registration), and (3) the endorsement time T of gaining the eventual revenues (e.g., more than a year after buying). Therefore, the historical network data have a length of T months such that T > t > 0, and it is on the order of years (unlike the length of the current network data, which is on the order of months; i.e., the data-collection time frame only extends to the buying time t).
All information from the historical network data is utilized to learn the influencer market of buying the future endorsement at buying time t and gaining the eventual revenues at endorsement time T, namely by performing out-of-sample predictions. The gained revenues at time T vary according to the network status or content-consumption level that different users ultimately reach, and thereby serve as observable proxies of financial success (positive correlation with revenues). The cost c of a single future endorsement from a user i is paid at buying time t, and it is thus disconnected from the eventual revenues ri stemming from this endorsement, which materialize at endorsement time T. Given the discrimination between success and failure, that is, whether or not a user reaches the top x% in terms of eventual network status or content-consumption level, it follows that ri ≈ 0 for failures (i.e., revenues are insignificant).
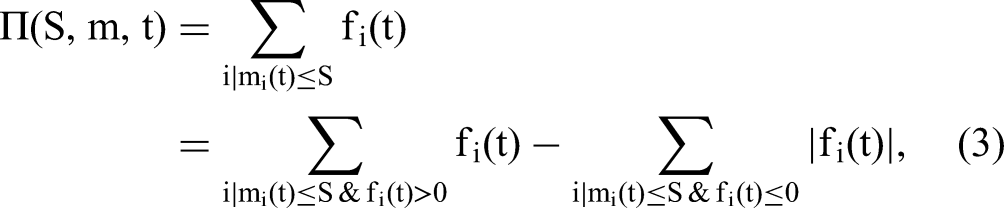
Along these lines, let fi(t) = −δtc + δTri be the discounted profits from a user i with a given eventual network status or content-consumption level, when a future endorsement is bought from this user i at buying time t, where δ is the (monthly) discount factor. By definition it follows that f1(t) > f2(t) > … > fN(t)(t) such that user i is a sorted index. N(t) is the total number of new users at time t who are still unknown and thus feasible for affordable future endorsements. From these N(t) total users, n(t) ultimately become influencers; hence they are the prospective influencers, who should be detected and selected. In contrast, N(t) − n(t) stay unknown, where N(t) along with n(t) exclude the users who are no longer unknown at buying time t (and are thus infeasible for future endorsements due to a higher cost). They are considered influencers forever from this point on.
At buying time t, a given model specification m is applied to generate a decreasing ranking of the N(t) still unknown users (i.e., based on estimated probabilities of becoming an influencer): Let mi(t) be the rank generated by the model specification m to a user whose index based on the (decreasing) discounted profits fi(t) was i. Hence, the model specification m creates a permutation mi(t) to the sorted user index i. 1 On the basis of this permutation, the predictive performance of a given model specification m is being evaluated, that is, out of sample while using the historical network data.
More specifically, given a selection size S along the decreasing ranking of the N(t) still unknown users (generated by a model specification m at buying time t), the selection only includes those for whom mi(t) ≤ S. In this context, let nps(S, m, t) be the number of prospective influencers in the selection S; they are the selected users i for whom mi(t) ≤ S and fi(t) > 0, namely the ones who are associated with positive discounted profits (i.e., the profitable selection).
Then, the (out-of-sample) probability of detection (also referred to as recall, sensitivity, or the true positive rate) is given by


The probability of detection and false discovery offers a first performance evaluation of (1) buying time t, (2) selection size S, and (3) model specification m for the detection of prospective influencers. While the two probabilities give insights into signal detection in the out-of-sample predictions of these triplets (S, m, t), the two probabilities are not sufficient to uncover dominant ones, which is subject to the next step.
Step 2: Uncovering the Set of Dominant Triplets
Known at this point from Step 1, and now utilized, are (1) the probability of detection PD(S, m, t), (2) the probability of false discovery PF(S, m, t), (3) the number of prospective influencers n(0) at platform registration time t = 0, and (4) the number of prospective influencers n(t) at buying time t.
In this second step, the main task is to calculate (1) the realized market RM(S, m, t) and (2) the wasted influencer spend WS(S, m, t), namely for uncovering the set of dominant triplets (which is independent of ROIS knowledge as well as the cost c). Considering the common case of expected profit maximization, let the total discounted profits on the selected users according to a selection size S along the decreasing ranking generated by a model specification m, applied at buying time t (e.g., 3 to 12 months after platform registration), be
Since the revenues are approximated from the profitable selections with the order of magnitude of the average ROIS,
For unprofitable selections, it follows that ri ≈ 0. Hence, fi(t) ≈ −δtc. Then the maximum profit potential of a wave of newly registered users, assuming the future endorsements are bought at platform registration time t = 0, is given by

Along these lines, the realized market (the detected proportion of prospective influencers) is given by


Not only does the selection size S produce a trade-off; the buying time t does too (timing trade-off): A later time for buying a future endorsement implies a lower probability of false discovery PF(S, m, t) and thus smaller wasted influencer spend WS(S, m, t). However, a later time also drastically reduces the pool of prospective influencers: The number of users n(t) who are still unknown and feasible for affordable future endorsements becomes smaller and smaller, which results in a smaller realized market RM(S, m, t).
The following example demonstrates the calculation of the realized market and the wasted influencer spend: Imagine a wave of N(0) newly registered users, in which the prevalence of future success at this platform registration time t = 0 is n(0) = 12 prospective influencers, namely 12 new users ultimately become influencers (where n(0) << N(0) as success is a rare event). Now let us consider the buying time t = 6 months, at which time we find that only 10 of these prospective influencers are still unknown and thus feasible for affordable future endorsements (two are no longer unknown at buying time t = 6 months). Hence, the prevalence of future success at buying time t = 6 months is n(6) = n(0) − 2 = 12 − 2 = 10 prospective influencers. Using the (historical network) data on all N(6) = N(0) − 2 ≈ N(0) new and still unknown users (but excluding the two who are no longer unknown), applying a given model specification m generates a decreasing ranking (i.e., based on estimated probabilities of becoming an influencer).
Then, let us consider a selection size, for example, S = 15, along the decreasing ranking of the N(6) users (generated by model specification m). Imagine that 3 of these 15 selected users are prospective influencers, namely nps(S = 15, m, t = 6) = 3, meaning that 12 of the 15 are false discoveries. Of course, with an increasing selection size, most likely nps(S > 15, m, 6) also increases. At the extreme, if the selection size equals the number of all N(6) users, then by definition it follows that nps(N(6), m, 6) = 10 > 3.
For the selection size of S = 15, the probability of detection is
With ROIS knowledge, it is possible to calculate profits by utilizing Equations 4 and 7. If costs are recovered by one order of magnitude in terms of profits (i.e., ROIS = 1,000%), then the maximum profit potential would be F0 = n(0) × c{−1 + ROIS + 1} = 12 × 1{−1 + 10 + 1} = 120 (assuming cost units, i.e., c = 1, and no discounting of time, i.e., δ = 1), and therefore profits would be Π(15, m, 6) = F0 × RM(15, m, 6) − c × WS(15, m, 6) = 120 × 25% − 1 × 12 = 18.
To conclude the example, historical network data are the basis for the calculation of the realized market and the wasted influencer spend (and if ROIS is known, also profits). These calculations of the realized market and the wasted influencer spend then allow for the assessment of any triplet (S, m, t) and the uncovering of the set of dominant ones, which we outline in the following paragraph.
Assuming that the maximum profit potential F0 > 0 (otherwise no selection is being made), a triplet (S, m, t) should be considered if for all other triplets (Sʹ, mʹ, tʹ), it is true that if RM(Sʹ, mʹ, tʹ) ≥ RM(S, m, t) then WS(Sʹ, mʹ, tʹ) ≥ WS(S, m, t), and if WS(Sʹ, mʹ, tʹ) ≤ WS(S, m, t) then RM(Sʹ, mʹ, tʹ) ≤ RM(S, m, t). This constitutes the set of dominant triplets SDT, where all other triplets that do not satisfy this inclusion condition should not be considered. 2 From the inclusion condition, which essentially forms an efficient frontier, it follows that the set of dominant triplets SDT is independent of ROIS knowledge (as well as the cost c).
Step 3 (Informed Manager): Find the One Dominant Triplet Choice (Based on Profit Maximization)
Known at this point from Steps 1 and 2, and now utilized, by an informed manager (i.e., a manager with ROIS knowledge) are (1) the set of dominant triplets SDT, the realized market RM(S, m, t), (2) the wasted influencer spend WS(S, m, t), (3) the maximum profit potential F0, and (4) ROIS (including the cost c of a single future endorsement).
In this third step, the main task is to perform profit maximization, namely for use in finding the one dominant triplet choice to be made later on in the implementation phase, where the maximization problem in the set of dominant triplets SDT is given by

This third step marks the end of the learning phase and illustrates that the output is not specific user names: the one dominant triplet choice (S*, m*, t*) provides for the implementation phase (1) a concrete buying time t* and (2) a concrete selection size S*, as well as (3) a concrete model specification m*, where the model specification is the “recipe” that can be used in combination with the selection size to decide which new users to actually buy future endorsements from in the implementation phase.
Step 3 (Uninformed Manager): Prepare the Suggested Cumulative Voting Procedure
An uninformed manager (i.e., a manager who does not have ROIS knowledge but still wants to make a choice) only utilizes (1) the realized market RM(S, m, t) and (2) the wasted influencer spend WS(S, m, t). Note that (3) the maximum profit potential F0 and (4) ROIS, including the cost c of a single future endorsement, are unknown.
In this third step, the main task is to prepare a cumulative voting procedure, which is employed in the implementation phase. Note that the proposed framework could account for a variety of procedures, and we present just one here. The buying time is given by the median buying time in the set of dominant triplets, that is, t* = med(t), and the selection size is given by the prevalence of future success, namely the number of prospective influencers in the historical network data at buying time t*, that is, S* = n(t*). Hence, there is a concrete buying time t* and a concrete selection size S*. However, concerning the model specification, it is not concrete at all: for the preparation of the suggested cumulative voting procedure, each and every model specification in the set of dominant triplets must be taken; hence there may even be duplicates. As can be seen in the fourth step, every single model specification will provide a ranking, and with the cumulative voting procedure, these rankings will be aggregated into one overall ranking. Whereas both types of managers rely on the set of dominant triplets, the uninformed manager cannot do profit maximization, and instead applies a cumulative voting procedure in the implementation phase. As we show in the empirical demonstration and application, this procedure yields satisfactory results.
Implementation Phase (Using Current Network Data)
Step 4 (Informed Manager): Realize the One Dominant Triplet Choice
Known at this point from the learning phase, and now utilized, is the one dominant triplet choice (S*, m*, t*), and the main task is to (1) collect current network data on a wave of newly registered users, and (2) realize the one dominant triplet choice (S*, m*, t*).
To do this, current network data on a wave of newly registered users are collected, where the data-collection time frame extends from the new users’ platform registration to a few months after, as specified by the buying time t*. Then the model specification m* (calibrated on the historical network data) is applied to this current network data, which generates the decreasing ranking, and the selection size S* indicates the cutoff along this decreasing ranking. Together this determines which new users to actually buy future endorsements from.
Step 4 (Uninformed Manager): Employ the Suggested Cumulative Voting Procedure
An uninformed manager utilizes (1) the buying time t*, (2) the selection size S*, and (3) each and every model specification in the set of dominant triplets (including duplicates). The main task is to (1) collect current network data on a wave of newly registered users, and (2) employ the suggested cumulative voting procedure.
The data-collection time frame extends from the new users’ platform registration to the buying time t*. To this current network data, every single model specification in the set of dominant triplets is applied, after being calibrated on the historical network data, resulting in as many rankings as the set consists of.
To aggregate all these rankings into one overall ranking, we suggest a cumulative voting procedure analogous to ranking mechanisms in sports and entertainment contests (e.g., the Eurovision Song Contest): Considering ranks 1 to S* of every single model specification, for every first rank a given user receives S* votes, for every second rank S* − 1 votes, and so forth, where for every rank S* a given user receives one vote (see Web Appendix B for an example). Note that a linear voting allocation is required, because unlike contests, in which the aim is to select a winner or a podium of winners, here the interest is in determining which top S* users to buy future endorsements from. These are determined by the accumulation of votes across every single model specification.
Empirical Application
In this section, we empirically demonstrate and apply the proposed framework using a data set from a worldwide leading audio platform. This network has a few advantages for research on seeding: First, it is one of the largest user-generated content platforms in the audio domain, with millions of users. Importantly, the platform, compared with Spotify or Pandora, is not only a streaming platform; it is a user-generated content platform on which users (fans and audio creators) interact with one another and do not just consume songs and podcasts. The basic functionalities of following and messaging as well as content reposting, commenting, and liking are almost identical to those of other user-generated content platforms such as X (formerly Twitter), YouTube, and Instagram, which also put interaction of users at their core. Second, this interaction possibility is especially helpful for unknown audio creators, which is why the music industry compares the platform to an incubator. This makes it particularly well suited for our purpose. Third, the platform is home to superstars with millions of followers (and some of these superstars emerged on the platform). For this reason, managers find the platform to be fertile ground for influencer seeding.
In this empirical demonstration and application, we follow the step-by-step procedure and conduct data-based simulations with the goal of comparing the profit realization for different markets in terms of ROIS (where profit realization is the fraction of all profits to be made with prospective influencers in a wave of newly registered users when applying the framework and buying future endorsements accordingly).
Data
Our longitudinal data set is composed of 35,000 users who registered on the platform in the same week. The data were approximately five years old at the time of analysis and covered all incoming and outgoing activities of each user—including follows, messages, podcast/song reposts, podcast/song comments, and podcast/song likes—over a span of more than two years, that is, a 123-week or approximately 31-month time period starting from each user's platform registration.
The platform enables users to upload their podcasts or songs to their user profile; this audio content can then be listened to, commented on, reposted, and liked by other users. As on other user-generated content platforms, users can exchange private messages and also follow each other to receive notifications about their latest activities. To trigger follow-backs (and thus increase their follower base and generate more plays), audio creators can reach out to other users by following them, sending them private messages, reposting their podcasts/songs, commenting on their podcasts/songs, and liking their podcasts/songs.
In the data-based simulations we aim to create a realistic environment in which a manager decides when to buy future endorsements and which new creators to buy from, given a wave of newly registered creators. To separate audio creators from fans in such a wave, the focus is on users who have already uploaded at least one podcast or song, say within the first month after their platform registration (which excludes, for example, fans that turn out to be creators later on). Along these lines, in the data composed of 35,000 users who registered on the platform in the same week, 3,382 are creators, that is, N(t = 0) = 3,382 creators.
These 3,382 creators uploaded on average 9.76 podcasts or songs (SD = 22.46) over the 31-month period. Note that for all these 3,382 creators we have full historical documentation of their entire incoming and outgoing activities over the 31-month period starting from their platform registration. Also note that over the span of these 31 months, the follower base overlap was on average .04 (SD = .01). Hence, the follower base overlap across the 3,382 creators over time was marginal, and therefore the follower bases are effectively independent. The same holds true for sent follows. Table 1 presents relevant descriptive statistics about this sample.
Descriptive Statistics.

We set the buying time t of buying the future endorsements to 3, 6, 9, and 12 months, that is, t = {3, 6, 9, 12} months, and the endorsement time T of gaining the eventual revenues to 31 months, that is, T = 31 months.
Note that all assumptions as outlined in the previous section apply, where the observable proxy for success is plays: We define a creator as having become an influencer if the creator reaches the top 1.5% in terms of average received monthly plays in the last three months of the 31-month period and was therefore able to cross two orders of magnitude before endorsement time T = 31 months (i.e., ≥ 111.98). Creators crossing this threshold earlier are considered influencers and are thus not relevant anymore. For testing sensitivity, we replicate all analyses with other success measures, that is, the top 1% and 2% in addition to the top 1.5%. The rationale behind focusing on plays is that the number of followers represents only potential and not actual content consumption. For testing robustness, we replicate all analyses with network status, that is, the number of followers instead of average received monthly plays.
At buying time t = 3 months, we find that among the N(t = 0) = 3,382 creators, 3,360 are still unknown and thus feasible for affordable future endorsements; that is, N(t = 3) = 3,360 creators, where 22 are no longer unknown at buying time t = 3 months. From these N(3) = 3,360 creators, 44 are prospective influencers, meaning that 44 creators ultimately become influencers; that is, n(3) = 44. 4 At buying time t = 3 months, they receive on average 17.72 monthly plays on their podcasts or songs (SD = 21.78; max = 104.00). 5 Hence, they are still unknown and thus feasible for affordable future endorsements. Note that at later buying times of 6, 9, and 12 months, such prospective influencers are fewer; that is, n(6) = 42, n(9) = 36, and n(12) = 32.
At endorsement time T = 31 months, the n(3) = 44 prospective influencers will receive on average 479.04 monthly plays of their podcasts or songs (SD = 494.99; max = 2,225.20)—and hence of the branded podcast or song paid for at the buying time, every month and also over subsequent months and years after its upload—whereas the creators who stay unknown will receive on average only 2.71 monthly plays.
Data-Based Simulations
In the data-based simulations with 1,000 iterations (or “realizations of the world”), there are—in each iteration—random sample splits used in the learning and implementation phases: two-thirds of the sample is treated as historical network data (with a length of T = 31 months), and one-third is treated as current network data (with a length of t* months).
More specifically, each iteration goes through both phases, where Steps 1 to 3 (representing the learning phase; see Figure 1) rely on historical network data and separate 1,000 out-of-sample predictions, per iteration of the data-based simulations. 6 More specifically, in these separate out-of-sample predictions, half of the historical network data (one-third of the sample with a length corresponding to the time horizon of the future endorsement, i.e., T = 31 months) is a training set to calibrate the model specification—that is, to estimate the βs—before their values are used for out-of-sample predictions in the other half of the data (also one-third of the sample, and also with a length of T = 31 months) to calculate the probability of detection and false discovery as well as the realized market and the wasted influencer spend, namely for uncovering the set of dominant triplets, which is independent of ROIS knowledge (as well as the cost). To find the one dominant triplet choice to be made in the implementation phase, an informed manager (with ROIS knowledge) then performs profit maximization. In contrast, an uninformed manager (without ROIS knowledge) prepares the suggested cumulative voting procedure, which is employed in the implementation phase.
Probability of Detection (PD) and False Discovery (PF) for the Model Specifications in the Set of Dominant Triplets as a Function of the Selection Size S.
In Step 4 (representing the implementation phase; see Figure 1), managers finally buy future endorsements at buying time t* (either by realizing the one dominant triplet choice (S*, m*, t*) or according to the cumulative voting procedure), which then results in a profit realization for a given ROIS. Here, current network data (one-third of the sample) are used, having a length of t* months, as the data-collection time frame only extends to the buying time t* and not endorsement time T (where t* < T). Of course, the information about who ultimately becomes an influencer is not available; it is only used to analyze the profit realization. Also note that due to the random sample split in each iteration, the prevalence of future success is actually n(3) = 44/3 ≈ 15, n(6) = 42/3 = 14, n(9) = 36/3 = 12, and n(12) = 32/3 ≈ 11, in each of the thirds, that is, in the learning phase (with historical network data consisting of two-thirds of the sample) and the implementation phase (with current network data consisting of one-third of the sample).
Learning Phase (Using Historical Network Data)
Step 1: Calculating the Probability of Detection and False Discovery
In the first three steps (representing the learning phase), to learn the influencer market, all information from the historical network data is utilized to perform out-of-sample predictions. In terms of predictors, we consider (1) audio creators’ activities and (2) audio creators’ social capital. Next we provide the theoretical reasoning behind our consideration and describe each predictor in more detail. Subsequently, we elaborate on the wide range of prediction models that we evaluate.
Model specifications: audio creators’ activity as predictor
Since audio creators on the platform seek to build and increase their follower base to generate more plays, they reach out to other users by following them, sending them private messages, and—if these seeding targets are also creators—reposting their podcasts/songs, commenting on them, and liking them. Indeed, such outgoing activities have been found to directly affect plays, and to indirectly affect plays through the audio creator's follower base (e.g., Ansari et al. 2018). We therefore include outgoing activity as predictor to detect prospective influencers t = {3, 6, 9, 12} months after their platform registration, where activeOUTωit denotes the average monthly outgoing activity measure of type ω (i.e., ω is an index) by creator i until buying time t, and ω = {1, 2, 3, 4, 5}, that is, (1) follows, (2) messages, (3) podcast/song reposts, (4) podcast/song comments, and (5) podcast/song likes.
As reciprocal activities of the same form may result, we also include activeINωit as a predictor, which denotes the average monthly incoming activity measure of type ω toward creator i until buying time t. Together with the outgoing activities, this captures the concept of interactivity, which has found to be a key feature of up-and-coming influencers: Beichert et al. (2023) show that for such influencers the follower and influencer engagement—that is, the outgoing and incoming activities—are particularly strong, which directly implies their influential power. This is related to the notion of strength of ties revealed on user-generated content platforms, typically a proxy for mutual confiding, emotional intensity, and so forth (Granovetter 1973).
Additionally, let audioit denote the accumulated number of uploaded podcasts or songs by creator i until buying time t, which is also a form of activity (we include it in the baseline, together with the average received monthly plays until buying time t, playsit). Genre, and especially cross-genre movements working over weak ties, could also play a role; however, since we divide the sample into thirds—with the number of prospective influencers being around 14—we cannot account for it.
Model specifications: audio creators’ social capital as predictor
Outgoing activity also indirectly affects plays through the audio creator's follower base (e.g., Ansari et al. 2018), where the value of a creator's follower base (or egocentric network) is known as social capital (e.g., Coleman 1988). Following network theorists in sociology (e.g., Burt 1992), we take an inside-out view of social capital, focusing on the creator (ego) as well as on the different layers of the creator's egocentric network, or follower base. These layers are commonly characterized by the structure or density of the follower base and, furthermore, by centrality measures (e.g., degree or betweenness centrality) that assess the creator's position within the entire network.
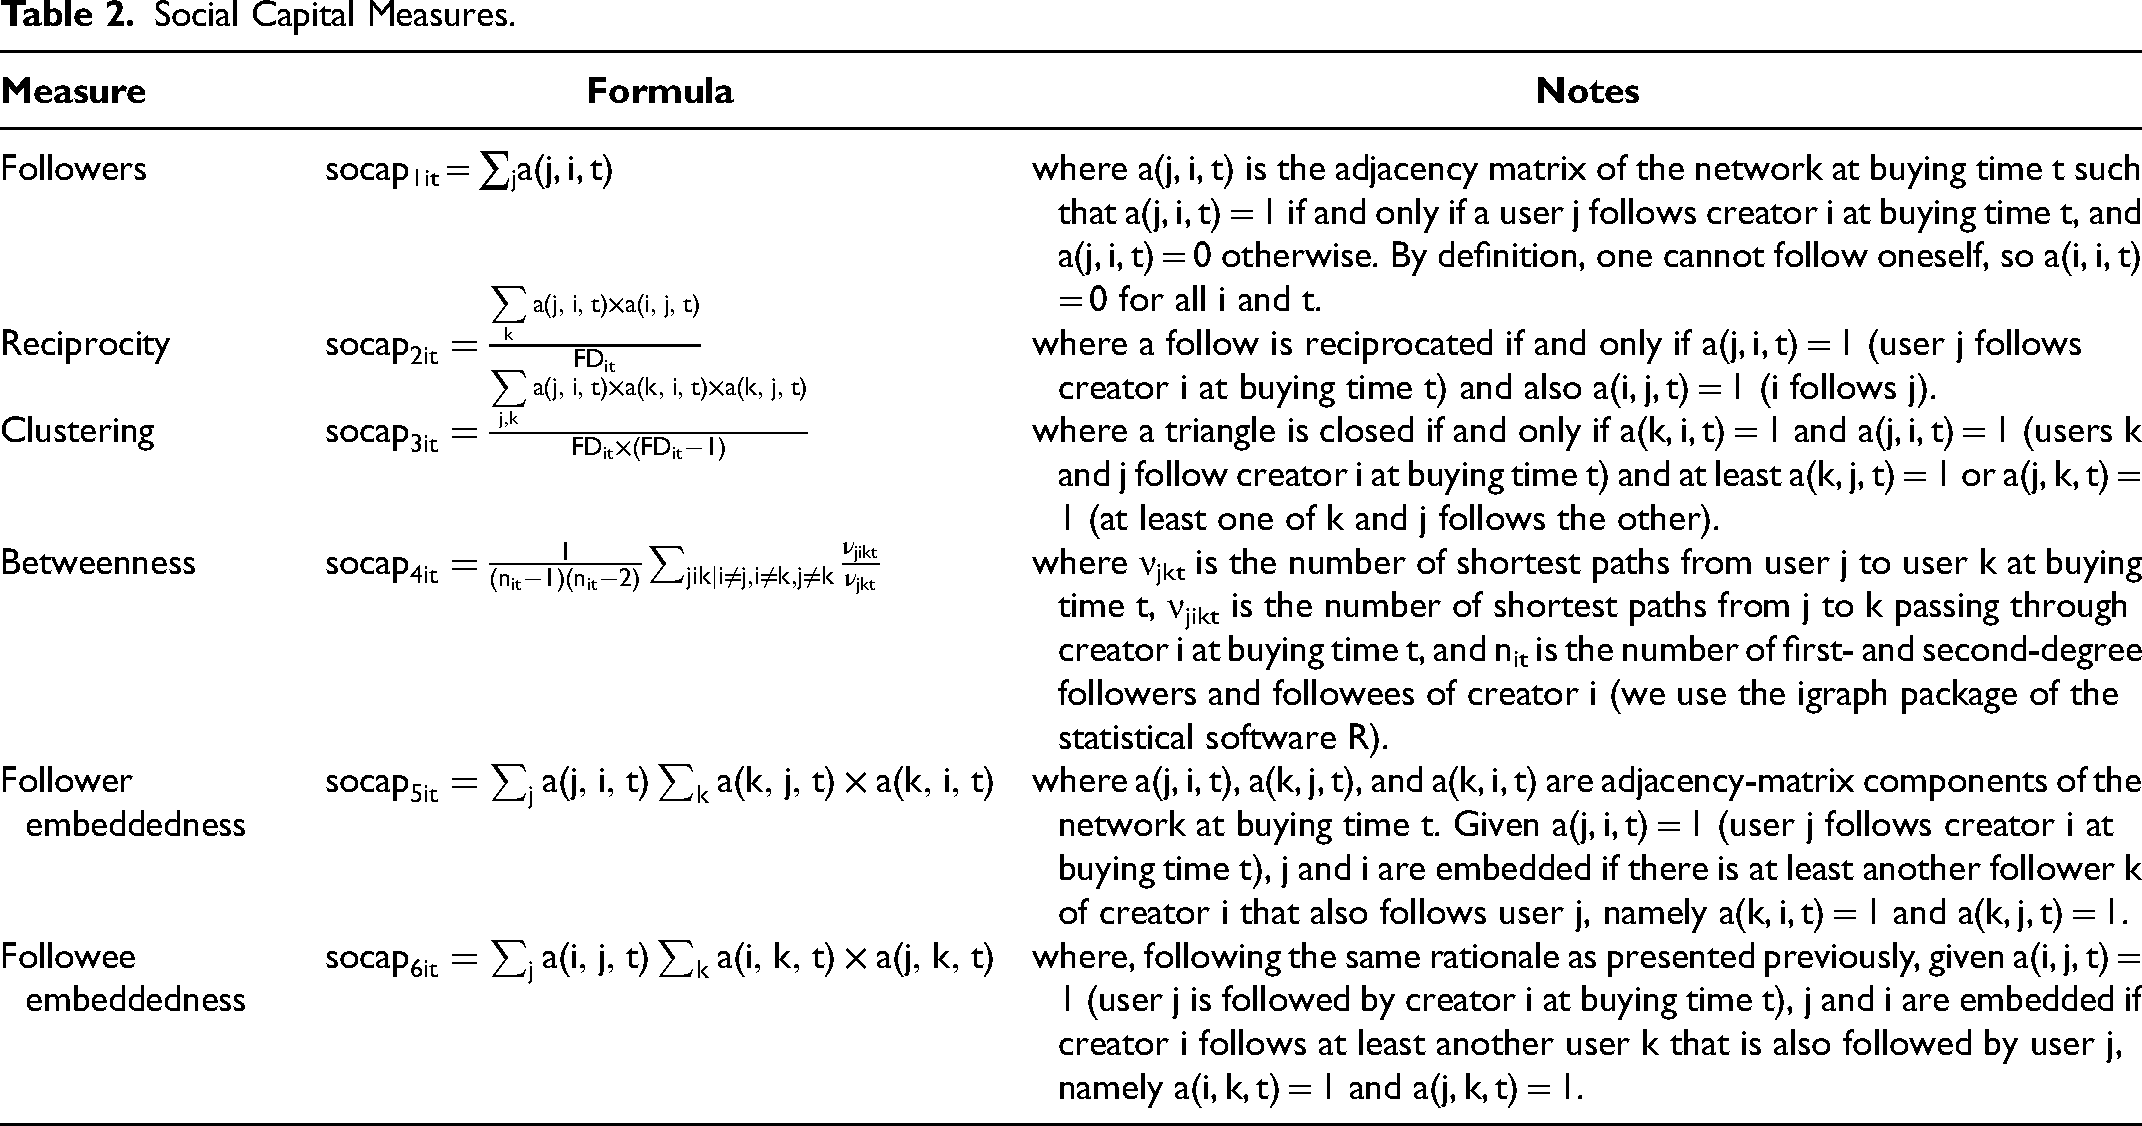
Therefore, we use several measures of social capital based on the creator's egocentric network, where socapρit denotes a social capital measure of type ρ (i.e., ρ is an index) by creator i at buying time t, and ρ = {1, 2, 3, 4, 5, 6}, that is, (1) followers, (2) reciprocity, (3) clustering, (4) betweenness, (5) follower embeddedness, and (6) followee embeddedness. For elaboration on these six social capital measures, see Table 2.
Social Capital Measures.
Model specifications: wide range of prediction models
We evaluate a wide range of prediction models, as the proposed framework is not sensitive to any particular specification since the only purpose of model specifications m is to generate decreasing rankings of audio creators: (1) a linear regression model, (2) a log-linear regression model, (3) a logit model, (4) Firth's (1993) penalized logit model, (5) the oversampling technique including bias correction by King and Zeng (2001), which also builds on the logit model, (6) extreme gradient (tree) boosting, and (7) a deep learning algorithm, which trains neural networks using backpropagation. For elaboration on the seven prediction models and their specifications, see Table 3.
Prediction Models.

Out-of-Sample Predictions
For a first performance evaluation of triplets—that is, combinations of (1) buying time t, (2) selection size S, and (3) model specification m—we perform 1,000 out-of-sample predictions on historical network data (per iteration in the data-based simulations) using the prediction models in different specifications (i.e., combining inputs in an additive manner as well as with and without dynamic inputs to account for short-term time trends). 7
To account for the rare-event problem, we also oversample and create “synthetic” examples in the training set (from historical network data) following the SMOTE (using R's smotefamily; Chawla et al. 2002). We use such oversampled training sets, in addition to the original ones, when applying the deep learning algorithm as well as the logit model. In the case of extreme gradient boosting, we directly weigh for class imbalance. Hence, these additional oversampled training sets add another layer to the combinations of triplets (S, m, t), which we evaluate in this step of the framework procedure.
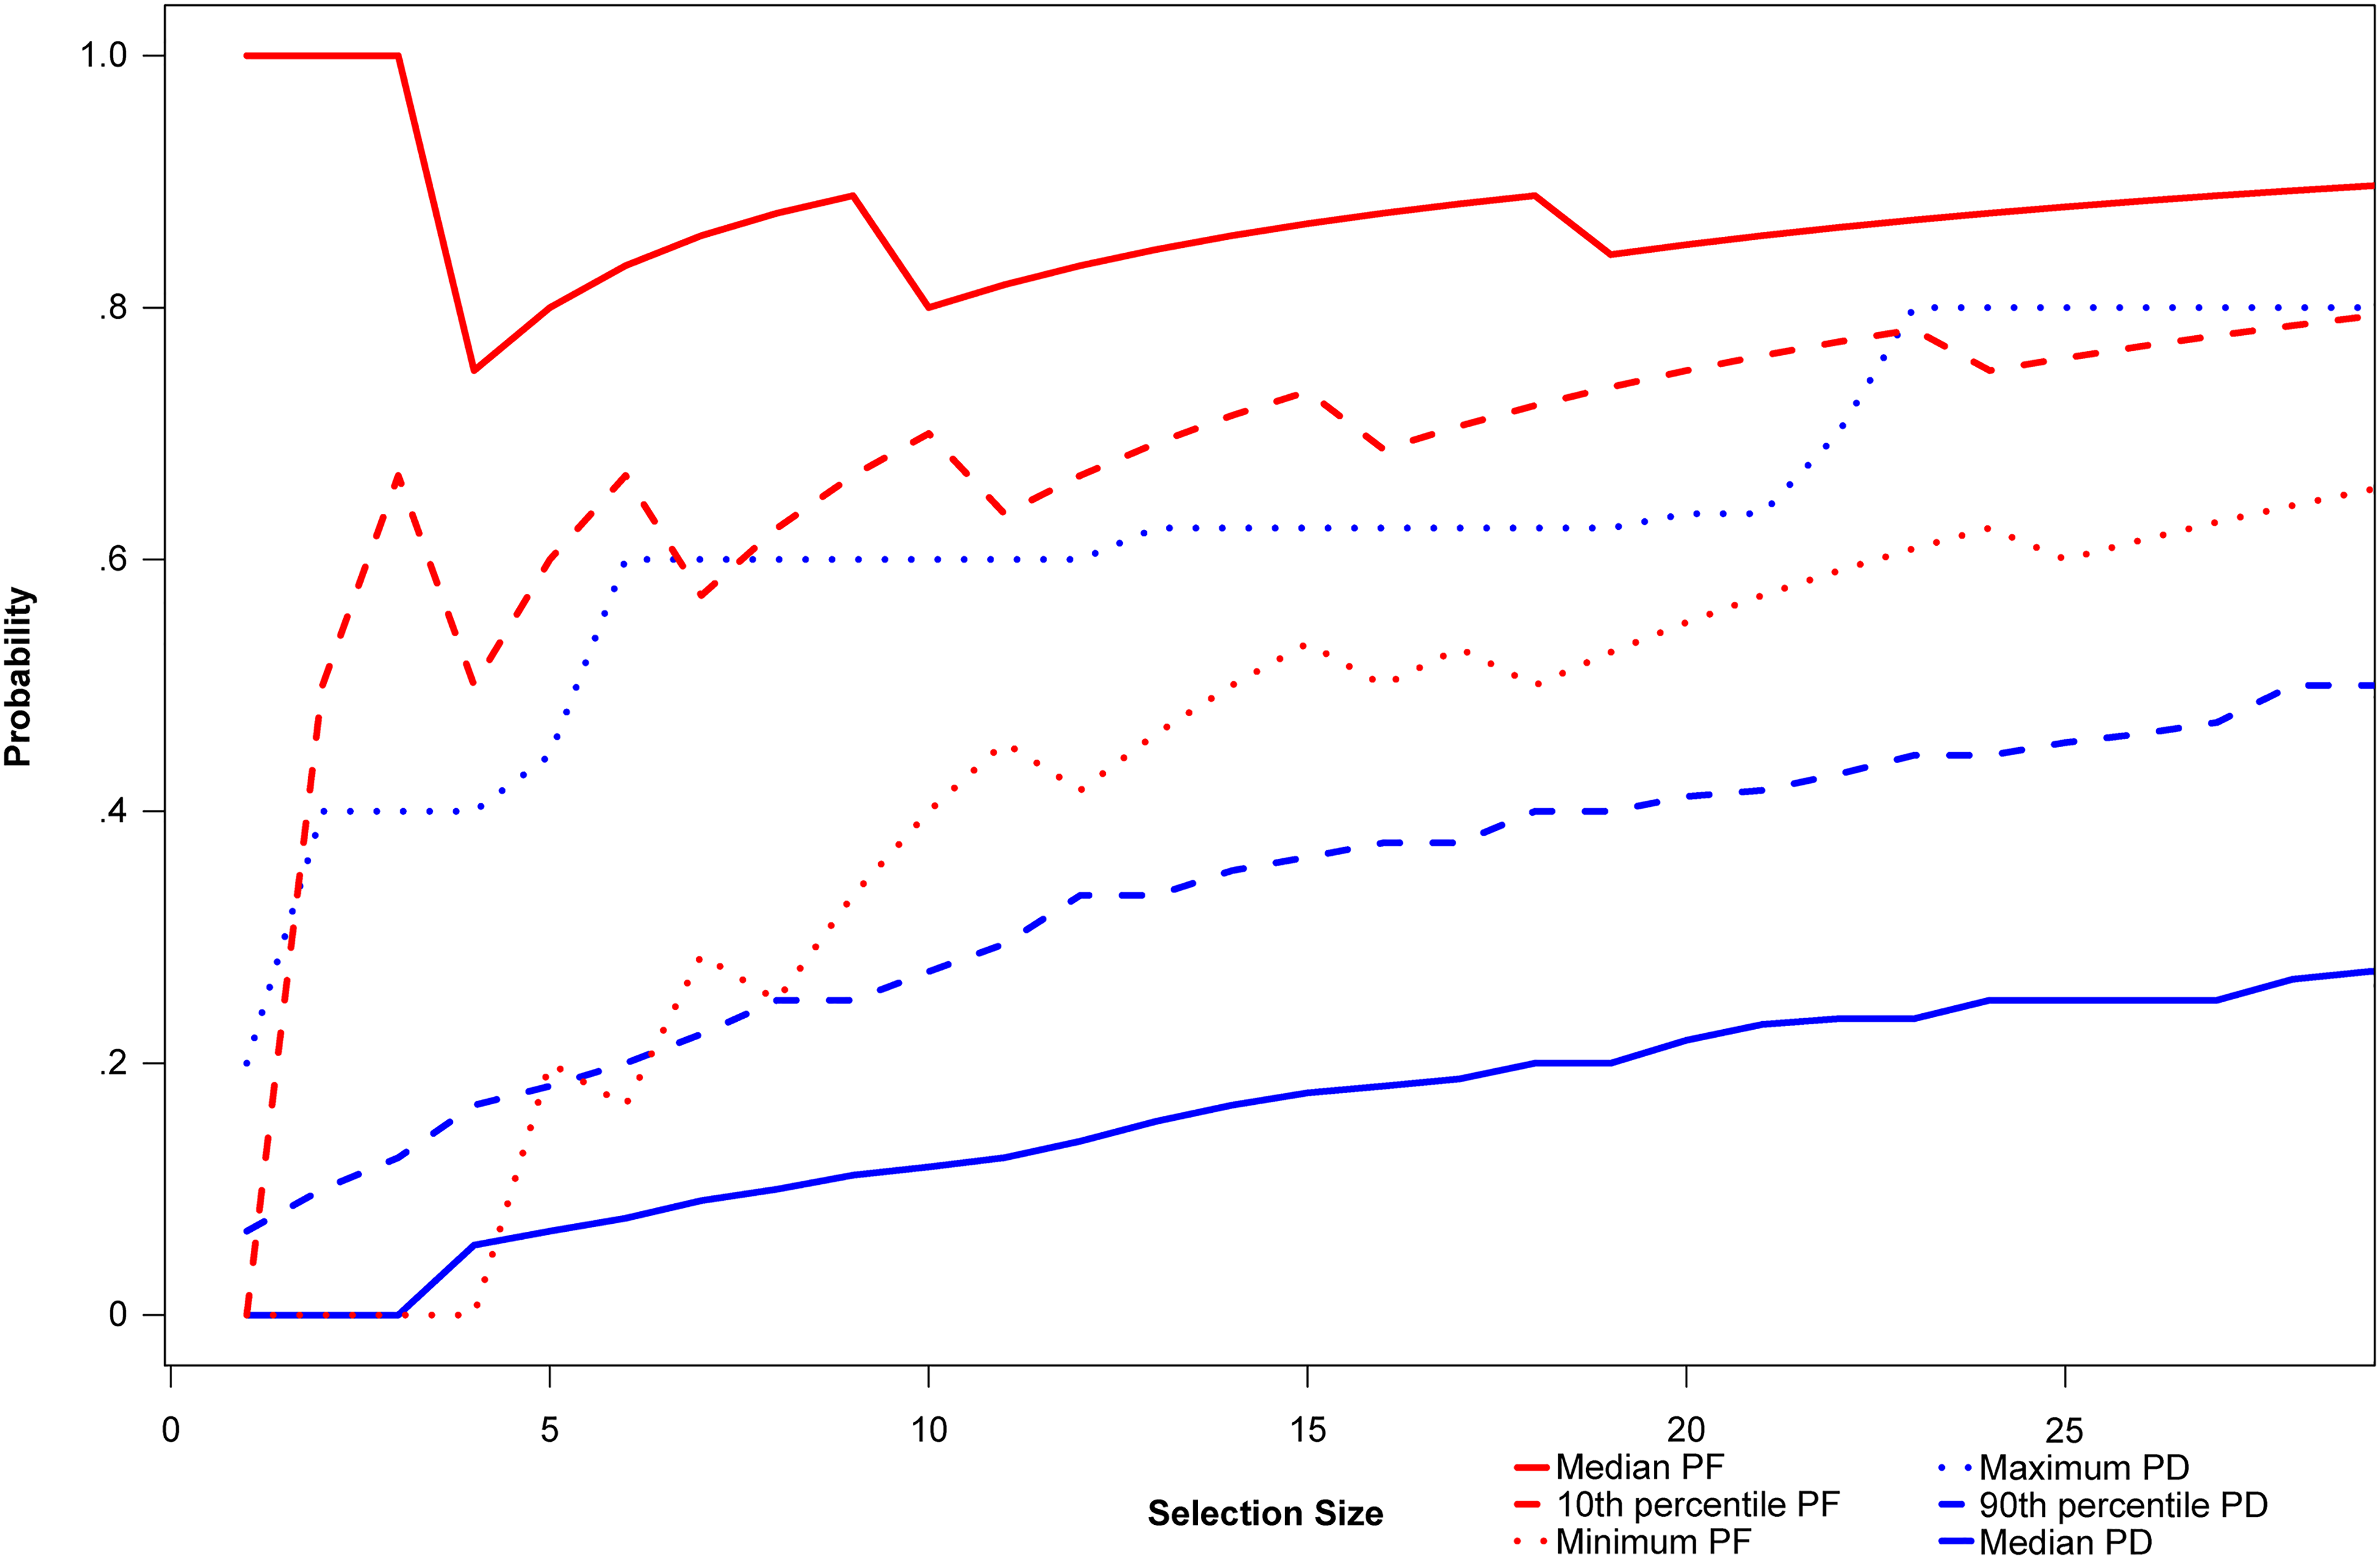
From the out-of-sample predictions, Figure 2 exhibits the probability of detection and false discovery as a function of the selection size S (see Equations 1 and 2) when predicting the average received monthly plays of audio creators (top 1.5%). It portrays average probabilities across the model specifications m in the set of dominant triplets, and only for the buying time t = 6 months, because we find that the whole set of dominant triplets relies on this buying time. In Figure W.1 in the Web Appendix, we provide the same figure for all buying times (and not only for t = 6 months); in Figure W.2 in the Web Appendix, we further provide the average probabilities across all model specifications m (and not only for the ones in the set of dominant triplets).
More specifically, Figure 2 illustrates the minimum (red dotted line), the 10th percentile (red dashed line), and the median (red solid line) of the probability of false discovery as a function of the selection size S, that is, (1) the logit model using the SMOTE training set, (2) King and Zeng’s (2001) oversampling technique including bias correction, and (3) extreme gradient boosting (with the outgoing activity and the incoming activity measures as predictors, as they constitute 80% of the set of dominant triplets). Figure 2 also depicts the median (blue solid line), the 90th percentile (blue dashed line), and the maximum (blue dotted line) of the probability of detection.
Since the prevalence of prospective influencers is n(6) = 42/3 = 14, we visualize the selection size S as S = 30 (twice the prevalence of prospective influencers). Increasing the selection size from 1 to 30 results in a higher probability of detection, which would eventually converge to 1 in the case in which all audio creators and therefore all prospective influencers are selected. However, increasing the selection size results in a higher probability of false discovery, which would eventually get close to 1.
From the distributions of the probability of detection and false discovery in Figure 2, we find that the model specifications m in the set of dominant triplets are effective at detecting prospective influencers, as the maximum probability of detection (blue dotted line) and the minimum probability of false discovery (red dotted line) suggest, especially considering the rare-event nature of the problem and the weak signals due to the relatively long time horizon. 8 On the one hand, the median probability of detection climbs well above 20% (blue solid line) and may go as high as 80% (maximum; blue dotted line). On the other hand, the probability of false discovery ranges somewhere between 50% (minimum; red dotted line) and 80% (median; red solid line).
In Table 4, from the out-of-sample predictions, we provide granular out-of-sample results—in terms of mean values—for the model specifications m in the set of dominant triplets. For example, upon buying future endorsements from 14 in a wave of newly registered creators, which equals the prevalence of prospective influencers as n(6) = 42/3 = 14, then around 3 of them ultimately become influencers. The 3 hits out of 14 (approximately 20%) mean that these model specifications m are effective at detecting prospective influencers, similar to what venture capitalists face when investing in startups (Thiel and Masters 2014). For granular in-sample results, see Tables W.2 to W.4 in the Web Appendix.
Out-of-Sample Results.
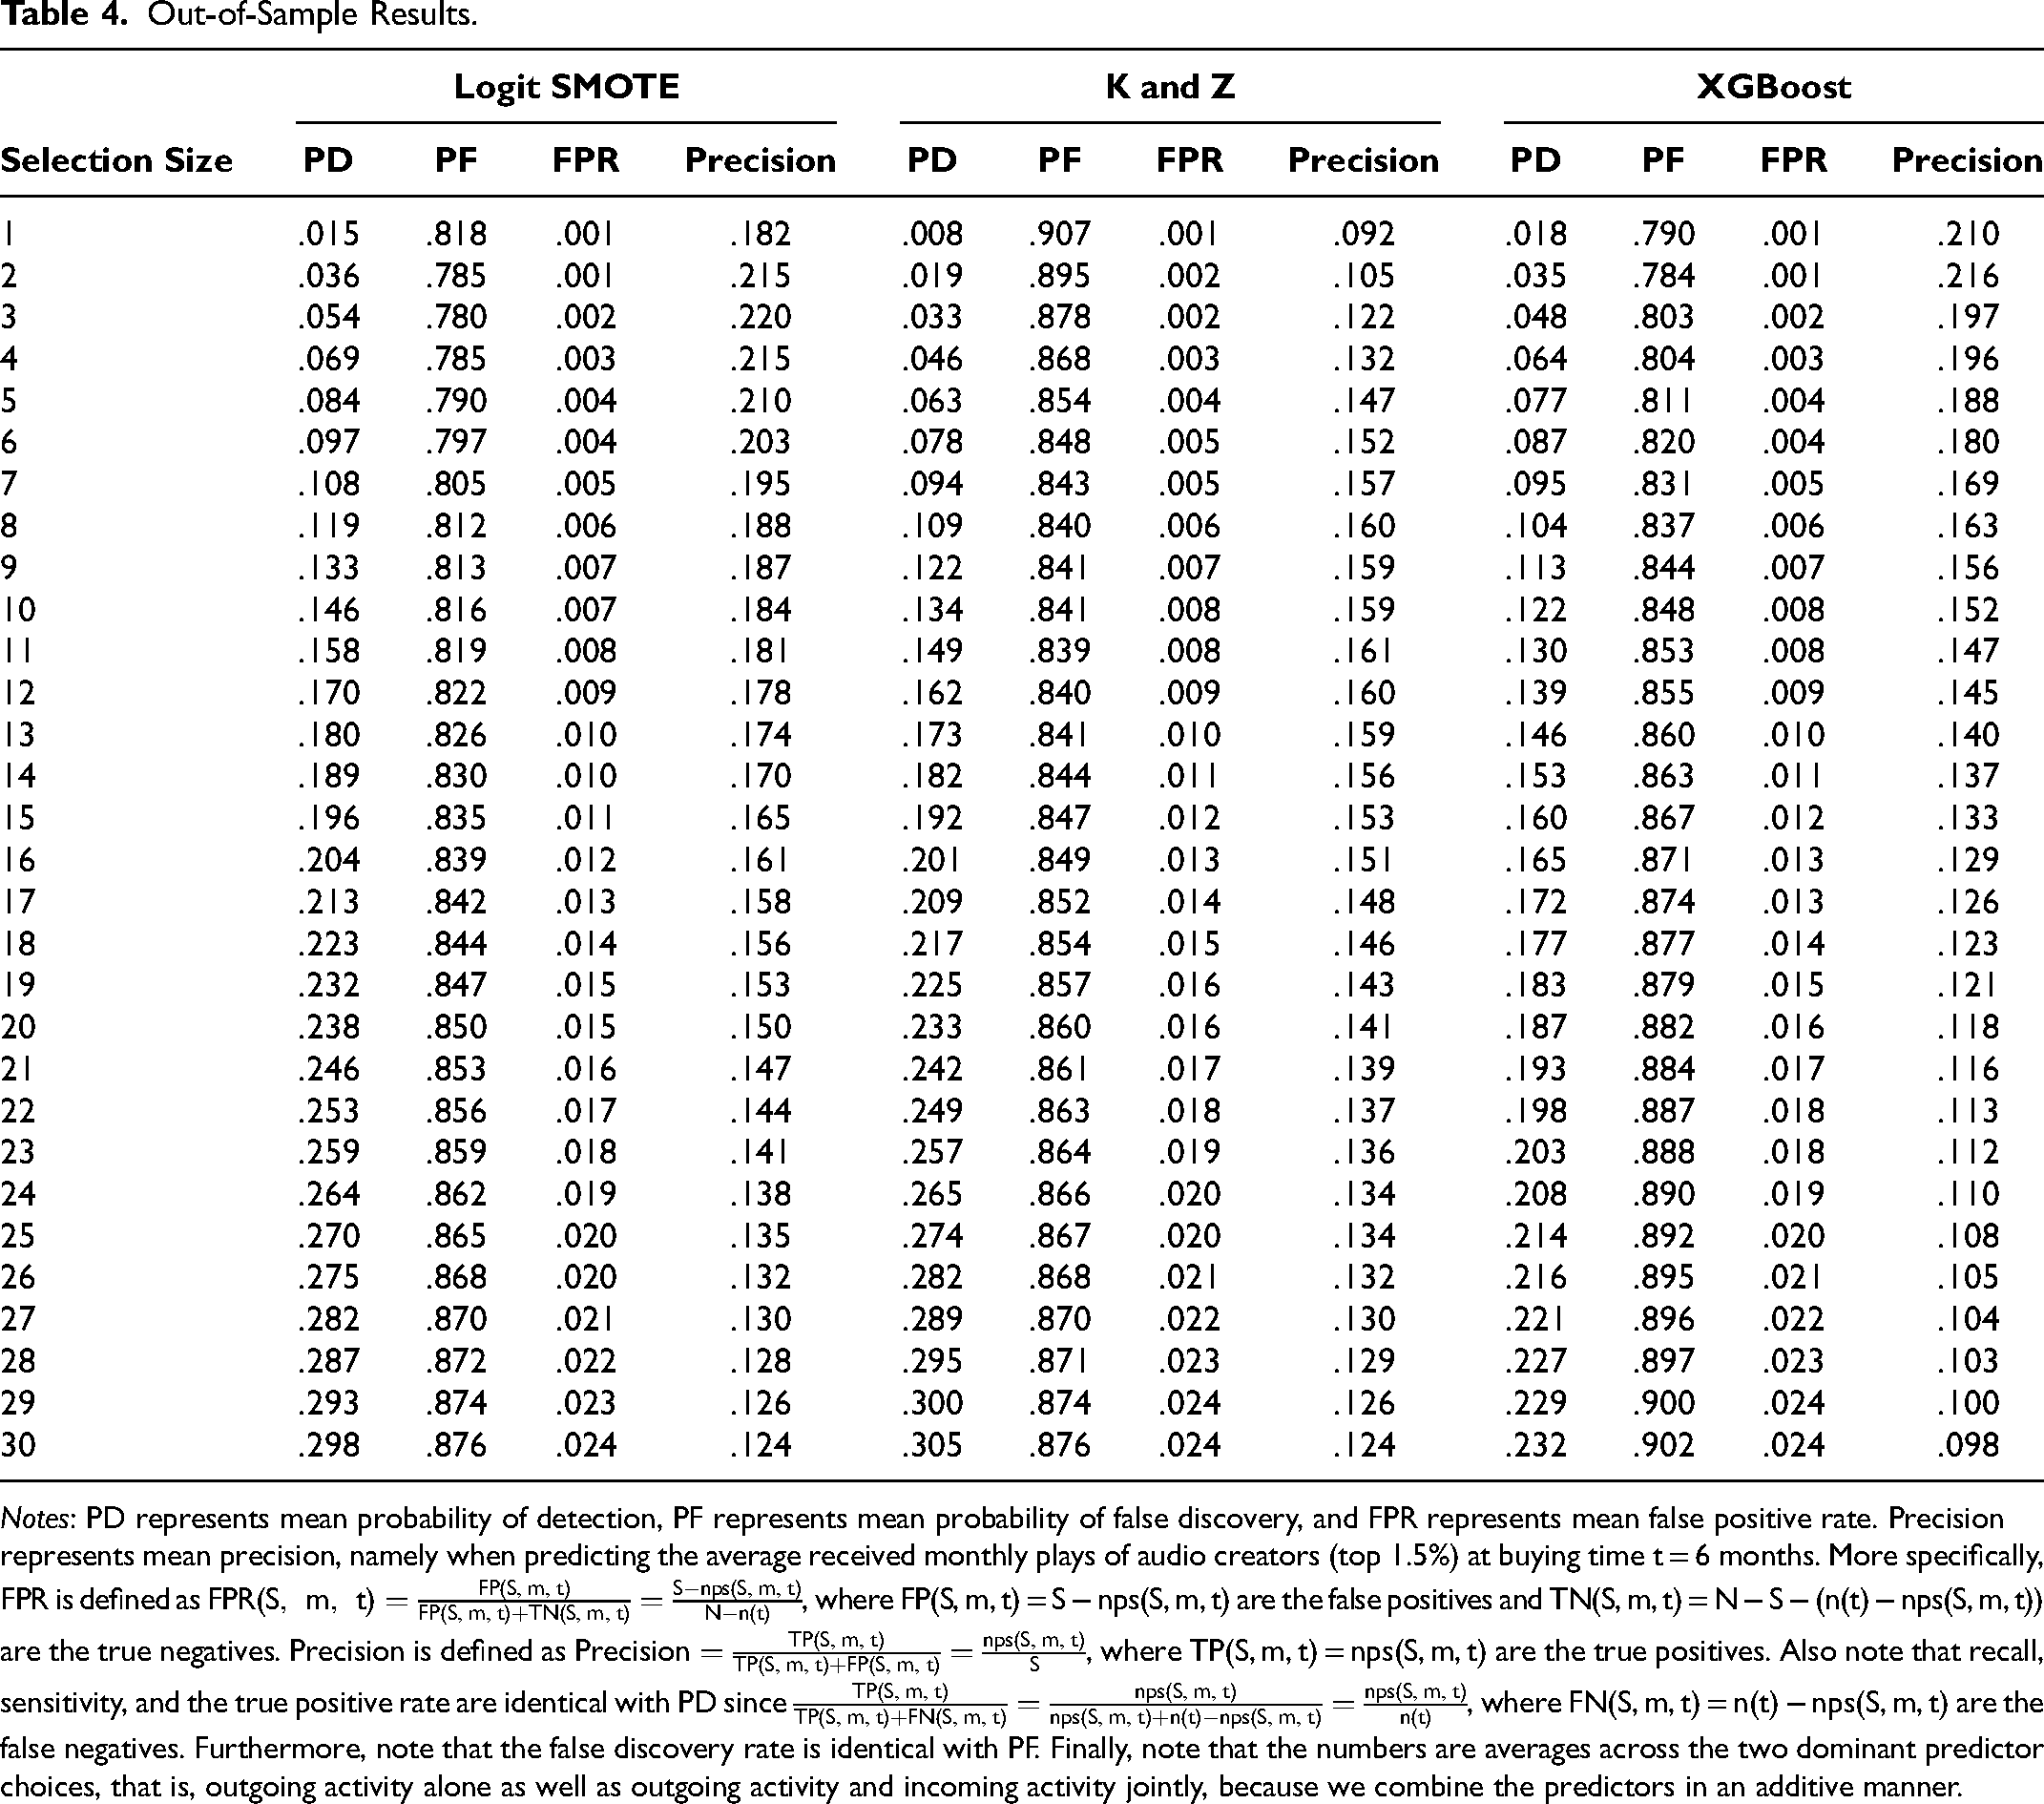
Notes: PD represents mean probability of detection, PF represents mean probability of false discovery, and FPR represents mean false positive rate. Precision represents mean precision, namely when predicting the average received monthly plays of audio creators (top 1.5%) at buying time t = 6 months. More specifically, FPR is defined as
This first performance evaluation of triplets (S, m, t) gives insights into signal detection, but it is not sufficient to solve the inherent economic trade-offs and uncover the set of dominant ones, which is subject to the next step.
Step 2: Uncovering the Set of Dominant Choices
In the out-of-sample predictions, the realized market (the detected proportion of prospective influencers) and the wasted influencer spend are also calculated, where the triplets (S, m, t) that satisfy the inclusion condition are in the set of dominant triplets. Note that for the sake of simplicity, we assume indifference between the present and future, that is, there is no discounting of time (i.e., δ = 1). For testing sensitivity, we subsequently replicate all analyses with δ < 1.
We again consider only selection sizes below twice the prevalence of prospective influencers and find 40 dominant triplets (S, m, t) satisfying the inclusion condition; hence there are 40 combinations of S, m, and t that constitute the set of dominant triplets.
In terms of models, (1) the logit model using the SMOTE training set has a share of 57% among all dominant models, (2) King and Zeng's (2001) oversampling technique including bias correction has a share of 32%, and (3) extreme gradient boosting has a share of 10%. In terms of predictors, (1) the outgoing activity measures and the incoming activity measures have a share of 80% among all dominant predictors, (2) the outgoing and incoming activity measures together with social capital have a share of 10%, and (3) all of them paired with dynamic inputs account for another 10%. We combine predictors in an additive manner (see Table 3), and all model specifications m always include the baseline, that is, the average received monthly plays and the accumulated number of uploaded podcasts/songs until buying time t.
Interestingly, for all 40 in the set of dominant triplets, the dominant time of buying the future endorsement is t = 6 months, hence t* = 6 months. Therefore, we find that future endorsements should neither be bought too early, when signals are still weak (3 months), nor be bought too late, when the pool of prospective influencers is drastically reduced because many from the wave of newly registered creators are no longer unknown (9 or 12 months).
Also interesting is the fact that all dominant models are rare-event models, because not only King and Zeng's (2001) oversampling technique including bias correction but also the logit model using the SMOTE training set as well as extreme gradient boosting are correcting for the rare-event nature of the problem at hand. The SMOTE creates “synthetic” examples in the training set, and extreme gradient boosting directly weighs for class imbalance.
These rare-event models rely on social capital measures in only 20% of cases, perhaps because at the buying time of t = 6 months a creator has not acquired enough social capital for it to serve as a signal of whether the creator ultimately becomes an influencer or stays unknown. The outgoing and incoming activities, however, do serve as a signal, which could mean that the creator has to put in the work and interact with others, a finding in line with work on freelancers who try to acquire business on work-related user-generated content platforms (Weiler et al. 2022). More specifically, the creator has to actively reach out to other users by following them, sending them private messages, and so forth. At the same time, with this outgoing activity, the creator must be able to trigger reciprocal activities of the same form. Hence, there is already at that early stage some sort of success, because outgoing activities trigger incoming activities, but not yet meaningful social capital. As a result, interactivity is the main predictor of prospective influencers.
Step 3 (Informed Manager): Find the One Dominant Triplet Choice (Based on Profit Maximization)
While uncovering the set of dominant triplets is independent of ROIS knowledge (as well as the cost), for finding the one dominant triplet choice to be made in the implementation phase, the order of magnitude of the ROIS as well as the cost c of a single future endorsement must be known. Only then can the optimization problem in Equation 8 be solved and the profit-maximizing triplet (S*, m*, t*) be determined (where, apparently, t* = 6 months). Note that we consider profits in cost units, that is, the cost of a single future endorsement is c = 1.
To determine the ROIS level below which no selection should be made, we consider the selection size S* as a function of the ROIS and find that this threshold is 70%. Below that threshold, no selection should be made, because the eventual revenues stemming from an endorsement may not compensate for the cost of it. This threshold should be considered in light of the model specification m* making false discoveries, because, after all, rarely do new creators ultimately become influencers (i.e., reach the top 1.5%). If the ROIS is greater than 70%, then the revenues from a selection are large enough to cover the costs involved when making false discoveries in this selection.
For testing sensitivity, we investigate the effect of the discount factor (i.e., δ < 1) on the selection size S* and find similar patterns (see Figure W.3 in the Web Appendix). As expected, the less the discounting of the future, the lower the value of the ROIS-threshold below which no selection should be made, that is, 94% (monthly
Step 3 (Uninformed Manager): Prepare the Suggested Cumulative Voting Procedure
An uninformed manager (without ROIS knowledge), however, prepares as a last step in the learning phase the suggested cumulative voting procedure. Concerning the buying time, the manager calculates the median buying time in the set of dominant triplets, that is, t* = med(t) = 6 months. Concerning the selection size, the manager calculates the prevalence of future success, namely the number of prospective influencers in the historical network data at buying time t* = 6 months, that is, S* = n(t* = 6) = 14. Hence, there is a concrete buying time and a concrete selection size. Concerning the model specification, to prepare the cumulative voting procedure, the manager must take each and every one of the 40 model specifications in the set of dominant triplets (including duplicate model specifications).
Implementation Phase (Using Current Network Data)
Step 4 (Informed Manager): Realize the One Dominant Triplet Choice
In the implementation phase, an informed manager collects current network data on a wave of newly registered creators, namely until buying time t* = 6 months. Therefore, we take the one-third of the random sample split that is treated as current network data, namely with a length of t* = 6 months, for which we also have (while the manager does not have) the information about who ultimately becomes an influencer at endorsement time T = 31 months.
Following the data-based simulations over 1,000 iterations, we can next analyze profit realizations. Every wave of newly registered creators is associated with a profit potential stemming from future endorsements by prospective influencers, where the profit realization is the fraction of profits made when realizing the one dominant triplet choice (S*, m*, t* = 6) and buying future endorsements accordingly. Every detected prospective influencer is associated with revenue gains at endorsement time T = 31 months and thus profits of fi(t) ≈ ROIS as δ = 1 and c = 1 (where for everyone who ultimately stays unknown, losses amount to fi(t) ≈ −1). As the number of prospective influencers associated with realizing the one dominant triplet choice (S*, m*, t* = 6) is nps(S, m, t), it follows that profit realization is given by
Panel A in Figure 3 exhibits the median profit realization (green dots)—as a function of the ROIS—including the boundaries given by 50% confidence intervals (thick green lines) as well as 90% confidence intervals (thin green lines), with the minimum and maximum marking the extremes (thin gray lines).

Median Profit Realization for Informed Managers (Panel A) and Uninformed Managers (Panel B) as a Function of the ROIS.
We find that almost always the median profit realization is positive. Considering the distribution around it, an important barrier point, where the top 75% of the distribution becomes positive (i.e., the 25th percentile crosses the zero line; see thick green line), is around 280% in terms of ROIS, rather than 70% as recommended by the framework. We attribute this gap to the fact that although the recommendation is based on out-of-sample predictions in the learning phase (Steps 1 to 3), the data are effectively not completely unseen in such out-of-sample predictions using historical network data on an aggregate level, because there are many out-of-sample predictions. Therefore, a margin of safety, which is a factor of around
With a safety factor of around eight—that is, for ROIS levels above approximately 8 × 70% = 560%—not only has the 25th percentile crossed the zero line but also the 5th percentile (thin green line) crosses it, meaning that the top 95% of the distribution becomes positive. This means that only in 5% of the cases losses may occur.
To investigate the misdetections, namely the prospective influencers that were not detected (thereby resulting in losses, or at least making the profit realization drop), we analyze the distribution of predictor measure differences between them and the ones that were detected. For ROIS levels above the first barrier point of 280%, we find that these differences are positive for the aggregated measures of outgoing activities, incoming activities, and social capital in 30%, 18%, and 31% of the instances, implying that they feature a weaker signal, and hence they are less likely to be detected. On a granular level, we find an even more pronounced effect for podcast/song reposts and podcast/song likes, where less than .1% of the instances are positive, implying that the misdetected prospective influencers are creators who are much less liked and reposted at an early stage. These findings qualitatively hold for ROIS levels above the second barrier point of 560%.
It is important to note that these two ROIS barrier points of 280% and 560% must be interpreted in cost units, that is, the cost of a single future endorsement being c = 1. If this cost is effectively around $100—which is reasonable according to industry reports (Hopper HQ 2023)—then the first barrier point of 280% requires revenues of $380, and the second barrier point of 560% requires revenues of $660. This means that if revenues from a prospective influencer’s endorsement in the future are below $380 and $660, respectively, no selection should be made, because the eventual revenues stemming from the endorsement may not compensate for the cost of it.
In general, we find that applying the framework—while relying on rare-event models and interactivity as the main predictor—results in substantial profits. For ROIS levels above the first barrier point of 280% (with a safety factor of four), the median profit realization is around 20%, climbing from 10% to 33%. For a ROIS of 280%, when relying instead on a naive model at buying time t* = 6 months, where the random selection size is given by the prevalence of future success, that is, S* = n(t* = 6) = 14, the median profit realization drops to (a negative value of) −31%. 9 In fact, such a naive model always results in losses, which is a direct result of not being able to compensate for the costs, as the probability of detection is almost always zero. In contrast, when applying the framework, the maximum profit realization may go as high as 60% for ROIS levels above 560% (second barrier point with a safety factor of eight)—meaning that 60% of all profits to be made with prospective influencers can be extracted with the framework—compared with the maximum of 6% for the same ROIS with the naive model.
If costs are recovered by one order of magnitude in terms of profits, namely ROIS = 1,000%, and the cost c of a single future endorsement is again effectively $100, it follows that the maximum profit potential is F0 = n(0) × c{−1 + ROIS + 1} = 22 × 100{−1 + 10 + 1} = 22,000, that is, $22,000. In that case, the median profit realization of 33% corresponds to more than $7,000 in profits for each and every wave of newly registered creators from which selections are made. If profit realization is at its peak, that is, 60%, then profits exceed $13,000. This makes the framework highly relevant for small and medium-sized businesses, which face a cost explosion in influencer marketing, posing a high barrier to engage in effective influencer seeding.
For testing sensitivity, we investigate the effect of the discount factor (i.e., δ < 1) on the profit realization and find similar patterns (see Figures W.4 to W.6 in the Web Appendix). The same applies when testing sensitivity/robustness related to the influencer definition (we replicate all analyses with other success measures, i.e., top 1% and 2% in addition to top 1.5%, and also with network status, i.e., number of followers; see Figures W.7 and W.8 in the Web Appendix).
Step 4 (Uninformed Manager): Employ the Suggested Cumulative Voting Procedure
An uninformed manager also collects current network data on a wave of newly registered creators until buying time t* = med(t) = 6 months. Considering ranks 1 to S* = n(t* = 6) = 14 of the (calibrated and applied) 40 model specifications in the set of dominant triplets (including duplicate model specifications), for every first rank a given user receives S* = 14 votes, for every second rank S* − 1 = 13 votes, and so forth, where for every S* = 14th rank a given user receives one vote (see Web Appendix B for an example).
Panel B in Figure 3 (in line with Panel A) exhibits the median profit realization (green dots)—as a function of the ROIS—including the boundaries given by 50% confidence intervals (thick green lines) as well as 90% confidence intervals (thin green lines), with the minimum and maximum marking the extremes (thin gray lines). Compared with a manager with ROIS knowledge, the manager without this knowledge has lower median profit realization, that is, around 15%. In fact, it is aligned with the 25th percentile of the profit realization of a manager with ROIS knowledge. This means that an informed manager who has a general idea about the bang for the buck is able to extract a higher fraction of all profits to be made with prospective influencers in a wave of newly registered users.
Discussion
In this article, we propose a forward-looking approach of signing prospective influencers to endorse the firm in the future, before they become influencers, which is analogous to futures in finance. This approach offers two benefits over the conventional approach: (1) higher receptiveness (e.g., Lanz et al. 2019) and (2) much lower prices (Hopper HQ 2023).
In the first part of the article, we outline a framework that offers a step-by-step procedure to cope with this rare-event problem, solving the inherent timing as well as selection trade-offs, where the former concerns when to buy future endorsements and the latter concerns from which new users. In the second part of the article, we empirically demonstrate and apply the framework using a data set from a worldwide leading audio platform and find that the proposed framework results in substantial profits, which are higher with ROIS knowledge.
With respect to the main predictor of prospective influencers on the platform, namely the outgoing and incoming activities (i.e., the interactivity), record labels as well as brands should focus on unknown users who not only actively reach out to other users but also experience reciprocity of the same form, that is, receiving messages, podcast/song reposts, podcast/song comments, and podcast/song likes. Among such users who feature strong interactivity are the ones who eventually build meaningful social capital—because interactivity helps in creating a community—and therefore ultimately become influencers. This is directly related to the fundamental premise of the platform being an incubator, but it is in the users’ hands to capitalize on it; they need to put in the work to create a community around them. For record labels and brands, the platform offers the unique opportunity to uncover the determination of users by monitoring their interactivity on the platform, which typically in an offline setting would be very costly to assess.
For the platform itself, such users who feature high interactivity at an early stage should be in the focus as well, because they are potentially the ones who will be responsible for significant traffic in the future (e.g., in terms of plays). At the present time, they are still unknown, highly active, and looking for ways to make the next big jump, namely from a nobody to someone, before becoming an influencer. Platforms could, for example, put in place a recommender system (besides the one for content discovery) to point out which other users to connect with in order to increase and bolster the high interactivity, which helps in building a community and increasing the follower base. Naturally, such a recommender system of user discovery would result in higher density in the user network and thereby stronger positive network externalities and lower churn. Platforms could even consider directly implementing the framework as a third type of recommender system—besides content and user discovery—and orchestrate the market for future influencer endorsements by prospective influencers.
Note that the generalizability of the proposed framework may be affected by several limitations. First, it depends on historical network data on users who ultimately either become influencers or stay unknown, while requiring a long time frame, at least equaling the time horizon of the future endorsement.
Second, this network data should cover interactions and capture the emerging egocentric networks of users. Absence of this kind of data can limit the effectiveness of the framework. But not only do platforms nowadays provide public application programming interfaces; there are also firms that offer crawling services, which may alleviate this data-collection challenge. If, however, this challenge remains (e.g., due to high data-acquisition costs), the framework could potentially account for a two-stage model that incorporates data collected at a later stage only on users who rank high in the implementation phase. Future research should investigate the impact of such data challenges on the effectiveness of the framework, also with varying time horizons of the future endorsements.
Third, since the framework assumes a risk-neutral manager, and we thus consider an expected profit maximizer, future research should extend the framework and account for uncertainty and rely on general expected utility theory. This will allow for the inclusion of managers who are risk-averse, above and beyond risk-neutral ones. In this context, future research should also explore objectives other than financial success, such as philanthropy.
Fourth, given rich data on the interrelation between users—above and beyond data on the individual level (i.e., predictors such as activities and social capital)—future research should find and investigate variables of dependency between users, and thus of overall portfolio performance. Moreover, the investigation of overall portfolio performance could also involve buying future endorsements at different times, with the idea being to spread and diversify the budget. In this context, another avenue is to investigate the continuous influx of new platform registrations. Such an influx could be viewed as an aggregation of multiple waves of platform registrations that can be analyzed either separately or together.
Fifth, once an increasing number of firms (e.g., record labels) apply the framework, then the future influencer endorsements could be traded between firms, where prices would be, among other factors, a function of the expectations of influencers’ “trajectories.” This is also left for future research.
Supplemental Material
sj-pdf-1-mrj-10.1177_00222437231207323 - Supplemental material for Buying Future Endorsements from Prospective Influencers on User-Generated Content Platforms
Supplemental material, sj-pdf-1-mrj-10.1177_00222437231207323 for Buying Future Endorsements from Prospective Influencers on User-Generated Content Platforms by Andreas Lanz, Jacob Goldenberg, Daniel Shapira and Florian Stahl in Journal of Marketing Research
Footnotes
Acknowledgments
The authors thank Barak Libai, Oded Netzer, and the faculty and deans of HEC Paris as well as the seminar participants at Ben-Gurion University, University of St.Gallen, HEC Lausanne, University of Hamburg, the Marketing Science Conference, the EMAC Conference, the SAMS Conference, ai-zurich, HEC Data Day, Rorschacher Kreis, the YES | MARKETING Meeting, and the Marketing Dynamics Conference for valuable comments on previous versions of this article. The article greatly benefited from the comments of the entire review team.
Coeditor
Peter Danaher
Associate Editor
Eric Bradlow
Declaration of Conflicting Interests
The authors declared no potential conflicts of interest with respect to the research, authorship, and/or publication of this article.
Funding
The author(s) disclosed receipt of the following financial support for the research, authorship, and/or publication of this article: This work was supported by the Israel Science Foundation (grant number 1459/18), the Julius Paul Stiegler Memorial Foundation, the DAAD, and the IPID4all program.
Notes
References
Supplementary Material
Please find the following supplemental material available below.
For Open Access articles published under a Creative Commons License, all supplemental material carries the same license as the article it is associated with.
For non-Open Access articles published, all supplemental material carries a non-exclusive license, and permission requests for re-use of supplemental material or any part of supplemental material shall be sent directly to the copyright owner as specified in the copyright notice associated with the article.