
Abstract
Direct-to-consumer firms increasingly believe that influencer marketing is an effective option for seeding. However, the current managerially relevant question for direct-to-consumer firms of whether to target low- or high-followership influencers to generate immediate revenue is still unresolved. In this article, the authors’ goal is to answer this question by considering for the first time the whole influencer-marketing funnel, that is, from followers on user-generated content networks (e.g., on Instagram), to reached followers, to engagement, to actual revenue, while accounting for the cost of paid endorsements. The authors find that low-followership targeting outperforms high-followership targeting by order of magnitude across three performance (return on investment) metrics. A mediation analysis reveals that engagement can explain the negative relationship between the influencer followership levels and return on investment. This is in line with the rationale based on social capital theory that with higher followership levels of an influencer, the engagement between an influencer and their followers decreases. These two findings are derived from secondary sales data of 1,881,533 purchases and results of three full-fledged field studies with hundreds of paid influencer endorsements, establishing the robustness of the findings.
Keywords
Influencer marketing garners significant attention: it quickly grew into a $17.4 billion industry by 2023 (Collabstr 2023), with more than 80% of companies in the U.S. using influencers for marketing purposes (Influencer Marketing Hub 2023). The most prominent user-generated content network for both brands and influencers is Instagram, counting 3.8 billion annual sponsored postings (Klear 2022). According to marketers, sales is the leading goal of influencer marketing (Statista 2023). Particularly for direct-to-consumer (DTC) firms, identifying influencers who drive positive return on investment (ROI) remains the biggest challenge when considering influencer marketing as a revenue channel (Influencer Marketing Hub 2023).
Despite the fact that revenue generation is the most important goal of budget allocation in influencer marketing (Brown 2023), research has focused on other outcome variables such as content consumption (e.g., Yoganarasimhan 2012), content interaction (e.g., Hughes, Swaminathan, and Brooks 2019; Leung et al. 2022; Wies, Bleier, and Edeling 2023), content reposting (e.g., Peng et al. 2018), and follow-backs (Lanz et al. 2019). These outcome variables, while important and worthy of consideration, are not the main focus of practitioners (Statista 2023), especially DTC firms. We may assume that revenue has not been examined as an outcome variable despite its primacy due to the significant challenge of obtaining data about how much was sold through influencer campaigns on a granular level.
Another crucial yet missing variable in the equation is the cost: the existing literature has predominantly overlooked the cost aspect, and there is a noticeable dearth of published research on the effect of paid endorsements. Neglecting the incorporation of costs cannot result in an effective evaluation of the influencer endorsement (Batra and Keller 2016).
Although some notable contributions have emerged, including Hughes, Swaminathan, and Brooks (2019), Leung et al. (2022), and Wies, Bleier, and Edeling (2023), shedding light on the cost aspect, they do not examine the influencers’ impact on revenue generation. Calls for studying influencers using more relevant outcome variables—such as revenue—have repeatedly been made (e.g., Hughes, Swaminathan, and Brooks 2019).
The current article attempts to fill this gap and explore revenue as a key outcome variable in influencer marketing research, addressing the effectiveness of influencer endorsements in driving financial returns for DTC firms. We are not aware of prior work that jointly considers the cost and revenue aspects empirically.
A widely acknowledged debate is ongoing in the literature regarding the effectiveness of high-followership versus low-followership influencers in user-generated content networks. Yet few articles point out the value of low-followership influencers (e.g., Galeotti and Goyal 2009; Lanz et al. 2019; Watts and Dodds 2007). At this stage, most of the seeding literature in marketing recommends targeting high-followership influencers, that is, hubs (e.g., Goldenberg et al. 2009; Hinz et al. 2011; Leung et al. 2022).
A crucial observation for understanding this debate is that the findings supporting the effectiveness of low-followership influencers are based only on unpaid endorsements (i.e., the influencers do not receive any monetary compensation for their actions), leaving the question open as to whether the same holds true for paid endorsements. In paid endorsement situations, influencers work for brands to promote products or services, and influencers with higher followership have the ability to drive more significant brand exposure and consumer engagement due to their larger audience reach. There is more and more evidence for the advantage of high followership influencers in such paid endorsements (e.g., Hughes, Swaminathan, and Brooks 2019; Leung et al. 2022). However, there is no evidence in the literature that low-followership influencers offer the same advantage in paid endorsements as high-followership influencers. Low-followership influencers might be perceived as less popular (e.g., De Veirman, Cauberghe, and Hudders 2017), less credible (e.g., Goldenberg et al. 2009), and having lower status (e.g., Labrecque et al. 2013).
In contrast, based on social capital theory (Van den Bulte and Wuyts 2007; Wasko and Faraj 2005), we posit that the higher the influencer followership level, the lower the engagement between the influencer and their followers; hence the influencer's performance is expected to be less effective. In analyzing the engagement before the sponsored posting, we closely follow social capital theory, which for engagement formulates concepts of commitment and reciprocity in social networks. We separate this engagement between the influencer and their followers with (1) follower engagement and (2) influencer engagement, both of which are expected to be negatively associated with influencer followership levels.
In this work we engage the debate by testing the two possible strategies (focus on low- vs. high-followership influencers) in the context of paid endorsements to fully understand the potential value in user-generated content networks. In contrast to previous work, we consider the entire influencer-marketing funnel for paid endorsements in the context of DTC firms—from followers on user-generated content networks (e.g., on Instagram), to reached followers, to engagement, all the way to actual revenue, while accounting for the cost of paid endorsements—using a combination of secondary revenue data and three full-fledged field studies.
To align with common business practice at DTC firms, we conducted a survey among senior influencer-marketing managers in such firms to uncover the most important performance (ROI) metrics (see Web Appendix A), which we find to be (1) revenue per follower, (2) revenue per reach, and (3) return on influencer spend (ROIS). We test the effect on these three measures.
We combine both empirical and field studies. On the one hand, we use a data set from one of Europe's leading DTC firms that includes 2,808 influencer-specific discount codes, allowing us to attribute 1,881,533 sold products (with total value over €17 million in revenue) to 2,808 unique sponsored postings on Instagram by 1,698 nano-, micro-, and macro-influencers (three influencer followership levels, where “nano-influencers” refers to low-followership influencers and “macro-influencers” refers to high-followership influencers; e.g., Van den Bulte and Wuyts 2007). On the other hand, collaborating with two DTC firms, we run three distinct field studies with a total of 319 paid nano- and macro-influencers (also on Instagram).
Our consistent result is that nano-influencers provide a significantly higher ROI than macro-influencers, namely by order of magnitude across empirical and field evidence. Note that we can rule out the impact of Instagram's algorithm by also accounting for actually reached followers, resulting in the same findings. Additionally, we use propensity score matching to make nano- and macro-influencers comparable, particularly in terms of their followers’ characteristics. Furthermore, in a parallel mediation analysis (e.g., Xu, Mehta, and Dahl 2022), we find that the negative effect of the number of followers on all three ROI metrics is partially mediated by the (follower and influencer) engagement before the sponsored posting, and this can explain up to 51% of the direct effect.
We delve into the two mediators by investigating the interaction between the influencer and their followers in the five postings before the sponsored posting and observe higher engagement for nano-influencers. We use language style matching (LSM) to further analyze an influencer's relationship with their followership and find that nano-influencers match the communication style of their followers far better than macro-influencers do.
Interestingly, our results do not mean that past articles reporting the advantage of high-followership influencers are necessarily wrong. A likely explanation of the emerging shift is the mere dramatic growth of user-generated content networks (Facebook, for example, grew from 900 million users in Q1 2012 to almost 3 billion users in Q1 2022; Meta 2022). This leads to a situation in which high-followership influencers today have many more followers (by three orders of magnitude) than in the past (i.e., millions instead of thousands). From this we conclude that high-followership influencers from the past now fall into the low-followership category. Another reason for a potential shift is that past literature has not examined more relevant (and complex) measures like ROI, mainly because revenue and associated costs were not readily available to researchers.
The rest of this work is organized as follows: In the next section we examine the related literature before empirically investigating low- versus high-followership targeting based on secondary revenue data. This also includes assessing the relationship between influencers and their followers using textual analysis and LSM on followers’ comments and influencers’ replies. Then we replicate the main empirical investigation via three field studies. We conclude with a discussion of our findings and offer directions for future research.
Background
This work is related to three aspects of influencer marketing. The first focuses on the various existing seeding policies. The second facet involves the different returns on seeding, which we evaluate with a focus on user-generated content networks. Finally, the third facet covers the role of the engagement of both the influencer and the followers in seeding processes.
Seeding Policies
Typically, for seeding campaigns the targets are classified according to the (in)degree, or number of followers, since this metric is always readily available (Shriver, Nair, and Hofstetter 2013). In business practice, influencer followership levels are commonly defined as nano-, micro-, and macro-influencers (see Web Appendix B). Following this rationale, high-followership influencers (macro-influencers) are simply the most connected users of a network, whereas low-followership influencers (years later defined as nano-influencers) are the least connected ones (Van den Bulte and Wuyts 2007).
Although prior research in the seeding literature in marketing is not fully aligned in its policy recommendation, while typically focusing on unpaid endorsements, the vast majority suggests targeting high-followership influencers. For instance, Hinz et al. (2011) find it to be more effective than targeting fringes or individuals with high betweenness, a result that is in line with many other publications (e.g., Chen, Van der Lans, and Phan 2017; Goldenberg et al. 2009; Hinz et al. 2011; Leung et al. 2022; Libai, Muller, and Peres 2013; Yoganarasimhan 2012).
In contrast, only a few works suggest targeting low-followership influencers. For example, when benchmarked in an analytical model and a computer simulation, low-followership influencers outperform high-followership influencers when the dissemination process is about information sharing (e.g., Galeotti and Goyal 2009; Watts and Dodds 2007). This is possibly due to the average influential power of influencers decreasing with an increase in their number of friends (Katona, Zubcsek, and Sarvary 2011). Similarly, Moldovan et al. (2017) derive stronger opinion leadership among leaders in small, strong-tie groups, whereas leaders become less effective the larger the group and the weaker the ties. Lanz et al. (2019) provide further empirical evidence, demonstrating that the return in terms of follow-backs is higher on low-followership influencers. It is crucial to recognize that the conclusions drawn from Lanz et al. are limited to (1) self-promotion, (2) unpaid endorsements, (3) a one-to-one outreach, and (4) follow-backs as dependent variable, and this may not capture the profitability across influencers with different followership levels for DTC firms.
Hence, the matter arises as to whether in business practice—which relies predominantly on paid endorsements—the recent shift toward low(er)-followership influencers (Haenlein et al. 2020), which goes against the bulk of the seeding literature in marketing, is worthwhile. In this work, we investigate this business practice by comparing low- versus high-followership targeting, namely in the context of paid endorsements.
Return on Seeding
Prior research on seeding has mainly focused on building awareness, and rarely on adoption, let alone generating sales or considering costs (as can be seen in the “Costs” and “Revenue” columns of Table 1). Awareness, as a first step in the customer journey, can stimulate consumers in the preference-formation stage (Hamilton et al. 2021), and it has been operationalized—in the context of user-generated content networks—with content consumption (e.g., Yoganarasimhan 2012), content interaction (e.g., Hughes, Swaminathan, and Brooks 2019; Leung et al. 2022; Wies, Bleier, and Edeling 2023), content reposting (e.g., Peng et al. 2018), and follow-backs (Lanz et al. 2019). Although some research has covered later stages of the customer journey, such as adoptions (e.g., Goldenberg et al. 2009) or registrations (e.g., Katona, Zubcsek, and Sarvary 2011), the clean attribution to sales on an influencer level has not been considered (as can be seen in the “Key Dependent Variable” column of Table 1).
Empirical Studies Investigating the Impact of Followership Levels on Outcomes.

Notes: N.A. = not available. Projects with “(Yes)” use the number of items sold, not the actual revenue in monetary terms.
In our literature review, we identified several working papers on influencer marketing, including Bairathi and Lambrecht (2023), Gu, Zhang, and Kannan (2023), Hughes, Soni, and Swaminathan (2023), Huh, Zhang, and Kannan (2023), Tian, Dew, and Iyengar (2023), and Yang, Zhang, and Zhang (2023). However, none of these papers specifically focus on DTC firms, and their dependent variable does not include revenues. Hughes, Soni, and Swaminathan; Bairathi and Lambrecht; and Tian, Dew, and Iyengar primarily focus on engagement as their main dependent variable. Yang, Zhang, and Zhang mainly focus on video content, movement, and timing of product placement of mature macro-influencers. Huh, Zhang, and Kannan focus on video content in a gaming context with a focus on offline sales, while Gu, Zhang, and Kannan do not incorporate incurred costs and instead focus on the dynamics of livestreaming.
Our research emphasizes the importance of considering both generated revenues and incurred costs, particularly using revenue per follower, revenue per reach, and ROIS as dependent variables. This approach goes beyond existing literature that primarily uses engagement as the main dependent variable. This is noteworthy, as engagement has been criticized as an inadequate predictor of sales conversion, echoing common industry concerns about engagement metrics (Yang, Zhang, and Zhang 2023).
Since the consideration of costs of paid endorsements is typically outside the scope of prior research (as can be seen in the “Paid Endorsements” column of Table 1), Hughes, Swaminathan, and Brooks (2019) call for further research to investigate “the direct impact of a blog post on consequential outcomes, such as sales and ROI” (p. 93), where ROI requires the consideration of not only revenue but also the associated costs of paid endorsements.
In summary, as can be inferred from Table 1, by considering sales (i.e., revenue), costs, and performance (ROI) metrics in paid endorsements (that were not examined before), we respond to this call in the context of DTC firms for which influencer marketing is a direct revenue channel, typically on Instagram, which is also our focus here (no other user-generated network is as popular among marketers for these purposes; Statista 2023).
Engagement of the Influencer and Followers
The literature shows that despite the importance of weak ties in building a large following—one can maintain only 150 friendships in an offline setting (Dunbar 1998)—it is the strong ties between influencer and followers that facilitate purchase intention (e.g., Aral and Walker 2014; Katona, Zubcsek, and Sarvary 2011).
Granovetter (1973) portrays tie strength in the context of mere information dissemination as a combination of time spent (the commitment) and the intensity of emotions involved in the reciprocal relationship. Hence, maintaining strong relationships, or ties, is “costly” (Hill and Dunbar 2003). Although prior research has revealed that in an online setting the number of connections can easily exceed 150, the same interaction frequencies are valid for both online and offline settings (Dunbar et al. 2015).
Concerning degrees of friendship, Dunbar (2018) differentiates among various definitions of what a “friend” is (ranging from very close friends to just acquaintances). By design there is no differentiation among connections in user-generated content networks. Therefore, users are able to connect to multiple “friends” at all levels. This means that there are different degrees of friendship among connections; namely, between “friends” in an online setting there is heterogeneity in terms of engagement. Based on social capital theory (Van den Bulte and Wuyts 2007), commitment and reciprocity are concepts of engagement in social interactions, constituting the two pillars of relational capital according to the integrative framework for understanding online information-sharing behavior (e.g., Wasko and Faraj 2005).
Commitment is closely linked to the engagement of future interactions and originates from frequent exchange; it refers to a person's psychological attachment and loyalty to a specific individual (Coleman 1988). Interactions are motivated by a sense of obligation within personal relationships (Constant, Kiesler, and Sproull 1994). It involves a willingness to devote time, effort, and resources to maintain and strengthen the relationship. In the presence of strong ties and more personal relationships, users are less reluctant to engage with postings (Levin and Cross 2004). High level of commitment to an influencer would mean that a follower is actively engaging with the influencer's postings, sharing them, and providing feedback in the form of comments. Just the act of writing a comment by a follower is a somewhat strong form of commitment, let alone sharing a posting with one's own followers, or friends. In contrast, a low level of commitment would imply that the follower is less engaged and may simply be passively following the influencer without any interaction.
Reciprocity is linked to the concept of tie strength (e.g., Aral and Walker 2014). At its core, reciprocity embodies a feeling of shared obligation, leading people to typically return the favors done for them, which in turn promotes continuous supportive interactions, as highlighted by Shumaker and Brownell (1984). This conceptualization of how two individuals interact has mainly been investigated and formulated with regard to frequency of engagement (Brown and Reingen 1987; Godes and Mayzlin 2004; Weimann 1983), where strong ties can result in more than double the volume of engagement than weak ties (e.g., Blight, Jagiello, and Ruppel 2015; Lee, Hosanagar, and Nair 2018). However, the volume of engagement is also dependent on the number of followers. With increasing followership levels, influencers accumulate—and need to maintain—new followers, thereby weakening overall tie strength (i.e., their existing degrees of friendship). More specifically, since maintaining these relationships is “costly” (Hill and Dunbar 2003), engagement frequency with each follower decreases (Sutcliffe, Binder, and Dunbar 2018).
Along these lines, to operationalize commitment and reciprocity—this concept of engagement through interactions—we use (1) follower engagement and (2) influencer engagement, both of which are expected to be negatively associated with influencer followership levels. We expect that low-followership influencers outperform high-followership influencers in terms of revenue per follower and ROI, because the higher the influencer's followership level, the lower the engagement between the influencer and followers.
We first test this expectation by looking at secondary data with a multitude of influencers across followership levels for our comparison of the two seeding policies. We employ a parallel mediation analysis to shed light on the mechanism underlying superior performance of either seeding policy across three different performance (ROI) metrics. Subsequently, to provide further robustness, we conduct three field studies across different settings to again compare the two seeding policies: In the first study, we keep the content of the sponsored posting as stylized as possible. In the second study, we allow for some freedom in content creation to make the sponsored posting more realistic. Finally, in the third study, we allow for full freedom in the creation of the sponsored posting.
Low- Versus High-Followership Targeting: Empirical Evidence
The purpose of this study is to empirically investigate the effectiveness of targeting low- versus high-followership levels. We start with model-free evidence on differences in ROI, and then we present a parallel mediation analysis to examine the underlying mechanism.
Data
One of Europe's leading DTC fashion firms provided us with a data set that includes 2,808 influencer-specific discount codes created between 2018 and 2021. These codes were distributed by 1,698 influencers via sponsored postings to their followers who, in turn, could use them to purchase products at a discount in the firm's e-commerce store, the typical setting for DTC firms to generate direct revenue through influencer marketing. The discount codes enable us to cleanly attribute 1,881,533 sold products (valued at over €17 million in total revenue) to 2,808 sponsored postings on Instagram by 1,698 influencers (each posting received an influencer-specific—i.e., unique—discount code; hence there are also 2,808 discount codes).
Initially, influencers are invited based on evaluations of the influencer–product fit on a rolling basis. Once influencers agree to participate in a campaign, they receive their designated discount code and payment. Receiving the discount code and the payment is highly automated for nano- and micro-influencers, whereas for macro-influencers a more personal and thus work-intense approach is common. Figure 1 shows an example from our data in which two influencers posted in their feed with such a discount code (see Web Appendix C for a more detailed outline of the comments). Given that influencer-marketing platforms and other specialized third-party service and data providers enable marketers to not only find but also work with hundreds of nano-influencers at the same time and efficiently leverage their potential at the labor cost of handling only one macro-influencer, we can make one-to-one comparisons of influencers, just as in Figure 1. This is also confirmed by a survey among senior influencer-marketing managers at DTC firms (see Web Appendix A for details; see also Web Appendix D demonstrating that, by definition, there is a corner solution, namely to select either nano- or macro-influencers).

Examples of Feed Posting with an Influencer-Specific Discount Code.
Instagram, one of the biggest user-generated content networks in the domain of visual content, has become much more than an application for the purpose of editing photos as well as videos and distributing them to friends. Today, Instagram users obtain relevant information about potential purchases through the content uploaded to the network, whether it stems from friends, influencers, or brands. This content comes in the form of feed postings (see Figure 1) or stories, with the latter only available for a short time. Typically, the feed postings and stories can be seen, liked, commented on, and shared by Instagram users as the messages find their way into their timelines.
In the case of influencers uploading the content, the sponsored feed postings and stories typically contain personalized UTM tracking URLs (i.e., influencer-specific links) that point to the firm's e-commerce store and/or influencer-specific discount codes that followers can use in that store (where the former reduces conversion friction). Hence, the funnel does not end with the followers’ engagement with the sponsored posting after having seen it; the funnel continues with the followers landing in the firm's e-commerce store and eventually purchasing products in it. For this reason, we consider the whole influencer-marketing funnel, that is, from followers on Instagram, to reached followers, to engagement with the sponsored posting, and to actual revenue.
Along these lines, our data set is quite rich, as it features 2,808 influencer-specific (and thus unique) discount codes through which 1,881,533 products have been purchased; hence it allows for the calculation of ROI metrics for each of the 1,698 influencers in the data set (who differ in their number of followers). To make sure we are aligned with common business practice among DTC firms and are examining the most relevant parameters, we conducted a survey among senior influencer-marketing managers in such firms to uncover the most important ROI metrics (see Web Appendix A), which we find to be (1) revenue per follower, (2) revenue per reach, and (3) ROIS (see Table 2 for further details). We use these metrics as our main dependent variables.
Variable Description and Descriptive Statistics.

Notes: We also control for the following four nonnumerical variables: campaign focus area (Benelux, DACH [Germany, Austria, Switzerland], Mediterranean, Nordic, other), whether the influencer posted during the weekend, the time of day that the influencer posted, and the period of year the influencer posted. Nano-influencers are the influencers from the lowest quartile w.r.t. to followers, macro-influencers are the ones from the highest quartile, and micro-influencers are the ones in between.
For example, the low-followership influencer (nano-influencer) of the sponsored posting from Figure 1, Panel A, on April 21, 2020, had 6,632 followers at this point. The influencer generated €2,456 in revenue. Thus, we calculate the revenue per follower as €.37. Then consider the high-followership influencer (macro-influencer) in Figure 1, Panel B, who posted on September 4, 2018, having 258,055 followers. Her sponsored posting generated €1,968 in revenue, and hence the revenue per follower is €.008. Concerning the other two performance (ROI) metrics for this nano-influencer and macro-influencer, the revenue per reach is €1.29 versus €.04, and the ROIS is 27.23 versus .01. Note that the influencers' number of followers reached and the payment are not directly observed in the secondary data but are inferred from industry sources (see Web Appendix E and Web Appendix F).
Table 2 provides descriptive statistics on all 1,698 influencers, as well as mean values for each influencer type, including nano-, micro-, and macro-influencers. Concerning the number of followers at the point in time of the actual sponsored posting, our data set covers a broad range, from influencers with 1,219 followers to those with 1.4 million followers (mean = 52,849; median = 19,004). We classify influencers according to the distribution of number of followers in the data set; hence nano-influencers are the bottom 25% (first quartile) and macro-influencers are the top 25% (4th quartile), with micro-influencers making up the middle 50% (2nd and 3rd quartiles). More specifically, nano-influencers have between 1,219 (minimum) and 8,496 (first quartile) followers, and macro-influencers have between 49,845 (third quartile) and 1.4 million (maximum) followers; their mean number of followers amounts to 5,034 and 160,740, respectively. Concerning revenue per follower in euros, the revenues lie between 0 and 23 (mean = .117; median = .030), and the mean revenue per follower for nano-influencers is higher by one order of magnitude than that of the macro-influencers, that is, .265 versus .049. In fact, when exploring the relationship between influencer followership levels and revenue per follower, we find a monotonically decreasing pattern across the three influencer types, that is, from .265 (nano-influencers) to .080 (micro-influencers) to .049 (macro-influencers). The same holds true for revenue per reach (.881 to .305 to .237) and ROIS (17.85 to 5.98 to 4.67). 1
We demonstrate model-free evidence of the superiority of nano-influencers with respect to revenue relative to cost in a funnel comparison (see Figure 2). We observe a monotonically decreasing pattern from nano- to macro-influencers.

Funnel Comparison of Nano-, Micro-, and Macro-Influencers.
We analyzed data in other contexts (entertainment and gaming) as well as on other user-generated content networks such as YouTube and TikTok (see Appendix A) and found the exact same pattern. This contradicts the common (mostly implicit) assumption in the seeding literature in marketing that this pattern is increasing instead of decreasing (e.g., Hinz et al. 2011).
The findings from Table 2 provide new supportive evidence that low-followership targeting outperforms high-followership targeting in terms of ROI. Above and beyond this finding, we expect that engagement—that is, follower and influencer engagement before the sponsored posting—must mediate this relationship between the number of followers and ROI. We focus on the five postings before the sponsored posting to capture a campaign-independent measure of engagement between the influencer and their followers.
For this engagement—that is, the engagement before the sponsored post—we divide, on the one hand, the total number of the followers’ comments and likes by the influencer's number of followers (“follower engagement”) and, on the other hand, the total number of the influencer's replies by the influencer's number of followers (“influencer engagement”). Note that influencer engagement does not include likes, as the influencer engages just through comments with the followers and is always simply replying to the follower's comments as well as to the comments on comments, and so forth; hence we use the term “replies” instead of “comments” for influencers. Also note that both engagement measures incorporate the mean engagement on these five postings—that is, the number of likes and comments (and replies in the case of “influencer engagement”)—divided by the mean number of followers; thus five (time-varying) values go into the numerator and denominator, namely from the respective five posting dates. Hence, we take a granular, dynamic approach when measuring the mediators.
Table 2 shows that the influencer engagement before the sponsored posting by the nano-influencers is on average higher by one order of magnitude than that of macro-influencers, that is, .003 versus .0001. Concerning the follower engagement, we find the same pattern: for nano-influencers it is one order of magnitude higher, that is, .147 versus .058. Consider the example influencers from Figure 1: For the nano-influencer (Panel A), influencer engagement is .0018 and follower engagement is .0019. The macro-influencer (Panel B) shows an influencer engagement of .00017 and a follower engagement of .00059; hence the qualitative conclusion holds in terms of the order-of-magnitude difference.
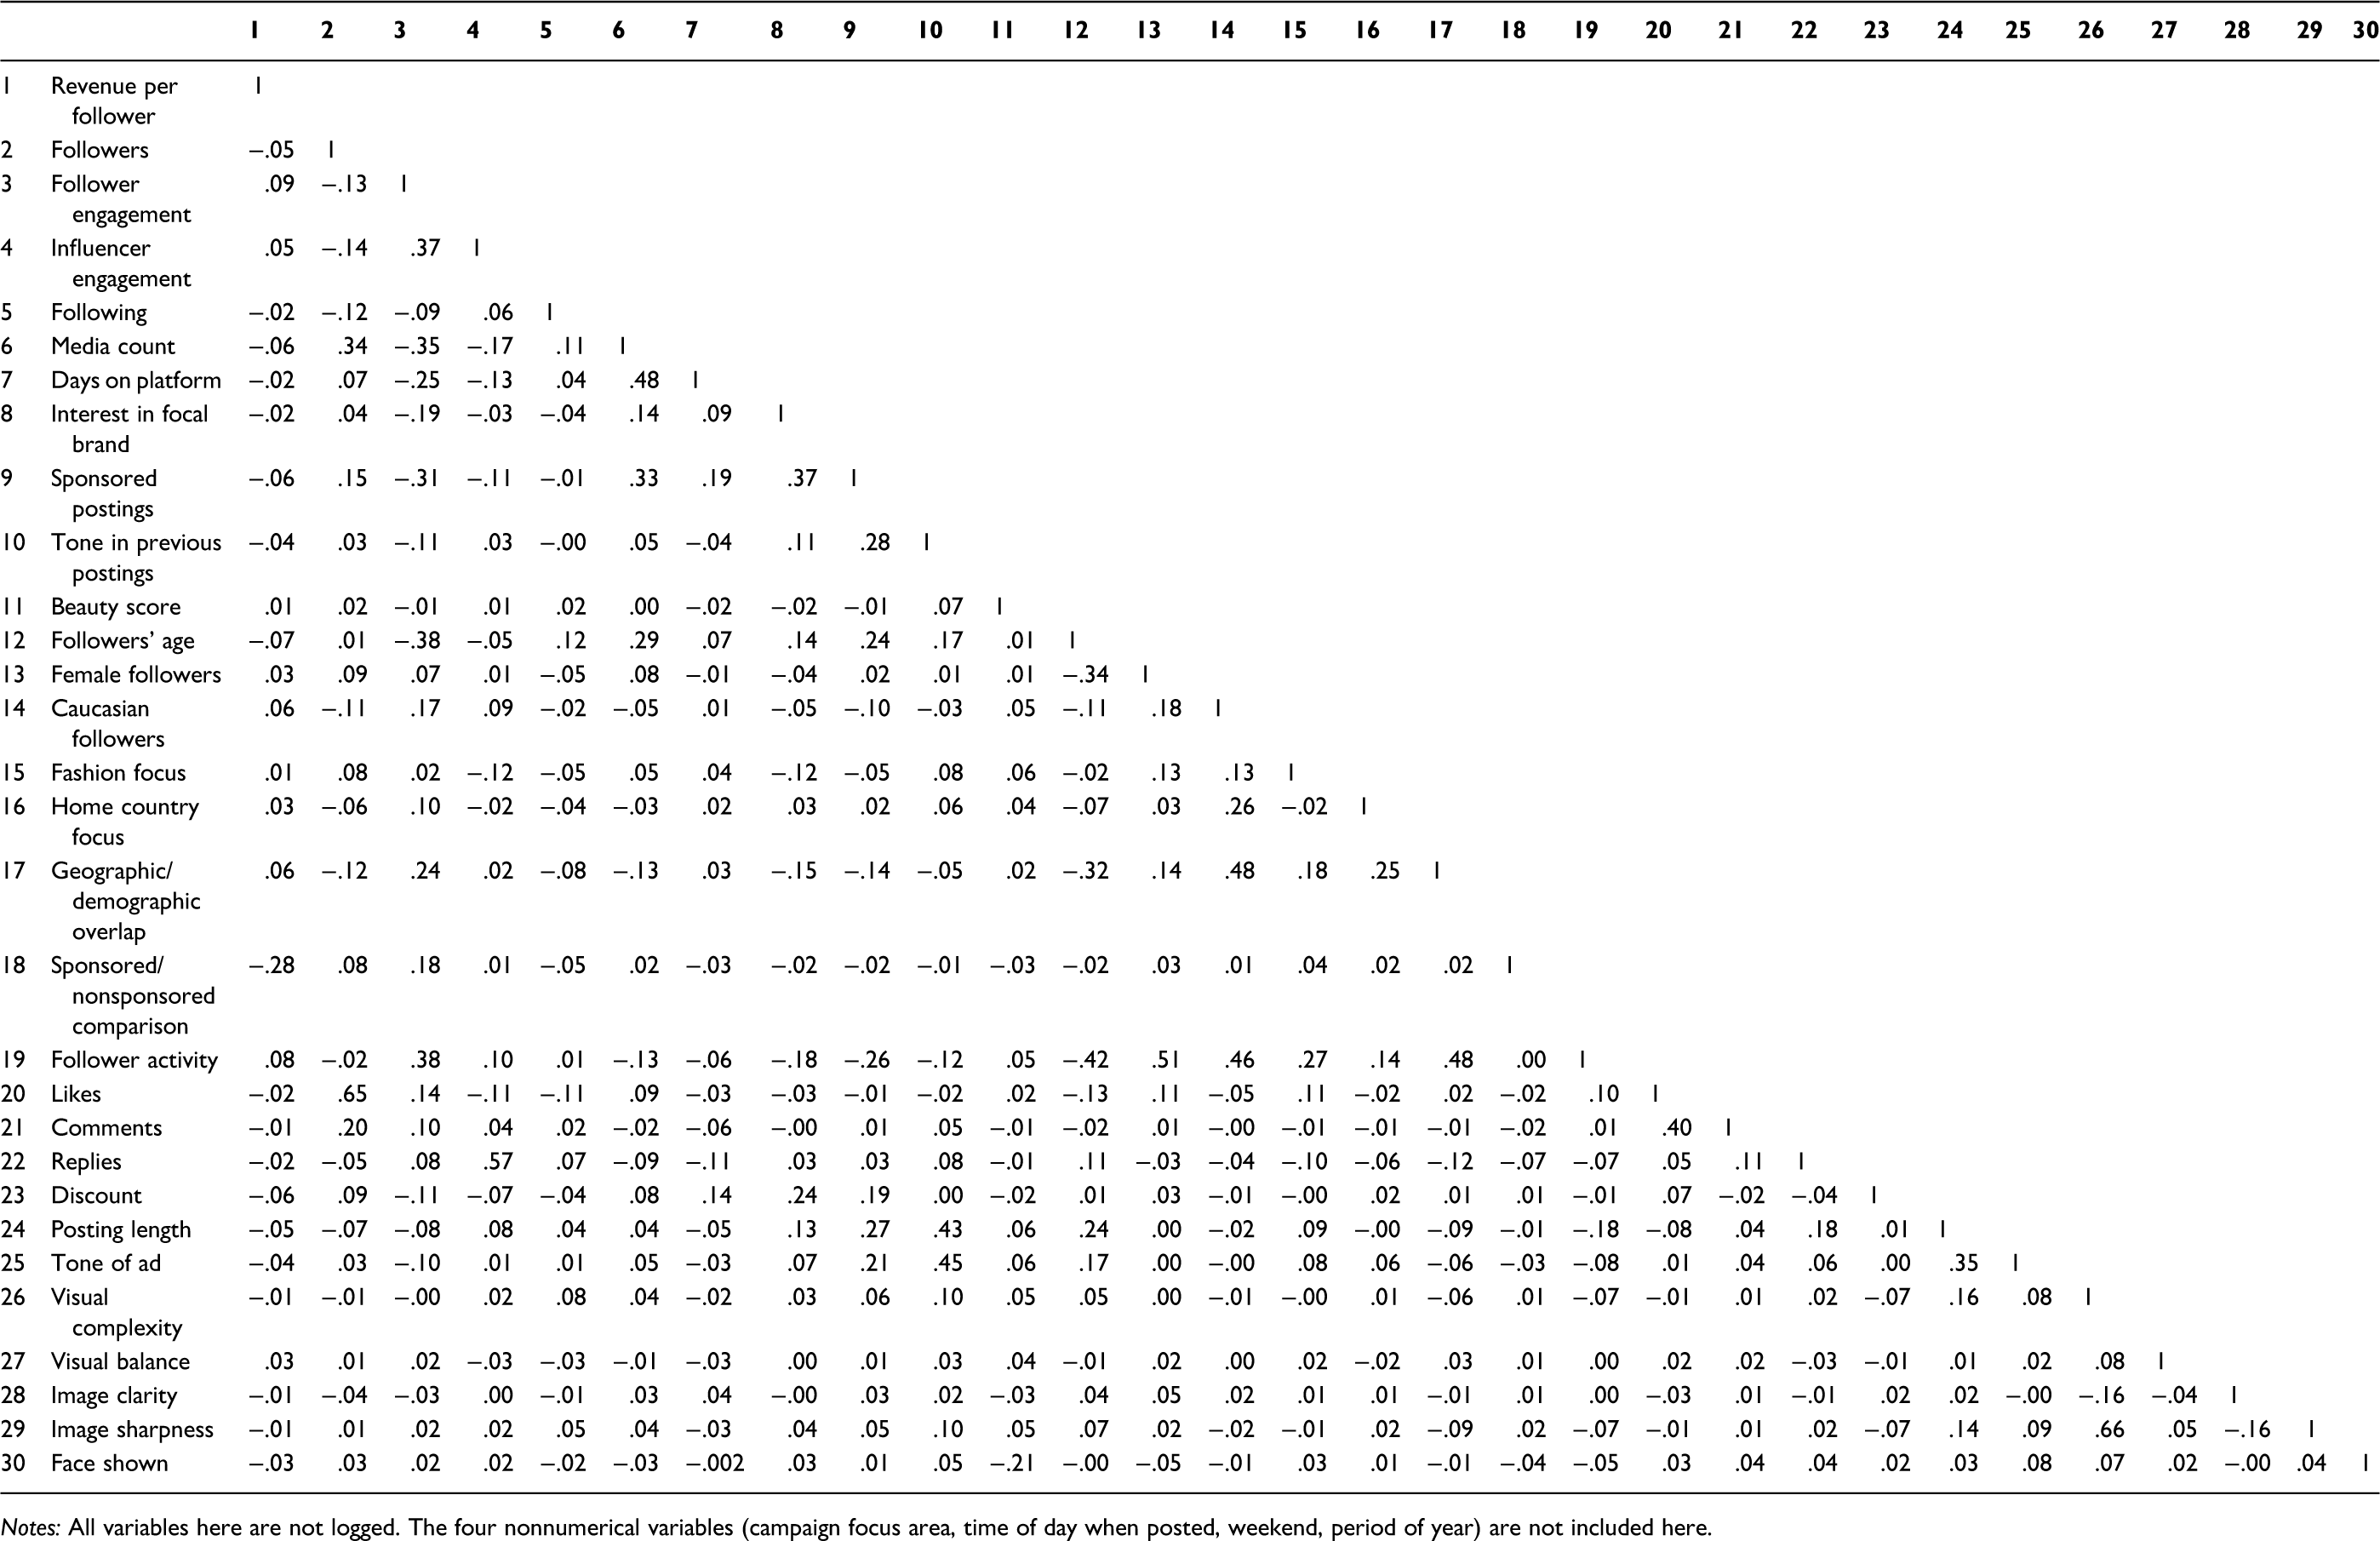
To limit the influence of confounding variables on ROI, we include a range of influencer characteristics, follower characteristics, and posting characteristics as control variables (see Table 2 for more details of the variables and how they were measured): (1) following, (2) media count, (3) days on platform, (4) interest in focal brand, (5) sponsored postings, (6) tone in previous postings, (7) beauty score, (8) followers’ age, (9) female followers, (10) Caucasian followers, (11) fashion focus, (12) home country focus, (13) geographic/demographic overlap, (14) sponsored/nonsponsored comparison, (15) follower activity, (16) likes, (17) comments, (18) replies, (19) discount, (20) posting length, (21) tone of ad, (22) visual complexity, (23) visual balance, (24) image clarity, (25) image sharpness, (26) face shown, (27) campaign focus area, (28) weekend, (29) time of day, and (30) time of year. For the correlation matrix of these variables, see Appendix B.
Analysis
To investigate the mechanism underlying the superior performance of low-followership targeting, we conduct a mediation analysis with two mediators in parallel 2 (e.g., Xu, Mehta, and Dahl 2022): the follower and influencer engagement. Note that we focus on revenue per follower, because the mechanism underlying the superiority is most likely independent of the costs for the paid endorsement. Nevertheless, for robustness, we run the models also with the two other ROI metrics, that is, with ROIS (which accounts for costs) as well as revenue per reach (which accounts for inactive followers and the impact of Instagram's algorithm, such that it only considers the followers who viewed the sponsored posting).
First, we run a total-effect model by including the (log-transformed) number of followers as the independent variable and the (log-transformed) revenue per follower as the dependent variable (see Figure 3). Note that we use the full data set with 2,808 influencer-specific discount codes attributing 1,881,533 sold products (totaling more than €17 million in revenue) to 2,808 sponsored postings on Instagram by 1,698 influencers. Also note that we include the full range of influencer-, follower-, and posting-related control variables (see Table 2).
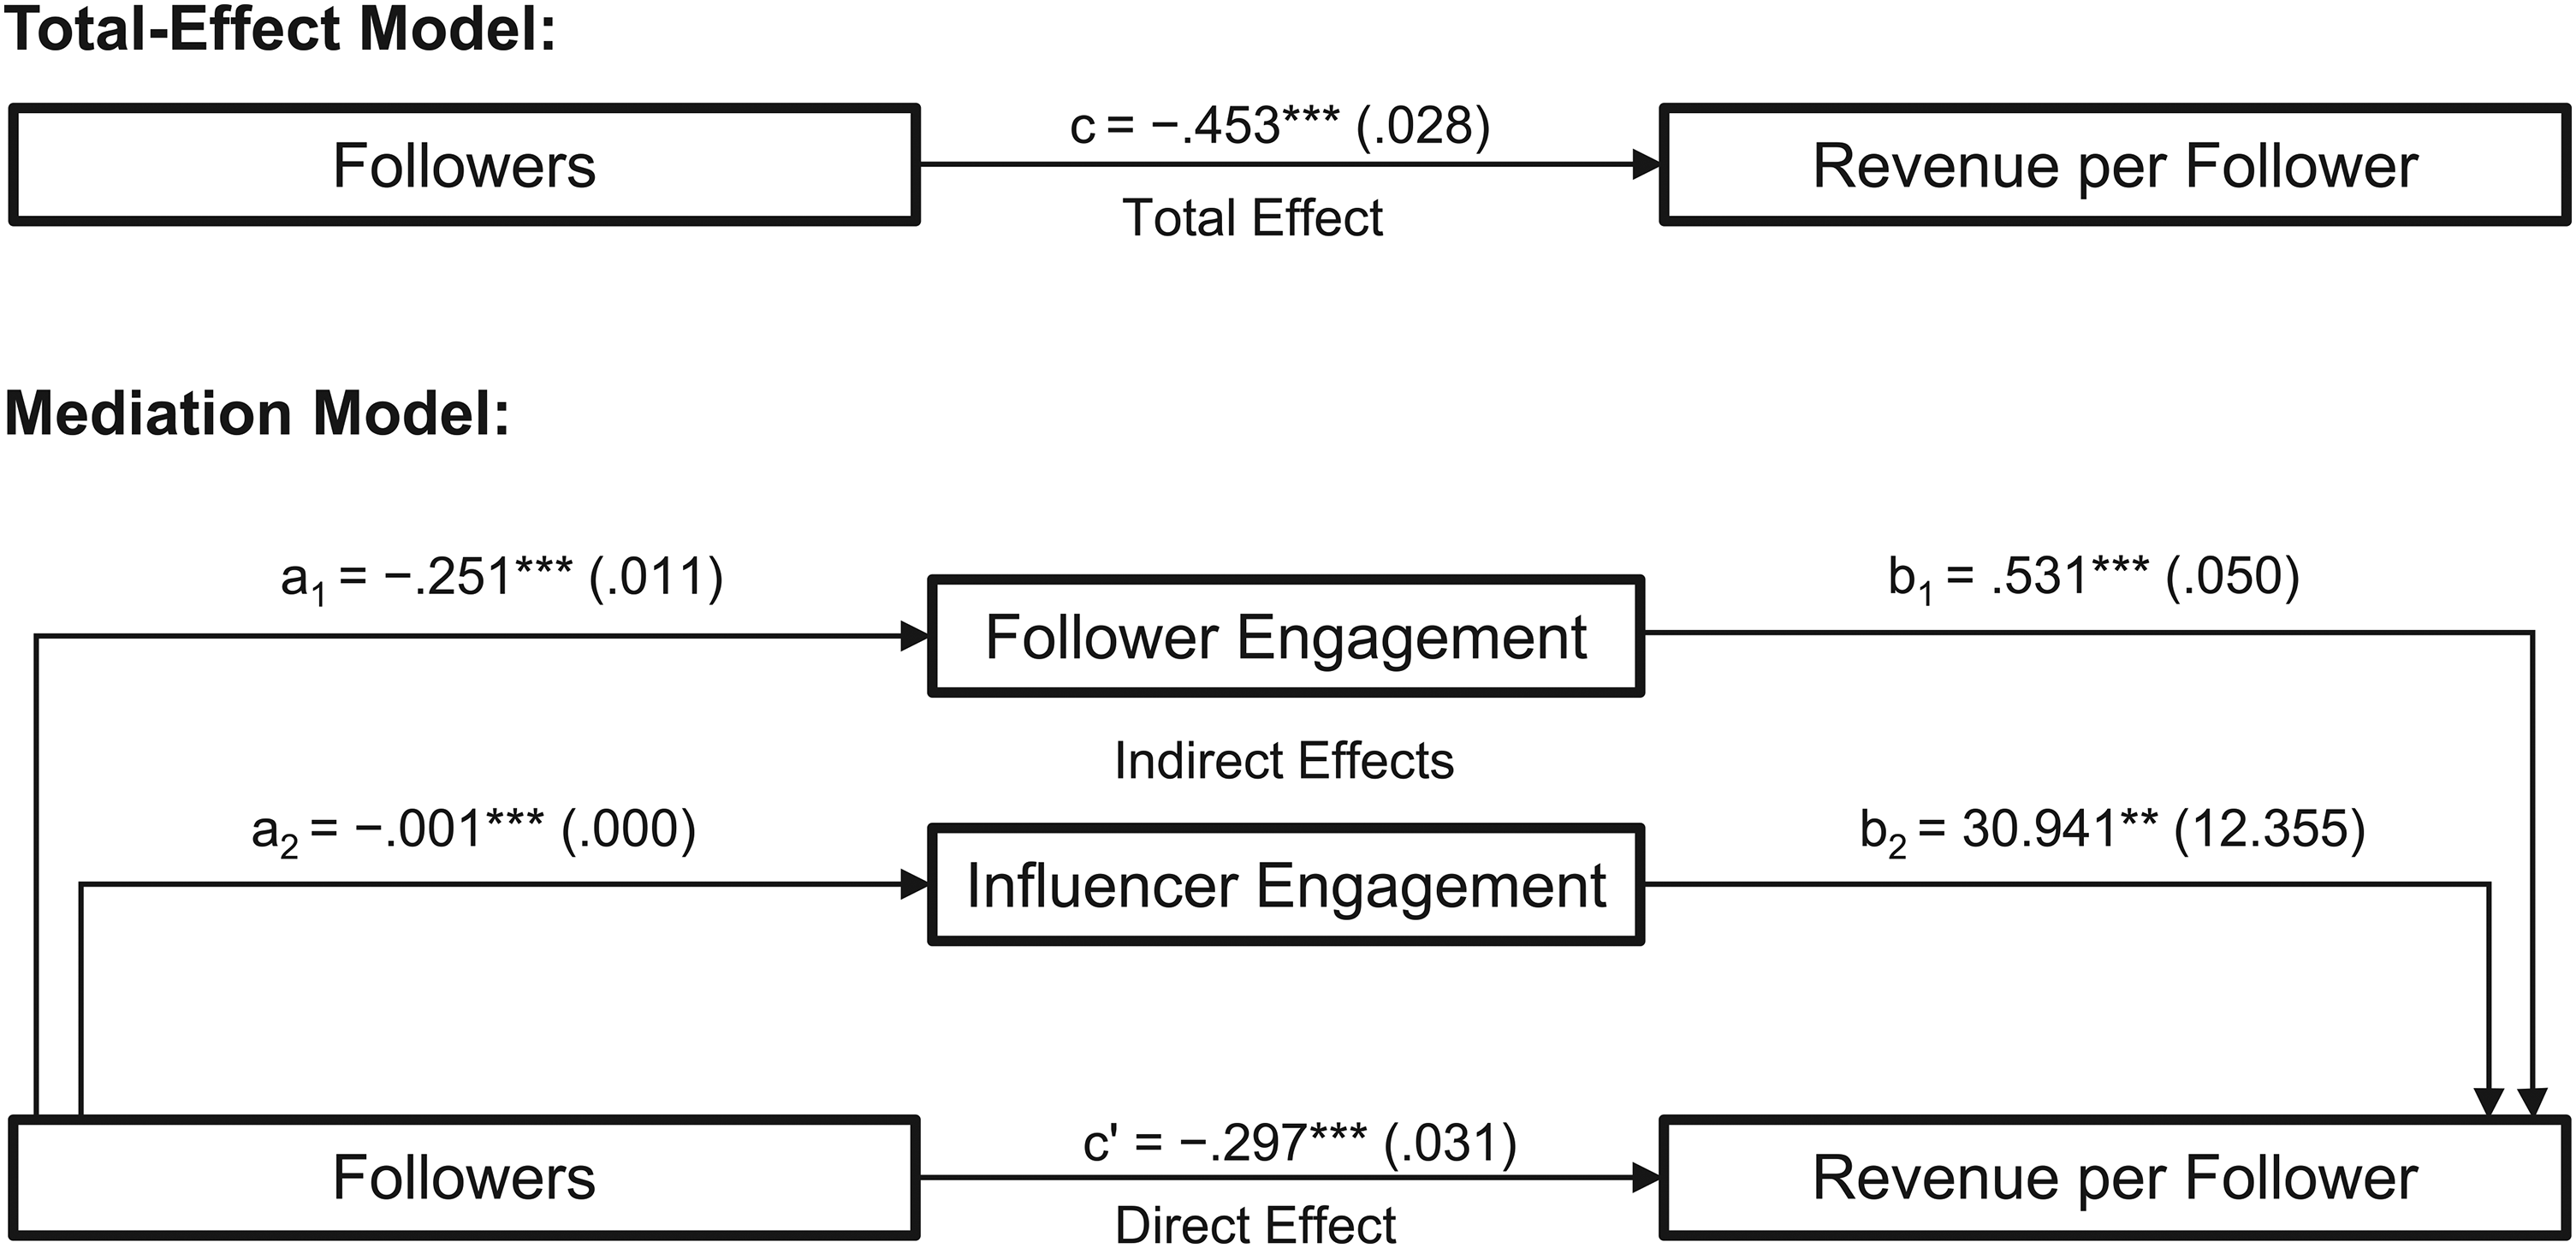
Total-Effect and Mediation Models for Revenue per Follower.
Then we run a bootstrapped parallel mediation model, providing a robust way to test the significance of the indirect effects (e.g., Xu, Mehta, and Dahl 2022), using as parallel mediators the follower and influencer engagement on the five postings before the sponsored posting (see Figure 3). Again, we use the full data set and include the full range of influencer-, follower-, and posting-related control variables for the mediation model (see Table 2).
Results
When running the total-effect model including all control variables, we find a significant negative association between the (log-transformed) number of followers and the (log-transformed) revenue per follower: the total effect is −.453 (p < .01). This finding is in line with the monotonically decreasing pattern across the three influencer types (see Table 2), from €.265 (nano-influencers) to €.080 (micro-influencers) to €.049 (macro-influencers).
When we run the parallel mediation model using the bootstrapping procedure (Hayes and Preacher 2013) including all control variables, the previously significant and negative total effect becomes closer to zero: the direct effect is −.297 (p < .01). The parallel mediation analysis reveals that the effect of the number of followers on revenue per follower is partially mediated by follower engagement and influencer engagement, since the direct effect of the number of followers on the revenue per follower becomes closer to zero but stays significant. In Appendix C we illustrate the coefficients for all included control variables, which we discuss in more detail in Web Appendix G.
To better understand this result, we calculate the indirect effects (mediating effects) of the number of followers on the revenue per follower via the two mediators. A bootstrap confidence interval of the total indirect effect obtained by resampling the data 1,000 times (with number of followers as the independent variable, follower engagement and influencer engagement as the mediators, and revenue per follower as dependent variable) did not include zero (engagement = −.156, 95% confidence interval [CI] = [−.163, −.107]). Notably, the two indirect effects are also significant (follower engagement = −.133, 95% CI = [−.171, −.135]; influencer engagement = −.023, 95% CI = [−.042, −.007]). Hence, the mediation path for follower engagement contributes 85% to the total indirect effect, and the mediation path for influencer engagement 15%, accordingly.
The mediating effects become even stronger when replacing the dependent variable of revenue per follower with the two other ROI metrics, namely the revenue per reached follower (see Table 3, Model 2) and ROIS (see Table 3, Model 3), providing robustness of the findings. Across Models 1 to 3, engagement can explain the negative relationship between the number of followers and ROI. 3 Even though from Model 1 to Model 3 the indirect effects become much stronger, the proportion and hence the contribution of the two mediation paths (follower and influencer engagement) to the indirect effects stay roughly the same. We also test for multicollinearity: the values of the variance inflation factor across Models 1 to 3 are all below four, which meets the threshold of less than five (Gareth et al. 2013).
Total-Effect and Mediation Model.

*p < .1. **p < .05. ***p < .01.
Note that the revenue per reached follower incorporates effects of Instagram's algorithm, whose invisible hand sometimes allocates more or fewer views to a certain posting (Haenlein et al. 2020). By looking at the revenue per reached follower, we incorporate this difference and can thus rule out the possibility that our results are driven by Instagram's algorithm. Looking at reached followers also accounts for potential tie inactivity. ROIS demonstrates a further perspective on the generalizability of our findings by accounting for costs of paid endorsements.
To provide additional robustness we conducted 12 robustness checks regarding four different follower-engagement metrics in our mediation models, which we test with each of the three considered dependent variables (i.e., revenue per follower, revenue per reach, and ROIS, hence 12 robustness checks). These four follower-engagement metrics are based on comments and likes, where we categorize comments as either positive or negative (around 70% of comments are positive). First, instead of adding up the number of likes and comments, we add up only likes and positive comments. Second, we use only the number of likes, and, third, we use only the number of comments. For all these three new metrics, the qualitative conclusions of the mediation models stay the same. Fourth, we also use the number of likes and comments as two separate mediators. While we still find a significant mediation, the comments mediator is significant (only) at the .15 level (see Web Appendix H).
A potential bias is a self-selection bias as a result of influencers who choose to work with a firm, which can limit the generalizability of the influencer's audience and the impact of the firm's marketing efforts. To examine this self-selection of influencers into working with the focal firm, we closely follow the marketing literature using propensity score matching (e.g., Deng, Lambrecht, and Liu 2022; Kumar et al. 2016) and show that when matching (quartile-split), via advanced covariate-balancing-propensity-score matching (Imai and Ratkovic 2014), low-followership influencers with high-followership influencers, the former significantly outperform the latter across all ROI metrics (revenue per follower: β = −8.739, SE = .353, p < .001, R2 = .440, adjusted R2 = .439; revenue per reached follower: β = −29.104, SE =1.117, p < .001, R2 = .438, adjusted R2 = .437; ROIS: β = −620.160, SE = 25.11, p < .001; R2 = .438, adjusted R2 = .437). The results point to the same direction as in our total-effect and mediation models (see Web Appendix I for details). Furthermore, to rule out biases concerning the type of products sold, we find that the average price for items sold is the same across followership levels and ranges between €27.16 and €28.15. This suggests that there are no differences in products sold (in terms of their price and thus revenues).
Therefore, our findings from the empirical investigation are twofold: First, low-followership targeting outperforms high-followership targeting by order of magnitude. Second, a parallel mediation analysis reveals that engagement can explain the negative relationship between number of followers and three relevant ROI metrics.
Additional Evidence for Engagement: Textual Analyses
Linguistic Inquiry and Word Count (LIWC) categories across followership levels
For all five influencer postings before the sponsored posting (in analogy to the mediators), we analyze the followers’ comments and the influencers’ replies. These 570,603 comments and 136,714 replies came in 16 different languages, which we translated to English. On the translated comments and replies, we use the English version of the LIWC dictionary (Boyd et al. 2022; Pennebaker, Francis, and Booth 2001). LIWC is a dictionary-based text classification method and is regularly used in marketing research (see Hartmann et al. 2019).
Since we expect (and find) a lower engagement with higher number of followers, we would also expect shorter comments by followers and shorter replies by influencers (i.e., a lower word count), as well as lower information richness (i.e., fewer words per sentence). Similarly, with a higher number of followers and thus lower engagement, we would expect such influencers to show decreased values with respect to the LIWC word categories of “emotional tone,” “authenticity,” “personal pronouns,” “social processes” (i.e., social behavior and social referents), “affect,” “positive emotions,” “affiliation,” and “netspeak” (i.e., conversational language).
We assess whether this expectation holds between the number of followers of an influencer and the respective LIWC category with a regression on the aggregated five postings (for each posting we calculated the median value of the respective LIWC category), while including the full range of influencer- and follower-related control variables (see Table 2):
Textual Analysis of Follower Comments and Influencer Replies.

*p < .1. **p < .05. ***p < .01.
In line with the main contributing mediator, namely follower engagement, of our mediation analysis, it is the followers of lower followership levels who indicate significantly more signs of authentic and positive language in their commenting behavior compared with higher followership levels. Additional indicators pointing in the same direction in a significant way are the LIWC categories “word count,” “words per sentence,” “personal pronouns,” and “social processes.” This provides additional evidence for the higher engagement and social interactions in the form of more personal relationships of followers of low-followership influencers with the influencer.
LSM between influencers and followers
Everyone has a unique language style, which is less about what we say (i.e., the content) and more about how we say it. According to Humphreys and Wang (2018), the matching of language styles between two individuals is necessary for the development of social relationships. To assess the degree of LSM, we analyze the similarity between followers’ comments and influencers’ replies based on the well-established LSM metric (Gonzales, Hancock, and Pennebaker 2010). Following the formula for calculating LSM (Ireland and Pennebaker 2010), for each influencer, we calculate the relative similarity in the use of eight function word categories between the followers’ comments and the influencers’ replies across the previous five postings. For example, for the function word category of prepositions, for each influencer i we calculate:

Indeed, the LSM metric for nano-, micro-, and macro-influencers is .886, .868, and .855, respectively. Nano-influencers show significantly higher LSM than micro-influencers (p = .023) and macro-influencers (p < .01). We further find that the level of LSM is positively, albeit not highly significantly, correlated with all our dependent variables (corr = .03; p > .1). Note that this may be due to the comments on Instagram generally being short, which makes it challenging for LSM to always detect similarities. In line with the LIWC category results, this finding further illustrates the more personal relationship expressed in the engagement of the low-followership influencer and their followers.
Discussion
Looking at secondary data with a large number of influencers across followership levels to compare the two seeding policies, we find that macro-influencers in our data have 32 times more followers but generate only about four times as much revenue. Consequently, the revenue per follower is five times higher for nano-influencers: .265 versus .049 (see Table 2). We demonstrate this superiority across three ROI metrics, including ROIS, which accounts for costs of paid endorsements.
Even though we try to control for all potentially relevant outside factors, endogeneity still poses a threat to our results. The main difference from the secondary data is that in the field studies we can hold many variables constant. Some of them we can control for only in the secondary data and only to a certain degree. For example, in the secondary data, we cannot control for (1) influencers posting the specific content on other social media channels such as YouTube, TikTok, or Snapchat. We cannot control for (2) the timing dimension in a clean way; in particular, it could be that at the time of the sponsored posting, the e-commerce store had more interesting products available. Furthermore, we cannot control for (3) whether discount codes are publicly shared on third-party websites (e.g., deal-sharing platforms). We cannot fully (although we try to) control for (4) the text and visuals of the sponsored postings. And, most importantly, we cannot exactly control for (5) the products advertised.
The purpose of the next section is to rule out these alternative explanations in a controlled environment with three field studies, namely, not to allow for influencer cross-posting, prevent dissemination on deal-sharing platforms, keep the timing in terms of posting period the same for all, and provide a discount code only for a specific set of products with a short expiry time.
Low- Versus High-Followership Targeting: Three Field Studies
This section consists of three field studies—in full-fledged field settings—and provides robustness concerning the superior performance of low-followership targeting. The effects replicate across different settings, while we controlled for relevant factors, as outlined previously. We ran a total of three field studies in which the settings varied in terms of product domain, brand, freedom of content creation, followership levels, payment, and attribution to sales. In the first study, we kept everything constant except for the number of followers. In the second study, we allowed for some freedom in content creation to make it more realistic. Finally, in the third study, we allowed for full freedom in content creation.
We again collaborated with DTC firms to obtain information on the entire funnel, that is, one in the domain of fashion (consistent with the empirical investigation; Studies 1 and 2) and a second in the domain of beauty (Study 3). These two domains are the most prominently advertised on Instagram (Haenlein et al. 2020).
In the field studies, sales are attributed in two different ways: influencer-specific discount codes that followers can use in the respective firm's e-commerce store (consistent with the empirical investigation; Studies 1 and 2) and personalized UTM tracking URLs (i.e., influencer-specific swipe-up links) that point to that store, which reduce conversion friction (Study 3).
Overview of the Field Studies
Study 1
In the first field study (fashion domain), we provided influencer-specific discount codes that worked for only two days, limiting the risk of it being shared throughout the internet. Also, the goal was to keep the content of the sponsored postings practically the same across all participating influencers. For this reason, the briefing instructions for the influencers were to not show their face in the posting. DeBono and Telesca (1990) demonstrated that attractiveness of the source of an advertising message matters. By not showing the face, we wanted to limit its influence altogether.
Study 2
In the second field study (also in the fashion domain), we again provided influencer-specific discount codes but relaxed the setting to be more realistic by having sponsored postings with the influencers’ faces present.
Study 3
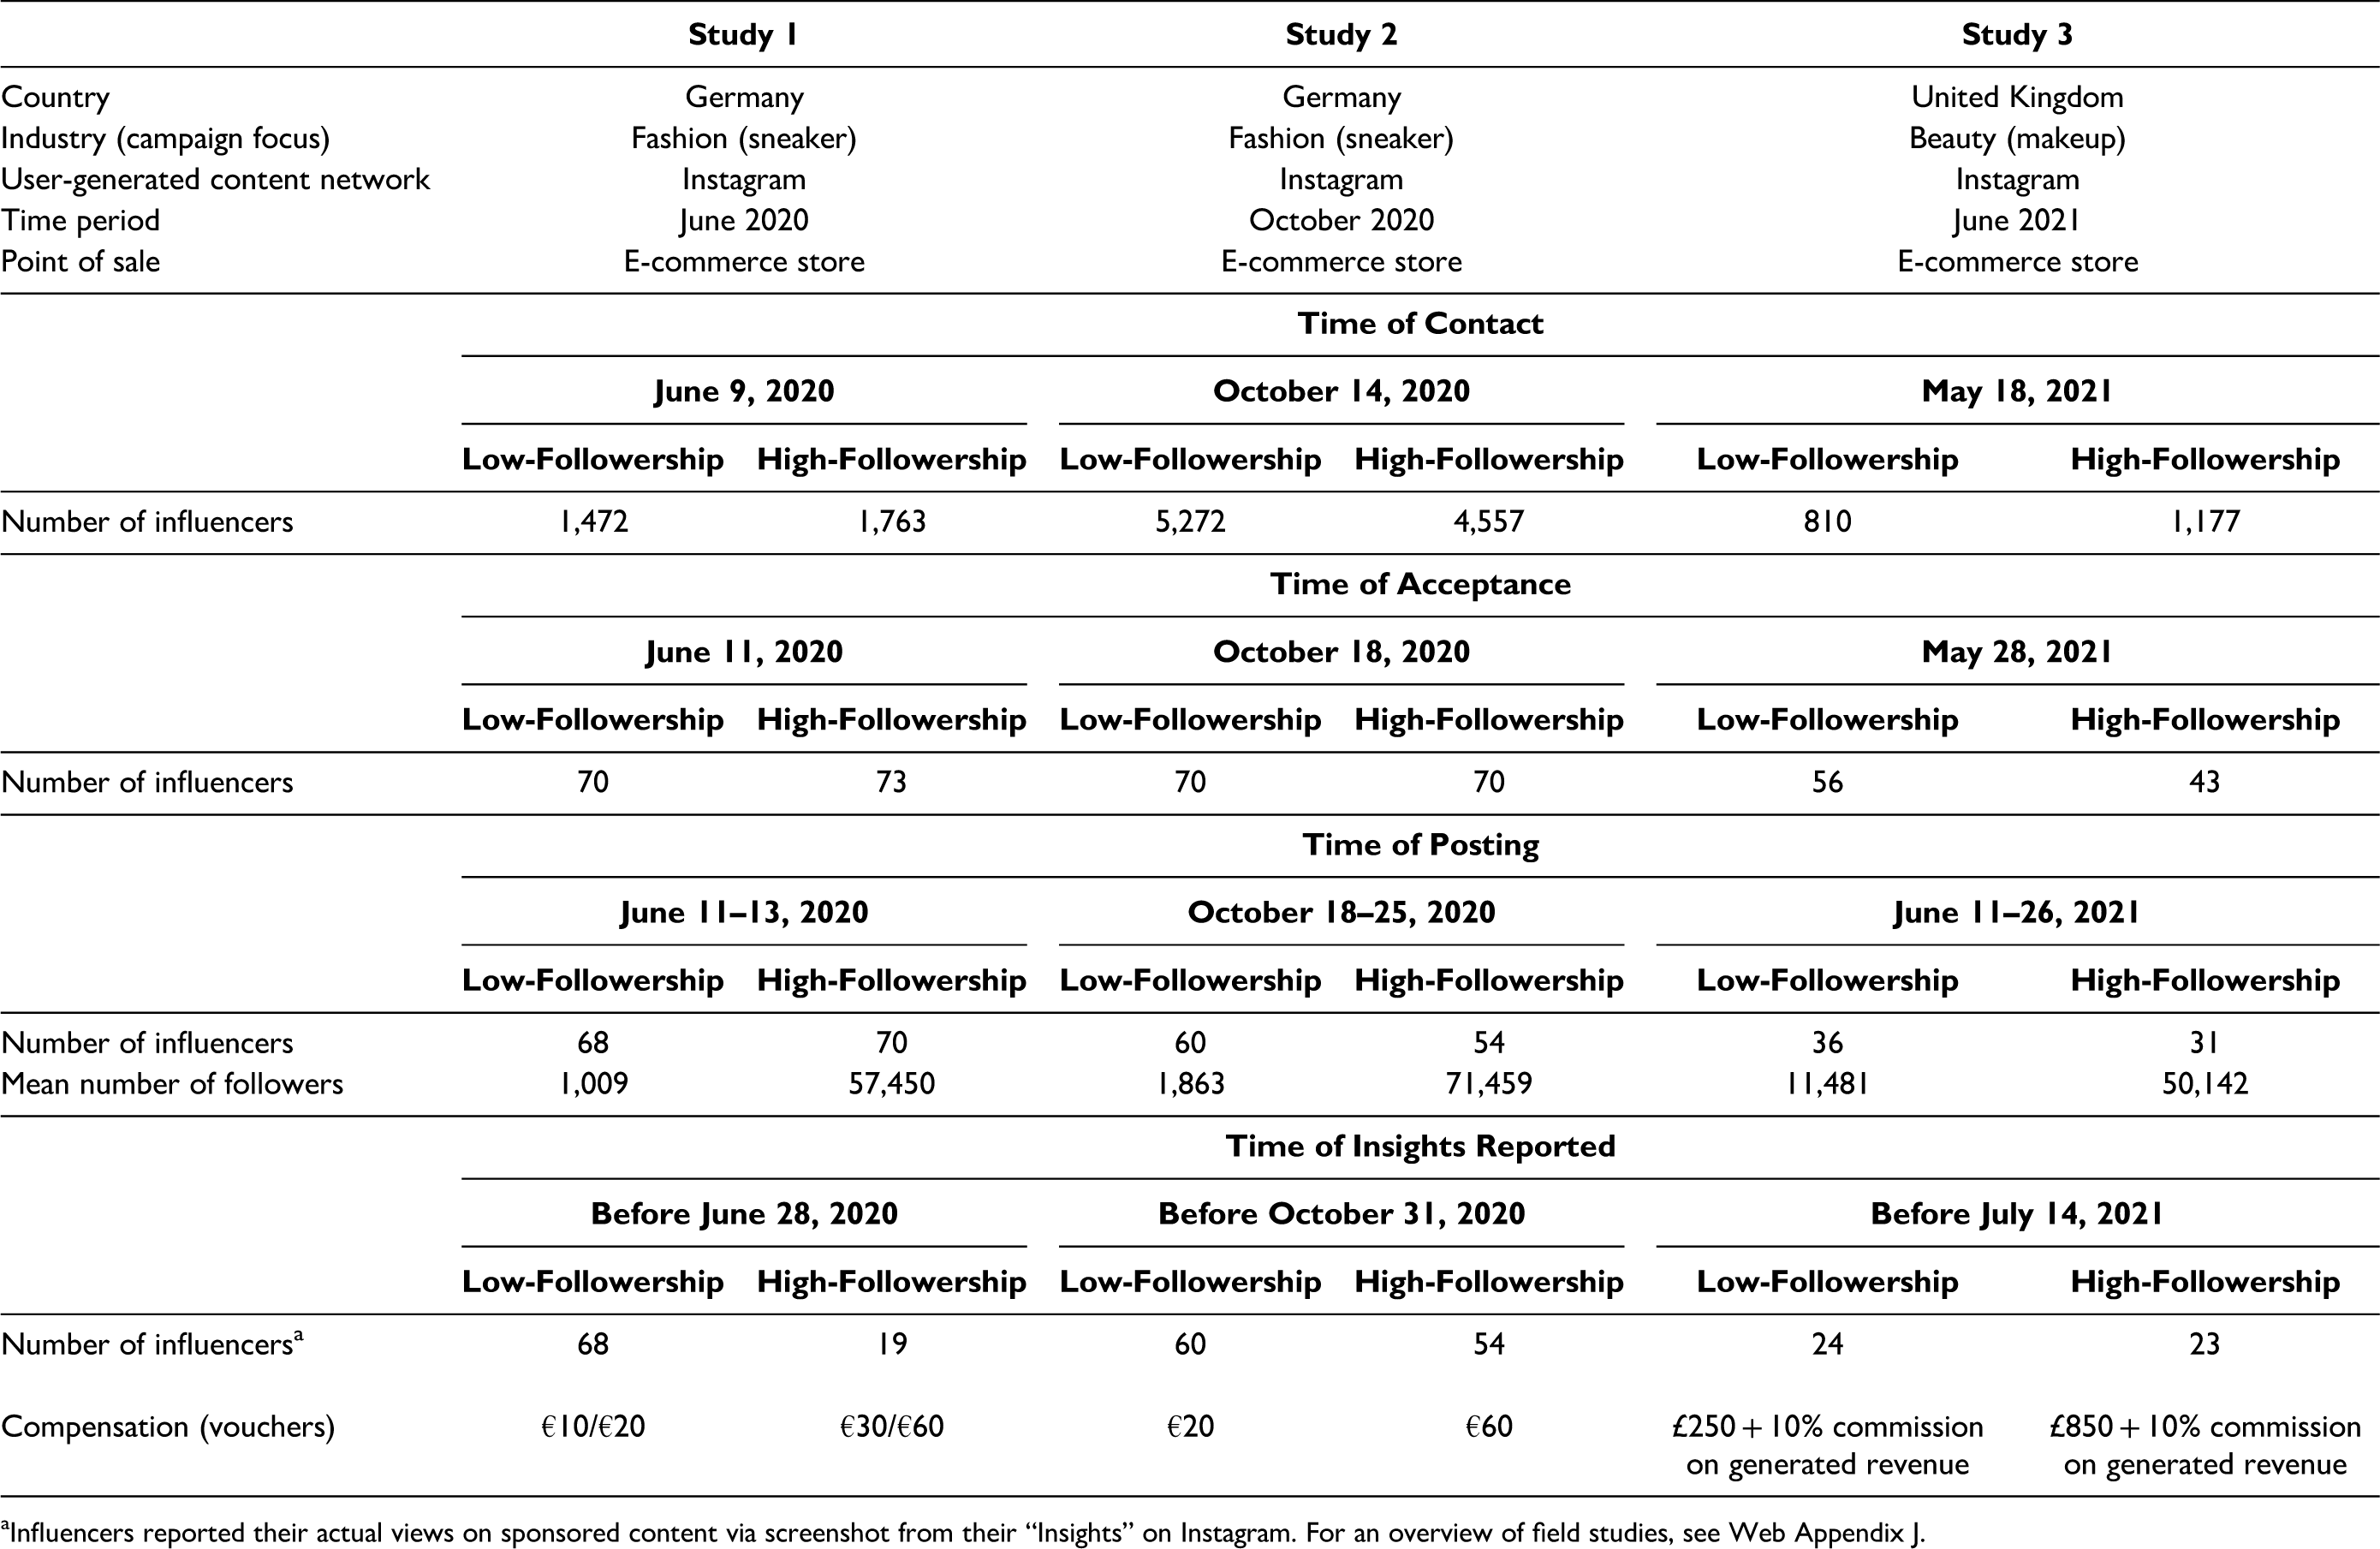
In the third field study (beauty domain), we investigate another type of attribution to sales—that is, influencer-specific swipe-up links, which reduce conversion friction—but without a discount code. This enables followers to go directly from an influencer's posting to the respective firm's e-commerce store. At the time of the experiment, the swipe-up feature was available only for influencers starting at 10,000 followers, which is why our low-followership influencers have considerably more followers in this last field study (and are thus more professional). Once more, we had sponsored postings with the influencers’ faces present, but in addition, we asked participating influencers to use the beauty product and show a before/after effect. For details of the timeline and execution of Studies 1, 2, and 3, see Appendix D and Web Appendix J.
Data
We collaborated with two major influencer-marketing platforms (specialized third-party service and data providers), one for Studies 1 and 2 and a second for Study 3. This allowed us to take a bird's-eye view and consider all available influencers in a given country market, that is, in Germany for Studies 1 and 2 and in the United Kingdom for Study 3.
In the field studies we granted access only to influencers in the campaign from the bottom 25% (low-followership influencers) and the top 25% (high-followership influencers) on the respective influencer-marketing platform. Note that in Study 3, we established a lower boundary and considered only influencers with a minimum of 10,000 followers to be able to use the swipe-up link, which at that time was available on Instagram only for influencers with at least 10,000 followers. This also remedies the critique of choosing less professional and hence less mature influencers. Nevertheless, especially in smaller country markets, marketers heavily rely on low-followership influencers with less than 10,000 followers (which is covered in Studies 1 and 2).
Therefore, in Studies 1 and 2 the average number of followers of participating low-followership influencers is lower (see Table 5), at 1,009 (n = 68) and 1,863 (n = 60) respectively, whereas in Study 3 it is higher, at 11,481 (n = 36). Concerning high-followership influencers, the average number of followers is 57,450 (n = 70), 71,459 (n = 54), and 50,142 (n = 31) for Studies 1, 2, and 3. Whereas in Studies 1 and 2, the high-followership influencers have around 40 to 50 times the followers of the low-followership influencers, in Study 3, high-followership influencers are bigger by a factor of around four to five. In total, there are 319 low- and high-followership influencers in the three field studies.
Overview of the Three Field Studies.
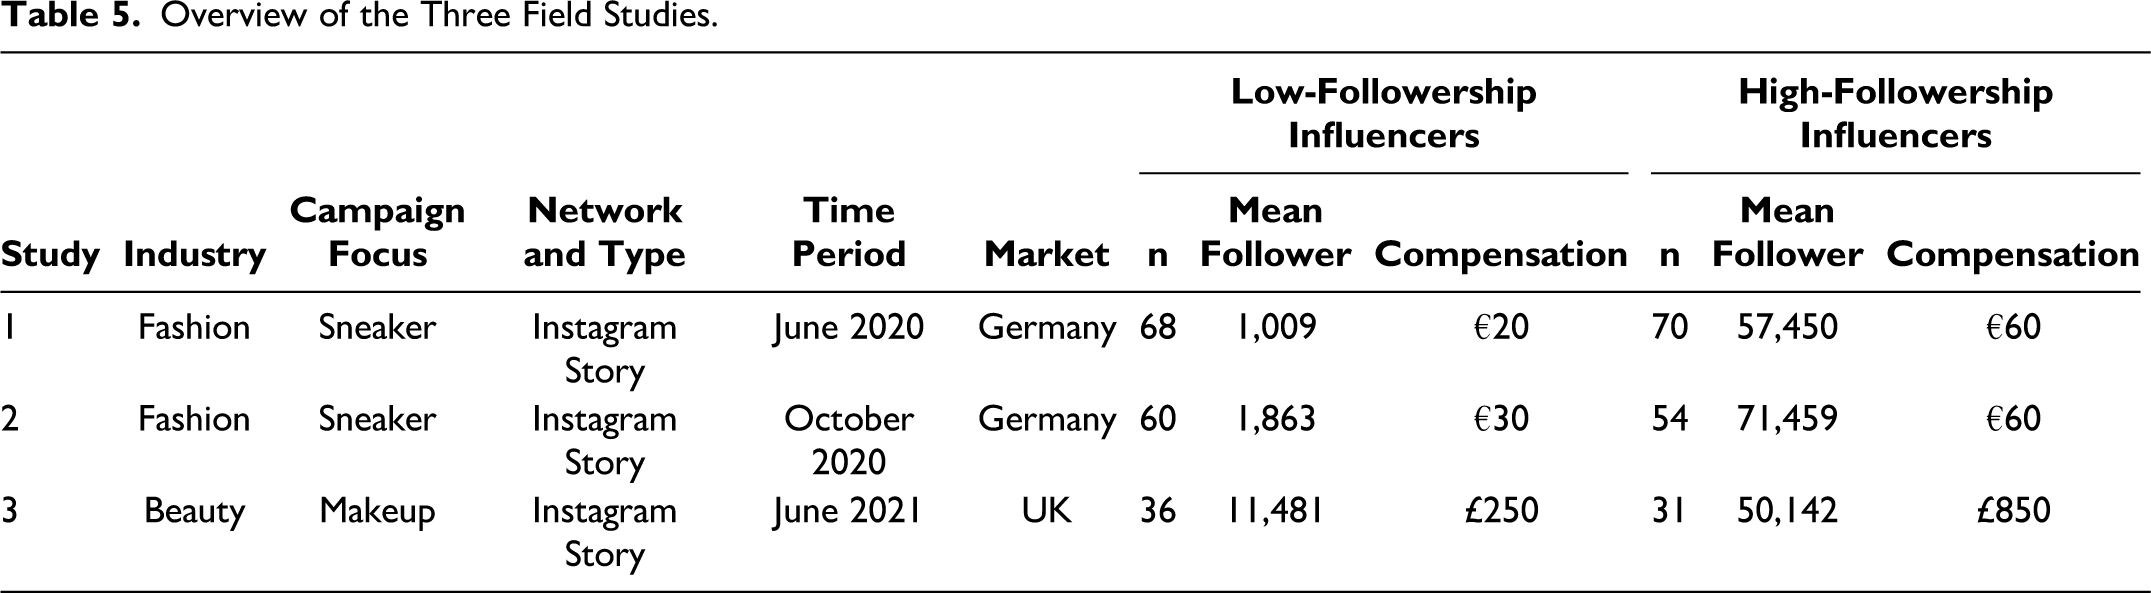
We applied a “first-come, first-served” principle after using the respective influencer-marketing platform to contact 1,472, 5,272, and 810 low-followership influencers as well as 1,763, 4,557, and 1,177 high-followership influencers for Studies 1, 2, and 3, respectively. Note that we find no structural differences among the influencers due to the “first-come, first-served” principle (see Web Appendix K for details and Web Appendix L for sample campaign material). Eventually, a total of 319 influencers participated and were compensated accordingly.
As compensation, the respective firms provided influencers with a voucher for their e-commerce store, which varied according to the influencer type. For Studies 1 and 2, we followed market compensation on the focal platform, and for Study 3, we adopted the collaborating company's typical compensation for low-followership influencers (see Table 5). Compensation levels in Study 3 were also higher, because of higher requirement (i.e., show before/after effect, three stories instead of just one, and video content instead of only an image). To cleanly attribute the sold products, each influencer received an influencer-specific discount code that followers could use in the respective firms’ e-commerce store (Studies 1 and 2) and an influencer-specific swipe-up link that pointed to that store (Study 3 only). Hence, the funnel does not end with the engagement with the sponsored posting after viewing; it continues to a landing in the brand's e-commerce store and eventually to the purchase of a product in it.
Analysis
For all three field studies, we calculate the mean revenue per follower for both low- and high-followership influencers. Additionally, the number of reached followers was made available to us by the influencers, because it was a condition in the briefing instruction to share this (private) information through a screenshot with us.
Results
In Study 1, in which we provided influencer-specific discount codes, targeting low-followership influencers results in mean revenue per follower of .008, compared with only .00007 when targeting high-followership influencers. In Study 2 (the more realistic setting with the influencers’ faces present in the sponsored postings), targeting low-followership influencers results in mean revenue per follower of .007, compared with .0001 when targeting high-followership influencers. Finally, in Study 3, in which we provided influencer-specific swipe-up links—but without a discount code—the mean revenue per follower amounts to .001 (low-followership influencers) versus .00006 (high-followership influencers). As a conclusion, we find across all field studies at least an order of magnitude difference.
Note that in these field studies, the revenue per follower is smaller than in the secondary data. A plausible explanation is that we collaborated with lesser-known brands compared with the globally known brand in the secondary data. Consistently, the results reveal a decreasing pattern from low- to high-followership influencers, that is, from .008 to .00007 in Study 1, from .007 to .0001 in Study 2, and from .001 to .00006 in Study 3. In fact, low-followership targeting is superior by a factor of 114 (Study 1), 70 (Study 2), and 17 (Study 3). From this we learn that in our field study data, €1 invested in low-followership influencers leads to revenues per follower that are between 17 and 114 times higher than that generated through high-followership influencers.
A one-tailed Welch's unequal variances t-test provides a p-value of less than .001 for all three field studies, and hence the differences in all three field studies are highly significant. To add further robustness to these findings, we determine the bias-corrected bootstrap confidence interval obtained by resampling the mean differences in revenue per follower for low- and high-followership influencers 1,000 times. For Study 1 the mean difference estimate for revenue per follower is .009 (bias-corrected 95% CI = [.004, .015]), for Study 2 the mean difference estimate for revenue per follower is .007 (95% CI = [.003, .011]), and for Study 3 the mean difference estimate for revenue per follower is .001 (95% CI = [.000, .002]).
In summary, in these field studies we held the following constant: (1) we did not allow for cross-posting on other social media channels; (2) we checked that the codes were not appearing on major third-party websites; (3) sponsored postings had to appear at the same time, where all the coupon codes had the same expiry date (the coupon codes were also just for a specific set of products); (4) content creation of image and text were gradually relaxed and in the hands of the influencer; and (5) the exact same product was in place to be advertised. To compare more or less stylized settings, in the first study we kept everything constant except for the number of followers. In the second study we allowed for some freedom in content creation to make it more realistic. Finally, in the third study we allowed for full freedom in content creation.
Reviewing these findings from the three field studies, we can conclude that consistently across different settings, the evidence leads to the same conclusion as the empirical evidence: low-followership targeting is superior (while keeping in mind that we had to pay the high-followership influencers at least three times more than the low-followership influencers in the three field studies).
Discussion
We contribute to the seeding literature by considering that followership levels and the level of engagement between the influencer and their followers matter for influencer marketing in the realm of DTC firms. Their main objective is revenue generation, namely direct consumer response. We find that such firms can achieve the highest ROI if they target low-followership influencers, or nano-influencers. In fact, our consistent result is that such nano-influencers provide a significantly better ROI than macro-influencers, by order of magnitude across empirical and field evidence.
Hence, when deliberating where to invest the first euro, it should be in the most profitable influencer type, which is nano-influencers. But this applies not just to the first euro; also the second and all further euros should be invested in nano-influencers until the budget is exhausted (see Web Appendix D).
To the best of our knowledge, we are the first to conduct a supply-side, full-fledged, field study comparison of seeding policies for paid influencer endorsements, in addition to analyzing secondary revenue data. This highly managerially relevant comparison helps resolve controversies about whether macro-influencers make use of their greater reach, and whether they are more persuasive when it comes to the purchasing decision.
The foundation for this comparison is influencer-level data, which marketers nowadays have access to: User-generated content networks such as Instagram make information available on influencers’ follower characteristics. Specialized third-party service and data providers (i.e., influencer-marketing platforms) may also support marketers with more social-network information for further identifying the level of engagement between the influencer and their followers. These influencer-marketing platforms enable marketers to work with hundreds of low-followership influencers at the same time and efficiently leverage their potential at the labor cost of handling only one high-followership influencer. In addition, our survey among senior influencer-marketing managers at DTC firms reveals that it is not difficult to locate and collaborate with influencers (see Web Appendix A for details).
This new approach to influencer marketing requires both access to data and a conceptual foundation. When attempting to make the clean attribution to sales, marketers need to consider the whole influencer-marketing funnel, that is, from followers (e.g., on Instagram), to reached followers (via the sponsored posting), to engagement (with the sponsored posting), to actual revenue. We find that across ROI metrics, nano-influencers consistently outperform macro-influencers.
Specifically, ROIS, which considers both revenue and costs, is more than three times higher (18) for nano-influencers compared with macro-influencers (5) (see Table 2). Even though the revenue is 6 times higher for macro-influencers, the associated costs are 18 times higher than for nano-influencers (see Figure 2).
In contrast to our empirical evidence pointing out the monotonic negative relationship between number of followers and ROI, in our three field studies we were, due to cost constraints, only able to compare the extremes (particularly in Studies 1 and 2). Future research should evaluate followership levels in between those we studied and determine if at certain thresholds, the engagement plummets and hence impacts revenue generation. In addition, and given that we consider paid influencer endorsements, further research is needed, first to understand influencer incentives when offering product gifting, fixed fees, or performance-based compensation and second to determine the impact of influencer briefings on the influencer campaign effectiveness. It is important to mention the unobserved cost structure as a potential limitation as, in general, the influencer's fees (i.e., marketer's costs) may correlate with the strength of influence on their followers (e.g., loyalty, engagement). Moreover, a long-term consideration of influencers in terms of customer lifetime value is needed and can explain the initial interest in a firm, along with the behavior of returning customers. Importantly, when the primary focus of the influencer-marketing campaign is not to generate immediate revenues, which is the primary goal in a DTC context, but to promote awareness, using high-followership influencers probably still makes sense given their broader reach. The dynamics of awareness and revenue goals should be further elaborated on, as that social influence may vary greatly depending on what kind of influence should be exerted. Finally, user-generated content networks (e.g., TikTok) increasingly enable influencers to reach an audience that is not even following the influencer. These networks work with algorithms favoring quick signs of popularity, and they mostly tend to favor low(er) followership levels in their boosts (Lee, Hosanagar, and Nair 2018). Along these lines, future research should look at indirect effects, namely when postings travel further and create cascades of influence.
Supplemental Material
sj-pdf-1-jmx-10.1177_00222429231217471 - Supplemental material for Revenue Generation Through Influencer Marketing
Supplemental material, sj-pdf-1-jmx-10.1177_00222429231217471 for Revenue Generation Through Influencer Marketing by Maximilian Beichert, Andreas Bayerl, Jacob Goldenberg and Andreas Lanz in Journal of Marketing
Footnotes
Acknowledgments
The authors thank Daniel Shapira, Florian Stahl, Peter Ebbes, Lev Muchnik, Matthias Göllner, the various industry collaborators, and the faculty and deanship of HEC Paris and HEC Paris in Qatar as well as the seminar participants at the University of Mannheim, Association for Consumer Research Conference, Choice Symposium, ZEW Conference on the Economics of Information and Communication Technologies, AMA-Sheth Foundation Doctoral Consortium, Marketing Science Conference, Theory+Practice in Marketing Conference, EMAC Conference, AMA Winter Academic Conference, Workshop on Information Systems and Economics, GESS Research Day, Marketing Dynamics Conference, AIM-AMA Sheth Foundation Doctoral Consortium, and Marketing in Israel Conference for valuable comments on previous versions of this article. The article greatly benefited from the comments of the entire review team.
Coeditor
Vanitha Swaminathan
Associate Editor
Michael Trusov
Declaration of Conflicting Interests
The authors declared no potential conflicts of interest with respect to the research, authorship, and/or publication of this article.
Funding
The authors disclosed receipt of the following financial support for the research, authorship, and/or publication of this article: This work was supported by the Julius Paul Stiegler Memorial Foundation, IDEUM, HEC Paris in Qatar, and a grant from the French National Research Agency (ANR), “Investissements d’Avenir” (LabEx Ecodec/ANR-11-LABX-0047).
Notes
Appendix A: Additional Generalizability Through Supportive Evidence
We were able to collect secondary data also in other contexts (entertainment and gaming) and on other user-generated content networks (YouTube and TikTok).
An entertainment company used 120 German influencers with the goal of advertising a TV day pass. We median-split influencers with respect to the followers they have and found that the smaller ones, with 105,959 followers on average, generated a revenue per reached follower of €.0030, while the bigger influencers, with 1,477,290 followers on average, generated only €.0018 with each reached user.
Another company wanted to advertise a voucher card in Europe. We found that 12 small influencers had on average 91,558 subscribers, reached 21% of them, and generated €.016 in revenue for each reached subscriber. The 13 biggest YouTubers in the data, with 900,000 subscribers on average, reached only 12% of them and generated €.006 in revenue for each reached subscriber.
A fashion company worked with 11 TikTok influencers from Germany between 2020 and 2021 to advertise discount codes valid for the brand's entire e-commerce store. The five small influencers had on average 197,977 followers and generated €.042 in revenue for each follower. The six biggest influencers in the data, with 634,320 followers on average, generated €.005 in revenue for each follower.
These results add robustness to our finding that when it comes to generating sales, smaller influencers achieve more relative to the number of followers or subscribers they have. And this holds across different contexts (e.g., fashion, beauty, entertainment, gaming), across different user-generated content networks (Instagram, YouTube, TikTok), and across different content formats (story posting, feed posting, video posting).
Appendix B. Correlation Matrix
|
|
|
|
|
|
|
|
|
|
|
|
|
|
|
|
|
|
|
|
|
|
|
|
|
|
|
|
|
|
|
||
|---|---|---|---|---|---|---|---|---|---|---|---|---|---|---|---|---|---|---|---|---|---|---|---|---|---|---|---|---|---|---|---|
| 1 | Revenue per follower | 1 | |||||||||||||||||||||||||||||
| 2 | Followers | −.05 | 1 | ||||||||||||||||||||||||||||
| 3 | Follower engagement | .09 | −.13 | 1 | |||||||||||||||||||||||||||
| 4 | Influencer engagement | .05 | −.14 | .37 | 1 | ||||||||||||||||||||||||||
| 5 | Following | −.02 | −.12 | −.09 | .06 | 1 | |||||||||||||||||||||||||
| 6 | Media count | −.06 | .34 | −.35 | −.17 | .11 | 1 | ||||||||||||||||||||||||
| 7 | Days on platform | −.02 | .07 | −.25 | −.13 | .04 | .48 | 1 | |||||||||||||||||||||||
| 8 | Interest in focal brand | −.02 | .04 | −.19 | −.03 | −.04 | .14 | .09 | 1 | ||||||||||||||||||||||
| 9 | Sponsored postings | −.06 | .15 | −.31 | −.11 | −.01 | .33 | .19 | .37 | 1 | |||||||||||||||||||||
| 10 | Tone in previous postings | −.04 | .03 | −.11 | .03 | −.00 | .05 | −.04 | .11 | .28 | 1 | ||||||||||||||||||||
| 11 | Beauty score | .01 | .02 | −.01 | .01 | .02 | .00 | −.02 | −.02 | −.01 | .07 | 1 | |||||||||||||||||||
| 12 | Followers’ age | −.07 | .01 | −.38 | −.05 | .12 | .29 | .07 | .14 | .24 | .17 | .01 | 1 | ||||||||||||||||||
| 13 | Female followers | .03 | .09 | .07 | .01 | −.05 | .08 | −.01 | −.04 | .02 | .01 | .01 | −.34 | 1 | |||||||||||||||||
| 14 | Caucasian followers | .06 | −.11 | .17 | .09 | −.02 | −.05 | .01 | −.05 | −.10 | −.03 | .05 | −.11 | .18 | 1 | ||||||||||||||||
| 15 | Fashion focus | .01 | .08 | .02 | −.12 | −.05 | .05 | .04 | −.12 | −.05 | .08 | .06 | −.02 | .13 | .13 | 1 | |||||||||||||||
| 16 | Home country focus | .03 | −.06 | .10 | −.02 | −.04 | −.03 | .02 | .03 | .02 | .06 | .04 | −.07 | .03 | .26 | −.02 | 1 | ||||||||||||||
| 17 | Geographic/demographic overlap | .06 | −.12 | .24 | .02 | −.08 | −.13 | .03 | −.15 | −.14 | −.05 | .02 | −.32 | .14 | .48 | .18 | .25 | 1 | |||||||||||||
| 18 | Sponsored/nonsponsored comparison | −.28 | .08 | .18 | .01 | −.05 | .02 | −.03 | −.02 | −.02 | −.01 | −.03 | −.02 | .03 | .01 | .04 | .02 | .02 | 1 | ||||||||||||
| 19 | Follower activity | .08 | −.02 | .38 | .10 | .01 | −.13 | −.06 | −.18 | −.26 | −.12 | .05 | −.42 | .51 | .46 | .27 | .14 | .48 | .00 | 1 | |||||||||||
| 20 | Likes | −.02 | .65 | .14 | −.11 | −.11 | .09 | −.03 | −.03 | −.01 | −.02 | .02 | −.13 | .11 | −.05 | .11 | −.02 | .02 | −.02 | .10 | 1 | ||||||||||
| 21 | Comments | −.01 | .20 | .10 | .04 | .02 | −.02 | −.06 | −.00 | .01 | .05 | −.01 | −.02 | .01 | −.00 | −.01 | −.01 | −.01 | −.02 | .01 | .40 | 1 | |||||||||
| 22 | Replies | −.02 | −.05 | .08 | .57 | .07 | −.09 | −.11 | .03 | .03 | .08 | −.01 | .11 | −.03 | −.04 | −.10 | −.06 | −.12 | −.07 | −.07 | .05 | .11 | 1 | ||||||||
| 23 | Discount | −.06 | .09 | −.11 | −.07 | −.04 | .08 | .14 | .24 | .19 | .00 | −.02 | .01 | .03 | −.01 | −.00 | .02 | .01 | .01 | −.01 | .07 | −.02 | −.04 | 1 | |||||||
| 24 | Posting length | −.05 | −.07 | −.08 | .08 | .04 | .04 | −.05 | .13 | .27 | .43 | .06 | .24 | .00 | −.02 | .09 | −.00 | −.09 | −.01 | −.18 | −.08 | .04 | .18 | .01 | 1 | ||||||
| 25 | Tone of ad | −.04 | .03 | −.10 | .01 | .01 | .05 | −.03 | .07 | .21 | .45 | .06 | .17 | .00 | −.00 | .08 | .06 | −.06 | −.03 | −.08 | .01 | .04 | .06 | .00 | .35 | 1 | |||||
| 26 | Visual complexity | −.01 | −.01 | −.00 | .02 | .08 | .04 | −.02 | .03 | .06 | .10 | .05 | .05 | .00 | −.01 | −.00 | .01 | −.06 | .01 | −.07 | −.01 | .01 | .02 | −.07 | .16 | .08 | 1 | ||||
| 27 | Visual balance | .03 | .01 | .02 | −.03 | −.03 | −.01 | −.03 | .00 | .01 | .03 | .04 | −.01 | .02 | .00 | .02 | −.02 | .03 | .01 | .00 | .02 | .02 | −.03 | −.01 | .01 | .02 | .08 | 1 | |||
| 28 | Image clarity | −.01 | −.04 | −.03 | .00 | −.01 | .03 | .04 | −.00 | .03 | .02 | −.03 | .04 | .05 | .02 | .01 | .01 | −.01 | .01 | .00 | −.03 | .01 | −.01 | .02 | .02 | −.00 | −.16 | −.04 | 1 | ||
| 29 | Image sharpness | −.01 | .01 | .02 | .02 | .05 | .04 | −.03 | .04 | .05 | .10 | .05 | .07 | .02 | −.02 | −.01 | .02 | −.09 | .02 | −.07 | −.01 | .01 | .02 | −.07 | .14 | .09 | .66 | .05 | −.16 | 1 | |
| 30 | Face shown | −.03 | .03 | .02 | .02 | −.02 | −.03 | −.002 | .03 | .01 | .05 | −.21 | −.00 | −.05 | −.01 | .03 | .01 | −.01 | −.04 | −.05 | .03 | .04 | .04 | .02 | .03 | .08 | .07 | .02 | −.00 | .04 | 1 |
Notes: All variables here are not logged. The four nonnumerical variables (campaign focus area, time of day when posted, weekend, period of year) are not included here.
Appendix C. Model 1: Mediation Model for Revenue per Follower

|
|
||||
|---|---|---|---|---|
|
|
|
|
|
|
|
|
|
|
|
|
| Followers | −.453*** (.028) | −.251*** (.011) | −.001*** (.000) | −.297*** (.031) |
| Follower engagement | .531*** (.050) | |||
| Influencer engagement | 30.941** (12.355) | |||
|
|
||||
| Following | −.197*** (.037) | −.114*** (.014) | −.000 (.000) | −.136*** (.037) |
| Media count | −.067 (.046) | −.053*** (.018) | −.000 (.000) | −.038 (.045) |
| Days on platform | .000 (.000) | −.000 (.000) | −.000 (.000) | .000 (.000) |
| Interest in focal brand | .128*** (.028) | −.008 (.011) | .000 (.000) | .131*** (.028) |
| Sponsored postings | −.136*** (.031) | −.147*** (.012) | −.000 (.000) | −.057* (.031) |
| Tone in previous postings | .002 (.002) | −.001 (.001) | .000** (.000) | .002 (.002) |
| Beauty score | −.097 (.086) | −.020 (.033) | .000* (.000) | −.093 (.084) |
|
|
||||
| Followers’ age | .018 (.013) | −.045*** (.005) | −.000 (.000) | .042*** (.013) |
| Female followers | .922*** (.186) | −.142** (.070) | .000 (.000) | .989*** (.182) |
| Caucasian followers | .590 (.463) | .483*** (.175) | .002** (.001) | .286 (.454) |
| Fashion focus | −.053* (.029) | .012 (.011) | −.000*** (.000) | −.056* (.028) |
| Home country focus | .176 (.114) | .079* (.043) | −.001*** (.000) | .151 (.111) |
| Geographic/demographic overlap | 1.161*** (.235) | .263*** (.089) | −.000 (.000) | 1.023*** (.230) |
| Sponsored/nonsponsored comparison | −1.420*** (.411) | 2.350*** (.155) | .004*** (.001) | −2.792*** (.419) |
| Follower activity | .800*** (.252) | 1.097*** (.096) | .001*** (.000) | .185 (.253) |
|
|
||||
| Comments | .143*** (.032) | .324*** (.012) | .000*** (.000) | −.042 (.036) |
| Replies | −.025 (.021) | −.039*** (.008) | .001*** (.000) | −.025 (.022) |
| Discount | −7.315*** (.641) | −.424* (.242) | −.001 (.001) | −7.074*** (.627) |
| Posting length | −.027 (.047) | .038** (.018) | .000 (.000) | −.049 (.046) |
| Tone of ad | −.001 (.001) | −.001** (.000) | −.000 (.000) | −.000 (.001) |
| Visual complexity | −5,066.844 (3,643.521) | −1,378.665 (1,378.565) | 4.115 (5.557) | −4,461.505 (3,561.393) |
| Visual balance | .000 (.002) | .001 (.001) | −.000 (.000) | −.000 (.002) |
| Image clarity | −.083 (.118) | −.036 (.045) | .000 (.000) | −.066 (.115) |
| Image sharpness | .096* (.050) | .082*** (.019) | .000 (.000) | .053 (.049) |
| Face shown | .006 (.071) | −.030 (.027) | .000 (.000) | .019 (.070) |
| Campaign focus area (omitted base reference category: Benelux) | ||||
| DACH region | .260*** (.085) | .239*** (.032) | −.000* (.000) | .140* (.084) |
| Mediterranean | −.745*** (.117) | .040 (.044) | −.000 (.000) | −.764*** (.114) |
| Nordic | .567*** (.092) | .192*** (.035) | −.000 (.000) | .468*** (.090) |
| Others | −.602*** (.191) | .010 (.072) | −.000 (.000) | −.594*** (.186) |
| Time of day when posted (omitted base reference category: afternoon) | ||||
| Evening | −.062 (.064) | −.037 (.024) | −.000 (.000) | −.039 (.063) |
| Morning | .070 (.070) | −.042 (.027) | −.000 (.000) | .093 (.069) |
| Night | .577** (.265) | .048 (.100) | −.000 (.000) | .558** (.259) |
| Weekend | −.062 (.059) | −.005 (.022) | −.000 (.000) | −.058 (.058) |
| Period of year (omitted base reference category: fall) | ||||
| Spring | .022 (.071) | −.079*** (.027) | .000 (.000) | .064 (.070) |
| Summer | −.185** (.076) | −.044 (.029) | .000 (.000) | −.165** (.074) |
| Winter | −.254*** (.076) | −.053* (.029) | −.000 (.000) | −.222*** (.074) |
| Constant | .975 (.748) | −.364 (.283) | .004*** (.001) | 1.041 (.733) |
| Observations | 2,808 | 2,808 | 2,808 | 2,808 |
| R2 | .319 | .609 | .350 | .350 |
| Adjusted R2 | .310 | .604 | .341 | .341 |
| Residual std. error | 1.393 (d.f. = 2,770) | .527 (d.f. = 2,770) | .002 (d.f. = 2,770) | 1.361 (d.f. = 2,768) |
| F-statistic | 35.101*** (d.f. = 37; 2,771) | 116.605*** (d.f. = 37; 2,771) | 40.297*** (d.f. = 37; 2,771) | 38.293*** (d.f. = 39; 2,769) |
*p < .1, **p < .05, ***p < .01.
Notes: The steps refer to Baron and Kenny (1986): Step 1 is the total-effect model. Step 2A and Step 2B are a regression of both parallel mediators against the number of followers and all controls. Step 3 is the mediation model, which is the full model, with number of followers, both mediators, and the controls. The following variables went into the model after taking the log: revenue per follower, followers, follower engagement, influencer engagement, following, media count, interest in focal brand, sponsored postings, comments, replies, posting length, image sharpness. To avoid multicollinearity, we exclude the number of likes on the ad, as this would cause a variance inflation factor above 10.
Appendix D. Timeline and Details of Execution of Field Studies
|
|
|
|
||||
|---|---|---|---|---|---|---|
| Country | Germany | Germany | United Kingdom | |||
| Industry (campaign focus) | Fashion (sneaker) | Fashion (sneaker) | Beauty (makeup) | |||
| User-generated content network | ||||||
| Time period | June 2020 | October 2020 | June 2021 | |||
| Point of sale | E-commerce store | E-commerce store | E-commerce store | |||
|
|
||||||
|
|
|
|
||||
|
|
|
|
|
|
|
|
| Number of influencers | 1,472 | 1,763 | 5,272 | 4,557 | 810 | 1,177 |
|
|
||||||
|
|
|
|
||||
|
|
|
|
|
|
|
|
| Number of influencers | 70 | 73 | 70 | 70 | 56 | 43 |
|
|
||||||
|
|
|
|
||||
|
|
|
|
|
|
|
|
| Number of influencers | 68 | 70 | 60 | 54 | 36 | 31 |
| Mean number of followers | 1,009 | 57,450 | 1,863 | 71,459 | 11,481 | 50,142 |
|
|
||||||
|
|
|
|
||||
|
|
|
|
|
|
|
|
| Number of influencers a | 68 | 19 | 60 | 54 | 24 | 23 |
| Compensation (vouchers) | €10/€20 | €30/€60 | €20 | €60 | £250 + 10% commission on generated revenue | £850 + 10% commission on generated revenue |
Influencers reported their actual views on sponsored content via screenshot from their “Insights” on Instagram. For an overview of field studies, see Web Appendix J.
References
Supplementary Material
Please find the following supplemental material available below.
For Open Access articles published under a Creative Commons License, all supplemental material carries the same license as the article it is associated with.
For non-Open Access articles published, all supplemental material carries a non-exclusive license, and permission requests for re-use of supplemental material or any part of supplemental material shall be sent directly to the copyright owner as specified in the copyright notice associated with the article.