
Abstract
This research proposes a simple, new technique to obtain truthful answers to sensitive, categorical questions. The paired response technique (PRT) asks participants to merely report the sum of the answers to two paired questions, one baseline and one sensitive, with the answers to each question known only to the participants. The technique then statistically infers the prevalence of the sensitive characteristic and its potential drivers from the association of the baseline question with other questions in the survey. Monte Carlo simulations demonstrate the performance of the PRT under varying conditions. A representative survey (n = 4,649) in the Netherlands about legal and illegal purchases of prescription drugs to enhance sexual performance reveals that 17.4% of the target population has purchased medication to enhance sexual performance at least once. In contrast, in a control group surveyed with direct questioning, only 5.1% admit having done so. The great majority of these individuals opt to purchase illegally. Two further empirical applications, respectively, in the United States and the United Kingdom, show that the PRT reduces cognitive and affective costs of survey participation compared with a state-of-the-art randomized response technique for categorical questions.
Surveys are commonly used to investigate consumers’ behavior and opinions, but participants may provide socially desirable answers when the research concerns a sensitive topic (Steenkamp, De Jong, and Baumgartner 2010; Tourangeau and Yan 2007). Examples of such sensitive topics are pornography viewership; smoking during pregnancy (De Jong and Pieters 2019); sexual desires and behavior (De Jong, Pieters, and Fox 2010); software, music, and movie piracy (Kwan, So, and Tam 2010); and self-reported information on charity donations or sustainable consumption (White, Habib, and Hardisty 2019).
This research proposes a new technique to enhance truth-telling for sensitive survey questions. Our paired response technique (PRT) offers distinct advantages over existing indirect question techniques to promote honest responses. The PRT (1) can accommodate all types of categorical questions, which broadens the researcher's toolbox, (2) is easy to understand for survey participants, (3) offers unconditional privacy protection to participants, and (4) does not rely on randomization devices or questions mimicking randomization devices. Jointly, this facilitate participants’ compliance with the instructions. We examine the properties of the new technique theoretically and empirically and show that the PRT outperforms a state-of-the-art randomized response technique (RRT) for categorical sensitive questions (De Jong, Pieters, and Fox 2010).
Figure 1 provides an example of the data collection for the PRT. It pairs a sensitive and a nonsensitive item. The instructions simply ask participants to report whether the sum of the answers to these two paired categorical items corresponds to one of the provided response options. The response to the sensitive question is known only to the survey participant and masked from the analyst. Data analysis for the PRT then uses the association between other questions in the questionnaire and the nonsensitive baseline item to estimate the likely response to the sensitive question. The statistical model to analyze the data is based on item response theory (IRT), with Bayesian estimation for inference on the prevalence and correlates of the sensitive characteristic of interest. To facilitate implementation of the PRT in marketing research, we have posted the annotated Matlab and Python code and the data of the three empirical applications at https://osf.io/verfg/.

PRT: Question Pair, Each with Three Response Options.
Substantively, our research uses the PRT to provide new, large-scale empirical evidence on a topic of major societal importance, namely, illegal purchases of prescription drugs. Consumers increasingly rely on self-medication (Goldman and Jena 2011), a trend that was likely accelerated by the COVID-19 pandemic (United Nations Conference on Trade and Development 2020). As a result, more consumers might purchase prescription drugs online illegally. Medication purchased illegally online may entail substantial health risks as online pharmacies without a physical address are shown to sell counterfeit medications with improper ingredients or doses (Gelatti et al. 2013; Organisation for Economic Co-operation and Development [OECD] and European Union Intellectual Property Office [EUIPO] 2020; Venhuis et al. 2013; World Health Organization 2017). An early survey indicated that 25% of U.K. general practitioners had already treated patients for adverse reactions from illegal consumption of medications (Nuffield Council on Bioethics 2009). As a case in point, illegal consumption of a counterfeit drug for erectile dysfunction caused an outbreak of hypoglycemia in Southeast Asia in 2008–2009, leading to multiple deaths (Kao et al. 2009).
Our empirical context concerns consumer acquisition of medication to enhance sexual performance. Despite the potential health risks and side effects, medications to enhance sexual performance appear to be purchased frequently online and are commonly seized by customs controls (Koenraadt and Van de Ven 2018; OECD and EUIPO 2020; Venhuis et al. 2014). In the United States, India, China, and most of Europe, a prescription is required to legally obtain medication to enhance sexual performance and alleviate erectile dysfunction. In our first empirical application, based on a representative Dutch sample (n = 4,649), the great majority of these medications appear to be purchased illegally, most likely online (Venhuis et al. 2013). Using the PRT, we estimate that approximately 3.1% of the Dutch population has purchased medications to enhance sexual performance at least once, but always with a medical prescription, and approximately 13.7% of the Dutch population has done so exclusively without a medical prescription (that is, only illegally). In addition, we identify several potent covariates, for instance, that illegal purchases are especially prevalent among survey participants with lower socioeconomic status. In contrast, using direct questions to survey this sensitive issue dramatically underestimates the prevalence of illegal purchases.
Two additional empirical applications provide evidence that, compared with direct questioning (DQ) and the RRT, the PRT lowers the perceived and experienced psychological costs of participating in surveys on sensitive topics. Furthermore, in a different country (specifically, the United Kingdom), Study 3 replicates the outcome observed in Study 1. DQ leads to a lower estimated prevalence of buying medication to enhance sexual performance compared with the PRT. However, the difference is smaller than in Study 1, most likely due to the distinct regulatory regime in the United Kingdom. Sildenafil is covered by public health insurance and may be bought over the counter without a prescription (Bell et al. 2021). The RRT models do not produce reasonable estimates, unless noncompliance is explicitly accounted for, which requires additional assumptions and increases the required sample size.
The rest of the article is organized as follows. We first present an overview of existing indirect question techniques and the psychological costs that these techniques incur on survey participants. We point out the benefits of the PRT in minimizing these psychological costs for participants. Next, we describe the PRT, the response aggregation function, the statistical model, and the fundamental trade-off between privacy protection and statistical accuracy in designing the PRT. Then, three empirical applications provide evidence of the effectiveness of the PRT, and we conclude. Web Appendix B presents the results of Monte Carlo simulations that demonstrate the performance of the PRT in recovering the average prevalence and correlates of the sensitive characteristic of interest, while protecting individual privacy.
Throughout the manuscript, the term “sensitive characteristic” refers to any state, trait, or behavior (pattern) that survey participants may under- or overreport. The term “sensitive item or question” then refers to the target sensitive question asked to survey participants.
Indirect Question Techniques
A range of indirect question techniques have been proposed to reduce socially desirable response tendencies via truth-telling incentives, including RRTs (Lensvelt-Mulders et al. 2005) and item count techniques (ICTs; Blair, Coppock, and Moor 2020). Compared with DQ, these techniques ensure more truthful reporting by participants when dealing with sensitive private information (Rosenfeld, Imai, and Shapiro 2016; Tourangeau and Yan 2007). However, such indirect question techniques impose additional psychological (cognitive, affective, and behavioral) costs on survey participants, which may limit their usefulness in large-scale marketing and population surveys. The PRT aims to minimize these psychological costs.
RRTs are common indirect question techniques (Chaudhuri and Christofides 2013; Warner 1965). The privacy of the survey participant is protected by using a randomization device, such as a coin, a die, or a spinner (real or electronic). The randomization device adds stochastic noise to hide the survey participant’s true response to the sensitive question from the analyst. At the sample or subgroup level, it is straightforward to make inferences about the true response to the sensitive question (Blair, Imai, and Zhou 2015; Chaudhuri and Christofides 2013). Although commonly used, these methodologies have also come under scrutiny (Coutts and Jann 2011; Umesh and Peterson 1991; Wolter and Preisendörfer 2013). Randomization devices are difficult for many participants to understand and trust (Krumpal and Voss 2020). Furthermore, the response procedure may require some participants without the sensitive characteristic to endorse the question about it, thereby seemingly incriminating themselves. These participants might refuse to comply with the instructions (John et al. 2018). Finally, these techniques can be cumbersome for participants due to the (sometimes repeated) use of a physical randomizer (die, coin, spinner) or electronic randomization device.
Response aggregation techniques offer an alternative to standard RRTs. Instead of relying on randomization devices that add stochastic noise, these techniques ask survey participants to provide a single response to a set of statements (i.e., to aggregate their responses). These techniques are typically easier to understand for participants and simpler to implement than RRTs are (Hoffman et al. 2017). Examples include the ICT (also called the “list experiment”), the crosswise model, or the triangular model. Table 1 provides an overview of popular existing response aggregation techniques. Response aggregation techniques are increasingly popular in political science, sociology, and related disciplines (Blair, Coppock, and Moor 2020; Blair and Imai 2012; Nepusz et al. 2014). An example in marketing is De Jong and Pieters (2019). Figure 2 illustrates the ICT with a binary target item. Table 2 presents an overview of the notation and acronyms.

ICT (List Experiment) with Three Items.
Response Aggregation Techniques and Aggregation Functions.

Notes: The PRT assumes both statements Z1 and Z2 have L different numbers of response options (usually
Terms and Notation.

The ICT is by far the most popular response aggregation technique, with more than 150 published applications before 2020 (Blair, Coppock, and Moor 2020). However, the ICT has important drawbacks. First, similar to other response aggregation techniques, the ICT often results in substantial noncompliance (De Jong and Pieters 2019; Rosenfeld, Imai, and Shapiro 2016). Second, and in contrast to RRTs, the ICT is not suitable for categorical items (De Jong, Pieters, and Fox 2010). This is problematic because Likert and similar categorical items are the principal response format in marketing research and many of the social sciences in general (Bearden and Netemeyer 1999).
Criteria to Evaluate Indirect Question Techniques
Indirect question techniques such as RRTs, ICTs, and the PRT should statistically identify parameters of interest while minimizing the psychological costs (cognitive, affective, behavioral) of survey participation. In the following subsections, we describe each of these psychological costs of participation.
Cognitive costs
Cognitive costs concern the mental effort required to understand the text, follow the instructions, and implement one's choice when responding to survey questions (Johnson and Payne 1985). To illustrate, participants must sum their responses to two or more items when using the PRT or ICT. With RRTs, participants require some basic understanding of probability, which is considered more demanding than summing items (Hoffmann et al. 2016; Wolter and Preisendörfer 2013). For instance, participants from a low socioeconomic background have shown more difficulty understanding instructions about randomization devices (Rosenfeld, Imai, and Shapiro 2016).
Affective costs
Affective costs concern the emotional consequences and hurdles of giving a certain sensitive answer. Affective costs are influenced by the design of the indirect question technique, such as the extent of privacy protection provided to survey participants (Krumpal and Voss 2020), whether participants have to give seemingly incriminating forced answers, and participants’ perception of the baseline items.
Unconditional privacy protection implies that the participant's true response to the target item is concealed regardless of the answer to the indirect question technique. Failure to guarantee unconditional privacy protection implies that participants might actually or seemingly incriminate themselves by endorsing a sensitive item (John et al. 2018; Wolter and Preisendörfer 2013). Figure 2 provides an example of the ICT, where unconditional privacy protection does not hold. In the ICT, if participants report that all items in the list are true (a “ceiling effect”), then they certainly have the sensitive characteristic. Likewise, if participants report that none of the items in the list is true (a “floor effect”), then they certainly do not have the sensitive characteristic. Thus, the ICT does not protect the privacy of participants unconditionally at the extremes. Participants who would truly have to respond at the extremes might then protect their privacy and avoid experiencing negative emotions such as shame and guilt by not adhering to the instructions and by reporting another response. This reduces the validity of the technique. Even if the sensitive item would not be affirmed, participants may report a different sum of affirmative responses to the list of items than the true sum to prevent any impression that they do (Blair and Imai 2012; Hoffmann, Meisters, and Musch 2020; Nepusz et al. 2014). Other common alternatives such as RRTs (John et al. 2018) also have challenges—for instance, when participants have to provide a forced answer that they feel uncomfortable with. This incurs affective costs for survey participants resulting in significant misreporting which may be difficult to detect and correct statistically.
For indirect question techniques relying on response aggregation, affective costs of participation also depend on the other, baseline items. These other items should be meaningful and consistent with the “conversational logic” of the questionnaire (Kuha and Jackson 2014; Schwarz 1995), with inconsistent items arousing suspicion and reducing trust among survey participants. Techniques such as the crosswise model, the triangular model, or some version of the ICT use baseline items such as “My father's birthday falls on an uneven day” or “My house address begins with 6” (Höglinger and Jann 2018; Hoffmann, Meisters, and Musch 2020; Nepusz et al. 2014). These items aim at mimicking a randomization device (as their aggregate prevalence is known) and thus do not require between- or within-participation information for estimation. However, such items violate the conversational logic that the questions in a survey are meaningful, and the resulting confusion and mistrust may increase accidental or systematic misreporting. Furthermore, such baseline items may make the sensitive question more salient, triggering defense mechanisms and leading to noncompliance (De Jong and Pieters 2019; Höglinger and Jann 2018; Kuha and Jackson 2014).
Behavioral costs
Behavioral costs relate to the practical implementation of a survey technique for participants, in terms of use of time, response devices, or other means. Behavioral costs are considerable with indirect question techniques that rely on randomized response. Such techniques require survey participants to obtain and/or use a physical randomizer, such as one or more dice (Blair, Imai, and Zhou 2015), or use a calculator to sum multiple responses in an ICT. With the PRT these and other costs are lower, as described next. Lower cognitive, affective, and behavioral costs facilitate the use of an indirect question technique in large-scale marketing and other surveys.
Paired Response Technique (PRT)
This section describes the PRT. We first formally define response aggregation, then discuss the data collection with the PRT and how it relates to the survey participation costs described previously. When using indirect question techniques, the analyst wants to draw inferences about participants’ responses to a sensitive item (survey question)—the target item—while protecting privacy. To achieve this with response aggregation, the target item is mixed with so-called baseline items into a set of items. Rather than directly asking for the response to the sensitive item, the analyst asks participants to provide an aggregate response for the item set as a whole, concealing potentially sensitive answers. Formally, given K items 1, …, k, …, K, each item k is associated with a coded response Zk (e.g., Zk = 1 [0] for true [false] responses; Zk = 1, 2, 3 for agree, neutral, or disagree responses, respectively). Applying an aggregation function
Data Collection
The data collection part of the PRT has the following defining features. First, participants indicate the sum of their responses to a pair of items: a target item and a baseline item. It shares the summing of responses with the ICT, and the use of a pair of items with the crosswise model. In the PRT, the baseline item comes from a validated multi-item scale. Other items from the multi-item scale, labeled “outside-the-pair items,” are asked elsewhere—for instance before or after the PRT in the current survey, or in a previous or follow-up survey. The statistical analysis of the PRT uses information from the outside-the-pair items to predict the prevalence of the baseline item, from which the prevalence of the sensitive target item can be inferred. Hence, within-participant information is sufficient to probabilistically infer their likely response to the sensitive item. 1
As an example, suppose that the baseline item used in the PRT is “I enjoy parties with many people,” an item from the extraversion subscale of the Big Five personality inventory (Goldberg 1992). Additionally, assume that the following items are administered elsewhere (in the survey or in another survey) and answered directly: “I feel comfortable around people,” “I don’t talk a lot,” and “I keep in the background.” Since these items are all correlated, the outside-the-pair items predict the baseline item. These correlations are, however, not exceedingly large (e.g., 10%–30%), thereby guaranteeing privacy protection to the participant.
Response Aggregation Function
To illustrate data collection and analysis for polytomous items, we use an example question from our empirical application on legally and illegally obtaining prescription drugs, shown in Figure 1. The target item U has three possible responses—hence 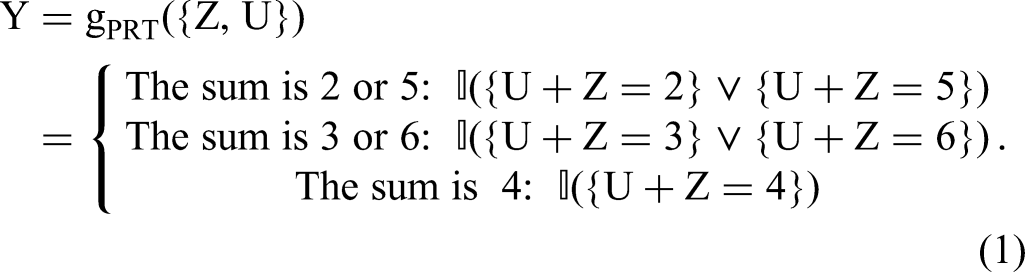

Implementing the model is straightforward by instructing participants to sum the two answers as shown in Figure 1. The PRT thus improves on other indirect question techniques in several important ways. First, the PRT reduces the cognitive and behavioral costs for participants by using “response aggregation” to mask the responses to sensitive questions, rather than by using randomization devices as the RRT does. The instructions are straightforward, and the task of summing up two small integers rests on simple cognitive operations (Johnson and Payne 1985), which facilitates participants’ comprehension and compliance. The PRT simplifies data collection as compared with the ICT, because only two items—including the target item—are required. Second, the PRT is suitable for all common categorical response specifications (binary, ordered, or multinomial responses). Third, the PRT reduces affective costs by ensuring unconditional privacy protection to survey participants. Participants can intuitively verify this because a low number is paired with a high number (e.g., “2 or 6”). Each sum option is not readily associated with a specific sensitive response, which reduces affective costs. This enhances truthful reporting and improves on techniques such as RRTs or the ICT. Table 3 provides the sum options satisfying the requirement of unconditional privacy protection given a target item with any number of options.
Response Options and Aggregation Functions for the PRT.

Notes: Z = baseline item; U = target item. Each level for U and Z is a coded response (e.g., for the case “2 (1, 2)”: 1 = Yes, 2 = No; for the case “3 (1, 2, 3)”:
1 = Agree, 2 = Neither agree nor disagree, 3 = Agree).
Unconditional privacy protection offered by the PRT has a price—that is, it results in a large posterior variance of the target item estimates. The statistical model introduced in the next section aims at reducing this variance while still ensuring unconditional privacy protection.
Statistical Model
We develop a formal statistical model for estimating the prevalence and drivers of categorical target items measured through the PRT. Participant i responds to H ordered baseline “outside-the-pair” items elsewhere in the questionnaire or in a separate survey. The baseline item inside and the outside-the-pair baseline items jointly reflect some latent individual trait, denoted θi for participant i. A “trait” denotes some underlying latent construct, such as personality traits, values, or norms (Fox 2010). The response to the outside-the-pair items 
The latent response to the sensitive target item for participant i is denoted as Ui, with J possible response options {1, …, j, …, J}. The response to the baseline item is denoted Zi, with K = J possible response options {1, …, k, …, K}. The probability of observing a graded response to the baseline item Zi, similarly to the outside-the-pair items, depends on the latent trait θi and item-specific parameters αbas and 
The response to the PRT Yi with possible response options {1, …, l, …, L} is observed and depends on the combination of responses to the baseline item Zi and to the target item Ui. Assuming conditional independence of the baseline and target items Zi and Ui, and conditioning on the remaining model parameters, the response probability to a certain combination of baseline and target item is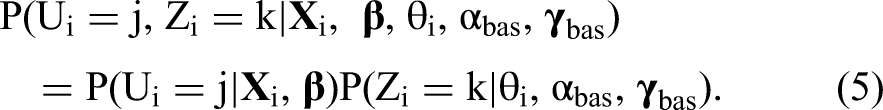

Identification and Efficiency
To identify the latent responses Ui, the following two conditions need to be satisfied. First, the number of response options presented in the PRT must be at least as large as the number of response options for the target item. Second, information on the unobserved baseline response Zi is needed. The key challenge of the PRT is that the response to the baseline question Zi for each individual is unknown to the analyst. However, under the proposed model, information about the latent responses Zi is obtained from the latent trait parameter θi. Thus, to identify the parameters αbas and
Condition 1
The first identification condition of the PRT is as follows: given a target and a single baseline item each with K response options, the prevalence of the target item is identified if the number of response options to the PRT is equal to or larger than K. For instance, in the PRT in Figure 1, the target item has three response options (1, 2, and 3) and the PRT has three possible responses (A, B, and C); hence, the model is just identified. Web Appendix A provides further details and examples illustrating response identification.
Condition 2
Upon satisfying condition 1, identification of the PRT relies on either functional form restrictions or between-participants information from a DQ sample. Specific priors for the baseline item parameters αbas and
An alternative approach is to administer the baseline item Z directly to a separate sample of participants. One could incorporate the responses of this separate sample in the likelihood when estimating Equations 3 and 4. The approach rests on the assumption of measurement invariance, that is, the item parameters
To complete the model identification, we impose the standard IRT restriction by setting the prior of the latent trait parameter θi equal to N(0, 1) (Fox 2010).
ɛ -Differential Privacy
ɛ-differential privacy mathematically quantifies the privacy loss versus statistical accuracy (also known as “utility”) for an indirect question technique. If the so-called parameter ɛ is smaller, more privacy is guaranteed to a survey participant, but statistical estimates of interest, such as the prevalence of the target item, become less accurate (Dwork and Roth 2014; Schneider et al. 2017). In the case of the PRT, the formal definition is as follows. The PRT is ɛPRT-differentially private if, given the response aggregation function 

Empirical Applications
Three empirical applications provide evidence for the effectiveness of the PRT in obtaining truthful responses to sensitive questions compared with DQ techniques and in reducing the psychological costs of participating in surveys on sensitive topics compared with a state-of-the-art RRT. The studies focus on illegal purchases of prescription drugs. Previous studies on this important societal issue rely on small, nonrepresentative samples using DQ techniques, which prevents firm conclusions about the prevalence and correlates of such purchases (e.g., Chan, Wood, and Dargan 2015; Koenraadt and Van de Ven 2018). Direct questions about acquisition and use of sexual enhancement drugs are likely to lead to biased estimates. Our empirical applications of the PRT aim to help close this knowledge gap. In particular, Study 1 is the first large-scale study to estimate the prevalence and correlates of purchases of prescription drugs to enhance sexual performance. Table 4 provides an overview of the studies.
Overview of Empirical Applications.

Notes: N.A. = not applicable.
Study 1: Purchases of Illegal Medication
Data for the first study were collected from an online panel administered in the Netherlands (LISS panel: https://www.centerdata.nl/). The sample is representative of the Dutch population over 16 years old. We have a two-wave longitudinal design. Responses to the target sensitive items are collected in the main wave, and responses to outside-the-pair items are collected in another wave.
Outside-the-pair items
Members of the LISS panel annually complete a questionnaire with a personality inventory. We had access to data from the May 2019 wave. All 6,218 panel members were sampled and 5,075 provided complete questionnaires (81.6%). This data set provides information about the “outside-the-pair” baseline items. We used four items from the Big Five International Personality Item Pool extraversion and conscientiousness subscales (Goldberg 1992), with five-point Likert response categories with endpoints at “Strongly disagree” and “Strongly agree.”
Due to the low incidence of some response options, we collapsed the “Strongly disagree” and “Disagree” categories into a single category. Furthermore, we recovered 182 additional complete questionnaires from the May 2020 wave, under the standard assumption of trait stability across a period of a few months (Gnambs 2014). Web Appendix C shows that the results are robust to excluding this additional sample.
Paired response item
The main data wave (September 2019) included two PRT questions, one with three response options and one with four response options. The first PRT question was a placebo check used to assess whether the PRT provides valid responses in nonsensitive contexts. The target item for the second PRT was a sensitive question with four answer options about purchases of prescription drugs to enhance sexual performance, with the exact items shown in Table 7.
Study 1: Comparing PRT and DQ on the Sensitive Target Item.

Notes: n = 3,687 (PRT) and n = 962 (DQ). Posterior standard errors in parentheses.
In the main wave, 5,946 panel members were included and 4,773 provided complete questionnaires (80.3%). After merging the three data sets (main wave and separate waves for outside-the-pair items), we have complete data for 4,649 participants. Participants in the main wave were randomly assigned to one of two conditions. Participants in the PRT condition answered the sensitive items with the PRT (80% of the total sample, n = 3,687). Participants in the DQ condition received the PRT items, including the baseline item, using direct questions (20% of participants, n = 962). Table 5 has descriptive statistics for both conditions. Participants in the two conditions do not differ in terms of observed covariates, which supports success of random assignment.
Study 1: Descriptive Statistics.

Notes: Median income is net personal monthly income.
Covariates
As covariates to predict illegal purchases of medicine, we include two dummy variables for income (whether the participant earns a net monthly income lower than $1,200 or a net monthly income higher than $3,600) and information on education level (elementary education, vocational or technical education, university-level education). We include these measures based on initial evidence that individuals with lower socioeconomic status are more likely to make these purchases (Ivanitskaya et al. 2010; Napolitano et al. 2013). Furthermore, information was also available on the participant's gender, age, relationship status (whether they currently have a partner or not), and psychometric measures of subjective well-being (Diener et al. 1985).
Data analysis was done in Matlab (version R2021a) using 50,000 draws for burn-in and 100,000 draws for computing posterior statistics. Code to replicate the analyses is provided at https://osf.io/verfg/.
Placebo test
The first PRT administered a nonsensitive target item with three answer options (“My birthday is between the 1st and the 20th of a month,” “My birthday is between the 21st and the 25th of a month,” and “My birthday is between the 26th and the 31st of a month”), which was then paired with a baseline question. If, as we expect, the PRT does not itself introduce bias but only enables participants to answer the sensitive target questions more truthfully, we should observe the following results. First, we should find no significant difference in prevalence of the behavior in the nonsensitive target item when obtained by PRT versus by DQ. Second, we should find a significantly higher prevalence of the behavior in the sensitive target item when it is obtained by PRT than by DQ.
The baseline item in the placebo test came from the Big Five scale of consciousness and was “if a project becomes too difficult, I don’t give up/sometimes I give up/I often give up.” For difference testing, we report the Bayesian p-value pBayes (i.e., the percentage of draws where a parameter estimated with the PRT is larger than the corresponding parameter estimated with DQ). Due to the low accuracy of the posterior estimates, the prior calibration procedure (mentioned in the identification section) is implemented using the baseline item administered directly in the DQ group. A prior sensitivity analysis is reported in Web Appendix C.
Table 6 has mean posterior estimates obtained for the PRT, DQ, and their difference. Web Appendix C has posterior estimates for the baseline item. Table 6 indicates that there is no evidence of possible overestimation or underestimation of response to the nonsensitive item due to using the PRT: none of the differences between PRT and DQ reaches statistical significance. As shown in Web Appendix C, this is true for various prior specifications. The PRT has larger variance compared with DQ, due to the response aggregation mechanism. Given the supportive evidence from the placebo test, we proceed with the sensitive target items.
Study 1 Placebo Test: Comparing PRT with DQ on the Nonsensitive Target Item.

Notes: n = 3,687 (PRT) and n = 962 (DQ). Posterior standard errors in parentheses.
Prescription drugs to enhance sexual performance
We use PRT to assess the prevalence of purchasing prescription drugs to enhance sexual performance. Table 7 shows that the estimated prevalence of buying medication to enhance sexual performance is much lower, namely 12.3% lower (pBayes = .004), when using DQ than when using PRT. That is, while under DQ 5.1% report to have purchased such medication at least once, whereas under PRT that share is 17.4%, which is a striking difference. As for the placebo item, we tested the robustness of the results to various prior specifications. The results are indeed robust (see Web Appendix C).
Under PRT, 3.1% of the participants disclose having purchased such prescription drugs legally, while with DQ 2.2% of the participants indicate having done so (pBayes = .421). With DQ, 2.0% of the participants report having purchased such prescription drugs illegally, whereas an almost seven-times higher 13.7% of the participants report having done so under PRT (pBayes = .008). Differences between questioning methods for the last response option (“having purchased prescription drugs both legally and illegally”) are not significant (pBayes = .266).
Using the MCMC sampler we estimate the proportion of exclusively illegal purchases to be 77.8% (95% CI: [41.3%, 97.1%]) of the total purchase incidence. This estimate is consistent with quite different, unobtrusive but admittedly indirect evidence collected earlier in the country. Venhuis et al. (2014) extracted the amount of sildenafil (an excreted ingredient of Viagra) present in sewage water in three major Dutch cities (Amsterdam, Eindhoven, and Utrecht) during a one-week window. Then, they estimated the percentage of this sildenafil that had been regularly prescribed and purchased at legal pharmacies countrywide. From the difference, they concluded that at least 60% of the Viagra consumed in these cities had been purchased illegally. We estimate from the current survey that approximately 80% of consumers who buy prescription drugs to improve their sexual life carry out these purchases illegally. This high proportion of illegal purchases and the potential health hazards of using illegally acquired prescription medication suggests that such purchases pose a serious public health issue. We next examine the prevalence of buying the target medication for different demographic subgroups.
Gender effects
Results stratified by gender are in Tables 8 and 9. Under the PRT, 7.2% of the male sample reports having bought prescription drugs to enhance sexual performance legally and 13.5% reports having bought illegally. In contrast, female respondents report almost never purchasing prescription drugs to improve their sexual life. Indeed, there are no approved drugs in the Netherlands for enhancing sexual performance for women, and only few approved drugs for female sexual arousal disorder in the United States (e.g., Addyi, Vyleesi). Still, the survey question asked whether participants had bought prescription drugs to enhance sexual life, which they may have purchased for themselves or on behalf of their partner.
Study 1: Comparing PRT and DQ (Male Subgroup).

Notes: n = 1,728. Posterior standard errors in parentheses.
Study 1: Comparing PRT and DQ (Female Subgroup).

Notes: n = 1,959. Posterior standard errors in parentheses.
Correlates of illegal purchases
Table 10 illustrates how the PRT can be used to predict the unobserved sensitive trait from the covariates described previously. Due to the low percentage of legal purchases, the focus is on participants who buy only illegally versus those who do not buy. The quadratic specification for age implies that the lowest likelihood of purchasing medications online illegally is approximately between 35–45 years of age in this sample. Low socioeconomic status increases the probability that participants engage in illegal purchases of the medication. In particular, the prevalence of illegal purchases is estimated at 27.9% for individuals who only completed elementary education, at 13.1% for individuals who received vocational or technical education, and at only 5.9% for individuals who received university-level education.
Study 1: Multinomial Logit PRT for Sensitive Target Question on Illegal Medication Purchases.

Notes: n = 3,687 (PRT). Posterior standard errors in parentheses. Criterion variable is illegally purchasing prescription drugs to enhance sexual performance. Not purchasing (at all) is the reference category.
The next two empirical applications zoom in on the prevalence of buying such medications illegally and show how the PRT is superior to the RRT using both a within-subjects design (Study 2: lay beliefs about PRT and RRT) and a between-subjects design (Study 3: prevalence and evaluation of PRT and RRT).
Study 2: Lay Beliefs About PRT and RRT
In Study 2, we surveyed 200 participants from Prolific on their lay beliefs (e.g., Bolton, Warlop, and Alba 2003) about the psychological costs of indirect question techniques to participants. Completion rate was approximately 91%. Participants were instructed to imagine working for an organization that plans to conduct a survey about a sensitive topic. The participant's task was to judge the psychological costs of two indirect question techniques (the PRT and the RRT) that can be used to protect survey participants’ privacy, to evaluate each technique, and then to choose the technique that they considered to maximize the likelihood that survey participants would respond truthfully to the questions. Thus, participants did not have to answer the sensitive questions themselves, but only to evaluate the survey techniques and select the best one, based on their lay beliefs. Each indirect question technique was illustrated using the example “purchasing prescription drugs without a medical prescription” with three response options (“never,” “occasionally,” and “often”); the illustrated PRT is as depicted in Figure 1. The RRT was implemented using an electronic die, which randomly shows one of six die faces upon clicking on a “roll die” button (as in Höglinger and Jann 2018). Each participant evaluated both the PRT and the RRT on five criteria, shown in Table 11 (questions a to e), with a slider ranging in values from 0 to 10. The evaluation criteria cover both cognitive costs (questions a and b) and affective costs (questions c to e). Afterward, there was a voluntary free-form evaluation. Finally, survey participants were asked whether they would recommend the technique to ask sensitive questions, using a slider from 0 to 100 (item 6 in Table 11). The presentation order of question techniques was randomized across participants. After evaluating both techniques, participants recommended implementing either the PRT or the RRT.
Study 2: Comparing PRT and RRT on Psychological Costs.
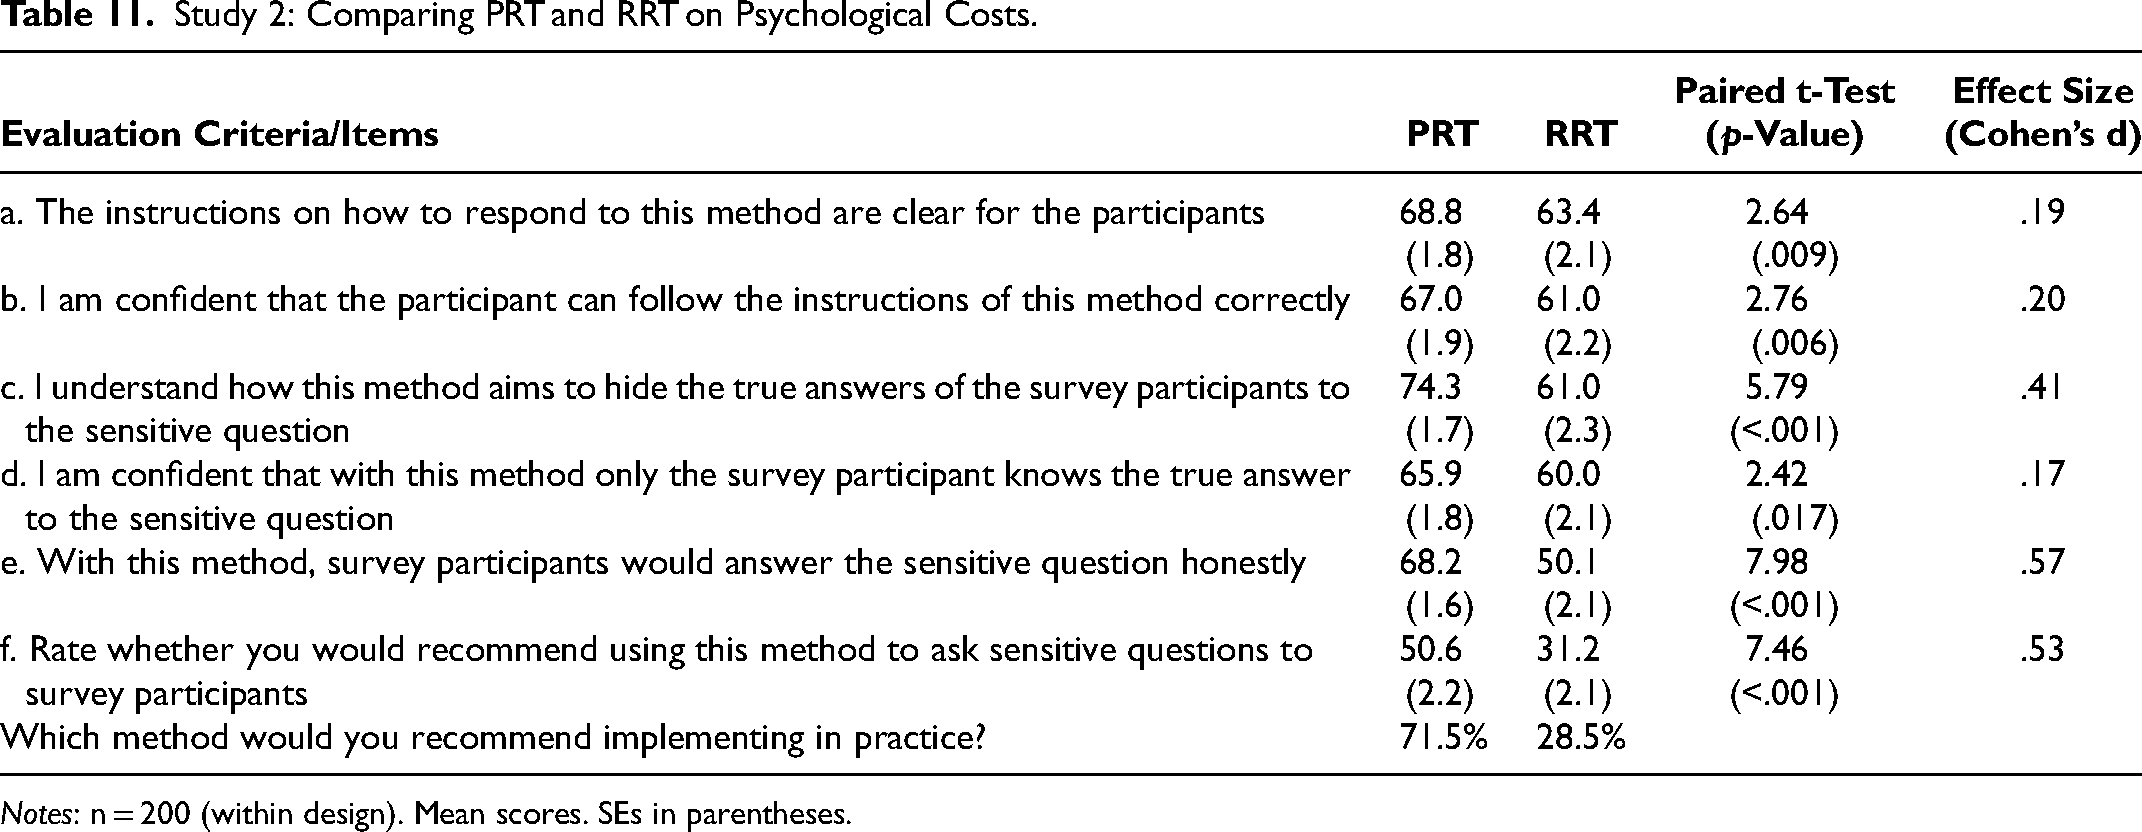
Notes: n = 200 (within design). Mean scores. SEs in parentheses.
The PRT scored higher than the RRT on all five criteria (paired t-test for difference in means: p < .02 for all items). The overall recommendation score for the PRT is much larger than for the RRT (item f): 71.5% of the sample recommend implementing the PRT over the RRT (p < .001, exact binomial test). The differences in average score are much larger for items c and e (as compared with the other items).
Study 3: Prevalence and Evaluation of PRT and RRT
Study 3 builds on the previous two studies by exploring alternative designs to implement the PRT and by comparing the PRT with the RRT on the experienced psychological costs of participation. Study 1 presented the outside-the-pair items in a separate wave to minimize common method bias and hypothesis guessing by participants; however, such a design is often not feasible. Therefore, Study 3 includes the outside-the-pair in the same wave. Further, Study 2 examined lay beliefs (in a within-subjects design) rather than the actual experienced costs of participating in a survey. Hence, Study 3 implements the PRT, RRT, and DQ using a single-wave between-subjects design and asks participants about the psychological costs after they completed the survey. The study uses a convenience sample of N = 2,999 male participants in the United Kingdom, recruited from Prolific (PRT: 52%; RRT: 32%; DQ: 16%). Participants were recruited from five age blocks: 18–27 years old (16.7%), 28–37 years old (18%), 38–47 years old (16.8%), 48–57 years old (20.1%) and 58+ years old (28.5%). The age blocks oversampled older people relative to the standard Prolific population, as purchases of prescription drugs are more common among older people. We compare the PRT with the RRT method (De Jong, Pieters, and Fox 2010) and DQ. Participants evaluated the psychological costs of participating in the PRT and the RRT after completing the survey, but we also report on prevalence estimates under PRT, RRT, and DQ.
The application in the United Kingdom is interesting for regulatory and marketing reasons (Bell et al. 2021). Purchases of sildenafil are covered by public health insurance, and it is legal to purchase Viagra over the counter after consultation with a pharmacist. Furthermore, direct-to-consumer advertising of Viagra sold over the counter is legal, potentially increasing take-up of similar medications (Kim and KC 2020). Therefore, prescription of drugs for erectile disfunction is substantially more common compared with countries such as the Netherlands (in Study 1). 3 We focus on prescription-based purchases because these are more common, being cheaper and often reimbursed by public health insurance (Bell et al. 2021).
The PRT was implemented as follows. Participants first received instructions, followed by the PRT question with a sensitive target item, namely “I have obtained prescription medication to enhance my sexual performance or to alleviate erectile dysfunction, such as Viagra or Cialis.” The item had three response options: “Never,” “I have obtained such medication, and always legally with a doctor's prescription,” and “I have obtained such medication, but at least once illegally (for instance, from a friend, an unregistered online pharmacy, or some other website).” Figure 1 shows the PRT used by participants.
Four different baseline items were used inside the PRT question, which were selected from two validated personality scales. Respondents in the PRT group randomly got one of the four baseline questions, with the remaining three baseline items potentially asked directly elsewhere in the survey (depending on the subgroup). Thus, there were four experimental subgroups within the PRT group. The advantage of this design is that we also collect direct responses to baseline items used in the PRT question, improving the accuracy of the PRT estimates. Web Appendix C provides the baseline items and randomization scheme for the four groups.
The RRT was implemented using an electronic die to facilitate participation. To reduce cognitive costs, additional text instructions were shown on the screen depending on the die outcome (e.g., “Roll die again,” “Answer truthfully”). After responding to the sensitive question, participants in the PRT and other (RRT and DQ) conditions evaluated the technique on psychological cost criteria, shown in Table 12, with a five-point scale (1 = “Strongly disagree,” and 5 = “Strongly agree”). Furthermore, we recorded time to completion.
Study 3: Comparing PRT, RRT, and DQ on Psychological Costs of Participation.

Results: Evaluation
Table 12 summarizes the evaluation of three survey methods by participants. As expected, the PRT outperforms RRT, here on four of the six criteria, namely, criteria a (“instructions are clear”), b (“followed instructions correctly”), c (“understand how answers are hidden”), and f (“worried about privacy”) (p < .02). This is consistent with the lay beliefs assessed in Study 2: survey participants find the PRT instructions more comprehensible and feel less worried about their privacy when answering the sensitive questions, compared with survey participants in the RRT condition. As we expected, participants found DQ instructions easier to understand and follow than PRT instructions (criteria a and b), but participants in the DQ condition also felt a bit more uncomfortable and worried about their privacy (criterion e: p = .026; criterion f: p = .011). Furthermore, completion of the PRT is faster than for the RRT, although not as fast as answering questions directly. Participants require 43.7 seconds on average to answer the PRT versus 52.9 seconds to answer the RRT (p < .001). Thus, to the extent that time to respond captures the underlying cognitive processes (Johnson and Payne 1985), participants find it easier and faster to the engage with the instructions of the PRT than the RRT.
Results: Prevalence
Prevalence estimates for the three techniques are reported in Table 13. The results indicate that under the PRT, participants are more likely to select sensitive response options (obtaining such medications either legally or legally). Two PRT models are tested, that is, a “simple” PRT and a PRT where the dependent variable is predicted using a multinomial logit model (“PRT + covs.”), with covariates such as age and education level (reported in Web Appendix C). Predicting the dependent variable with these covariates increases accuracy.
Study 3: Comparing PRT, RRT, and DQ on the Sensitive Target Item.

Notes: n = 1,572 (PRT), n = 955 (RRT) and n = 472 (DQ). Posterior SEs in parentheses.
More specifically, concerning purchases of prescription drugs to enhance sexual performance, survey participants report a significantly higher likelihood of picking the option “never” with the RRT (88.8%) as compared with the PRT (77.7%; Δ = 11.0% with pBayes = .004) or PRT + covs. (77.3%; Δ = 11.5% with pBayes = .002). The estimated prevalence of the RRT is even higher than DQ (83.6%; Δ = 5.2% with pBayes = .049), which implies that a substantial number of survey participants did not comply with the RRT instructions. Using covariates to predict the RRT responses reduces the difference with PRT, but it is still quite large (PRT: Δ = 9.2% with pBayes = .013; PRT + covs.: Δ = 9.6% with pBayes = .006). Participants might feel uncomfortable abiding by the instructions when asked to select a sensitive option (John et al. 2018), or they might not trust the use of an electronic randomization device that they cannot control (Coutts and Jann 2011). De Jong, Pieters, and Stremersch (2012) estimate noncompliance with RRT instructions in a U.K. sample to be 15%, although their design relied on a physical die as randomizer. 4 In contrast to Study 1, the difference between DQ and the PRT in selecting the response option “Never” is smaller, but still approximately 6% (comparison with PRT: Δ = 5.9% with pBayes = .052; comparison with PRT + covs.: Δ = 6.3% with pBayes = .029).
Conclusion
We introduced the paired response technique (PRT), a novel methodology to obtain truthful answers to sensitive survey questions. The technique guarantees unconditional privacy protection to participants and is easy to implement in large-scale marketing and other social science studies for any type of sensitive question. Our studies provide evidence that the PRT has several advantages compared with the randomized response technique (RRT), a leading indirect questioning technique for categorical questions (De Jong, Pieters, and Fox 2010). We empirically show that participants prefer the PRT to the RRT, finding it easier to understand and more pleasant to use. It is also faster to administer and provides prevalence estimates that are more realistic and precise, especially when RRT models suffer from noncompliance. To facilitate adopting the PRT in future marketing research, we have provided annotated Matlab and Python code on OSF.
The empirical applications of PRT produced noteworthy, new results on consumers purchasing drugs to enhance sexual performance, with important theoretical and policy implications. From the empirical applications, we estimate that approximately 17.4% of the population in the Netherlands obtained drugs to enhance sexual performance, and the majority of these consumers bought the drugs illegally. Standard DQ methods dramatically underestimate this. The differences between PRT and DQ are not due to the technique itself, as statistical placebo tests indicate.
We further estimate that in the United Kingdom, where regulation for purchasing medications to enhance sexual performance is less strict, 22.3% of a nonprobability sample obtained such medications. However, 14.3% of this sample obtained such medications with a prescription, whereas only 7.9% did so at least once illegally. In contrast to the Dutch sample, the difference between the PRT and DQ was smaller in the U.K. sample, perhaps due to regulatory differences, cross-cultural differences in the acceptability of using such medication, or differences between the probability and nonprobability samples. Nonetheless, the PRT appears more suitable and less taxing to participants than the RRT to investigate these issues.
Research on the incidence and determinants of legal and illegal purchases of prescription drugs is urgent, in view of the health threats of consuming counterfeit medicine, incorrect medication dosing by consumers and medicine consumption untraced by regular health care systems (Kao et al. 2009; OECD and EUIPO 2020; World Health Organization 2017). Koenraadt and Van de Ven (p. 353, 2018) stress that “future research should monitor the demand and sale of lifestyle drugs as well as further differentiating between the motives and methods for purchasing various substances.” Yet, reporting on such purchases is sensitive, which might lead to deliberate underreporting if using direct questions with potential grave implications for policy making and evaluation. Moreover, professional research firms are held to exercise special care when the nature of the research is sensitive and data collection may upset or disturb participants (e.g., ICC/ESOMAR 2016, article 1), which may limit or complicate data collection using DQ on such sensitive issues. The proposed PRT may open new avenues for research on sensitive issues. Such research should delve more deeply into the drivers of these sensitive behaviors, ideally further explaining which consumers are more likely to make them and proposing and evaluating policies to discourage them from doing so.
In closing, the PRT is a new, straightforward technique to ask sensitive questions in surveys. It is easy to implement and comprehend and promises to provide new insights into topics that are relevant to policy and theory, but about which consumers may choose not to speak truthfully if asked directly.
Supplemental Material
sj-pdf-1-mrj-10.1177_00222437231205252 - Supplemental material for Response Aggregation to Obtain Truthful Answers to Sensitive Questions: Estimating the Prevalence of Illegal Purchases of Prescription Drugs
Supplemental material, sj-pdf-1-mrj-10.1177_00222437231205252 for Response Aggregation to Obtain Truthful Answers to Sensitive Questions: Estimating the Prevalence of Illegal Purchases of Prescription Drugs by Marco Gregori, Martijn G. De Jong and Rik Pieters in Journal of Marketing Research
Footnotes
Technical Appendix
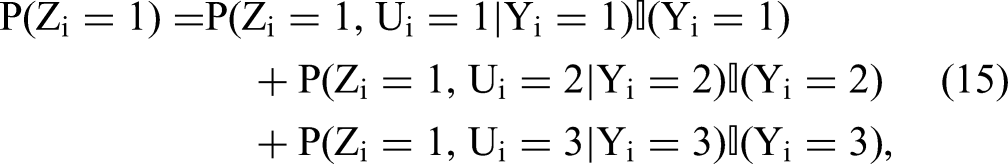
The conditional posterior distributions of the model based on the likelihood are given here. We present only the sampler for estimating the prevalence of the target item (defined as Draw Wih for i = 1, …, N and h = 1, …, H and Draw Wi,bas for i = 1, …, N given Zi, θi, αbas and Draw θi for i = 1, …, N given Draw αh for h = 1, …, H given Wi,h and θi. The conditional posterior of αh is proportional to Draw αbas given Wi,bas and θi. Sampled as in Step 4. Draw Draw Draw Ui and Zi for i = 1, …, N. The joint posterior probability of Ui and Zi conditional on the observed response to the PRT Yi is Draw
These probabilities can be computed using Equation 4 (to compute P(Zi = k)), Step 9 below (to compute P(Ui = j)), and Table 3 (to compute P(Yi = 1|Ui = j, Zi = k) and P(Yi = 1)). The probabilities are then used to compute the marginal probabilities P(Zi = k) and P(Ui = j). For instance, in the example with three response options, for the case Zi = 1:
where

Acknowledgments
The authors are very grateful to the JMR review team for many constructive comments that significantly improved the article. The first author thanks the Scientific Computing Research Technology Platform of the University of Warwick for providing access to computing facilities.
Coeditor
Sachin Gupta
Associate Editor
Neeraj Arora
Declaration of Conflicting Interests
The author(s) declared no potential conflicts of interest with respect to the research, authorship, and/or publication of this article.
Funding
The author(s) disclosed receipt of the following financial support for the research, authorship, and/or publication of this article: This work was supported by the Adri Bakker Foundation.
Notes
References
Supplementary Material
Please find the following supplemental material available below.
For Open Access articles published under a Creative Commons License, all supplemental material carries the same license as the article it is associated with.
For non-Open Access articles published, all supplemental material carries a non-exclusive license, and permission requests for re-use of supplemental material or any part of supplemental material shall be sent directly to the copyright owner as specified in the copyright notice associated with the article.