
Abstract
Soda taxes are an increasingly popular policy tool that discourages purchases of sugar-sweetened beverages. This study analyzes how emphasis on marketing conduct elements and their effectiveness might change after soda tax introductions. Prior studies on the effect of soda taxes focus on price increases but neglect other relevant marketing conduct tools (i.e., promotional frequency, promotional discount depth, and feature promotion frequency). This study documents the changes to marketing conduct elements and their effectiveness due to the introduction of soda tax across more than 200 retail stores in five markets. Findings related to price changes are consistent with prior literature; in addition, the study reveals a substantial, hitherto overlooked decrease in promotional frequency (−2%), promotional depth (−12%), and feature promotion frequency (−14%) compared with matched control markets, exacerbating the tax's negative sales effect. Introducing a soda tax also considerably influences the marketing conduct's effectiveness, such that consumers become less sensitive to changes in regular price, feature promotions, and the depth of the promotional discount but respond more to the presence of promotions. Importantly, marketing conduct and effectiveness changes do not align (e.g., while consumers become more sensitive to promotion frequency, managers often reduce them), a relevant insight for policy making.
Taxes based on sugar content may also encourage manufacturers, distributors, and retailers to redesign their … marketing plans.
The effects of adjustments in marketing conduct variables, such as price promotions, in response to a policy change (e.g., new sin taxes 1 ) may “be greater than even the largest tax” (Tedstone, Targett, and Allen 2015, p. 26), though we unfortunately lack systematic evidence about such adjustments and their implications (Francis, Marron, and Rueben 2016). Considering the widespread popularity and implementation of soda taxes, which impose additional retail taxes on sugar-sweetened beverages, we use this context to investigate how changes to marketing conduct variables, in response to the new policy, compound or offset the desired outcomes of the tax.
Soda taxes, designed to address the obesity epidemic, are already in place in several U.S. metropolitan areas, including Berkeley, Oakland, and San Francisco, California, as well as Philadelphia, Pennsylvania; Boulder, Colorado; and Seattle, Washington. Multiple other localities are contemplating similar taxes, including the states of Connecticut, Hawaii, New York, and Washington (Boesen 2021), prompting various research efforts to determine retailers’ reactions, such as adjustments to regular prices of sugary beverages, and consumers’ responses to the tax (e.g., Seiler, Tuchman, and Yao 2021; Teng et al. 2019). These studies focus on price adjustments and confound regular price changes with short-term promotions, without addressing other localized promotional marketing conduct actions that retailers likely take, 2 such as altering the frequency and level of promotional discounts or featuring certain products in the store circular. Jointly, we label these store-specific decisions “marketing conduct.” Anecdotal evidence suggests that whereas some retailers reduce their promotions of taxed beverages (Holdbrook et al. 2019), others try to compensate for the expected sales losses with additional promotions (Peterson and Placek 2017). The overall sales effect of a soda tax thus may reflect several tactics within the retailer's overall marketing conduct, suggesting the need for a more in-depth, systematic analysis of the implications of the new tax policy. Such investigations seem even more pertinent when we consider that consumer utility and decision making depend on prices and other marketing conduct variables (e.g., Gatignon 1993). Indeed, consumers likely respond to the introduction of a soda tax by adjusting their response to changes in various marketing tools.
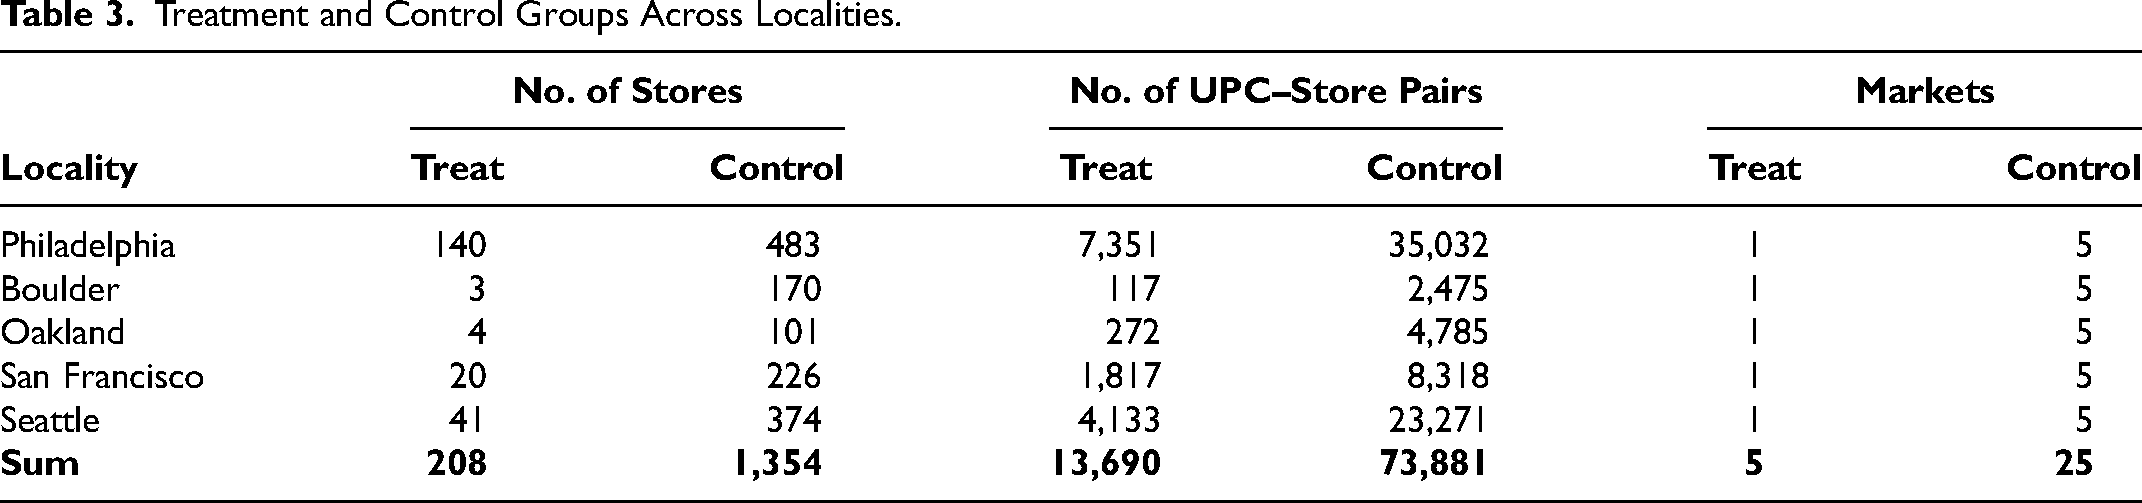
In this timely, relevant research context, we aim to answer two related research questions: How does marketing conduct change in response to the introduction of a soda tax, and does the effectiveness of such marketing conduct change due to the introduction of the tax? With a rich data set related to five soda tax introductions in Philadelphia, San Francisco, Oakland, Boulder, and Seattle, we gather information about close to 600 unique beverage Universal Product Codes (UPCs), representing more than 150 brands. Across the five localities, we obtain observations from more than 200 retail stores, producing more than 13,000 UPC–store pairs. Our identification strategy rests on a difference-in-differences (DID) approach, where we compare sales before and after the implementation of the tax, relative to a set of matched control markets that sell the same UPCs but were not subject to a soda tax. 3 Our research thus is novel in that we (1) include multiple localities to establish more generalizable insights; 4 (2) focus on promotion frequency, promotion depth, and feature frequency in addition to price; and (3) document changes in the effectiveness of marketing conduct variables.
With this unique approach, we determine that the tax is largely passed on to consumers; the average pass-through is 88.2%, though it varies across the five localities, from 70% to 107% (in line with Cawley et al. [2021] and Seiler, Tuchman, and Yao [2021]). But retailers also adapt their marketing conduct, such that we observe diminished promotional frequency (average −2%), a decrease in promotional depth (or the relative size of the discount; average −12%), and a decrease in feature promotion frequency (average −14%). In addition, the introduction of a soda tax influences the effectiveness of each marketing conduct variable: Consumers become less sensitive to changes in the regular price, promotion depth, and feature advertising, but they respond more to the mere presence of promotions.
Managerially, these findings are of critical relevance, as we can decompose the total sales effect of a soda tax and assess to what extent it is driven by adjustments in the promotional conduct rather than (regular) price adjustments. This provides novel insights on adjustments to marketing conduct as a reaction to the introduction of a soda tax. We also provide insights on when the effect of soda taxes is exacerbated and when it is mitigated. Indeed, by assessing the marketing conduct effectiveness changes, we further our understanding on managerial reactions to soda tax introduction and the impact of the reactions on sales.
The findings of our study also place it firmly at the intersection of marketing and health policy research. From a policy perspective, by studying the application and effectiveness of marketing conduct variables after a soda tax introduction, we clarify whether the conduct hinders or elevates the effectiveness of tax policies designed to discourage the consumption of unhealthy products. In the process, we contribute to a stream of studies on governmental measures on consumer nutrition (e.g., Palazzolo and Pattabhiramaiah 2021) and other efforts to curb societally harmful products (e.g., cigarettes; Wang, Lewis, and Singh 2021), which has highlighted that not all brands are affected equally. We also add to the literature on marketing conduct and soda taxes. For marketing conduct literature concerning conduct decisions and their effectiveness in retailing, we move beyond studies that use primarily a business cycle (e.g., Lamey et al. 2012; Van Heerde et al. 2013) or rebranding (Keller, Geyskens, and Dekimpe 2020) lens. We build on the literature concerning soda tax, where most prior studies of soda taxes in particular analyze their impact on retailer pass-through behaviors and sales at a single location (e.g., Bollinger and Sexton 2023; Roberto et al. 2019; Seiler, Tuchman, and Yao 2021; Teng et al. 2019), using various data sources (e.g., manually collected, surveys, scanner data). These studies suggest that retailers pass most of the tax on to consumers, with noticeable effects on sales; we generalize this effect by studying multiple locations and multiple time periods. Despite a rich tradition in marketing more generally of analyzing the effectiveness of promotions (Van Heerde and Neslin 2017), we find no such considerations in relation to soda taxes (cf. Zenk et al. 2020), even though they could induce considerable variation in the effect of soda taxes on prices and sales. By undertaking a concerted, systematic effort to document the various routes through which soda taxes affect sales, we seek to add to the literature by quantifying the role of the marketing conduct and assessing whether effectiveness and conduct changes go hand-in-hand.
Conceptual Foundation
Studies of the relationship between soda taxes and prices changes (e.g., Roberto et al. 2019; Seiler, Tuchman, and Yao 2021) typically analyze the degree to which managers pass the tax on to consumers (i.e., what percentage of the tax) and its effects on those consumers’ purchasing patterns. Most studies document a sizable pass-through, between 59% and 103%, resulting in significant price increases for consumers (Cawley et al. 2021) and significant drops in sales of taxed soda. Seiler, Tuchman, and Yao (2021) report a 46% reduction in volumes sold in Philadelphia; Powell and Leider (2020) find a 22% reduction in Seattle; Kim, Lee, and Gupta (2020) document a 6% reduction for Washington's short-lived soda tax; and mixed results emerge for Berkeley, including decreases ranging from 20% (Silver et al. 2017) to 9% (Taylor et al. 2019), though Rojas and Wang (2021) find no evidence of any effect. Extant research considers single locations and confounds regular price and promotional changes by assessing the price paid only, disregarding that consumers react differently to regular price and promotional price (Datta, Ailawadi, and Van Heerde 2017).
However, one can argue that retailers could offset their losses due to the price increases by other adjustments to marketing conduct by altering promotion frequency, promotion depth, and/or feature frequency (in store circulars). An exclusive focus on price changes thus may not fully reflect the response to local soda taxes and may conflate the price-related effect of soda taxes. Thus, in addition to prices, we study promotion frequency, promotion depth, and feature frequency.
Adjustments to Marketing Conduct
The nascent literature that studies the effect of exogenous shocks on consumer demand crudely falls into two categories of effects of exogenous shocks on (1) consumers’ purchasing power and (2) consumers’ preferences. 5 As the soda tax is implemented through a price increase to consumers, we focus here on consumer purchasing power. At a general level, only Lamey et al. (2012) have looked at the cyclicality of multiple marketing tools and find price promotions to decrease with economic contractions. They argue this is potentially due to retailers’ inclination to pocket a larger share of trade promotional budgets rather than passing it on to consumers.
Regarding managerial response to soda taxes as an exogenous event, in a small-scale study in Oakland, Zenk et al. (2020) investigate the effects of soda taxes on price promotions and interior and exterior advertising, using hand-collected data and in-store audits. They find diminished price promotions (though confounding the effects of promotion frequency and depth) but no change in local advertising. Despite some limitations, their findings imply that managers rely on multiple elements of marketing conduct in response to soda tax.
Managers may increase promotional activities to offset the expected sales loss due to soda tax introduction that represents an increase in price. Thus, managers may rely on the sales-enhancing effect of promotions (e.g., Van Heerde and Neslin 2017) to counter the sales-dampening effect of price increases due to soda tax. With these reductions in demand, the lift of a promotion will be lower in absolute terms, even if the promotion stays as effective in relative terms. Concurrently, fixed costs related to running a promotion (e.g., setting them up, implementing them at retailers) are likely to remain unchanged. 6 The reduced absolute lift in sales, combined with stable costs, would make running promotions less enticing.
Moreover, the promotion literature (e.g., Anderson and Fox 2019) identifies “trade spends” as another reason for reducing promotions. Typically, manufacturers budget trade spends for their UPCs that determine the amount dedicated to promotions, based on revenues from the prior year (Anderson and Fox 2019). The extent to which the trade spends pass on to consumers varies widely, with documented pass-through rates being higher in categories with higher margins and sales volumes (Ailawadi and Harlam 2009). As soda taxes lower relative retailer margins and expected revenues, retailers might try to retain more of the trade spends from manufacturers and reduce their promotion frequency or depth to protect their bottom line.
Based on this reasoning, we expect reduced promotional activities after the soda tax introduction. These reductions might take different forms, as managers work to accommodate the increased product prices, including diminished promotion frequency, promotion depth, and/or feature frequency.
Effectiveness of Marketing Conduct
We focus our literature review on findings concerning variations in price elasticity and effectiveness of promotions. Price elasticity tends to be more pronounced (more negative) during business cycle contractions (Van Heerde et al. 2013) and inflation periods (Bijmolt, Van Heerde, and Pieters 2005) but less pronounced (less negative) after a rebranding (Keller, Geyskens, and Dekimpe 2020). Next to industry-wide continuous (e.g., business cycles) and brand-specific discrete (e.g., rebranding) factors influencing price elasticity, there is some evidence that indicates price elasticity reacts to discrete, industry-wide events such as taxes. In a series of lab studies, Sussman and Olivola (2011) show that consumers are more sensitive to price increases due to a tax than to regular price increases. Studying Philadelphia's soda tax introduction, Seiler, Tuchman, and Yao (2021) find evidence for a less negative price elasticity.
Promotion effectiveness seems to vary over time (e.g., Ataman, Van Heerde, and Mela 2010) and to be sensitive to external industry events (Keller, Deleersnyder, and Gedenk 2019). We know of no studies of the effect of newly imposed taxes on promotional effectiveness. Therefore, we reason that if the average pass-through of soda taxes is between 59% and 103% (e.g., Cawley et al. 2021), the regular price of these products increases, which should influence the effectiveness of promotions for those products as well. Two streams of literature provide relevant insights. First, several studies document a negative correlation between promotion sensitivity and price points (e.g., Blattberg and Wisniewski 1989; Hökelekli, Lamey, and Verboven 2017; Lemon and Nowlis 2002), though they do not account for potential confounds due to product positioning characteristics or other correlates of pricing. Second, a microeconomic view on promotions (e.g., Varian 1980) asserts that they function to discriminate among consumers. Narasimhan (1984) uses consumers’ varying price sensitivity as a rationale for discounts offered. Moreover, Orhun and Palazzolo (2019) suggest that as liquidity constraints vary across consumers, so does the degree to which consumers can benefit from promotions. As soda tax increases the baseline price, the price paid by consumers even on a promoted product, arguably, should alter the composition of the market (e.g., price-sensitive consumers stop purchasing, the increase in price increases the severity of facing liquidity constraints) and the effectiveness of promotions due to the change in consumer composition.
Finally, we consider a more subtle potential determinant of promotional effectiveness. Promotions function as purchase reminders because features and displays help reduce consumer search costs (Mehta, Rajiv, and Srinivasan 2003) and exert influence on product and category sales (Seiler 2013). However, following the implementation of a soda tax, the promotion also might serve as a reminder of the tax itself. Consumers are generally averse to taxes, beyond just their monetary effects (Sussman and Olivola 2011), so greater awareness of the tax might diminish promotional effectiveness. Similarly, increased awareness of (sin) taxes, which are known to shape consumers’ acceptance of a consumption practice (Humphreys 2010), may influence the promotion effectiveness as consumers are known to have different promotion sensitivities for vice versus virtue foods (Wertenbroch 1998).
Research Context
Institutional Setting
We study the effects of soda taxes in five localities in the United States: Philadelphia, Oakland, Boulder, San Francisco, and Seattle. 7 Soda taxes generally reflect two main policy motivations: increased tax revenues and decreased sales and consumption of sugary beverages (Heise et al. 2016). These five localities implemented soda taxes at three different points in time: January 1, 2017 (Philadelphia), July 1, 2017 (Oakland and Boulder), and January 1, 2018 (San Francisco and Seattle). Although they all impose a distribution levy per ounce, the amounts vary: Oakland and San Francisco both levy 1¢/oz., whereas Philadelphia, Seattle, and Boulder levy 1.5¢/oz., 1.75¢/oz., and 2.0¢/oz., respectively (see Table 1). These taxes notably increase the retail prices of soda products. For example, a 67.6-oz. (2 L) bottle of a leading soda brand costs $1.60 in Philadelphia before the tax; after the tax, assuming 100% pass-through, it would have increased by $1.01 (67.6 oz. × 1.5 ¢/oz.) to $2.61, such that consumers would face a 63% price increase. The values are similar in the other four localities, and the respective taxes increase prices anywhere from 35% to more than 80%. The substantial heterogeneity in pass-through rates, across and within markets, also affects the final price that different customers encounter.
Soda Taxes in Five U.S. Localities.

For these values, we cite empirical studies that focus on regular retailers and exclude studies conducted in airports or small independent stores.
Data
We gather soda sales data from Nielsen Retail Measurement Services (RMS), provided by the Kilts Center for Marketing at University of Chicago. The RMS data include detailed information at the UPC–store–week level, including the UPC's package size and soda type (diet vs. regular), which we use to determine whether the UPC is affected by a soda tax (see also Table 1). 8 Store information includes the three-digit zip code, to link stores to various localities. 9 For every locality, we include weeks between the vote on the soda tax up to one year after the introduction. To better isolate the effects of interest and avoid potential data anomalies in the immediate aftermath of the introduction, we do not use the first three weeks (similar in nature to the “dust-settling” period used in the promotion literature; Dekimpe et al. 2008) and retain the remainder of the year (weeks 4–52) for our focal empirical analysis. We discuss our rationale for the yearly timeframe and the omission of the first three weeks in the analysis in the “Threats to Identification” section.
In addition to volume (fl. oz.), the data provide information on UPC prices and features (in weekly store circulars), which we use to construct each UPC's regular price per oz., its promotion frequency, promotion depth, and feature frequency. As is common for retail scanner data, we rely on sales data to infer UPC stocking decisions due to a lack of product availability. Similar to Hwang, Bronnenberg, and Thomadsen (2010, p. 865) we consider products, even in the absence of sales, part of the assortment unless they prompt no sales for four weeks. We retain all UPC–store pairs consistently offered in our study period and with no more than 25% of weeks without sales in the entire period) in both a taxed market and its control markets; 96% of the taxed UPCs are sold in both treated and control markets, representing >99% of all volume sales.
Descriptive Statistics
Our data cover 587 unique UPCs in the soda category, ranging from 385 UPCs in Philadelphia to 63 UPCs in Boulder (on average, 197 UPCs per locality). They belong to 167 unique brands, such as Coca-Cola, Pepsi, Red Bull, and Schweppes (range from 114 brands in Philadelphia to 32 brands in Boulder). Across all treated markets, we observe 208 stores (42 per locality), resulting in 13,690 UPC–store pairs. Notably, our data indicate substantial heterogeneity across UPCs, brands, and stores in terms of sales and marketing conduct across the five markets, both during the pretax period and after the introduction of the tax. As importantly, within UPCs, there is variation in the marketing conduct within a retailer–week across its stores of the same market. Following DellaVigna and Gentzkow (2019), we calculate for each UPC, market, and retailer the average correlation both before and after the soda tax introduction of its marketing conduct across its stores. For regular price (promotion incidence, promotion depth), we find an average correlation of .265 (.164, .310) before and .402 (.159, .348) after the soda tax introduction. That is, similar to DellaVigna and Gentzkow (2019) and Hitsch, Hortaçsu, and Lin (2021), we find some support of rigidity across stores within a market but note that local adaptations to marketing conduct are present (and relatively more prevalent than found by DellaVigna and Gentzkow [2019] and Hitsch, Hortaçsu, and Lin [2021]). Only feature promotions are set at the Nielsen designated market area (DMA) level and thus are constant across stores within a UPC–retailer week. 10 In Table 2 we present, across all UPC–store pairs, detailed information about average levels of sales and the marketing conduct variables, before and after the soda tax.
Changes in Marketing Conduct and Sales Before and After Soda Tax Introduction.

Notes: This table reports average weekly values across 13,690 UPC–store pairs (cf. 13,129 for promotion depth, because this measure is conditional on a promotion existing). Values for promotion (feature) frequency indicate the share of observations in which a promotion (feature) takes place. If a UPC–store pair's price in a given week is not observed, we use the last observed price for this pair.
In line with extant research (e.g., Cawley et al. 2021), sales volumes are substantially lower (−31%) after the introduction of the soda tax. Regular prices increased by 17%, from 8.4¢/oz. to 9.8¢/oz. At the same time, promotion frequency (−9%), promotion depth (−8%), and feature frequency (−16%) dropped sharply. However, not all UPC–store pairs reacted in the same manner: most, but not all, UPCs exhibited increased prices (95%), and a pertinent portion of UPC–store pairs increased their promotion frequency (41%), promotion depth (38%), and features frequency (28%).
Method
Our identification strategy aligns with prior investigations of soda tax introductions (e.g., Cawley et al. 2021; Seiler, Tuchman, and Yao 2021) and relies on a DID approach, which is apt for our before-and-after-with-control setting. We include the five focal markets, which experienced a soda tax introduction as treatment markets, and other markets that sell the same products in a similar environment but that did not experience a soda tax introduction as control markets (see Table 3).
Treatment and Control Groups Across Localities.
Control Markets
To identify control markets, we rely on distance-based matching (Guo and Fraser 2015), such that we pair each treated three-digit zip code with five other nonneighboring and untaxed three-digit zip codes that are in other DMAs based on sociodemographic characteristics, health orientation, and political orientation (Abadie 2005; Gill, Sridhar, and Grewal 2017). 11 , 12 Within each control market, we use the UPCs sold in the treated markets as control units. In the Appendix, we describe the matching variables and provide descriptive statistics for the sets of variables applied to the treatment and control markets. The Web Appendix (Table W1) provides a list of all control markets.
Using matched control markets that are not neighbors reduces the likelihood of treatment spillovers (i.e., violations of the stable unit treatment value assumption [SUTVA]), which can occur on both supply (coordination of marketing conduct activities across markets) and demand (cross-border shopping in adjacent markets) sides. In addition, by using control and treated markets that are similar on observable variables (i.e., demographics, health orientation, and political orientation), we can account for taste preferences at the market level, in addition to other factors that may influence the markets’ propensity to adopt a soda tax. Finally, by leveraging the same UPCs and time periods (but different markets), we ensure the comparability of the treated and control units. 13
Using geographically distant control markets with similar observables helps reduce the likelihood of violating SUTVA assumption. While our matching is based on several market characteristics (i.e., demographics, health orientation, and political orientation), our control markets may still differ in unobserved preferences for soda. As a robustness check, we consider two potential alternative approaches to the composition of the control markets: (1) geographically proximate markets and (2) synthetic controls derived from a pool of potential control markets. For the geographically proximate markets, we rely on the notion that proximate markets experience similar demand shocks and have similar unobserved preferences (e.g., Seiler, Tuchman, and Yao 2021). For example, using geographically close markets, we might account for demand shocks driven by weather patterns or sports events. With a robustness check, using indirect neighbors (neighbors’ neighbors), we assess the sensitivity of our results to the selection of control markets. For the latter alternative, we employ the recently proposed synthetic DID estimator (SynthDID; Arkhangelsky et al. 2021), which creates a synthetic control based on the pretreatment marketing conduct. Any unobservable preferences for soda that are reflected in the pretreatment marketing conduct will therefore be similar in nature between treated and controls. We note that this alternative analysis estimates treatment effects only for the outcome variable (e.g., regular price, promotion frequency) and hence is only possible for the marketing conduct analysis, rather than the variation in marketing effectiveness.
Models
Effects on marketing conduct
With a first set of models, we aim to evaluate the effect of the soda tax on each marketing conduct m (1 = regular price, 2 = promotion frequency, 3 = promotion depth, and 4 = feature frequency). For ease of interpretation, we take the natural log of regular price, whereas for promotion frequency, promotion depth, and feature frequency we use the operationalization as discussed in Table 2. Our interest is in the change in marketing conduct in a locality l, because of the tax introduction, captured by 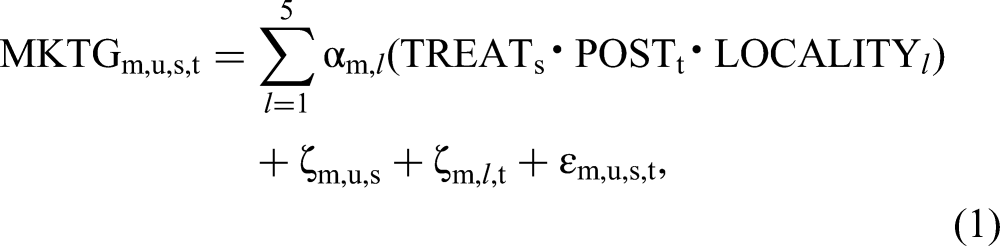
Effects on marketing effectiveness
Next, to inform our second research objective concerning the effect of soda taxes on sales and the associated effectiveness of the marketing conduct, we rely on a DID specification and compare the change in volume sales and effectiveness of the four marketing conduct variables for UPC–store pairs in taxed markets versus the same UPCs in the same period at stores in the control markets. Specifically, we are interested in the coefficients related to the interaction of the soda tax and the marketing conduct variables (
Threats to Identification
Despite careful selection of control markets that do not violate the SUTVA assumption and robustness assessment with geographic proximal markets to incorporate common demand shocks and synthetic control to account for unobservables, there are other threats to identification that require attention. The primary among these threats is the endogenous nature of marketing conduct variables. We also discuss issues that relate to (1) within-store competition and manufacturers’ pass-through, (2) time window, and (3) advertising at market and brand levels.
Endogeneity of marketing conduct variables
The marketing conduct variables
Within-store competition and manufacturers’ pass-through
The same UPC offered by multiple retailers in a market may not receive the same support in terms of shelf space or shelf positioning, due to differences in within-store competition. Similarly, it may receive attention depending on shelf crowdedness, or the number of UPCs offered by the retailer and the types of competing UPCs and brands. In addition, retailer–manufacturer power balances influence price and promotion decisions (Ailawadi et al. 2010). Soda taxes are levied at the manufacturer (and not the consumer) level, resulting in an increase in wholesale cost for a manufacturer. The manufacturers’ power may determine how much of this increase in costs are passed on to the consumer (i.e., the pass-through rate). If it is not passed on completely, their power also can determine whether retailers or manufacturers cover the remainder. Notably, for consumers and researchers, information about who covers this remaining tax is unobservable.
Because differences in within-store competition and manufacturers’ pass-through might be omitted variables that correlate with marketing conduct and sales, they might bias our estimates. We account for these omitted variables with fixed effects. That is, we use UPC–store fixed effects to subsume unobserved differences across UPCs (and manufacturers) within a store, such as those pertaining to a UPC (e.g., quality), the store (e.g., store or retailer power), and their combination (e.g., UPC's relevance to a store). However, a potential concern associated with using UPC–store fixed effects to account for within-store competition or the power dynamic is that competition may change over time. For example, a retailer may become more powerful relative to a brand manufacturer. In our setting, this risk is minimal, as our estimation period is relatively short and because we have separate UPC–store fixed effects for the pre- and postperiods. Moreover, our results remarkably stable across different time windows (up to 52 weeks postintroduction, 13 weeks postintroduction, 26 weeks postintroduction, and 39 weeks postintroduction; see the following subsection), indicating that any unobserved shifts over time are unlikely to affect our results.
Time window
We analyze the effects of a soda tax within a one-year time window while omitting the first three weeks. Two considerations drive our choice of a time frame for the analysis: (1) the implementation of the tax may come with some idiosyncratic anomalies in marketing conduct for logistical reasons and (2) managers will have had time to learn and/or strategically adjust their marketing. Indeed, a visual inspection of the parallel trend plots provided in the Web Appendix (Figures W2 and W3) indicates nontrivial deviations for promotion frequency and depth during the dust-settling period, thus suggesting our omission of those weeks. Balancing these two criteria, we set the time window to week 3 until the end of the first year. In a robustness check, we alter the window to 13, 26, and 39 weeks.
Advertising at market or brand level
We explicitly focus on store-specific marketing conduct decisions, but market- and/or brand-level decisions could covary with them and with sales, such that omitted market- and brand-level variables could bias store-specific marketing conduct decision parameter estimates. To our knowledge, no data source provides local advertising at the UPC level (or subsets) for our study context. 18 Evidence that local advertising does not change with a soda tax introduction (Zenk et al. 2020), and the size of the markets subjected to the soda tax suggests that it is unlikely to influence national advertising decisions. Still, we account for these possible influences by including brand–market fixed effects that can capture brand-idiosyncratic factors, such as advertising decisions. The UPC–market fixed effects (which are included separately for the pre- and postperiods) in our model already subsume brand fixed effects as well as potential changes from before to after the soda tax introduction. We also note the presence of advertising campaigns discouraging soda taxes, run by the American Beverage Association (Aubrey 2016; Sasko 2016). The association, which includes Coca-Cola, PepsiCo, and Keurig-Dr Pepper as members, launched several campaigns rallying against sugar taxes. Their execution occurs at the industry level, and the campaigns do not feature individual UPCs but rather aim to create antitax sentiment. As such, these campaigns should affect demand for soda in general, rather than particular brands or UPCs. To capture their effects, we include locality–week fixed effects.
Results
We first assess the validity of the parallel trends assumption and then discuss model-based results. We present the model-based results in four parts: (1) the causal effect of soda tax introductions on marketing conduct, (2) how soda taxes determine the effectiveness of the four marketing conduct variables, (3) assessments of two mechanisms for the change in marketing effectiveness, and (4) estimates of three robustness checks based on different composition of control markets and an alternative endogeneity correction for the marketing conduct variables.
Parallel Trends Assumption Validity
Our estimation approach relies on the assumption that treatment and control markets follow the same trends in the absence of soda tax introductions. To assess the validity of this assumption, we provide two separate pieces of evidence. First, in Figure W2 (Web Appendix), we present visual evidence for the evolution of sales volume and marketing conduct variables for Philadelphia and its control markets. All the graphs show similar patterns up until the introduction of the soda tax (for other localities graphs, see Web Appendix Figure W3). Second, we regress our dependent variables on trend variables (one per locality) and another variable that captures the deviation of the treated markets’ trend from that of the control markets using pretreatment data (closely following Bronnenberg, Dubé, and Sanders [2020]). To regress all the dependent variables, we use Equation 1 and replace the locality–week fixed effects by a separate time trend (i.e., variable containing the week number) for each market. Then we derive an interaction effect of the time trend with the treatment indicator. The parameter of this interaction effect indicates if the pretax trend for the treatment market deviates from the trend of the control markets, as well as the magnitude of this potential deviation. Similar to Bronnenberg, Dubé, and Sanders (2020), we find that some trend deviation parameters are statistically significant, yet they have little economic significance, particularly in contrast with the effects of the soda tax introduction. 19
Effect of Soda Taxes on Marketing Conduct
To assess the effect of the soda tax introduction on regular price, promotion frequency, promotion depth, and feature frequency, we estimate Equation 1 for each marketing conduct variable. We present the associated parameter estimates in Table 4.
Impact of Soda Tax Introduction on Marketing Conduct.

p < .10.
*p < .05.
**p < .01.
***p < .001.
We interpret the treatment effect on the logarithm of regular price as follows: A treatment effect of .275 means that the effect on the regular price is 31.69% (e.275 − 1). The other dependent variables are not log-transformed, so the parameter estimates represent the marginal effect.
Notes: Observations include 4th to 52nd week after the soda tax introduction. Standard errors are clustered by UPC–store pair and displayed in parentheses. (Clusters at higher level of aggregation than UPC–store [viz., UPC–retailer, store, brand–store] result in comparable standard errors.) Number of observations is lower for promotion depth, because this measure is conditional on the presence of a promotion.
Regular price and pass-through rates
Across localities, regular prices increase substantially, by an average of around 23%. For the regular price in Seattle, subject to a 1.75¢/oz. tax, we find the smallest price increase of 18.28% (
In addition to the relative changes in regular prices, we compute the share of the soda tax passed on to consumers in each locality, pass-through rate (
Pass-Through Rates and Relative Changes in Marketing Conduct.
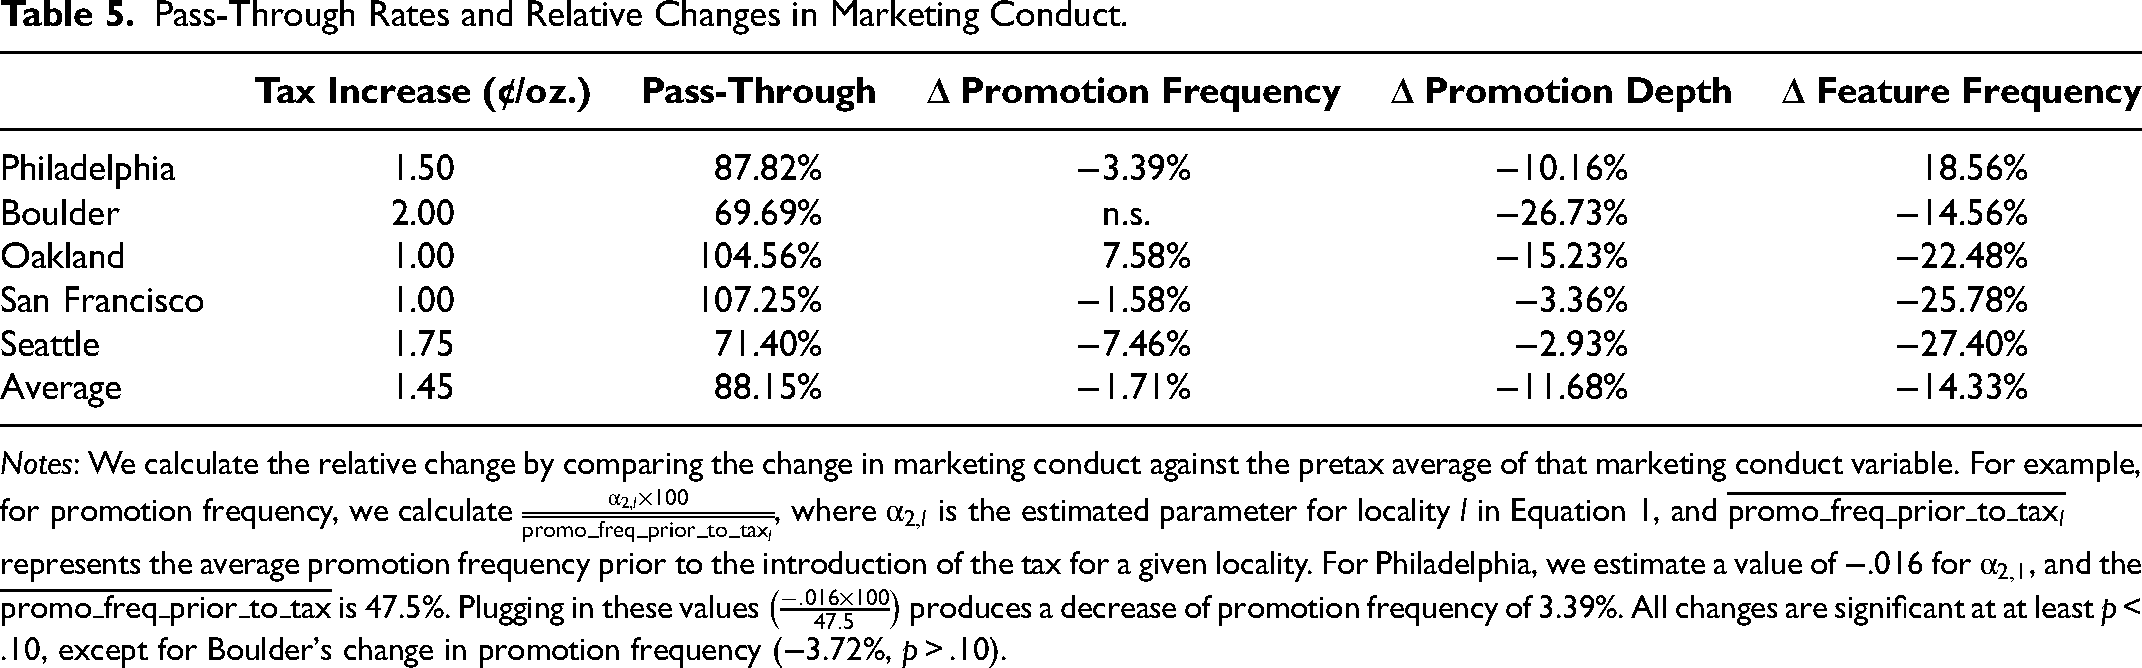
Notes: We calculate the relative change by comparing the change in marketing conduct against the pretax average of that marketing conduct variable. For example, for promotion frequency, we calculate
In Seattle, we find a pass-through rate of 71.40% (
Promotion frequency
We find a decrease in promotion frequency (of −2%, on average, across all localities) and individually for four out of five localities (all except for Oakland), whereas for one of the smaller locality (Boulder, −3.7%) we do not find any statistical evidence of a change. To unravel heterogeneity in this effect, we present all relative changes for each locality (and each marketing conduct variable) in Table 5. To calculate the effect for Seattle, for example, we compare the change (α2,5 = −.040, p < .001; or −7.46%) against the average promotion frequency before the soda tax introduction in Seattle, which was 53.4%. Therefore, the change amounts to a 7.46% decrease (= −4.0/53.4, see notes to Table 5 for details). San Francisco, Philadelphia, and Boulder similarly show reduced promotion frequencies, ranging between 1.6% and 3.4%: San Francisco (α2,4 = −.008, p < .10; −.8/48.71% = −1.6%), Philadelphia (α2,1 = −.016, p < .001; −1.6/47.51% = −3.4%), and Boulder (α2,2 = −.018, p > .10; −1.8/47.68% = −3.72%), whereas for Oakland (α2,3 = .018, p < .10; 1.8/23.17% = 7.58%) the effect is positive but had a far lower baseline before the soda tax.
Promotion depth
The magnitude of promotion depth, conditional on a promotion occurring, decreases substantially after the tax introduction for all localities. Across localities, we observe the strongest decrease in Boulder, with a 3.9% percentage point reduction (α3,2 = −.039, p < .001) in average promotion depth, representing a 26.7% drop compared with the average promotion depth of 14.50% before the tax (3.9%/14.50% = 26.7%); this is followed by Oakland and Philadelphia with a 15.23% (α3,3 = −.027, p < .001; −2.7%/17.5% = −15.23%) and 10.16% (α3,1 = −.012, p < .001; −1.2%/12.05% = −3.36%) reduction in promotion depth, respectively. We find slightly lower average relative reductions, around 2.9%, in Seattle (α3,5 = −.004, p < .001; −.4%/14.90% = −2.9%) and 3.4% in San Francisco (α3,4 = −.005, p < .01; −.5%/14.71% = −3.36%).
Feature frequency
The appearance of soda UPCs in store circulars decreases by 14% after the soda tax introduction. In Seattle, we observe a drop of more than 5.8 percentage points (α4,5 = −.058, p < .001), reflecting a 27.4% relative reduction compared with the pretax average frequency of 21.25% (−5.8%/21.25% = −27.4%). San Francisco's, Oakland's, and Boulder's reductions are at 25.78% (α4,4 = −.043, p < .001; −4.3%/16.67% = −25.78%), 22.48% (α4,3 = −.027, p < .001; −2.9%/11.86% = −22.48%), and 14.56% (α4,2 = −.024, p < .05; −2.4%/16.76% = −14.56%), respectively. In Philadelphia, we observe an increase (α4,1 = .018, p < .001; 1.82%/9.80% = 18.56%) in feature frequency after the soda tax introduction. Notably, Philadelphia is the only market that taxed both diet and regular sodas. Thus, retail managers could not simply substitute taxed, sugary sodas with diet sodas in their store circulars. 20
In summary, we find substantial, consistent reductions in promotion frequency, promotion depth, and feature frequency, in support of the contention that managers respond to external events (Cleeren, Van Heerde, and Dekimpe 2013) and set marketing conduct levels based on expected sales levels or products’ gross margins, both of which likely decrease due to soda taxes.
Marketing Conduct Effectiveness
In Table 6, we present the parameter estimates from Equation 2 that we use to examine changes in marketing conduct effectiveness after the soda tax introduction.
Impact of Soda Tax Introduction on Marketing Conduct Effectiveness.

p < .10.
* p < .05.
** p < .01.
*** p < .001.
Notes: Observations include the 4th to 52nd week after the soda tax introduction. Standard errors are clustered by UPC–store pair.
Change in marketing conduct effectiveness
The parameters exhibit face validity. Regular price has an elasticity of −1.023 (p < .001), in line with meta-analytic findings related to price elasticities (Bijmolt, Van Heerde, and Pieters 2005). The parameters of promotion depth (θ3 = 1.676, p < .001), promotion frequency (θ2 = .190, p < .001), and feature (θ4= .419, p < .001) in the soda category also are in line with extant research (e.g., Datta, Ailawadi, and Van Heerde 2017; Web Appendix E).
In turn, we observe both economically and statistically substantive changes in marketing conduct effectiveness with the introduction of a soda tax. First, our key parameter of interest indicates that regular price elasticity declines (β1 = .311, p < .001). This reduction represents a change of 39.02% compared with what the elasticity would be without the soda tax introduction (θ1 + δ1 + γ1 = −.797, p < .01). Put differently, consumers react substantially less to regular price changes after the substantial price increase following a soda tax introduction, potentially because only less price-sensitive consumers remain in the market or because of a changed responsiveness to regular price changes. Second, promotion frequency effectiveness increases by 13.70% due to the soda tax (β3 = .031, p < .001), compared with what it would be without the tax (θ3 + δ3 + γ3 = .224, p < .001), in line with the notion that consumers shift their purchases from regular prices toward promotions to counteract steep (regular) price increases due to the soda tax. Third, conditional on a promotion, steeper discounts typically improve sales (θ2 + δ2 + γ2 = 1.000, p < .001), but due to the soda tax, they are less effective (β2 = −.301, p < .001), with a 30.07% reduction (.301/1.000). That is, consumers continue to show an interest in soda promotions, presumably due to the higher price level overall (in line with current marketing literature), but if a promotion is supposed to elicit the same sales response, ceteris paribus, as before the soda tax introduction, it will need to be deeper given that consumers are less responsive to it after the introduction. Fourth, feature promotions typically increase sales (θ4 + δ4 + γ4 = .248, p < .001), but this effect also decreases substantially (β4 = −.043, p < .001), amounting to −17.43% (−.043/.248) after the soda tax introductions.
Mechanisms for Change in Marketing Effectiveness
We consider two plausible mechanisms that may be of relevance in driving the change in marketing effectiveness. First, households may have updated their preferences and subsequent soda-shopping behavior as a result of either the signal that a soda tax sends and/or a base price increase. Put differently, households may all have shifted in their sensitivity to marketing conduct. We label this first mechanism “within-household changes.” Second, the changed promotion effectiveness may be driven by changes in aggregate demand because the composition of households that purchase soda has changed. This scenario suggests that subsets of households may decide to buy less (or not at all) and/or frequent other markets (as found in Seiler, Tuchman, and Yao 2021) because of the introduction of a soda tax. To concretize the second mechanism, we rely on game-theoretic work on promotions that suggest the existence of segments based on different degrees of price sensitivity (e.g., Narasimhan 1984). If the more price-sensitive segments lower the frequency with which they purchase soda (or drop out of the category altogether), we should observe changes in aggregate effectiveness. We label this second mechanism “household composition changes.”
To provide some insights into the presence of within household changes and household composition changes, we conduct an analysis using the household panel (HMS) provided by Nielsen. Similar to our main analysis, we use a DID framework with households from the same treatment and control markets and analyze if their shopping behavior changes. More specifically, we analyze three dimensions that characterize a household soda purchasing behavior in using a 13-week pre- and 52-week postwindow around the treatment (13 pre, 52 post). These three dimensions are (1) trips during which soda is purchased, (2) the units of soda purchased, and (3) the volume purchased. Jointly, this set of variables allows us to detect changes in frequency and volumes of purchases due to the soda tax. If this effect varies across households (i.e., affects certain segments more than others), it implies that the household composition will be affected. We proceed in two steps: we first establish whether the soda tax affects household soda purchasing behavior and then supplement this model by interacting the treatment effect with other household characteristics that proxy for segment membership (as in Narasimhan [1984]).
We present our empirical approach to test these mechanisms in the Web Appendix, along with the estimation results in Table W3. We find that the introduction of the soda tax influences a household’s soda purchasing behavior. The effects on trips (β1 = −.016) and volume purchased (β1 = −1.376) are significant at p < .01, whereas the effect of the tax on the units purchased (β1 = −.070, p < .10) is only marginally significant. In the models that interact household characteristics with the introduction of a soda tax, we observe virtually identical main effects: we detect no significant interaction of the treatment effect with household income, household size, and female head education, and only observe statistically significant interactions (p < . 05) of the introduction of the tax with one factor, “female head of household age” (DV = volume purchased, β5 = −.335, p < .05, DV = units purchased, β5 = −.033, p < .01). This suggests that the effects we observe are not correlated strongly with many customer segment indicators. While we cannot rule out the possibility that there are other proxies that would correlate with customer segments, we tentatively conclude that the change in marketing conduct effectiveness tends to be driven more by within-household changes rather than household composition changes. However, we acknowledge that the sparseness of the household level data in these treated localities may interfere with our ability to detect changes. While we have used as many households as possible across all five localities, richer data, ideally covering more households in treated localities, could allow us to estimate household-specific price sensitivities. We are not aware of such data sources but are hopeful that future research will shed more light on this question.
Robustness Checks
We assess the robustness of our findings to our selection of control markets and our efforts to account for the endogenous nature of the marketing conduct variables. In our main model, we use the same UPCs in matched markets, similar in their infrastructure, consumer composition, and health and political orientations but geographically distant. In a first robustness check we replace these control markets with geographically close markets, where we use the same UPCs offered by the same retailers as control units. In a second robustness check, we use the SynthDID estimator (Arkhangelsky et al. 2021) that creates a synthetic control. We discuss the results and present the parameter estimates for these two robustness tests in Tables W6–W10 in the Web Appendix but note that our key insights remain the same with both robustness checks.
Second, we employ suitable set of fixed effects to correct for the potential endogeneity of the marketing conduct variables in our main analysis. We conduct a robustness check in which we supplement Equation 2 using a control function approach and use instruments for marketing conduct. We discuss our approach in the Web Appendix and find that our findings are virtually identical to those of the focal model (see Table W5 in the Web Appendix).
Discussion
With increasing adoption of soda taxes across cities, counties, and countries, research into their effects has focused predominately on sales, consumption, and prices in a single setting. We build on this research by studying marketing conduct variables besides price and using the same research protocol to study Philadelphia, Boulder, Oakland, San Francisco, and Seattle. In addition to examining the implication of soda taxes for consumer demand, we model changes to supply-side decisions (i.e., regular price, promotion frequency, promotion depth, and feature frequency).
Assessing the Evolution of the Effect of a Soda Tax
Our analysis relies on a one-year postintroduction analysis period in which we dropped the first three weeks to allow for a dust-settling period (Dekimpe et al. 2008). To gain additional insights into how these effects unfold, we assess them over shorter time windows. Thus, we reestimate Equations 1 and 2 three times, using up to 13, 26, and 39 weeks after the soda tax introduction (where we again omit the first three weeks). We present the detailed results in the Web Appendix and discuss the key results here. As Tables W11–19 in the Web Appendix show, the results are similar across marketing conduct variables to our focal results. See the Web Appendix (p. W18) for a detailed discussion about the similarity of the results.
Contributions to Soda Tax Research
Our findings replicate the results of prior studies that address the changes in regular prices due to soda taxes and offers novel insights along two dimensions. First, using the same research protocol across the five cases, we establish the face validity of our findings, which are comparable to evidence in prior literature, and the consistency of the results across localities (Figure 1). As such, we rule out the possibility that the research protocol drives variations in pass-through rates.

Comparison of Pass-Through Rates Across Localities.
Second, we provide comprehensive evidence of how soda taxes exert influences beyond prices, by identifying the impacts on promotion depth, promotion frequency, and feature frequency. Across five localities, we find consistent decreases in promotion depth (−12%), promotion frequency (−2%), and feature frequency (−14%), which is similar to prior findings on promotion pass-through rates (e.g., Ailawadi and Harlam 2009) that suggest that expected sales determine promotion funding. Thus, in addition to the well-documented reduction in sales due to price increases imposed by soda taxes, we also see reductions in promotional funding. Therefore, it becomes important to study the effect of promotional tools besides price while accessing the impact of soda taxes on sales.
To assess how relevant promotional conduct adjustments are relative to regular price changes, we calculate the expected sales change due to the conduct adjustments separately for regular price and each promotional tool. Specifically, we multiply the effectiveness of marketing conduct m (βm + γm + δm + θm, Equation 2) by the change in the conduct due to the soda tax (αm,1, Equation 1). Across localities, the most important driver of sales changes is indeed the increase in regular price (soda tax's price increase). However, reductions in the promotional conduct substantially exacerbate the sales reduction and account for 18% of the reduction through marketing conduct changes (promotion frequency −2.9%, promotional depth −10.0%, and feature frequency 5.3%). This underscores the importance of hitherto disregarded reductions in promotional efforts in assessing soda tax's effects on sales.
Contributions to Marketing Conduct and Effectiveness Literature
The consistent, sizable changes in marketing conduct (reduction in all marketing conduct variables and less than complete pass-through of regular prices) contrast with the more nuanced changes that we find in terms of marketing conduct effectiveness. The baseline (i.e., pretax) marketing conduct effectiveness estimates match prior findings (see, e.g., Datta, Ailawadi, and Van Heerde 2017), but we find reduced effectiveness of promotion depth and feature frequency, along with increased effectiveness of promotion frequency and regular price increases. To dig deeper, we assess whether these changes in marketing effectiveness may be driven by changes in individual households’ sensitivity (within-household change over time) or a change in which (types of) households purchase soda (household composition change). Analyses of household-level data suggest the presence of a within-household change, rather than a change in household composition, where consumers with different levels of sensitivity toward marketing conduct drop out of (or remain in) the market.
These nuanced findings help explain the outcomes of potentially ineffective practices in which managers do not adjust their marketing conduct according to the effectiveness of the marketing conduct variables. Reducing promotional depth and feature frequency seems appropriate, considering their diminished effectiveness. However, average promotion frequency decreases, even as its effectiveness increases by 14%. Similarly, regular prices increase by less than the amount of the tax (representing an effective price decrease after the tax), even though price elasticity declines (i.e., moves close to zero). This finding contributes to nascent literature that indicates that marketing conduct effectiveness and marketing conduct decisions do not always go hand in hand (Chevalier, Kashyap, and Rossi 2003; Gijsenberg 2014; Keller, Geyskens, and Dekimpe 2020).
Policy and Managerial Implications
Our study offers insights that inform both policy and retail and brand managers. However, before we delve into these implications, it is important to recognize that they are derived from DID and SynthDID analyses (i.e., descriptive causal models). Perhaps stronger implications would result from an equilibrium model with consumers, retailers, and brand managers as strategic actors. We examine varying time windows for 13 to 39 weeks and find consistent results, which seems to suggest the possibility of an equilibrium generating the results. Nonetheless, it is important to recognize that we present descriptive causal models, and limitations of this approach do apply. Studies that directly model equilibrium are a potential future research avenue. Thus, our findings should be viewed with caution on this front, as we model a composite of retailers and brand managers.
From a policy perspective, we affirm evidence (e.g., Cawley et al. 2021; Seiler, Tuchman, and Yao 2021) that soda taxes can reduce soda sales and, presumably, consumption. Importantly, our study highlights the need for policy makers to not only assess the direct effects of soda taxes but also understand the indirect effect that emanates due to supply side changes in the retailing industry. Such indirect effects negatively contribute to the already negative effect of soda taxes on soda sales.
For managers, our study helps clarify changes to effectiveness of the marketing conduct variables. First, increasing regular prices by the full amount of a soda tax (or even more) may be justified because regular price elasticity declines substantially, so managers can expect less pronounced consumer reactions to price increases. Second, a soda tax necessitates some substantial revisions to the design of promotional efforts. It appears worthwhile to increase the number of offered promotions, for which effectiveness increases by more than 10%. Yet managers may not offer the same promotions, such that they can be more conservative with their promotion depth and using features, due to the reduced (but still positive) effectiveness of the latter two marketing conduct instruments. Table 7 summarizes our findings and implications for each aspect of the marketing conduct.
Overview of Findings and Implications of Soda Tax Introductions.

Limitations and Further Research
We close by noting some limitations of our study, which provide fruitful avenues for further research. Our study is the first to use the same data source and model specification across five separate soda tax introductions, and it produces remarkably consistent effects. Yet we cannot assess whether this consistency holds across brands, retailers, and individual products. For example, does marketing conduct effectiveness vary with brand size and visibility? Do all retailers need to reconsider their marketing conduct efforts in the same way? Do soda tax introductions affect more expensive UPCs in the same fashion as cheaper UPCs (i.e., for which the relative price increase is more substantial)? 21
We investigate five localities that differ in their tax amount (ranging from 1¢/oz. to 2¢/oz.) and characteristics (e.g., Philadelphia has more than 1.5 million inhabitants, Boulder has around 100,000), but all of them are cities located in the United States. Many other countries have introduced soda taxes (e.g., Mexico, France, Saudi Arabia), so it is incumbent on researchers to determine to what extent cultural differences affect the outcomes of a soda tax introduction.
Our empirical approach is built on a DID framework within the wider paradigm of descriptive causal models. We also assesses robustness using SynthDID (Arkhangelsky et al. 2021). However, we do treat retailer and brand manager as a unitary actor and consumers as nonstrategic. As we mention earlier, equilibrium models could relax these assumptions, and provide avenues for further exploration.
Unlike other categories, the soda category is characterized by a limited presence of private labels. As the pass-through of any (soda) tax can be contingent on the manufacturer's power relationship with the retailer, one might expect differential results for private labels relative to national brands. In our sample, private labels have a limited market share of <1%, limiting their influence on our results. We leave it for future research to extend this analysis to other categories with a higher prevalence of private labels.
Finally, we acknowledge that marketing conduct can be rigid across markets (DellaVigna and Gentzkow 2019; Hitsch, Hortaçsu, and Lin 2021). If the marketing conduct in our setting has been set for a treated market and another market simultaneously, the estimated parameters of the soda tax's effect on marketing conduct may be conservative. This may particularly be the case for feature changes (which may be set over larger areas) when using indirect neighbors rather than geographically distant control markets with similar observables. In our data, using the same approach as DellaVigna and Gentzkow (2019), we observe sufficient local adjustments to marketing conduct to expect treated markets to be able to adjust their marketing conduct without having to take unaffected markets into account. We thus hope our study proves useful in managing the consequences of soda tax introductions and stimulates further research in the increasingly important intersection of marketing and public policy.
Supplemental Material
sj-pdf-1-mrj-10.1177_00222437231195551 - Supplemental material for Soda Taxes and Marketing Conduct
Supplemental material, sj-pdf-1-mrj-10.1177_00222437231195551 for Soda Taxes and Marketing Conduct by Kristopher O. Keller, Jonne Y. Guyt and Rajdeep Grewal in Journal of Marketing Research
Footnotes
Appendix: Control Markets Selection and Characteristics
To select controls markets, we conduct distance-based matching (Guo and Fraser 2015, p. 177) and pair treated three-digit zip codes with other nonneighboring and nontaxed three-digit zip codes in the United States, based on sociodemographic characteristics, health orientation, and political orientation. We use population size, median household income, median home value, number of housing units, land area in square miles, the share of democratic voters, fast-food outlets per 1,000 capita, gyms per 1,000 capita, and the number soda manufacturers per 1,000 capita to calculate the Euclidean distance among markets. In Table A1, we present, for each characteristic, the average value across three sets of markets: treated, potential control, and matched control. Treated markets differ substantially from potential control markets before matching, but this difference diminishes drastically and becomes statistically nonsignificant after matching.
Acknowledgments
The authors acknowledge the Kilts Center for Marketing at the University of Chicago Booth School of Business for providing access to the Nielsen RMS data. Researchers’ own analyses were calculated (or derived) based in part on data from Nielsen Consumer LLC and marketing databases provided through the NielsenIQ Datasets at the Kilts Center for Marketing Data Center at The University of Chicago Booth School of Business. The conclusions drawn from the NielsenIQ data are those of the researchers and do not reflect the views of NielsenIQ. NielsenIQ is not responsible for, had no role in, and was not involved in analyzing and preparing the results reported herein. The authors thank Els Gijsbrechts, Shyam Gopinath, Adithya Pattabhiramaiah, Kapil Tuli, and Venkatesh Shankar for helpful comments on a previous version of the article.
Coeditor
Sachin Gupta
Associate Editor
Vrinda Kadiyali
Declaration of Conflicting Interests
The authors declared no potential conflicts of interest with respect to the research, authorship, and/or publication of this article.
Funding
The authors received no financial support for the research, authorship, and/or publication of this article.
Notes
References
Supplementary Material
Please find the following supplemental material available below.
For Open Access articles published under a Creative Commons License, all supplemental material carries the same license as the article it is associated with.
For non-Open Access articles published, all supplemental material carries a non-exclusive license, and permission requests for re-use of supplemental material or any part of supplemental material shall be sent directly to the copyright owner as specified in the copyright notice associated with the article.