
Abstract
It is common in moderation analysis that at least one of the target moderation variables is latent and measured with measurement error. This article compares six methods for latent moderation analysis: multigroup, means, corrected means, factor scores, product indicators, and latent product. It reviews their use in marketing research, describes their assumptions, and compares their performance with Monte Carlo simulations. Several recommendations follow from the results. First, although the means method is the most frequently used method in the review (95% of articles), it should only be used when reliabilities of the moderation variables are close to 1, which is rare. Then, all methods except the multigroup method perform similarly well. Second, the results support using the factor scores method and latent product method when reliabilities are smaller than 1. These methods perform best with parameter and standard error bias less than or equal to 5% under most investigated conditions. Third, specific settings can warrant using the multigroup method (if the moderator is discrete), the corrected means method (if moderation variables are single indicators), and the product indicators method (if indicators are nonnormally distributed). Practical guidelines and sample code for four statistical platforms (SPSS, Stata, R, and Mplus) are provided.
Investigating the boundary conditions of a phenomenon is central to academic research and crucial for decision makers. In marketing, it commonly involves a latent moderation analysis in which at least one of the target moderation variables is latent and is measured by one or more reflective indicators. Recent examples include Auh et al. (2019), who showed that customer orientation dampens the effect of customer participation on satisfaction (all three variables are latent). Another example is a study by Atasoy and Morewedge (2017) that found greater differences in (latent) perceptions of psychological ownership between physical and digital books (manipulated) when consumers had a stronger need for control (latent trait).
This article focuses on latent moderation analysis and compares six main methods that differ in their approach and assumptions: the multigroup, means, corrected means, factor scores, product indicators, and latent product methods. Table 1 summarizes a literature review of the 1,381 articles published in Journal of Marketing Research, Journal of Marketing, Journal of Consumer Research, and Marketing Science between 2015 and 2020. It shows that the moderation methods have not been equally popular. Among 885 estimated moderation effects in 213 articles, 95% of articles used the means method.
Summary of Literature Review.

Notes: Literature review of moderation analyses in the 2015–2020 volumes of Journal of Marketing Research, Journal of Marketing, Journal of Consumer Research, and Marketing Science. Percentages do not sum to 100% because of rounding and use of multiple methods within an article. Effect sizes are correlations. Effect sizes and correlations are reported as mean and standard deviation (SD), and number of indicators and scale points have modes and SD. Dropping one study with extreme sample sizes (|Z-score| > 3.33) results in a median sample size of 215 (SD = 55,647). For details, see Web Appendix A.
The means method takes unit-weighted mean scores of the indicators without accounting for the remaining measurement error in the scores. Measurement error is the difference between observed and true values of a score (Wooldridge 2015, p. 288). Its magnitude is determined as 1 minus the score's reliability, which is the proportion of systematic variance in the score with respect to its total variance (Bollen 1989, p. 156). It is known that not accounting for measurement error can severely bias estimates and/or standard errors (Bollen 1989; Cohen et al. 2003; Grewal, Cote, and Baumgartner 2004; Spearman 1904; Wooldridge 2015). Bias is the difference between estimated and true values of a parameter or its standard error (Wooldridge 2015). Thus, the popularity of the means method is in stark contrast with its reported poor statistical properties in the face of measurement error.
Nevertheless, multiple reasons can explain the common use of the means method. First, reliabilities of measures in the literature are high (a mean of .87 in Table 1). However, as Grewal, Cote, and Baumgartner (2004, p. 528) conclude, “Even when reliability is fairly high by conventional standards, measurement error can be damaging.” One may also overlook that measurement error becomes more severe in latent moderation settings because the reliability of an interaction term is usually lower than the reliability of its components (Busemeyer and Jones 1983; McClelland et al. 2017). Second, researchers might believe that ignoring measurement error leads to underestimated moderation effects and that the means method would therefore be a conservative estimator. However, this is only the case for regressions with a single predictor, in which not accounting for measurement error would bias parameter estimates to zero (Bollen 1989; Cohen et al. 2003; Grewal, Cote, and Baumgartner 2004; Spearman 1904; Wooldridge 2015). The direction and magnitude of bias in models with multiple predictors, even if some are with and some are without measurement error, are more difficult to predict (Bollen 1989; Cohen et al. 2003; Wooldridge 2015). Third, the lack of a comprehensive performance assessment of the six main latent moderation methods hinders an informed use of these methods. This last point motivated this research.
Our objective is to compare the six methods for latent moderation analysis, both theoretically and empirically, and to provide recommendations for their use. First, we describe the six methods and their differences. Second, we use eight Monte Carlo simulation studies to investigate the statistical properties of the methods under a variety of conditions and in terms of four performance criteria (parameter bias, standard error bias, root mean square error [RMSE], and power). The simulations manipulate, respectively, reliability of the measures (Study 1), scale of the indicators (Studies 2a and 2b), correlation between the latent moderation variables (Study 2c), factor loadings (Study 3), and indicator distributions (Study 4a). They show that some methods, specifically the factor scores method and the latent product method, outperform the others. In addition, the simulations examine the effects of misspecification, specifically correlated measurement errors (Study 4b) and ignoring U-shaped (polynomial) effects of the latent variables (Study 4c), and all methods perform worse there. Third, we provide recommendations for future use of the methods and make sample code available for four statistical platforms (SPSS, Stata, R, and Mplus) to implement the methods.
This article makes several recommendations for latent moderation analysis. First, when the reliabilities of the moderation variables are close to 1, five of the six methods perform well; thus the choice of method is at the researcher's discretion. The corrected means, factor scores, product indicators, and latent product methods have parameter bias under 2% and standard error bias under 5% when the reliability of Y, X, and Z is high at .95 (Study 1). Under these conditions, the parameter bias of the means method is a slightly higher 8% (and standard error bias is 3%), less than the 10% that is considered acceptable (Feingold 2019; Muthén and Muthén 2002). In contrast, the multigroup method has an estimated bias higher than 20% and should be avoided when moderators have continuous indicators.
Second, our results support the use of the factor scores method and the latent product method in situations where reliabilities of the moderation variables are lower than 1. Both methods perform equally well under most investigated conditions, with bias levels lower than 5%. This is the case when reliabilities are between .75 and .95 (Study 1); for seven-, five-, and three-point categorical indicators (Study 2a); when correlations of X with Z range between 0 and .60 (Study 2c); and when indicator loadings are unequal (Study 3). Researchers might base their choice of either method on the availability in their preferred statistical software.
Third, we identify specific settings for which the multigroup method and the product indicators method can be reserved. The multigroup method can be used for a discrete moderator, although the corrected means, factor scores, product indicators, and latent product methods also perform well with biases under 5% (Study 2b). The product indicators method might be chosen over the other methods for nonnormally distributed indicators (parameter bias of 5% if skewness of the moderation variables is 3 and excess kurtosis is 10, at a sample size of 200). Yet, its standard error bias can harm statistical conclusion validity (Study 4a).
Web Appendix B provides an overview of sample code to implement the methods in SPSS, Stata, R, and Mplus, available at an OSF repository (https://osf.io/py7jx/).
Latent Moderation Analysis
Moderation Framework
Assume the following structural latent moderation model:
The parameters of the latent moderation model cannot be estimated directly because the true scores of Y, X, and Z are latent and are reflected in one or more indicator variables that contain measurement error. For exposition, this article focuses on three indicators per latent variable, the mode in the literature review (Table 1). We consider both continuous and ordered categorical indicators (e.g., Likert scales). The measurement model for X (and analogous for Z and Y) is
Definitions of Key Concepts and Method Performance Criteria
This article focuses on three key concepts: latent moderation analysis, measurement error, and reliability, defined in Table 2, Panel A. In addition, Table 2, Panel B, defines four focal performance criteria to compare the methods for latent moderation analysis: parameter bias, standard error bias, RMSE, and power/Type I error. Each reflects a statistical property of the estimators that might be affected by measurement error and might vary across methods. This article mainly focuses on the performance criteria with respect to the moderation effect because it leads in determining the presence of moderation, but we also consider the main effects because the moderation type (i.e., crossing or not) depends on the sign, size, and significance of the moderation and main effects parameters (Cohen et al. 2003).
Overview of Key Concepts and Method Performance Criteria.

Notes:
Parameter bias
Measurement error can bias moderation and main effects. Unbiased estimates are crucial measures of scientific knowledge and might inform the managerial relevance of effects (Eisend 2015). If Y, X, and Z are manifest (and X and Z are normally distributed and uncorrelated), the true moderation effect (Cohen et al. 2003) is


Bias due to measurement error is not specific to latent moderation analysis. Yet it can be more severe in this setting because product terms typically have a lower reliability than their components.
1
The reliability of a product of 
Standard error bias
Measurement error can also bias standard errors (Bollen 1989; Cohen et al. 2003; Van Smeden, Lash, and Groenwold 2019; Wooldridge 2015). Unbiased standard errors are crucial for valid moderation tests and a valid assessment of the uncertainty of moderation estimates more generally. Note that correcting for measurement error increases standard errors, even if they are unbiased. For correlations, a reasonable approximation for the standard error increase due to the correction is the magnitude by which the correlation is biased downward due to measurement error (Hunter and Schmidt 2004, p. 96). However, standard errors are complex functions of the model, the size of the effect, the sample size, the measure reliabilities, and correlations among predictors (Charles 2005; Yuan, Cheng, and Zhang 2010).
Root mean square error
The RMSE is based on the sum of the squared bias and the variance of a parameter. It summarizes parameter recovery (lower is better). It can also be used to choose between unbiased estimators. The method with the lowest RMSE (i.e., lowest parameter uncertainty) among unbiased estimators is preferred. Accounting for measurement error decreases parameter bias and thus decreases RMSE. At the same time, the measurement error correction might increase the RMSE due to the larger standard error. The net effect on RMSE is difficult to predict.
Power and Type I error
Power and Type I error are the probability that a parameter of interest is found to be statistically significant (Cohen 1988, p. 1). High power is crucial to find effects if they truly are nonzero. Measurement error decreases power and thus increases required sample sizes (Grewal, Cote, and Baumgartner 2004). If the true parameter is zero, the analogue to power is Type I error. Minimizing it prevents false positive results. Power and RMSE complement each other. For instance, a high upward parameter bias can lead to a high power, but RMSE would detect that the estimator is problematic. Among unbiased methods, both RMSE and power should provide qualitatively similar results.
Six Methods for Latent Moderation Analysis
Figure 1 visualizes the six methods for latent moderation analysis and provides model equations. Table 3 summarizes the assumptions of the methods.

Method visualizations and model equations.
Overview of Method Assumptions.
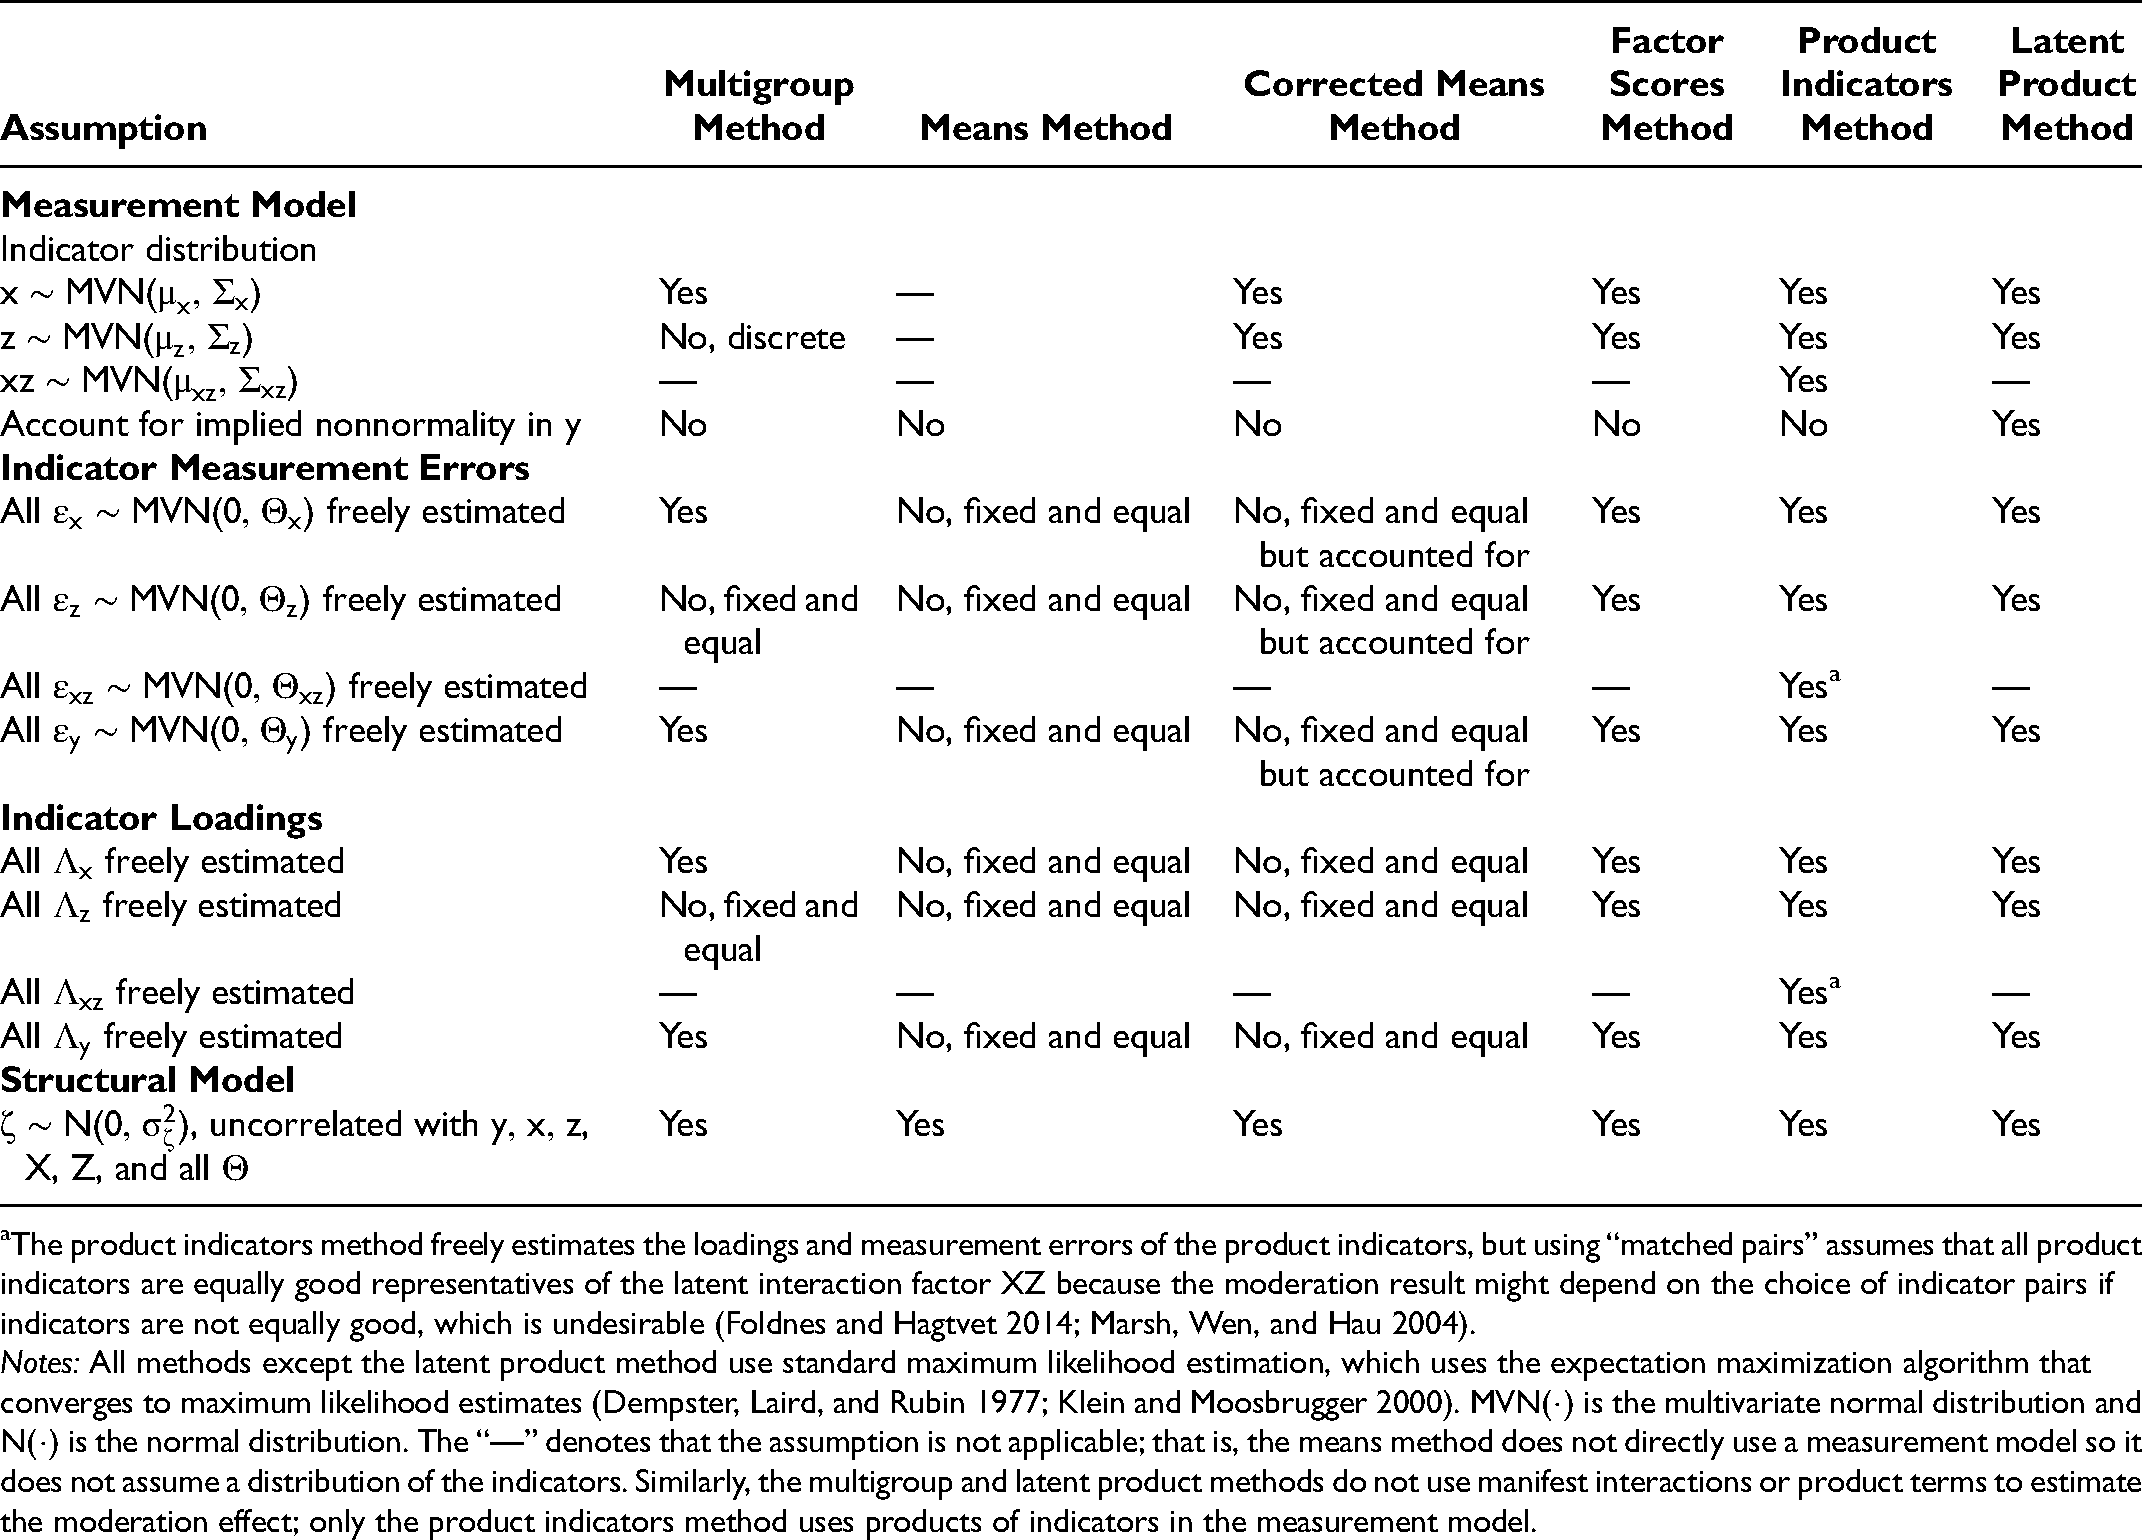
The product indicators method freely estimates the loadings and measurement errors of the product indicators, but using “matched pairs” assumes that all product indicators are equally good representatives of the latent interaction factor XZ because the moderation result might depend on the choice of indicator pairs if indicators are not equally good, which is undesirable (Foldnes and Hagtvet 2014; Marsh, Wen, and Hau 2004).
Notes: All methods except the latent product method use standard maximum likelihood estimation, which uses the expectation maximization algorithm that converges to maximum likelihood estimates (Dempster, Laird, and Rubin 1977; Klein and Moosbrugger 2000). MVN(·) is the multivariate normal distribution and N(·) is the normal distribution. The “—” denotes that the assumption is not applicable; that is, the means method does not directly use a measurement model so it does not assume a distribution of the indicators. Similarly, the multigroup and latent product methods do not use manifest interactions or product terms to estimate the moderation effect; only the product indicators method uses products of indicators in the measurement model.
Method 1: Multigroup
This method estimates separate models for discrete subgroups based on the moderator. We focus on two groups for exposition and because the use of two groups is common in moderation analyses (37% of moderation variables in the literature review). The structural model for each group g is
Method 2: Means
This method uses unit-weighted mean (or sum) scores of the indicators. Although mean scores can be used without estimating a measurement model, McNeish and Wolf (2020) show that unit-weighted means are analogous to assuming a parallel measurement model that constrains indicators to be equally weighted with equal measurement error variances. The structural model then uses the mean scores to estimate the moderation effect without accounting for measurement error in the mean scores:
Method 3: Corrected Means
This method uses a product of mean scores, as the means method does, but corrects for measurement error in the scores by using reliability estimates. A measurement model as in Equation 2 can be used but with loadings and measurement errors fixed for identification (Bollen 1989). For example, for XZ, the loading is
Method 4: Factor Scores
This method uses factor scores that estimate the latent variable scores with linear combinations of the indicators. The first step extracts factor scores from measurement models as in Equation 2 that freely estimate measurement errors and loadings. The second step regresses factor scores of Y on those of X, Z, and the product:


There are several ways to specify the measurement models. Measurement models for Y, X, and Z can be estimated jointly or separately with confirmatory factor analysis (CFA) or exploratory factor analysis (EFA) estimated with maximum likelihood. Skrondal and Laake (2001) have shown that separate factor analyses for Y (1-CFA or unrotated 1-EFA) and the predictors are necessary to avoid parameter bias. The predictors need to be combined in a joint confirmatory factor analysis (2-CFA of X and Z) because the 2-CFA accounts for the factor correlation of X with Z. Skrondal and Laake (2001, pp. 572–73) then show with analytical proofs that estimates are unbiased if the correlation is accounted for. Web Appendix C has additional details, including the extension to (moderated) mediation models.
Method 5: Product Indicators
Method 5 specifies a measurement model analogous to Equation 2 for products of indicators, while simultaneously estimating the structural model of Equation 1. There are several ways to specify this model. They differ in the product indicators that are paired for moderation analysis and the constraints that are used to estimate the model. Early on, Kenny and Judd (1984) proposed using a measurement model of product indicators that required multiple constraints on the indicator loadings and measurement error variances. Foldnes and Hagtvet (2014) showed with simulation studies and real-world data that there might be considerable variation in moderation estimates depending on the method used to pair indicators. Using a single pair of indicators uses limited information (Jöreskog and Yang 1996), whereas using all pairs of indicators uses all information but might lead to overly complex models (Marsh, Wen, and Hau 2004). Marsh, Wen, and Hau (2004) proposed a compromise “matched pairs” approach, using all indicators of X and Z but each indicator only once. This approach trades off the use of all indicators while limiting model complexity—avoiding correlated measurement errors for pairs that have common components—with acceptable bias and variance implications (Marsh, Wen, and Hau 2004). Lin et al. (2010) show that using matched pairs and double mean-centering the indicator pairs works well. It avoids the need for constraints, other than those for identification, on the indicator loadings and measurement error variances.
A Web of Science citation analysis signals that the product indicators method is rarely used in the focal journals of the literature review, even beyond the included volumes. The three citations of Marsh, Wen, and Hau (2004) apply the method, whereas three of the four citations of Kenny and Judd (1984) refer to its methodological contribution without application. Moreover, the matched pairs approach in Marsh, Wen, and Hau has accumulated more total citations (596) within and outside the marketing domain than other approaches have (at the time of writing: 588 citations of Kenny and Judd [1984], 272 citations of Jöreskog and Yang [1996], 70 citations of Lin et al. [2010], and 13 citations of Foldnes and Hagtvet [2014]).
Accordingly, we use the matched pairs approach with double mean-centering to represent the product indicators method here. In our running example where both X and Z have three indicators, taking matched pairs results in three product indicators of mean-centered variables, for example, x1z1, x2z2, and x3z3 (Marsh, Wen, and Hau 2004), that are subsequently mean-centered once more (Lin et al. 2010).
Method 6: Latent Product
This method estimates the moderation effect from the latent product of X and Z (Klein and Moosbrugger 2000). The latent product method is motivated by the nonnormality in Y that is due to the moderation specification (Klein and Moosbrugger 2000). Products of variables (e.g., XZ) are usually nonnormally distributed, even if their components (here X and Z) are normally distributed. Because Y is a function of the nonnormally distributed XZ if there is a nonzero moderation effect, it is also nonnormally distributed (Moosbrugger, Schermelleh-Engel, and Klein 1997). Web Appendix D provides further details and an illustrative example. The latent product method takes the nonnormality in Y directly into account. It is therefore based on an analysis of the indicator distribution and uses the raw data for estimation, unlike the other methods for which the observed covariance matrix is sufficient. The nonnormal indicator distribution can be approximated by a weighted sum or finite mixture of normal distributions (Klein and Moosbrugger 2000). The mixture distribution then becomes a tool to estimate the moderation effect from the latent product of the latent X and Z. Web Appendix E provides further details.
Commonalities and Differences Between the Methods
In terms of commonalities between the six methods, they all rely on the same estimation approach. All methods except for the latent product method use standard maximum likelihood estimation (Bollen 1989). The latent product method uses an expectation maximization algorithm that converges to maximum likelihood estimates too (Klein and Moosbrugger 2000), even though expectation maximization can be computationally intensive and more sensitive to local maxima of the likelihood (Dempster, Laird, and Rubin 1977).
The structural moderation models of five of the six methods (all except the multigroup method) are virtually identical. The crucial difference is in the specification and assumptions of the measurement model (Table 3). The means method takes unit-weighted mean scores of the indicators that assume a parallel measurement model (McNeish and Wolf 2020). The means method does not account for the remaining measurement error in the scores. The corrected means method accounts for this shortcoming of the means method by fixing the amount of measurement error in the variables on the basis of reliability estimates. Yet, it maintains the assumptions of a parallel measurement model. The equal indicator weighting biases reliability estimates downward and therefore might lead to upward parameter bias in the moderation effect even if measurement error is accounted for (McNeish and Wolf 2020).
Whereas the means method and corrected means method assume equally weighted indicators, the measurement models of the factor scores method, the product indicators method, and the latent product method freely estimate the loadings and measurement error variances. There are three differences between these methods. First, the factor scores method is a two-step approach that separately estimates measurement and structural models, whereas the product indicators method and the latent product method estimate the measurement model and the moderation effect simultaneously. Second, although the factor scores method and the latent product method use a product of latent variables or their scores in the case of the factor scores method, the product indicators method uses products of matched pairs of indicators. This method assumes that the product indicators are representative of all possible pairs, essentially assuming equally weighted indicators. There is considerable variation in moderation estimates as a result of different indicator pairings if indicators are not equally good, which is undesirable (Foldnes and Hagtvet 2014; Marsh, Wen, and Hau 2004). Third, the latent product method is the only approach that accounts for the nonnormally distributed indicators of Y due to the interaction (Klein and Moosbrugger 2000). However, it maintains the assumption of normally distributed indicators of X and Z, as do the factor scores method and the product indicators method. Yet, interestingly, the product indicators method uses products of indicators that rarely meet the assumption of being normally distributed because products are usually nonnormally distributed even if their components are normally distributed (Moosbrugger, Schermelleh-Engel, and Klein 1997; Oliveira, Oliveira, and Seijas-Macías 2016). Web Appendix D provides further details.
The multigroup method can include measurement models for the indicators of Y and X to account for indicator measurement error but does not rely on a product of variables and estimates models for discrete subgroups based on the moderators. Although naturally discrete moderators—such as different countries, owners of different brands, genders, experimental manipulations, and so on—can readily be used as grouping variables, grouping by discretizing continuous moderators adds measurement error to the grouping variable and can lead to parameter bias and a decrease of power (Irwin and McClelland 2001, 2003).
In summary, the six methods for latent moderation analysis are all based on maximum likelihood estimation. The main differences are in their approach and assumptions of the measurement model.
Overview of Monte Carlo Simulation Studies
We conduct Monte Carlo simulations to compare the statistical properties of the latent moderation methods across conditions. We use simulations because method performance and impact of design factor on method performance are difficult to derive analytically (Muthén and Muthén 2002; Skrondal 2000).
Summary of Studies
Table 4 summarizes the designs of eight Monte Carlo simulation studies (Studies 1, 2a–c, 3, and 4a–c) that focus on a variety of conditions. All studies, unless indicated otherwise, are under the following conditions. They generate standard normally distributed Y, X, and Z. Data generation is based on values from the literature review as much as possible, thus mimicking real-world situations (Table 1). The latent Y, X, and Z variables have three indicators (the most common in the literature review) that are equally good. Reliabilities of Y, X, and Z are .85, which is about the mean in our literature review and the mean in a recent review of mediation analyses (Pieters 2017). The moderation and main effect sizes are .20, which are about the mean values in the literature review and are small-to-medium effects (Cohen 1988). The correlation between X and Z is .20, about the mean in the literature review. Sample sizes are 100, 150, 200 (about the median in the literature review), 300, 500, 750, or 1,500. About 82% of the studies in the literature review have sample sizes between 100 and 1,500.
Summary of Study Designs.
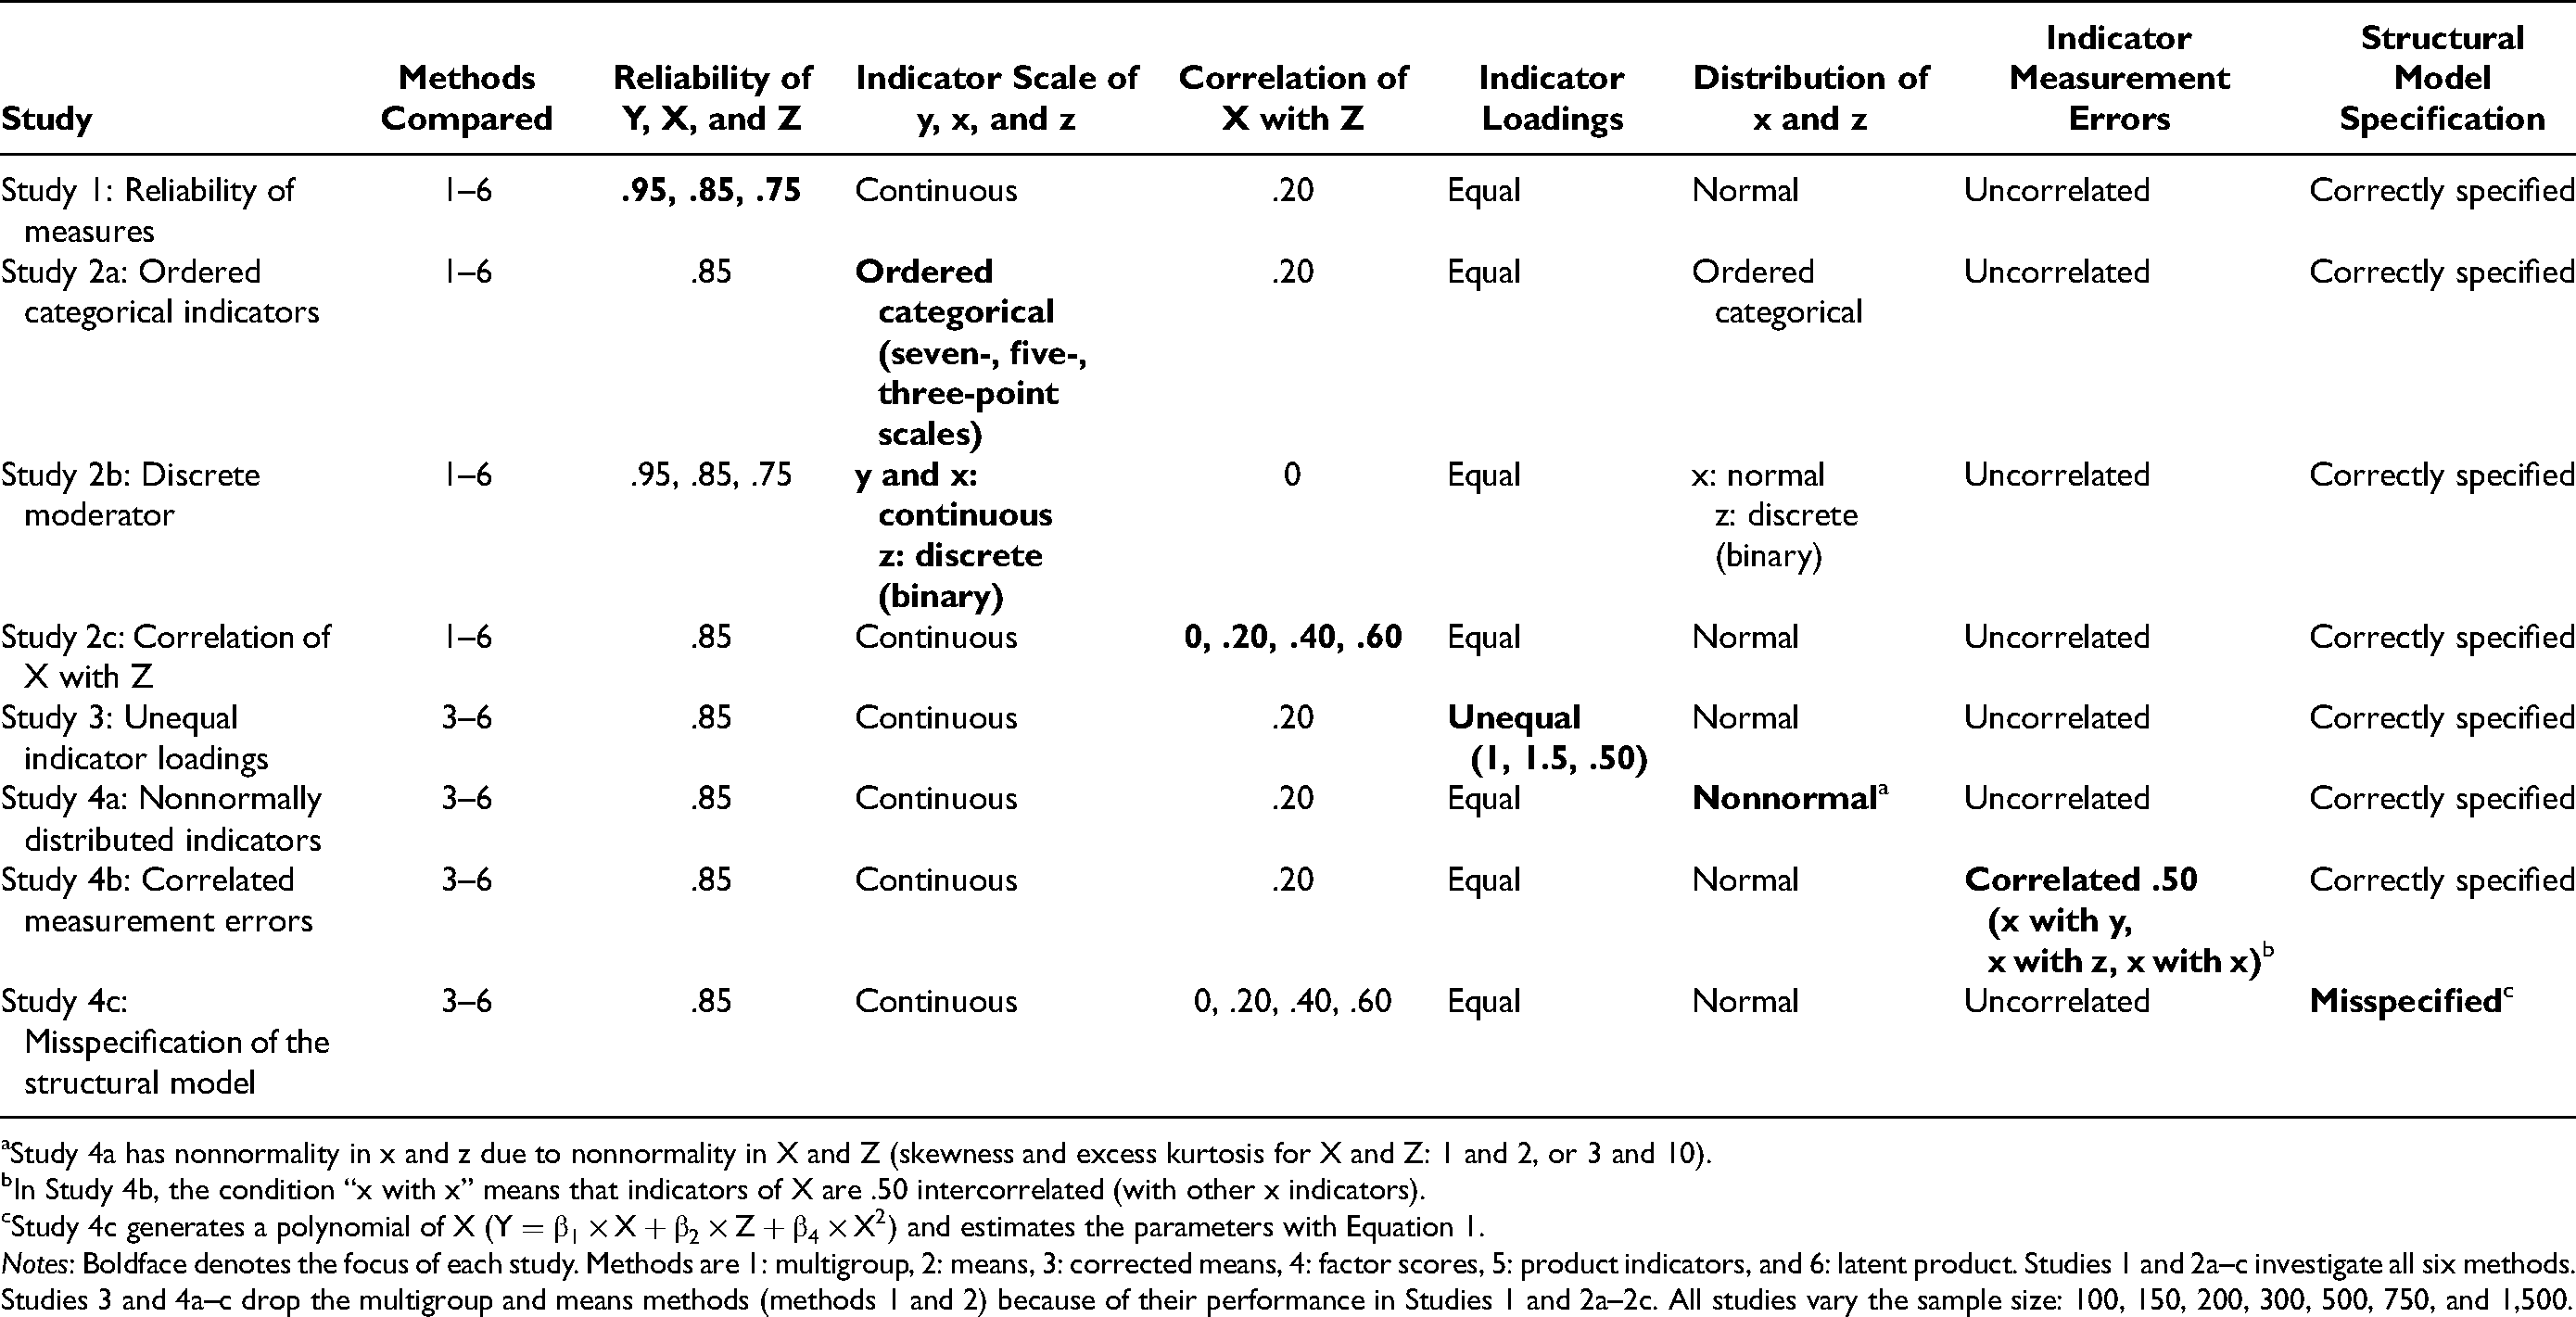
Study 4a has nonnormality in x and z due to nonnormality in X and Z (skewness and excess kurtosis for X and Z: 1 and 2, or 3 and 10).
In Study 4b, the condition “x with x” means that indicators of X are .50 intercorrelated (with other x indicators).
Study 4c generates a polynomial of X (
Notes: Boldface denotes the focus of each study. Methods are 1: multigroup, 2: means, 3: corrected means, 4: factor scores, 5: product indicators, and 6: latent product. Studies 1 and 2a–c investigate all six methods. Studies 3 and 4a–c drop the multigroup and means methods (methods 1 and 2) because of their performance in Studies 1 and 2a–2c. All studies vary the sample size: 100, 150, 200, 300, 500, 750, and 1,500.
For each study, we generate 5,000 replications (data sets) per cell in R (R Core Team 2020) using common random number seeds to increase precision and for reproducibility (Skrondal 2000). The R package lavaan (Rosseel 2012) implements all methods except for the latent product method, for which we use Mplus 8.3 (Muthén and Muthén 2019) from R via MplusAutomation (Hallquist and Wiley 2018). The OSF repository at https://osf.io/py7jx/ has simulation code for all studies.
Method Performance Criteria
Table 2, Panel B, has the operationalizations of the performance criteria to compare the methods. We calculate parameter bias by taking the deviations of the estimated main or moderation effect parameter
We evaluate the methods as follows. We first calculate biases in parameters and standard errors and retain the unbiased methods. Common acceptable levels of absolute parameter bias are ≤ 10% and ≤ 5% for standard error bias (Feingold 2019; Muthén and Muthén 2002). For the methods that meet these criteria, we consider RMSE and power. However, these criteria are not interpretable for biased methods because downward standard error bias can lead to low RMSE and upward parameter bias can lead to high power. Common thresholds are ≥80% for power and ≤5% Type I error (Cohen 1988; Muthén and Muthén 2002). Panel B of Table 2 summarizes these thresholds.
Table 5 summarizes the performance criteria for all methods across the conditions for each study at about the median sample size of 200 in the literature review. Web Appendices F–M and the material on the OSF repository (https://osf.io/py7jx/) provide detailed results for the moderation and main effects.
Method Performance.

Study 4c generates a polynomial of X (
Notes: Boldface indicates acceptable levels of bias: parameter bias (maximum of the moderation and main effects) ≤ 10% and standard error bias ≤ 5% (Feingold 2019; Muthén and Muthén 2002) at a sample size of 200, which is about the median in the literature review (Table 1). Reported RMSE sums the RMSE of the moderation and main effects, and reported power is the estimated power of
Study 1: Reliability of Measures
Design
Study 1 focuses on measure reliability as a determinant of method performance. The design is 6 (method) × 7 (sample size) × 3 (reliability of Y, X, and Z: .95, .85, or .75). The reliability levels are approximately the mean in the literature review, plus and minus one standard deviation (Table 1). These levels are respectively excellent, good, and acceptable reliability (Peterson 1994). We expect that the multigroup method is biased and has a high RMSE and low statistical power because discretizing the continuous indicators of the moderator adds measurement error. We expect the means method to be biased, but we expect the bias to decrease when the reliability increases. In contrast, the latent product method should recover parameters well. An open question is whether the corrected means method, the factor scores method, and the product indicators method perform similarly to the latent product method. Moreover, it is unclear how these methods perform at lower measure reliabilities (i.e., .75) and/or in smaller samples (e.g., 100 observations).
Results
Panels A–D in Figure 2 plot performance of the moderation effect estimates (y-axis) across sample sizes (x-axis) for each method (symbols) and across measure reliability levels (.75 in the left plot, .85 in the center plot, and .95 in the right plot of each panel). Overall, methods perform better and more similarly to each other when measure reliability and sample size increase. However, there are several key performance differences between methods.

Study 1: Performance criteria for the moderation effect (
Parameter bias (Panel A)
The multigroup method is biased, even at high reliability levels of .95 and large sample sizes (e.g., 1,500), with a bias of about 20%. Similarly, the means method is biased by 41% and 26% at reliabilities of .75 and .85, respectively. Increasing sample size does not reduce bias, making the multigroup method and the means method inconsistent estimators (Wooldridge 2015, p. 287). Yet, the bias of the means method at a reliability of .95 is 8%, which can be acceptable (Table 2). At that reliability, differences between methods become smaller. The corrected means, factor scores, product indicators, and latent product methods have biases of about 1%–2%. Differences between methods become larger at lower reliabilities. The product indicators method is unbiased only at larger sample sizes (e.g., ≥300), when reliabilities are .75. Overall, the corrected means method, factor scores method, and latent product method are unbiased (parameter bias below 6% across reliabilities and at a sample size of 200).
Standard error bias (Panel B)
All methods except the product indicators method have standard error biases under 5% for samples of at least 200 observations. The product indicators method has biased standard errors (up to about 33% at a reliability of .75 and sample size of 100) when measure reliability is smaller than .95. Its standard error bias decreases when sample size increases (e.g., bias of about 5% at a reliability of .75 and sample size of 1,500).
Root mean square error (Panel C)
The RMSE differences are small among the unbiased methods (e.g., RMSE between .12 for the factor scores method and .14 for the product indicators method at a reliability of .85 and sample size of 200). The means method offers the best RMSE in smaller samples (≤ 500 observations). However, it is biased and should therefore not be used. The product indicators method has a high RMSE, .55 at a reliability of .75 and a sample size of 200, due to its upward standard error bias.
Power (Panel D)
Among unbiased methods, the factor scores method has the highest power: an estimated 65% at measure reliabilities of .85 and a sample size of 200. Its power is 51% at a reliability level of .75 and 80% for reliabilities of .95. However, power differences between the corrected means method and the latent product method are only one to three percentage points across conditions. At reliabilities of .75 and a sample size of 200, the multigroup method (34% power due to discretization) and the product indicators method (37% power due to standard error bias) have lower power than the remaining methods.
Discussion
Study 1 raises concerns about the performance of the means, multigroup, and product indicators methods, even at reliabilities of .85, which are conventional in the literature review (Table 1) and commonly considered good (Peterson 1994). In contrast, the corrected means, factor scores, and latent product methods perform relatively well across conditions. Their parameter bias is under 10% and standard error bias is below 5% (Feingold 2019; Muthén and Muthén 2002) at a sample size of 200 (and higher). There are few differences in power and RMSE between these three methods. Main effect results offer similar conclusions (Web Appendix F). 2
However, the estimated power to find a small-to-medium moderation effect of .20 (about the mean in the literature review; see Table 1) at a measure reliability level of .85 (about the mean) and a sample size of 200 (about the median) is only about 65% at best. To estimate required sample sizes for 80% power based on Study 1, we follow Schoemann et al. (2014) and extract fitted probabilities from a binary probit regression of the significance of the moderation effect (1 if it is statistically significant, 0 otherwise) on an intercept, the sample size, the dummy-coded reliability, the dummy-coded method, and all interactions. The estimated required sample size is then the smallest sample for which the estimated likelihood (power) of a statistically significant moderation effect is at least 80%.
Table 6 reports the estimates. To find a moderation effect of .20 at a reliability of .85 and with 80% power, the corrected means, factor scores, and latent product methods need at least 312 observations. This requirement is almost 50% larger than the median sample size of 215 in the literature review and is only met by 33% of studies in our literature review. Thus, larger sample sizes are needed to attain sufficient power. At a high reliability of .95, slightly more than 200 observations are sufficient for 80% power. Smaller reliabilities of .75 require even larger samples (e.g., ≥450 for the latent product method). These results are in line with findings in the strategic management domain (Aguinis, Edwards, and Bradley 2017) and suggest that a substantive proportion of published moderation effects under investigation might be biased downward (because of the widespread use of the means method) and/or underpowered (because of moderation analysis in small samples).
Study 1: Required Sample Size Estimates to Estimate a .20 Moderation Effect with 80% Power.

Notes: The table shows point estimates and 95% confidence intervals of the required minimum sample sizes to estimate a moderation effect of .20 (about the mean in the literature review) with 80% power across methods and reliabilities of Y, X, and Z. Estimates are based on a binary probit regression (Schoemann et al. 2014). The median sample size in the literature review is 215, and the mean reliability is .87 (Table 1).
Study 2a: Ordered Categorical Indicators
Design
Study 2a extends Study 1 by using ordered categorical indicators rather than continuous indicators. The design is 6 (method) × 7 (sample size) × 3 (number of scale points of y, x, and z: seven, five, or three). We follow Rhemtulla, Brosseau-Liard, and Savalei (2012) and use thresholds based on Z-scores that equally divide ±2.5 standard deviations from the mean to transform the continuous indicators. We focus on seven-point scales (58% of the cases in the literature review), five-point scales (13%), and three-point scales (below 1%) to explore boundary conditions. Overall, categorical indicators contain less information than continuous indicators do, but Rhemtulla, Brosseau-Liard, and Savalei (2012) find that indicators with five or more ordered categories perform similarly to continuous indicators in nonmoderation settings. Study 2a tests whether this holds for latent moderation.
Results
First, the bias of the multigroup and means methods increases when the number of scale points decreases. For instance, the parameter bias increases from 27% (seven-point) to 38% (three-point) for the means method (compared with 26% for continuous indicators in Study 1). Second, the factor scores method and the latent product method remain unbiased (parameter and standard error bias below 5%) across conditions, and their RMSE and power levels are similar (e.g., RMSE of .37 for factor scores and .39 for the latent product method). However, power levels are lower than in Study 1. The latent product method has 58%, 56%, and 45% power for seven-, five-, and three-point scales at a reliability of .85 and sample size of 200, whereas it had 64% power in Study 1. Third, the corrected means and product indicators methods are biased for three-point scales (standard error bias up to 43% at a sample size of 200). However, and interestingly, the product indicators method has a standard error bias of 5% for at least five-point scales, whereas it had standard error bias of 10% at a sample size of 200 for continuous indicators (Study 1). In this simulation, categorical scales limit extreme values in the indicators, such as outliers, that are more likely to occur for continuous scales and become bigger issues as a result of indicator multiplication. In summary, although categorical indicators contain less information than continuous ones, leading to lower power, five-point and seven-point scales perform almost equally to continuous indicators in terms of unbiasedness for the factor scores method and the latent product method. The factor scores method and the latent product method outperform the corrected means method and the product indicators method for three-point scales.
Study 2b: Discrete Moderator
Design
Study 2b extends Study 1 by focusing on a single discrete (binary) moderation indicator without measurement error (e.g., a country indicator or a manipulation dummy). This is the case for about a third of the moderation effects in the literature review. The design is 6 (method) × 7 (sample size) × 3 (reliability of Y, X, and Z: .95, .85, or .75). Here, the multigroup method can use the moderator without discretization, and we investigate how the multigroup method performs in comparison with the other methods in such a setting.
Results
First, the multigroup method is unbiased (bias under 2% across sample sizes) for a discrete moderator. Similarly, standard error biases are under 5% at a sample size of 200. Second, the bias of the means method is lower than in Study 1 but persists (about 15% at a reliability of .85) unless reliabilities are .95 (bias about 5%). Third, the parameter and standard error biases of the product indicators method are lower than in Study 1 (below 5% across reliabilities of .75 to .95 and for sample sizes of 200 and larger). These findings are due to the fact that Study 2b only has measurement error in x and y, whereas Study 1 focused on measurement error in y, x, and z. Fourth, the corrected means, factor scores, product indicators, and latent product methods are unbiased (parameter and standard error bias up to 5%). We find that RMSE (e.g., between .33 [factor scores and corrected means] and .35 [multigroup] at a reliability of .85 and sample size of 200) and power (70%–71%) are similar under the investigated conditions for the unbiased methods. In summary, the multigroup method is a well-performing alternative to the corrected means, factor scores, product indicators, and latent product methods for binary moderators without measurement error.
Study 2c: Correlation of X with Z
Design
Study 2c extends Study 1 by varying the correlation between X and Z (fixed to .20 in Study 1). Typically, X and Z are correlated in observational data, and this might impact method performance (Grewal, Cote, and Baumgartner 2004). The design is 6 (method) × 7 (sample size) × 4 (correlation of X with Z: 0, .20, .40, .60) with the correlation varying from 0 to .60, covering most of the range in the literature review (Web Appendix A).
Results
First, the bias of the moderation effect for the multigroup method decreases when the correlation between X and Z increases, but the main effects (see Web Appendix I) become more biased (up to 86% at a correlation of .60). Second, increasing the correlation between X and Z from 0 to .60 decreases the moderation bias for the means method from 27% to 21%. This finding is due to the higher reliability of product terms for correlated components (see Equation 6). Third, the corrected means, factor scores, and latent product methods are unbiased across conditions (parameter bias below 3% and standard error bias below 5%), whereas the product indicators method has standard error bias of 9%–10%. The unbiased methods have similar RMSE and power levels (e.g., RMSE between .40 [factor scores] and .42 [latent product method] at a correlation of .60 and sample size of 200). Fourth, the power of the moderation effect increases from 62% to 79% for the latent product method when the correlation between X and Z increases from 0 to .60. Thus, the increase in the power of the moderation effect due to the increased reliability of the product term trades off against the decrease in power due to multicollinearity. However, consistent with Grewal, Cote, and Baumgartner (2004), the power of the main effects decreases because of multicollinearity (from 67% to 47% for the main effects; see Web Appendix I). In summary, the corrected means, factor scores, and latent product methods are unbiased under the investigated conditions. Higher correlation between X and Z increases power to find a moderation effect but decreases power of the main effects.
Study 3: Unequal Indicator Loadings
Design
Study 3 extends Study 1 by focusing on indicators of the latent variables that differ in their loadings. Because the multigroup method and the means method are biased across conditions in Studies 1, 2a, and 2c, on which the following studies build, Studies 3 and 4a–c focus on the comparison between the remaining methods: factor scores, corrected means, product indicators, and latent product. The design is 4 (method) × 7 (sample size) with unequal indicators in all cells:
Results
First, as expected, the corrected means method has biased moderation and main effect estimates, at least 20% even at large sample sizes of 1,500. Second, the factor scores and latent product methods that freely estimate indicator loadings perform best, with parameter and standard error biases under 5% at sample sizes of 200 (and higher). Their RMSE and power are similar (e.g., 69% power of the factor scores method and 68% power of the latent product method at a sample size of 200). Third, the product indicators method has a low parameter bias, as do the factor scores method and the latent product method, but it has a higher standard error bias (e.g., 12% at a sample size of 200). In summary, the factor scores method and the latent product method perform best for unequal indicator loadings.
Study 4a: Nonnormally Distributed Indicators
Design
Studies 4a–c investigate situations where model assumptions of all focal methods are violated, unlike Study 3, where assumptions are violated for the corrected means method only. Study 4a focuses on nonnormality distributed x and z, which is common when measuring constructs such as customer satisfaction (Peterson and Wilson 1992). The design is 4 (method) × 7 (sample size) × 2 (skewness and excess kurtosis for X and Z: 1 and 2, or 3 and 10). Skewness and excess kurtosis are conventional metrics of nonnormality. Both are zero for normally distributed variables (Oliveira, Oliveira, and Seijas-Macías 2016). Because we could not determine skewness and excess kurtosis in our literature review, we use about the 75th and 95th percentiles from a recent existing review in psychology (Cain, Zhang, and Yuan 2017, p. 1720). The procedure described by Vale and Maurelli (1983) generates nonnormal latent variables X and Z that are reflected in nonnormal indicators. Previous research concluded that nonzero skewness and excess kurtosis in variables lead to overestimated zero-order correlations (Bishara and Hittner 2015) but underestimated standard errors (Finch, West, and MacKinnon 1997). Yet, there might be differences between methods. Biased reliability estimates due to nonnormality can bias the corrected means method (Sheng and Sheng 2012). The product indicators method was found to be robust for different latent variable distributions (Marsh, Wen, and Hau 2004) although taking multiple indicator products might also exacerbate bias due to nonnormality. The latent product method does not use (algebraic) multiplications of indicators, so it might perform better, but severe nonnormality can still hamper the ability of the mixture distribution to approximate the indicator distribution (Klein and Moosbrugger 2000).
Results
First, all methods are biased (up to 19% for the corrected means method) in presence of severe nonnormality in x and z (i.e., skewness of X and Z is 3 and excess kurtosis is 10). One exception is the product indicators method with 5% parameter bias at a sample size of 200. Second, standard errors of all methods are also biased, including those of the product indicators method (standard error bias of 32%). Third, for moderately nonnormally distributed indicators (i.e., skewness of X and Z is 1 and excess kurtosis is 2), the factor scores method and the latent product method have biases under 5%. Their RMSE and power levels are similar (e.g., RMSE .35–.38 at a sample size of 200). In summary, the expectation of severe nonnormally distributed indicators with skewness and excess kurtosis might call for the product indicators method even though its statistical conclusion validity might be questionable because of biased standard errors.
Study 4b: Correlated Measurement Errors
Design
Study 4b focuses on another type of misspecification: correlated measurement errors. The design is 4 (method) × 7 (sample size) × 3 (measurement error correlation: x with y, x with z, or x with x). Correlated measurement errors can occur because of omitted variables in the measurement model, such as method factors or response tendencies (Baumgartner and Weijters 2017). We focus on three types of measurement error correlations. First, we generate error correlations between indicators of x and y (denoted as “x with y”). Evans (1985) and Siemsen, Roth, and Oliveira (2010) showed in the context of the means method that measurement error correlations between x and y do not bias moderation effects upward but can bias them downward depending on the magnitude of measurement error correlation. However, it is unclear whether these results hold for the main effects, for the other methods, and for other measurement error correlations. Hereinafter, the design also includes measurement error correlation between moderation indicators x and z and for indicators of X with other indicators of X (denoted as “x with x”). For brevity, we do not focus on measurement error correlations of z with y (analogous to x with y) and z with z (analogous to x with x). The measurement error correlation in all cells is .50. To generate the correlated measurement errors for x with y (analogous for x with z), we correlate indicator x1 with y1, x2 with y2, and x3 with y3. Measurement error correlations of x with x intercorrelate all three indicators of X.
Results
First, measurement error correlations of .50 between x and y bias the main effect estimate of X up to about 50% for all methods (see Web Appendix L for details) even though the moderation effect is unbiased (under 5%). This result extends what was previously found for the means method (Evans 1985; Siemsen, Roth, and Oliveira 2010). Second, under the investigated conditions, measurement error correlations of x with z yield parameter biases under 10% for the moderation and main effects across methods, much less than for measurement error correlations between x and y. However, the standard error bias of the product indicators method is 9%, whereas the standard error bias of the corrected means, factor scores, and latent product methods is 2%–4%. Third, measurement error correlations of x with x also severely bias the moderation and main effects of the corrected means method, product indicators method, and latent product method for about 21%. However, the bias is 12% (about 9% less) for the factor scores method. One reason for this result might be that the two-step estimation of the factor scores method, compared with one-step or simultaneous estimation of the latent product method, is more robust to misspecification in the measurement model (Devlieger and Rosseel 2017; Rosseel 2020; Smid and Rosseel 2020). Thus, under the investigated conditions, correlated measurement error biases all methods. The bias is most severe for measurement error correlations of predictors with outcomes (e.g., x with y).
Study 4c: Misspecification of the Structural Model
Design
Study 4c focuses on misspecification of the structural model. The design is 4 (method) × 7 (sample size) × 4 (correlation of X with Z: 0, .20, .40, .60). It generates a true U-shaped effect of X on Y (i.e.,
Results
First, when X and Z are uncorrelated, we find that the methods yield unbiased (≤ 2%) moderation effects. Bias for all methods is just under 10% when X and Z are correlated at .20. Second, when the correlation between X and Z increases, the bias due to misspecification increases, for instance to 19% for the latent product method and at a correlation of X with Z of .60 and a sample size of 200. Third, standard errors of all methods are biased between 5% and 15% across conditions, even at large sample sizes of 1,500. Fourth, all methods have Type I error ≥5% across conditions, about 20% at a correlation of .20 and a sample size of 200, which further increases if the correlation between X and Z or the sample size increases.
General Discussion
We compared six methods for latent moderation analysis and provide several recommendations. First, the choice between five of the six methods is at the researcher's discretion when reliabilities of the moderation variables approach 1. Although the multigroup method is biased by over 20% when the indicators of the moderator are continuous, the parameter bias of the corrected means, factor scores, product indicators, and latent product methods across sample sizes is under 2%, and the standard error bias is under 5% when the reliability of Y, X, and Z was high at .95 (Study 1). The parameter bias of the means method is then 8% (and standard error bias is 3%), which might be acceptable (Table 2). Furthermore, RMSE and power differences between methods were small. The closer the reliabilities of the moderating variables are to 1, the more similar the performance of five of the six methods becomes.
Yet, reliabilities of moderation variables approaching 1 are rare in practice: the mean reliability in the literature review was .87 (Table 1), and only 13% of moderation tests had reliabilities of the moderation variables ≥ .95. Thus, our findings and recommendation are in contrast with the use of the means method in 95% of the literature review (Table 1). It is well known that ignoring measurement error can bias parameter estimates (Grewal, Cote, and Baumgartner 2004; Spearman 1904; Wooldridge 2015). We show the bias of the means method once more, and our Monte Carlo studies quantify it in the latent moderation context: the moderation effect bias of the means method is about 40% and 25% respectively at reliabilities of .75 and .85.
Second, the factor scores method and the latent product method are recommended across most investigated conditions (Table 5). When indicators are continuous (Study 1) or seven-, five-, or three-point ordered categorical (Study 2a), or when the moderator is binary (Study 2b), and across reliabilities between .75 and .95 (Studies 1 and 2b), the factor scores method and the latent product method have parameter and standard error biases ≤ 5%. The bias remains small when the correlation between moderation variables increases from 0 to .60 (Study 2c) and for unequal indicator loadings (Study 3). We conclude from the small RMSE and power differences across the conditions of our studies that the choice between the factor scores method and the latent product method is mostly at the researcher's discretion. Method accessibility can then be relevant. Factor scores are available in most general statistical software packages. The latent product method is to our knowledge currently only available in Mplus (Muthén and Muthén 2019) and in an R package (Umbach et al. 2017). A follow-up study in Web Appendix N compares both latent product implementations and recommends Mplus in terms of performance, computation time, and the range of possible models that can be estimated. One key researcher decision in the use of the latent product method is the number of mixture components. A follow-up study in Web Appendix O shows that the default in Mplus is adequate to estimate a single moderation effect (Klein and Moosbrugger 2000).
When the factor scores method is used, decisions need to be made about the type of measurement model and the factor scores estimation method. We draw from Skrondal and Laake (2001) and Devlieger, Mayer, and Rosseel (2016) and our own analyses to recommend the following two-step factor scores (TSFS) method for latent moderation analysis.
Step 1 is to conduct a confirmatory factor analysis with the outcome (Y) as a single factor (1-CFA) and extract Bartlett factor scores. The 1-CFA uses optimal indicator weighting, and Bartlett factor scores account for measurement error in the outcome. Then, conduct a separate confirmatory factor analysis for the predictors (X and Z) simultaneously with two factors that are allowed to correlate (2-CFA, no cross-loadings), and extract regression factor scores to assure optimal indicator weighting and account for measurement error in predictors.
Step 2 is to compute the product term from the factor scores of the predictors (multiply) and estimate moderation and main effects with the target regression or path model. We demonstrate that this TSFS method for latent moderation analysis performs well across the examined range of conditions, and about as well as the latent product method that estimates the measurement and structural models simultaneously. Web Appendix P contains a follow-up simulation study that empirically examines the harm of using different factor scores methods than those recommended here.
Third, the multigroup, corrected means, and product indicators methods are best reserved for specific settings. The multigroup method can be used for discrete moderators (bias less than 5%), although the corrected means, factor scores, product indicators, and latent product methods perform similarly. Other researchers have found the corrected means method to perform well and similarly to the latent product method for single indicators (Hsiao, Kwok, and Lai 2021). In that case, the factor scores method cannot be used. Still, if a single indicator that contains measurement error is available, it becomes more difficult to estimate unreliability and hence to account for it, compared with multi-indicator measures, for which reliability estimators are readily available (Kamakura 2015). We refer to Pieters (2017, pp. 699–700) and the references therein for guidance. We identify one setting in which the product indicators method outperforms the factor scores method and the latent product method. The product indicators method had an estimated parameter bias of about 5% (parameter bias of 14% for the factor scores method and the latent product method) when the moderation variables had a skewness of 3 and excess kurtosis of 10 and at a sample size of 200 (Study 4a). Yet, standard errors of the product indicators method, as well as those of the other methods, remain biased (e.g., 32% standard error bias for the latent product method at a sample size of 200), which can harm statistical conclusion validity. Overall, these recommendations should provide actionable guidelines for method use. Web Appendix B provides an overview of sample code for method implementation in SPSS, Stata, R, and Mplus, made available on OSF (https://osf.io/py7jx/).
In some situations the corrected means, factor scores, product indicators, and latent product methods all perform poorly. First, although we showed that correlations between (latent variables) X and Z up to .60 have a negligible effect on the bias of these methods (Study 2c), they can be biased when measurement errors of individual indicators (e.g., x and z) are correlated, independent of the correlation between X and Z. This may occur, for instance, when indicators of X and/or Z are regular and reversed items. Then, the measurement model needs to be adapted (e.g., Baumgartner and Weijters 2017; Weijters, Baumgartner, and Schillewaert 2013), such as by introducing a method factor or having specific errors correlate, before applying the methods that we have compared here. Second, if the true effect of X on Y is U-shaped (polynomial) but not specified (Hutchinson, Kamakura, and Lynch 2000), not only the means method (Ganzach 1997) but all methods perform poorly (Study 4c). That is, if the data-generating process is a U-shaped effect of X on Y, using a specification of the moderation without the polynomial X2 leads to Type I errors for all methods. Then, a nonzero moderation effect between X and Z might be observed even though none exists in the data, a situation that can avoided by examining moderation and curvilinear effects simultaneously (Ganzach 1997).
Among our findings, the small differences in performance between the TSFS method and the latent product method across the focal conditions are noteworthy. One might have expected that joint estimation of the measurement and structural models by the latent product method would empirically perform better than the TSFS method. Recent research in the nonmoderation context has drawn attention to the role of two-step versus conventional simultaneous estimation of latent variable models (Devlieger and Rosseel 2017; Rosseel 2020; Smid and Rosseel 2020). 3 Conceptually, the TSFS method matches the estimation of the measurement and structural models as a combination of two separate models (Anderson and Gerbing 1988). Empirically, one advantage of two-step estimation is that measurement model misspecification might lead to less structural model bias, or vice versa (Devlieger and Rosseel 2017). Our Study 2c showed this to be the case in the context of within-construct correlated measurement errors, although the reduction in bias of the factor scores method compared with the latent product method was a modest 9% under the investigated conditions. Moreover, two-step methods might have fewer convergence issues or ineligible solutions than simultaneous estimation methods do (Smid and Rosseel 2020). Follow-up analyses of our Study 1 show that although nonconvergence was rare, all replications converged for the TSFS method and the corrected means method (both two-step methods). In contrast, 2.4% of replications for the product indicators method and less than 1% of replications for the latent product method (both one-step methods) did not converge. Among nonconverging replications, small sample sizes of 100 or 150 (about 84%) and low reliabilities of .75 (about 86% of nonconverging replications) were most common, which might support the use of two-step estimation to avoid convergence issues of simultaneous estimation in such settings (Rosseel 2020). In summary, the TSFS method for latent moderation analysis is accessible, and its estimates have a small bias with low variance across a large range of conditions.
With this foundation, our study opens several avenues for further research. First, one might investigate the performance of Bayesian estimation, which might do well in small samples and facilitates the incorporation of prior information, potentially resulting in more precise estimates and moderation tests with higher power. Asparouhov and Muthén (2021) conduct simulation studies for the latent product method. Second, although this research studied both random and correlated indicator measurement error, it does not focus on methods to account for correlated measurement errors. If correlated measurement errors are expected, the latent product method might be preferred over the factor scores method because it uses separate factor analyses for predictors and outcomes in which error correlations between predictors and outcomes cannot be accounted for. The latent product method estimates the measurement and structural models simultaneously. Further research might investigate this. We refer to Baumgartner and Weijters (2017) for an overview of models to account for correlated measurement errors in a nonmoderation setting. Third, although the Monte Carlo simulations study a variety of conditions, including settings that violate assumptions, the simulations can be extended further. For instance, the question remains how the methods perform for multilevel or multitime data and fixed or random effects models. Similarly, method performance in the case of (latent) instrumental variables can be assessed.
In summary, it is hard to justify the continued use of the means method for latent moderation analysis unless measurement reliabilities approach 1. Researchers are well advised to apply other methods for latent moderation analysis, such as the TSFS method and the latent product method. We hope that our recommendations improve moderation theory testing and help marketing researchers planning latent moderation studies.
Supplemental Material
sj-pdf-1-mrj-10.1177_00222437221077266 - Supplemental material for Six Methods for Latent Moderation Analysis in Marketing Research: A Comparison and Guidelines
Supplemental material, sj-pdf-1-mrj-10.1177_00222437221077266 for Six Methods for Latent Moderation Analysis in Marketing Research: A Comparison and Guidelines by Constant Pieters, Rik Pieters and Aurélie Lemmens in Journal of Marketing Research
Footnotes
Acknowledgments
This article is based on an essay from the lead author‘s doctoral dissertation, defended at Tilburg University. The authors are grateful to the anonymous JMR reviewers for their many constructive comments; the authors thank the colleagues from the Department of Marketing, Tilburg University, the colleagues from the Department of Marketing Management, Erasmus University Rotterdam, Hans Baumgartner and Harald van Heerde for useful suggestions.
Associate Editor
Shrihari Sridhar
Declaration of Conflicting Interests
The authors declared no potential conflicts of interest with respect to the research, authorship, and/or publication of this article.
Funding
The author(s) disclosed receipt of the following financial support for the research, authorship, and/or publication of this article: The authors received financial support from the NWO via a VIDI (452-12-011) grant.
Notes
References
Supplementary Material
Please find the following supplemental material available below.
For Open Access articles published under a Creative Commons License, all supplemental material carries the same license as the article it is associated with.
For non-Open Access articles published, all supplemental material carries a non-exclusive license, and permission requests for re-use of supplemental material or any part of supplemental material shall be sent directly to the copyright owner as specified in the copyright notice associated with the article.