
Abstract
The proliferation of digital goods has led to an increased interest in how the digitization of products and services affects consumer behavior. In this article, the authors show that although consumers are willing to pay more for physical than digital goods, this difference attenuates—and even reverses—when consumers are asked to make a choice between the two product formats. This effect is explained by a contingent weighting principle: In willingness to pay, a quantitative task, consumers anchor on quantitative information (e.g., market beliefs). However, in choice, a qualitative task, consumers anchor on qualitative information (e.g., which good dominates on the most important attribute). These differences in contingent weighting result in physical goods being preferred in willingness to pay, but their digital equivalent being preferred relatively more in choice. The authors draw conclusions from ten preregistered experiments and six supplemental studies using a variety of goods in hypothetical and incentive-compatible contexts, as well as within- and between-subjects designs. The article concludes with a discussion of implications for the marketing of digital goods.
Digital counterpartsto physical goods have become ubiquitous in the consumer landscape. For instance, three-quarters of music revenue now comes from digital platforms (Friedlander 2017); online subscriptions make up approximately 75% of the New York Times’ (NYT) total of 4.3 million (Peiser 2019); and, as of 2011, more e-books are purchased on Amazon than print books (Miller and Bosman 2011). The same trend has developed across a variety of domains including photographs, movies, magazines, payment systems, and even education (Cabyova and Ptacin 2014; Mintel 2009; Pardo 2015; Rysman and Schuh 2017; Siemens 2015). As physical products become digitized, consumers enjoy a variety of benefits that are conferred by the digital medium, including convenience, ease of access, and additional functionality (Bingham 2010; Goldfarb and Tucker 2019; Molteni and Ordanini 2002). However, despite the proliferation and obvious advantages of digital goods, recent research shows that consumers indicate a greater willingness to pay (WTP) for physical goods than for their digital counterparts (Atasoy and Morewedge 2018).
Although WTP is a commonly used form of preference elicitation, in the marketplace consumers typically express their preference by choosing the option they prefer out of a given set of alternatives. And, while normatively equivalent elicitation modes should yield identical preference orderings, descriptively this principle is often violated. That is, people's preference ordering shifts depending on the preference elicitation mode (Grether and Plot 1979; Lichtenstein and Slovic 1971, 1973; Tversky, Sattath, and Slovic 1988).
In this article, we argue that although consumers indicate a greater WTP for physical goods than digital goods, this difference significantly attenuates—and even frequently reverses—when consumers are asked to make a choice between the two alternative product formats. We explain this effect using the contingent weighting principle: the weighting of inputs is enhanced by their compatibility with the output (Tversky, Sattath, and Slovic 1988). Thus, in WTP, a quantitative task, consumers place relatively greater weight on relevant quantitative information—in particular, their market beliefs—when expressing their preference. As a result, when preferences are elicited using WTP, consumers prefer the good with a higher perceived market valuation—the physical version of the good. However, in choice, a qualitative task, consumers instead place relatively greater weight on qualitative attributes—specifically, which good dominates on the most important attribute. In our studies, we show that this attribute is convenience, and that digital goods tend to dominate physical goods on the convenience dimension. As a result, when preferences are elicited using choice, consumers prefer the digital version of the good relatively more often than in WTP—often preferring the digital good more than the physical good in choice.
Preference Reversals
Preference reversals refer to a change in the relative frequency by which one option is favored over another. For some subset of individuals, the preference ordering expressed when measured one way is the reverse of the preference ordering expressed when measured another way (Grether and Plot 1979; Lichtenstein and Slovic 1973). Preference reversals challenge the descriptive validity of normative decision theory, which is predicated on preferences that conform to the principle of procedure invariance: Preference orderings should be equivalent regardless of the method used to elicit them (Tversky, Sattath, and Slovic 1988; Tversky and Thaler 1990). In the canonical demonstration of a preference reversal, Lichtenstein and Slovic (1971) reported a study in which 47% of participants chose a gamble with a high probability of winning a small amount of money over another gamble with a low probability of winning a larger amount, but only 19% were willing to pay more for the gamble with the larger amount. Since the original demonstration, systematic differences in preferences expressed across elicitation methods have been demonstrated in various disciplines, including economics (Grether and Plot 1979; Tversky and Thaler 1990), psychology (Lichtenstein and Slovic 1971, 1973), and marketing (Fischer et al. 1999; Hsee 1996; Hsee and Leclerc 1998; O’Donnell and Evers 2019). 1
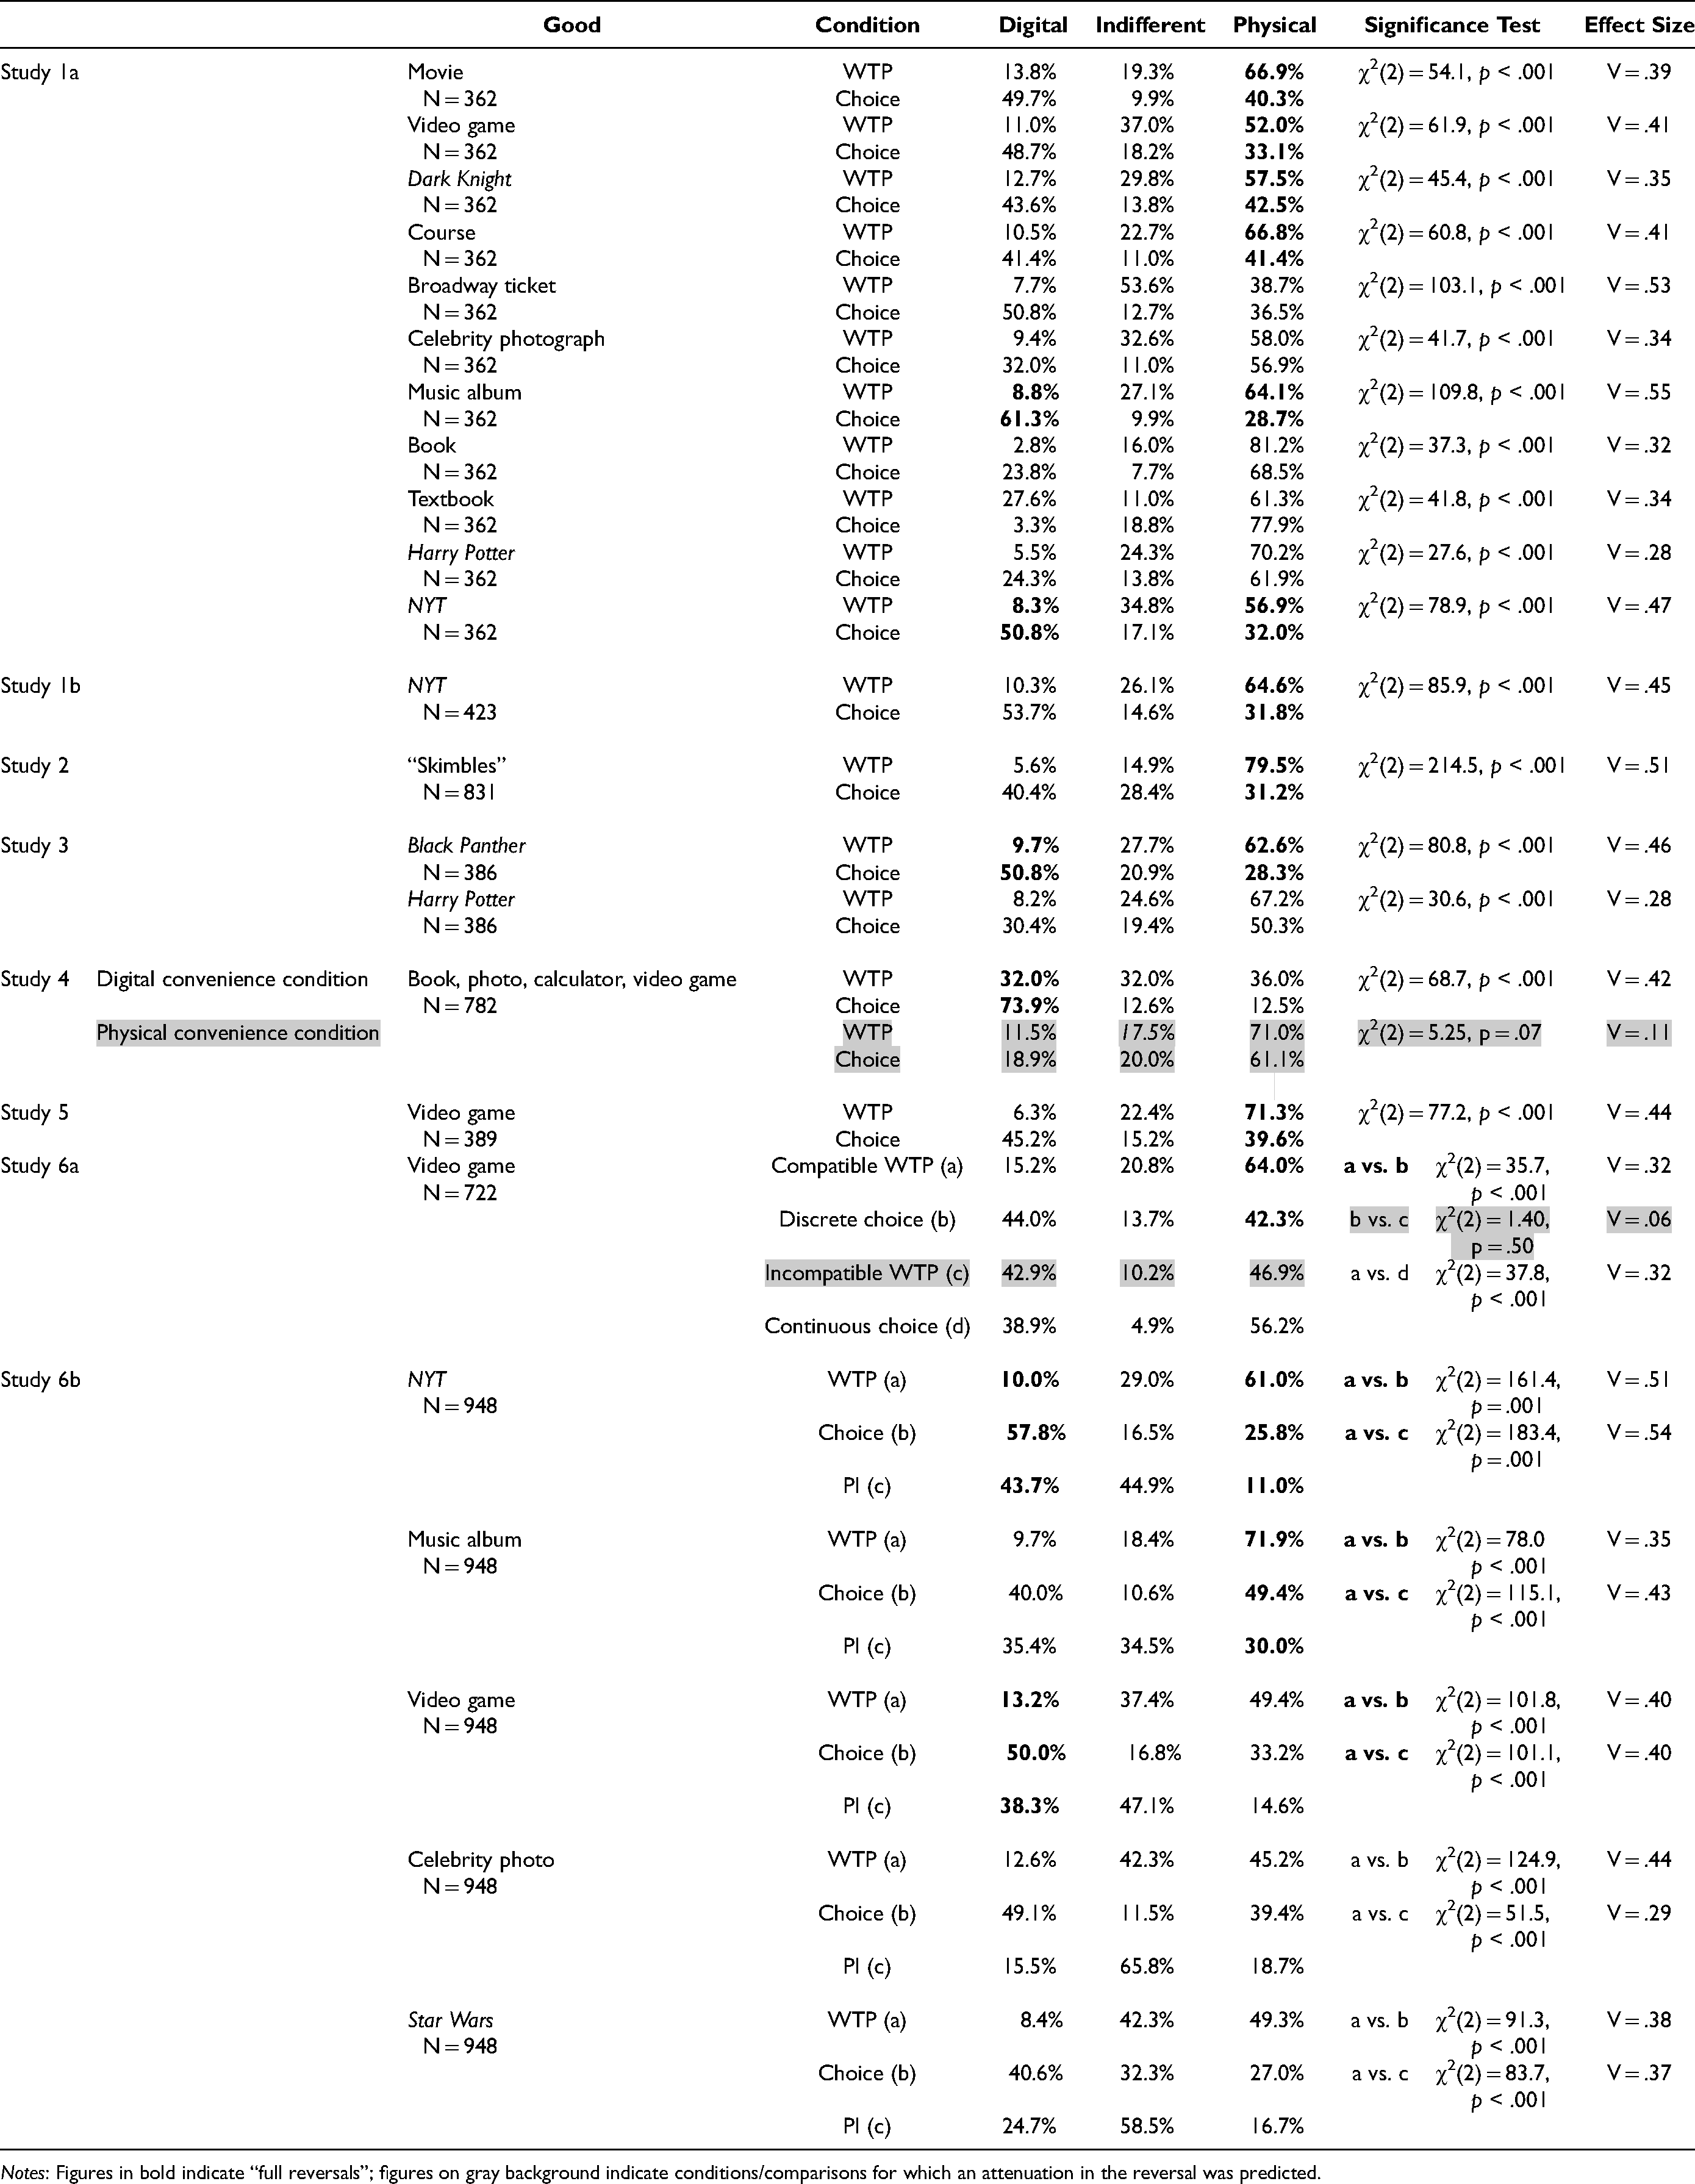
Preference Shifts by Study.

Notes: Figures in boldface indicate “full reversals”; figures on grey background indicate conditions/comparisons for which an attenuation in the reversal was predicted.
Prior research suggests that preference reversals can occur because attribute weights are sensitive to how preferences are elicited, a phenomenon referred to as “contingent weighting” (Tversky, Sattath, and Slovic 1988). Specifically, the weight of an input (e.g., product attributes) is enhanced by its compatibility with the output. In qualitative or ordinal tasks like choice, individuals adopt a lexicographic approach: Because the final output is an ordering of options (with the top choice selected), the most compatible input is the ordering of options based on the most important attribute. As a result, the most important attribute looms larger than the others, and drives choice of the option that dominates on this “prominent dimension.” This tendency, whereby individuals prefer options that are superior on the most important attributes, is known as the “prominence effect” (Fischer et al. 1999; Tversky, Sattath, and Slovic 1988).
In quantitative or cardinal tasks, however, individuals instead adopt a quantitative approach: Because the final output is a numeric assessment of options, the most compatible input is the relevant numeric attributes of the goods. As a result, relevant numeric attributes—particularly those in the same unit as the output—loom larger than the others, which evokes a preference for the option that dominates on this compatible attribute. This tendency, whereby individuals prefer options that are superior on compatible numeric attributes, is known as the “compatibility principle” (Tversky, Sattath, and Slovic 1988).
Consider an example from Tversky, Sattath, and Slovic (1988). In the ordinal or qualitative task condition, participants were given a choice between two programs for saving lives due to traffic fatalities. Program A would cost $55 million and result in 500 fatalities, while Program B would cost $12 million yet result in 570 fatalities. The majority of respondents chose A over B. In the cardinal or quantitative task condition, participants were given only the Program A price and were asked to price Program B at a level that would make it comparable. The majority of respondents generated prices above $12 million, indicating preferences inconsistent with their choices. The authors attributed this preference reversal to contingent weighting. More specifically, participants in the qualitative condition based their preferences on the most important attribute, number of fatalities, thus choosing Program A. Participants in the quantitative condition relied on the quantitative aspect of the matching task and simply estimated the unknown value using the other known values (i.e., proportion matching; Carmon and Simonson 1998). In other words, individuals afforded greater weight to the information most compatible with the elicitation mode being used and thus anchored on different characteristics in the cardinal versus ordinal task (Fischer and Hawkins 1993; Tversky, Sattath, and Slovic 1988).
In the current article, we examine the effect of contingent attribute weighting on the choice and valuation of physical goods and their digital counterparts. Despite the benefits of digital goods, prior research by Atasoy and Morewedge (2018) has shown that physical good equivalents elicit greater WTP, with its authors concluding that “digital goods are valued less than physical goods.” Procedure invariance necessitates that this preference for physical goods will hold across elicitation tasks. However, here we show that the tendency to prefer physical goods depends on elicitation mode: whereas people indicate higher WTP for physical goods than for their digital counterparts, this preference attenuates, and frequently reverses, when they are asked to choose.
Contingent Weighting in Choice
Contingent weighting postulates that in ordinal expressions of preference such as choice, the most important attribute will loom larger. What is the most important attribute when selecting between digital and physical goods? We argue that a key differentiating feature between digital and physical goods is convenience, which we define as the extent to which a product (1) is easy and/or comfortable to acquire and use, (2) helps an individual avoid wasting time and effort, and (3) is generally designed to make an individual's life simpler. This proposition is consistent with previous research suggesting that new technology adoption (e.g., the adoption of digital goods) is determined by two major dimensions of convenience, usefulness (capable of being used advantageously) and ease of use (able to be used without a great deal of effort) (Davis 1989; Robey 1979; Rogers and Floyd Shoemaker 1971; Schultz and Slevin 1975).
To confirm that convenience is indeed the most important, or prominent, attribute in choices between physical and digital goods, we conducted a pilot study in which we asked respondents (N = 193) to rate the importance of five attributes (convenience, ownership, touch, environmental waste, and cost; for details on how we selected these attributes, see Study 3) in determining product desirability for five common goods that come in physical and digital formats (a movie, a photograph, a book, a newspaper, and a video game). In addition, as a summary measure we asked about the importance of these attributes for “all products that come in physical and digital formats.” Regardless of the product category, convenience was consistently rated above any other attribute (for full statistics, see Web Appendix A Supplemental Study 1). The relative importance of the four other attributes varied depending on the product category. Thus, we would expect the product that dominates on convenience to be preferred in choice tasks.
Although physical and digital goods are intended to deliver equivalent content, each product format dominates along a different dimension. We suggest that although the sense of ownership is greater for physical goods (Atasoy and Morewedge 2018), digital goods are typically perceived as more convenient. This convenience is derived from the inherent “aspatiality” of digital goods—they are simultaneously everywhere and nowhere (Quah 2003). This quality allows consumers access anywhere, anytime, on various devices, with low (if any) transport costs to facilitate this accessibility. The benefits of aspatiality have become particularly important in a world where individuals are increasingly mobile and value “liquid goods” for their ease of access and storage (Bardhi, Eckhardt, and Arnould 2012). In contrast, physical goods exist in a single format, can be accessed in a single location at a time, and have temporal and spatial transport costs. To test the intuition that digital goods are viewed as more convenient than their physical counterparts, we asked a group of participants (N = 175) whether the digital format or physical format was more convenient for 11 common digital–physical good pairs. Across all 11 goods, participants thought the digital version was more convenient than the physical version (for full analysis, see Web Appendix A Supplemental Study 2). Thus, based on our discussion of contingent weighting, digital—the product format that is superior along the prominent dimension of convenience—will be preferred more often in choice tasks.
Contingent Weighting in WTP
For the quantitative judgments of WTP, we would expect consumers to rely on compatible quantitative attributes—particularly those that are expressed in the same unit scale. We argue that, in determining WTP, the relevant quantitative information that consumers are most likely to use is their impression of market valuation, which is tied to both a product's retail price and beliefs about how much others would be willing to pay for the product. We propose that market beliefs will have an outsized effect on WTP because of the compatibility between these quantitative price points and the quantitative assessment of the price an individual is willing to pay. As a result, when expressing their WTP for digital and physical goods, individuals will prefer the version that has a higher perceived market valuation. This proposition differs from prior research, which has argued that ownership is the primary factor in determining prices for digital and physical goods (Atasoy and Morewedge 2018). In the studies that follow (Studies 2, 4, and 5), we find evidence that although ownership is one attribute that consumers consider in their decision making for digital and physical goods, it is not the primary attribute used in this decision. Moreover, we find evidence that market valuations can be as important, if not more important, than ownership in determining preferences.
We propose that the perceived market valuation of physical goods is typically higher than the perceived market valuation of digital goods. The infinite expansibility of digital goods (i.e., their ability to be replicated quickly at little to no cost; David 1992; Quah 2003), is likely a primary contributor to this perception. Infinite expansibility lowers the marginal cost to produce each digital copy of a good, which typically leads digital goods to be priced lower than their physical counterparts (this is particularly true for the many firms that use cost-plus pricing). In the studies we report herein, we find that individuals indeed believe that the market valuations of physical goods are higher than their digital counterparts. As a result, we hypothesize that physical goods will be preferred more often in WTP tasks, relative to choice tasks.
Overview
We demonstrate our hypothesized preference reversal in ten preregistered studies and six supplements that include a variety of product categories, both between- and within-participant designs, and incentive compatibility. The effects we report are of medium to large magnitude (median Cramer's Vs = .39; mean Cramer's V = .40; note that small, medium, and large Cramer's V effect sizes are estimated at .10, .30, and .50, respectively [Seaman 2001]). We demonstrate the basic effect in a hypothetical scenario (Studies 1–2), in a within-subjects design (Supplemental Study 3), and in an incentive-compatible design (Study 1b, Supplemental Study 4). Studies 3–4 and 5–6 offer evidence for the role of the prominence effect and compatibility, respectively, in the reversal we report. We show that the preference reversal is moderated when digital is not considered dominant on the prominent attribute (Study 4) and when individuals express WTP using an elicitation mode that is less compatible with quantitative market valuation assessments (Study 6).
Studies
Our experiments all used a similar design in which participants either stated the maximum price that they would be willing to pay for digital and physical versions of the same product (e.g., a physical copy of a book vs. a digital copy of the same book) or made a choice between the product pair. In the WTP task, we asked participants, “What is the maximum price that you would be willing to pay for a [digital/physical] copy of [some good]?” In the choice task, we asked participants to “Imagine you are deciding whether to receive a physical copy of [some good] or a digital copy of [some good]. Which one would you choose?” Participants in the choice task could also indicate that they were indifferent between the two options. All studies were between-participants (except Supplemental Study 3, which was within-participants).
To compare preferences across our experimental conditions, we classified participants in the WTP condition into one of three categories. Participants were classified as preferring the digital version if their WTP for that version was higher than for its physical counterpart, and vice versa for the physical version. Participants indicating equal WTPs were classified as indifferent (the indifference option was available in the choice condition in all studies). Because our focus was preference for digital versus physical, in our primary preference reversal analyses we excluded participants who indicated indifference. 2 This decision allowed us to focus only on the target difference (preference for digital vs. physical) and is consistent with prior work on preference reversals (e.g., O’Donnell and Evers 2019). Table 2 shows the results including indifference. We return to the question of indifference in the “General Discussion” section.
Results After Exclusions, Including Indifference.
Notes: Figures in bold indicate “full reversals”; figures on gray background indicate conditions/comparisons for which an attenuation in the reversal was predicted.
All studies were conducted on Amazon Mechanical Turk (MTurk) or Prolific Academic in exchange for payment. In studies with only one stimulus (Studies 1b, 4–6a), at the beginning of the study participants were asked if they would consider buying the stimulus good at a discount, if offered to them (along with filler questions). Participants who answered “no” were disqualified from participating in the study, and no data were collected from these participants (for complete data on preexcluded participants by study, see Web Appendix B, Table W5-a). This preexclusion enabled us to ensure that all participants were answering based on their own preferences and experiences rather than giving preferences for a good they would not consider purchasing. Finally, it is worth noting that many of our studies were run in 2019 and 2020, after a large number of bots were detected on MTurk as affecting data quality (Chmielewski and Kucker 2019). To address this issue, we excluded all respondents who failed an attention check, 3 consistent with our preregistrations. The qualitative and quantitative conclusions that we report do not change when the full sample is included in the analysis. Results without exclusions are available in Table W6 of Web Appendix B. Preregistrations, data, and analysis files for all studies are available at https://osf.io/q3ca7/. Online data include all participants, including incomplete data from participants who were preexcluded before randomization, which was not used in any of our analyses. In 12/14 studies (85.7% 4 ), there was not a significant difference in exclusions by condition (see Web Appendix B, Table W5-b). Our analysis plans and participant exclusions were preregistered, unless otherwise specified.
Study 1a: Establishing the Basic Effect Across 11 Goods
Participants and Procedure
Four hundred twelve MTurk workers (54.7% female; Mage = 36.1 years, SD = 11.7 years) participated in this study, with 362 participants remaining after excluding those who failed an attention check (n = 50). Participants were randomly assigned to either the WTP or choice condition and were asked to evaluate 11 pairs of goods, ordered randomly (a copy of your favorite movie, a copy of your favorite video game, a copy of the movie The Dark Knight, a course that you have been wanting to enroll in, a ticket to your favorite Broadway show, a photograph with a favorite celebrity, a copy of your favorite music album, a copy of your favorite author's upcoming book, a copy of a textbook that you need for a class that you are taking, a copy of Harry Potter and the Sorcerer's Stone, and a subscription to NYT). Thus, in the WTP condition participants stated 22 WTP amounts (digital and physical for each good), and in the choice condition they made 11 selections. The order of all 11 WTP items was randomized and, to make the WTP condition as similar as possible to the choice condition, physical and digital product pairs in the WTP conditions were displayed on the same screen. In the choice condition, the order of the product pairings was randomized and each pair was displayed on a separate screen.
Results
The results were consistent with our predictions. Across the 11 goods, preference for the physical good was relatively stronger when preferences were elicited through WTP rather than choice, whereas preference for the digital good was relatively stronger when preferences were elicited through choice rather than WTP (binary logistic regression with a random intercept for participant and a random intercept for good: b = 2.23, Z = 13.45, p < .001; 1 = WTP, 0 = choice). This significant pattern emerged for each individual good (all χ2 > 16.3, ps < .001; percentage physical by stimulus and condition: movie: WTP 82.9%, choice 44.8%; video game: WTP 82.5%, choice 40.5%; The Dark Knight: WTP 81.9%, choice 49.4%; course: WTP 86.4%, choice 46.6%; Broadway ticket: WTP 83.3%, choice 41.7%; celebrity photo: WTP 86.1%, choice 64.0%; music album: WTP 87.9%, choice 31.9%; book: WTP 96.7%, choice 74.3%; textbook: WTP 95.9%, choice 68.9%; Harry Potter: WTP 92.7%, choice 71.8%; NYT: WTP 87.3%; choice 38.7%; see Table 1). We also conducted an additional analysis in which instead of using a mixed model controlling for good and participant, we explored the interaction between condition and good to see whether the effect size differed across goods. An omnibus test revealed no interaction between good and condition (Rao score 5 = 15.5, p = .11), suggesting a similar effect size across the goods we tested.
Study 1b: Incentive-Compatible Design
Prior literature suggests that when respondents provide hypothetical WTP estimates, they tend to overestimate the amount that they would actually pay in real-life contexts (Blumenschein et al. 1997; Cummings et al. 1997). To address this issue, here we introduce an incentive-compatible design to our procedure.
Participants and Procedure
We recruited 480 participants. After preexcluding participants who were not interested in purchasing the NYT subscription or who failed the training task from taking the survey, 423 remained (44.7% female; Mage = 35.7 years, SD = 11.4). Qualified participants were either asked their WTP for digital and physical subscriptions to the NYT or asked to make a choice between these two product versions. We did not collect preference data from participants who failed the training task or were not interested in the NYT, and no other attention check task was used. After removing participants who indicated indifference (n = 83), 340 participants remained.
Prior to indicating their WTP or choice, all participants completed a training task and answered questions to assess whether they understood how their responses would affect their outcomes (for text used, see Web Appendix C). The training tasks for choice and WTP were matched in duration and language. During the training task for the choice condition, participants were told that a lottery would determine whether they would receive their chosen subscription. Next, they answered questions on different outcomes based on their (purported) decision. During the training task for the WTP condition, we introduced participants to the Becker–DeGroot–Marschak (BDM) procedure (Becker, DeGroot, and Marschak 1964). Participants were given a budget ($250), which they could use to purchase the available product (here, NYT). Then, the participant's WTP was compared with a randomly generated price between $1 and $250. If the WTP amount is higher than the randomly generated price, the individual received the good and paid the generated price. If the WTP amount was lower than the randomly generated price, the individual did not receive the good and paid nothing. The BDM procedure thus penalizes respondents for providing a WTP amount that does not reflect their true valuation for the product. For example, if a participant values the product at $50 but only indicates a WTP of $20, then if the number generated is between $20 and $50, they will not receive the product, even though they value the product at more than that. However, if they indicate a WTP of $50 and the random amount is $20, then they only pay the $20—they are not penalized for a higher WTP. Participants who did not pass this training task were excluded from completing the remainder of the study.
Next, participants completed the preference elicitation task for the NYT subscription. In the choice condition, following a reminder about the lottery, participants made their selection. In the WTP condition, participants were told that one person would be randomly selected to receive $250 that they would use to pay for their NYT subscription if their stated WTP was greater than or equal to the randomly generated price (otherwise, they would receive the full amount of money).
Results
As in the previous study, while participants were willing to pay more for a physical copy than a digital copy of the NYT (86% physical/14% digital), they preferred the digital copy in choice (37.3% physical/62.7% digital; χ2(1) = 77.1, p < .001, V = .48). Thus, our findings replicate in an incentive-compatible setting.
Discussion
Studies 1a and 1b present evidence for a preference shift toward digital goods when preference is elicited through choice, as compared with WTP. We show this pattern for 11 different goods and using hypothetical and consequential outcomes. Moreover, in a series of robustness checks, we also found that this effect replicates within-subjects (Web Appendix A, Supplemental Study 3) and when individuals have to actually pay for their choice (Web Appendix A Supplemental Study 4). In addition, we found that the effect is not driven by the deliberation mechanism discussed in O’Donnell and Evers (2019) (Web Appendix A, Supplemental Study 5).
We argue that the reported preference shift is not specific to the subset of 11 digital–physical good pairs tested but generalizes broadly based on individuals’ intuitions about digital versus physical goods. In Study 2, we present evidence for this generalizability by replicating our effect using a fictitious product that participants should have no other associations with.
Study 2: Preference Reversal in a Fictitious Product
Participants and Procedure
Nine hundred ninety Prolific Academic workers (45.9% female; Mage not recorded) participated in this study, with 651 participants remaining after we excluded those who failed an attention check (n = 159) and removed those who were indifferent (n = 180). Participants were asked to evaluate a fictitious product, “skimbles,” and given the following instructions: “We are currently working with a major company that is planning to launch a new product in 2021. For confidentiality and intellectual property reasons, we cannot reveal the specific name of the company or product. For the purposes of this study, we will refer to the new product as ‘skimbles.’ Skimbles are estimated to cost between $5 and $100, and will be available in a digital format and a physical format. In initial product testing, users across age groups indicated that they thought skimbles would improve their everyday lives. Most testers said that they would seriously consider buying a skimble.”
After reading about “skimbles,” participants were asked which skimble they thought would be better for (1) convenience, (2), a sense of personal ownership, and (3) aesthetics (trinary scale: digital, neither, physical). To ensure that participants considered convenience important (a necessary condition for the prominence effect), we told them that product testers had indicated that all three properties were important, but convenience was most important. As an attention check, we asked participants, “What is the most important attribute in skimbles?” (convenience, sense of personal ownership, aesthetics) and excluded participants who did not correctly select convenience. Finally, participants were randomly assigned to either WTP or choice and completed the preference elicitation task as in our other studies.
Results
The results were consistent with our predictions. First, we explored whether participants intuitively believed that a digital product would be more convenient, in the absence of any other information about the product. Indeed, 90.2% of participants believed that the digital skimble would be more convenient (χ2(1) = 502.73, p < .001). Second, we explored whether elicitation mode affected preference for the digital versus physical good. As in our other studies, we found that participants in the WTP condition were significantly more likely to prefer the physical skimble (93.5% physical/6.5% digital) relative to participants in the choice condition (43.6% physical/56.4% digital; χ2(1) = 191.37, p < .001, Cramer's V = .54).
Exploratory Analysis 6
In this study, participants were asked which skimble they thought would be better for (1) convenience, (2) a sense of personal ownership, and (3) aesthetics (trinary scale: digital, neither, physical). We used these data in an additional exploratory analysis, in which we performed an ordinal logistic regression predicting propensity to prefer digital versus physical (−1 = digital, 0 = indifferent, 1 = physical; see footnote 2). The predictors used in the model were condition (1 = WTP, 0 = choice); which skimble was better on convenience, ownership, and aesthetics (three individual items entered into the model simultaneously; −1 = digital, 0 = neither, 1 = physical); and the interaction of condition and each of these attributes. First, the analysis revealed that, consistent with our other studies, individuals were more likely to prefer the physical skimble in WTP than in choice (b = 1.90, Z = 13.61, p < .001). Second, convenience, ownership, and aesthetics predicted preference, such that individuals were more likely to prefer the physical skimble when they believed that it offered better convenience (b = .29, Z = 2.80, p = .005), better ownership (b = .56, Z = 5.08, p < .001), or better aesthetics (b = .36, Z = 3.91, p < .001). Most germane to the prominence effect, the relationship between convenience and preference was qualified by a significant interaction (b = −.96, Z = −4.40, p < .001). Convenience significantly predicted preference in choice (b = .77, Z = 5.15, p < .001) but did not significantly predict preference in WTP (b = −.19, Z = −1.23, p = .22) when entered simultaneously with the other predictors. This interaction was not significant for ownership (p = .30) or aesthetics (p = .13).
Discussion
There are a couple of key takeaways from this study. First, even for a fictitious good, people believed that the digital good would be more convenient than its physical counterpart, suggesting consumers’ intuitions that digital goods are more convenient spans a very broad set of goods. In addition, consistent with contingent weighting, convenience (the prominent attribute) played a greater role in choice (i.e., more strongly predicted choice of digital) than in WTP. Finally, ownership and aesthetics, both nonprominent attributes, predicted preference equally across conditions. This finding suggests that the differential impact of convenience on WTP and choice is tied to the prominent attribute and does not occur for all attributes.
Study 3: Contingent Weighting in Choice
The goal of this study is to establish empirically the role of prominence in the preference shift that we report. To ensure that we captured all of the most salient attributes of the product, we conducted a pretest that we appended to another study in which we asked respondents to list either “why [they] had made [this] choice” or “why did [they] choose [this] amount” after they had made their choice or indicated their WTP, respectively. From these open-ended responses, four attributes emerged as the most commonly mentioned: cost of production, touch, convenience, and environmental waste. These attributes correspond to attributes mentioned in previous literature on characteristics of physical and digital goods (Belk 2013; Berkhout and Hertin 2004; Bradley et al. 2012; Lucas and Goh 2009; Siddiqui and Turley 2006; Sui and Rejeski 2002). We added a fifth attribute to this list, psychological ownership over the good, drawing on research suggesting its importance in valuations of digital and physical goods (Atasoy and Morewedge 2018).
In this study, we used two stimuli: Harry Potter and the Sorcerer's Stone (book) and Black Panther (movie), and preferences were elicited for both during the same survey. The preference elicitation task was identical to previous studies. After completing the preference elicitation task, participants rated the importance of each of the five attributes in determining the desirability of both Black Panther and Harry Potter. This design allowed us to explore both which attributes individuals view as most important in this decision and which format is superior on each of these attributes. To test the robustness of our findings, we replicated this study with an NYT subscription as the stimulus (see Web Appendix D study 3 replication).
Participants and Procedure
We randomly assigned 403 participants (37.2% female; Mage = 35.2 years, SD = 10.7 years) to either the WTP condition or the choice condition in a between-subjects design. After removing those who failed the attention check (n = 17) and those who were indifferent for both goods (n = 50), 336 participants remained (Harry Potter N = 301; Black Panther N = 292). Each participant was assigned to a single condition; thus, a participant who gave WTP for Harry Potter would also give WTP for Black Panther. After indicating their preference, participants were asked to rate on a seven-point scale (1 = “not important at all,” and 7 = “extremely important”) the importance of the aforementioned five attributes (convenience, cost of production, touch, environmental waste, and ownership) for each good.
Results
Participants in the WTP condition were significantly more likely to prefer the physical good relative to participants in the choice condition for both the Black Panther stimulus (WTP: 86.5% physical/13.5% digital; choice: 35.8% physical/64.2% digital; χ2(1) = 76.37, p < .001, Cramer's V = .51) and Harry Potter stimulus (WTP: 89.1% physical/10.9% digital; choice: 62.3% physical/37.7% digital; χ2(1) = 27.66, p < .001, Cramer's V = .30).
Furthermore, we find evidence supporting a contingent-weighting explanation for our preference shift. First, convenience emerged as the most important (prominent) attribute in the set either directionally (M HP = 5.34, SD = 1.47) or significantly (M BP = 5.71, SD = 1.31; see Table 3, Panels A and B, for results of pairwise Bonferroni-corrected paired t-tests) for both stimuli, as well as in the replication reported in Web Appendix D.
Mean and SD of Stimulus Attribute Importance on a 1–7 Scale.

Parentheses indicate the attribute of greater perceived importance in the comparison.
Second, we find that digital goods are perceived as being strongest on the convenience dimension. We assessed which good was perceived as strongest on each of the five attributes by regressing attribute importance on propensity to prefer the digital versus physical version of each good (ordinal logistic regression: −1 = digital, 0 = neither, 1 = physical; see footnote 2). Consistent with Atasoy and Morewedge (2018), higher importance ratings for ownership and touch were more strongly associated with preference for the physical version (ownership BP : b = .31, Z = 5.80, p < .001; ownership HP : b = .30, Z = 5.32, p < .001; touch BP : b = .42, Z = 8.0, p < .001; touch HP : b = .46, Z = 7.84, p < .001). However, higher importance ratings for convenience and environmental waste concerns predicted a preference for the digital version (convenience BP : b = −.25, Z = −3.64, p < .001; convenience HP : b = −.28, Z = −3.88, p < .001; environment BP : b = −.12, Z = −2.31, p = .02; environment HP : b = −.16, Z = −2.94, p = .003). Cost of production did not consistently predict preference (cost BP : b = .07, Z = 1.48, p = .14; cost HP : b = −.09, Z = −1.84, p = .07). Thus, when ownership and touch gain in importance, individuals increasingly prefer the physical good, whereas when convenience and environmental waste gain in importance, individuals increasingly prefer the digital good. This pattern implies that digital goods are perceived to dominate on convenience.
A contingent weighting account suggests that, in choice, preferences will shift toward the good that dominates on the prominent attribute, convenience. Because digital goods are superior on convenience, preferences shift toward digital goods in choice tasks relative to WTP.
Study 4: Moderation by Prominence
We have argued that the observed preference shift is due to contingent weighting. In choice, individuals weight the prominent attribute, convenience, more heavily than in WTP. Because digital goods tend to dominate on convenience, we observe a shift in preference toward digital goods in choice tasks relative to WTP. Conversely, contingent weighting predicts that in cases where the digital good's advantage on the convenience dimension diminishes, we would expect an attenuation of this shift. To test this hypothesis, in Study 4 we asked participants to rate whether digital or physical was more convenient for each of four goods. Next, each participant was presented either with the good that they had indicated was relatively most convenient in its digital format or the good that they had indicated was relatively most convenient in its physical format. We expected the preference shift to be smaller for the latter good than the former.
Participants and Procedure
We recruited 1,207 participants on MTurk. Using a prescreening question at the beginning of the survey (“How important is convenience to you in a product that you would like to purchase and use?”; 1 = “Not important at all,” 4 = “Moderately important,” and 7 = “Extremely important”), we excluded participants who did not believe convenience was important (ratings below 4) from completing the survey (as specified in our preregistration), and we did not collect data from these participants (n = 208). We randomly assigned 999 respondents (37.0% female; Mage = 37.0 years, SD = 10.8 years) to a 2 (WTP vs. choice) × 2 (digital is more convenient vs. physical is more convenient) between-subjects design. After we removed those who failed the attention check (n = 216 7 ) and those who indicated indifference (n = 157), 626 participants remained in the analysis.
At the outset, participants were told that convenience was defined as the extent to which the target good “(1) was easy and/or comfortable to acquire and use, (2) helps [them] avoid wasting time and effort, and (3) was generally designed to make [their] life simpler.” Participants then evaluated four goods (book, photograph, calculator, and video game) on seven-point scales by indicating whether their digital form was substantially more convenient (1), digital and physical were equally convenient (4), or physical form was substantially more convenient (7). These four goods were chosen based on a pretest free response question, in which participants were asked to indicate either a good whose digital form was more convenient than its physical form or whose physical form was more convenient than its digital form. The four selected goods were the most common answers that were used in both the digital and physical condition.
Participants were then randomly assigned to either the digital convenience or physical convenience condition. In the digital convenience condition, participants were asked to write about the good that they gave the lowest numeric rating to (i.e., the one for which the digital was considered the most convenient compared with physical) and explain why the digital version is more convenient than its physical version. In the physical convenience condition, participants were instead asked to write about the good that they gave the highest numeric ranking to (i.e., the one for which physical was considered the most convenient compared with digital) (see Figure 1). 8 After the writing task, participants completed the preference elicitation task for the designated good by indicating either their WTP or choice, as described in previous studies.
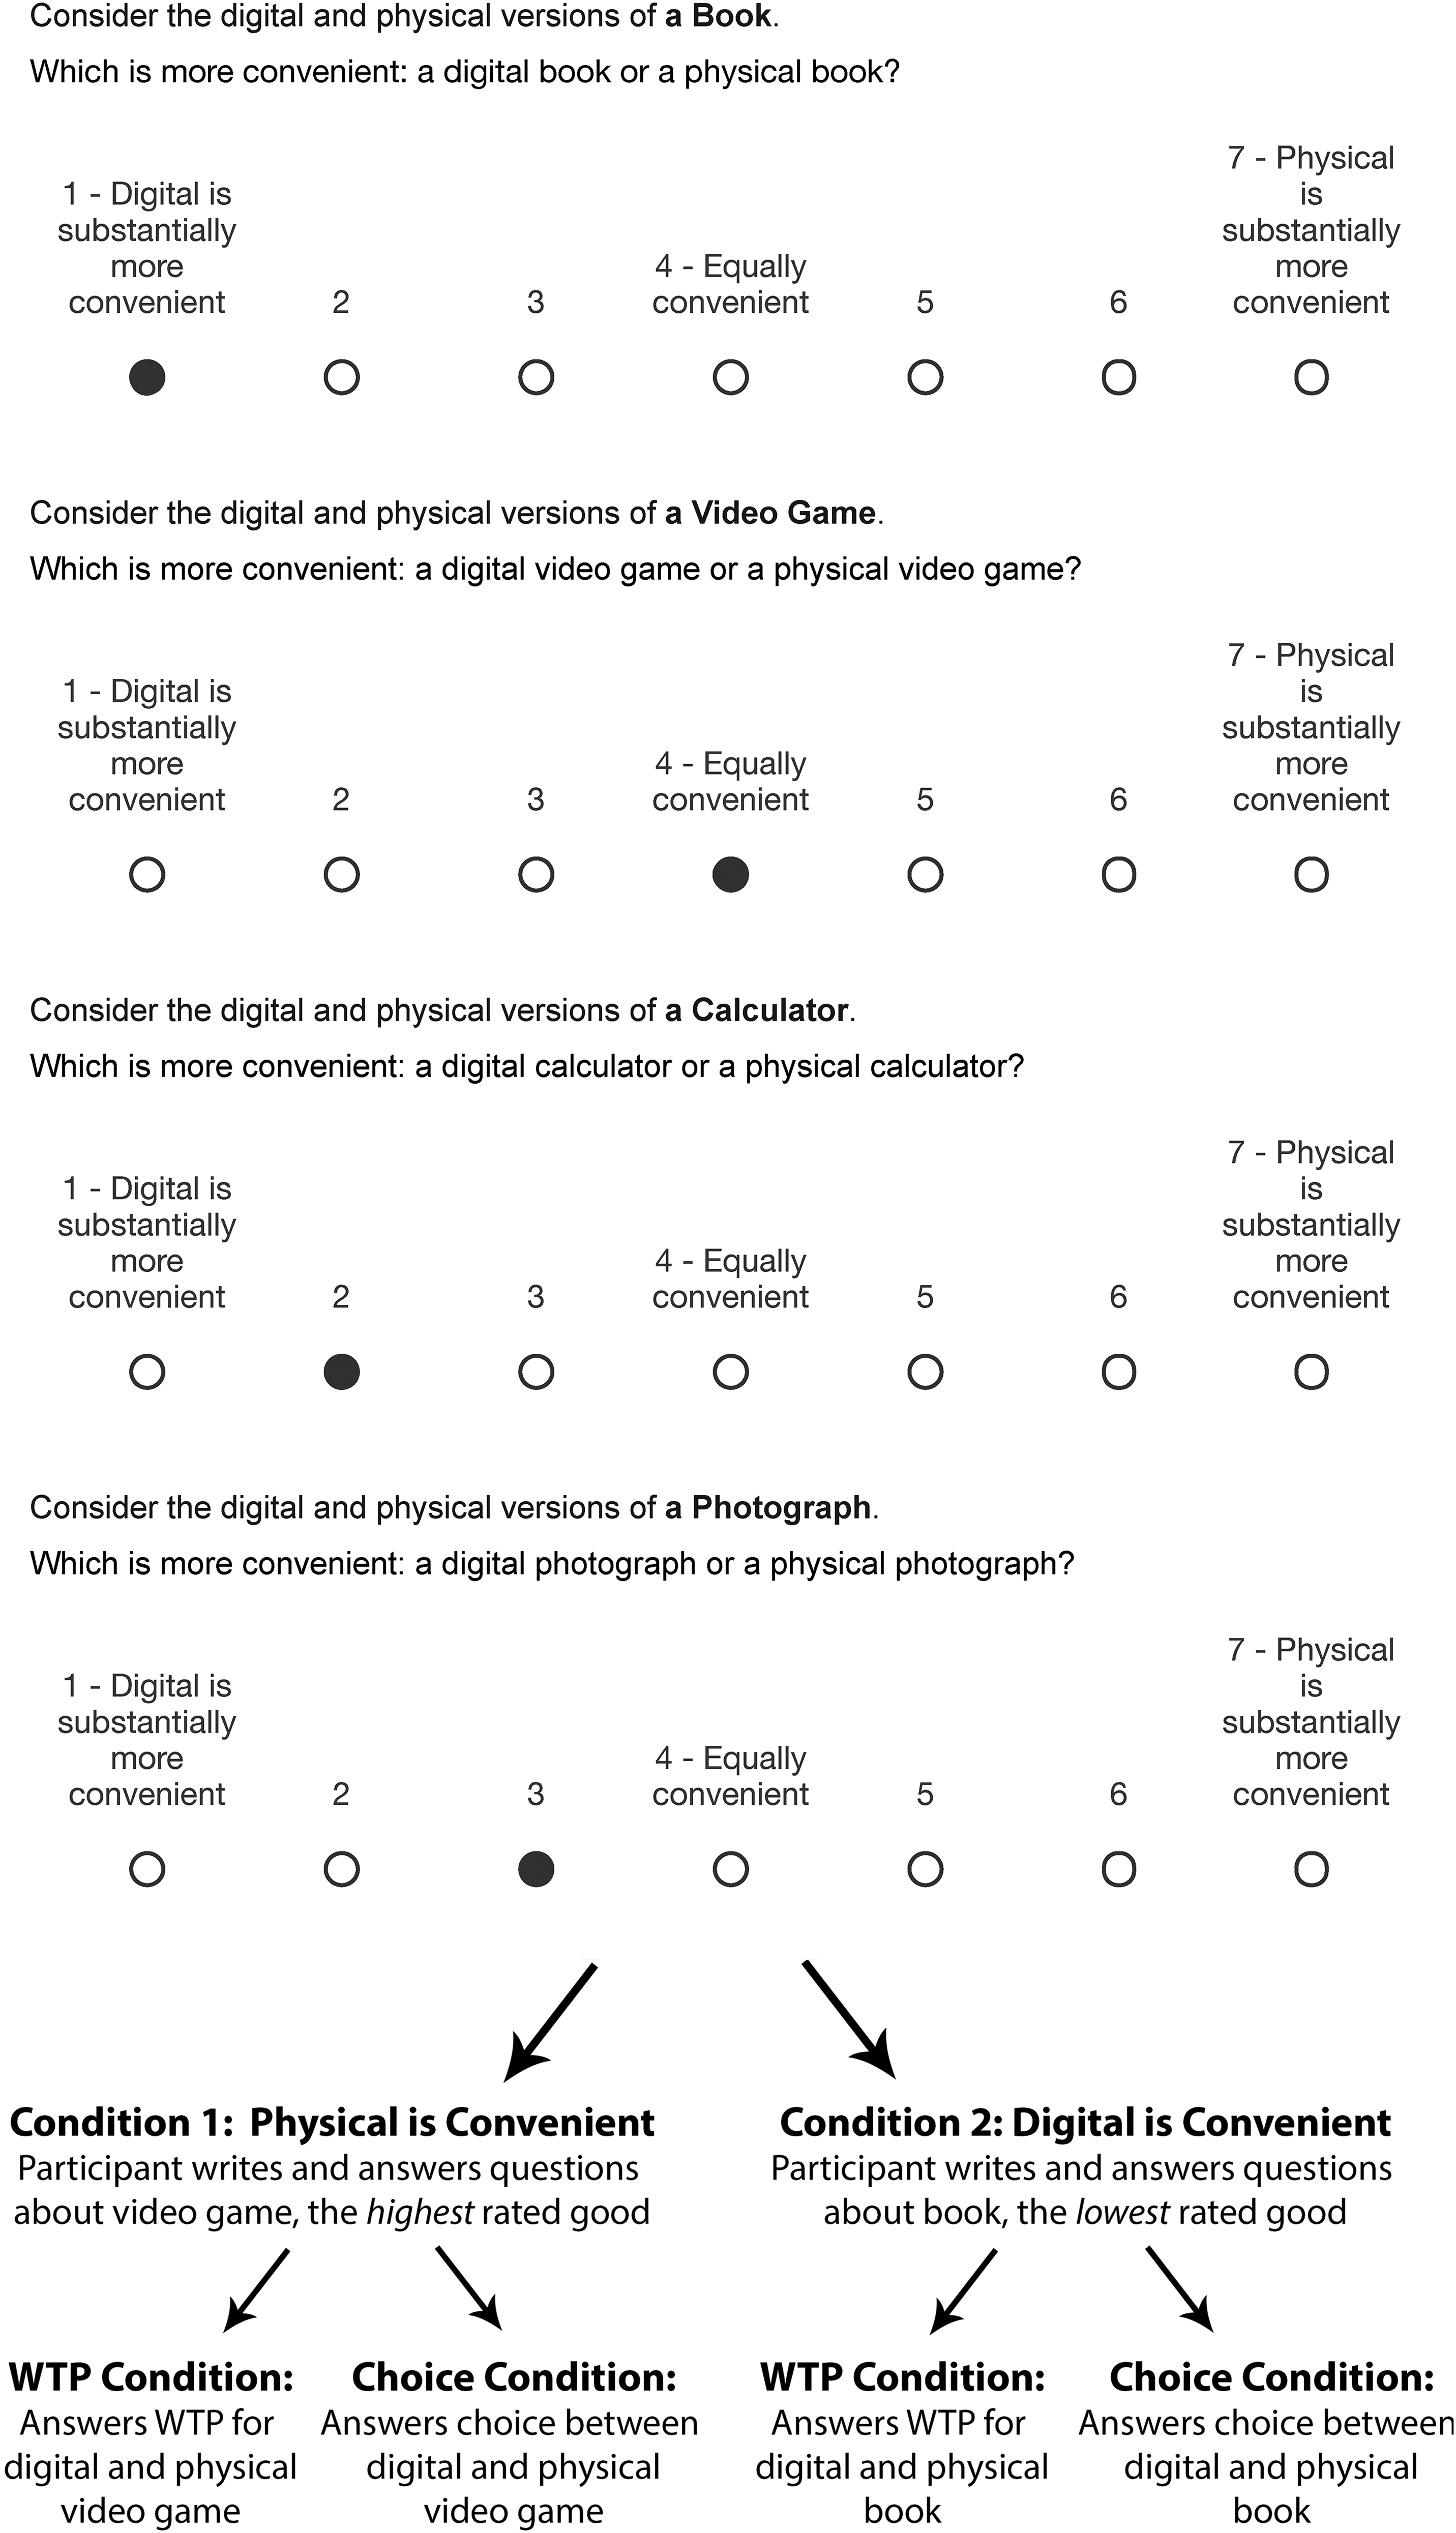
Sample participant study flow (Study 4).
Results
Confirming that our manipulation was effective, participants in the digital convenience condition believed that digital was more convenient compared with the physical convenience condition (M = 2.39, SD = 1.87), while participants in the physical convenience condition believed that physical was more convenient compared with the digital convenience condition (M = 4.74, SD = 1.92; t(624) = −15.5, p < .001). It is worth noting that in the physical convenience condition, physical and digital were viewed as equally convenient, rather than physical being viewed as significantly more convenient. This pattern is consistent with our other data suggesting that individuals overwhelmingly consider digital goods more convenient than their physical counterparts (e.g., 11 goods in pilot study, skimbles in Study 2). Thus, for this set of stimuli, we expect an attenuation of our effect rather than a full “flip” whereby individuals prefer physical more in choice than in WTP.
For our main analysis, we examined the interaction between elicitation condition (1 = WTP, 0 = choice) and convenience condition (1 = physical convenience, 0 = digital convenience). As predicted, we found a significant interaction between elicitation mode and convenience condition (b = −1.18, Z = −2.94, p = .003). In the digital convenience condition, we saw the standard preference reversal, such that in WTP 52.9% of participants preferred the physical good (47.1% digital), whereas in choice only 15.4% preferred the physical good (84.6% digital) (b = 1.82, Z = 6.67, p < .001). In the physical convenience condition, however, this effect was attenuated, such that in WTP 86.0% preferred the physical good (14.0% digital), and in choice 76.4% preferred the physical good (23.6% digital) (b = .64, Z = 2.19, p = .03).
Exploratory Analyses
In addition to our preregistered analyses, we also conducted the same exploratory analysis as outlined in Study 2, where we performed an ordinal logistic regression predicting relative preference for digital versus physical (−1 = digital, 0 = indifferent, 1 = physical; see footnote 2). As in previous analyses, the predictors used in the model were condition (1 = WTP, 0 = choice), which good was rated better on convenience (1 = digital, 4 = neither, 7 = physical), and the interaction of condition and convenience. First, consistent with our other studies the analysis revealed that individuals were more likely to prefer the physical good in WTP than in choice (b = 1.04, Z = 7.54, p < .001). Second, convenience predicted preference, such that individuals were more likely to prefer the physical good when they believed that it offered better convenience (b = .41, Z = 11.30, p < .001). Most germane to the prominence effect, this relationship was qualified by a significant interaction (b = −.38, Z = −5.12, p < .001): the good that was more convenient was a better predictor of preference in choice (b = .62, Z = 10.98, p < .001) than in WTP (b = .24, Z = 4.85, p < .001). 9 As in Study 2, these results are consistent with contingent weighting: in choice, the prominent attribute (convenience) looms larger than in WTP. In Supplemental Study 6, we present a conceptual replication of this finding.
Study 5: Contingent Weighting in WTP
Thus far, we have provided evidence that in choice between digital and physical goods, a qualitative decision task, respondents use the qualitative decision heuristic of prominence. Moreover, the preference for digital goods in choice is attenuated when the physical good, rather than the digital good, dominates on convenience (the prominent attribute). We argue that this alignment between task and decision heuristic is a manifestation of the compatibility principle (Tversky, Sattath, and Slovic 1988). In Study 5 we further explore the effect of compatibility on WTP. We argue that in WTP, a quantitative assessment, the relevant quantitative information that consumers use is market valuation. We test two factors that reflect valuation: a product's retail price (Study 5) and respondents’ beliefs about how much others would be willing to pay for the product (Study 6). To this end, in the current study we asked participants to estimate the product's retail price after the preference elicitation task. If consumers use this quantitative information in their WTP assessments (but not in choice), we would expect the difference between estimated prices of digital and physical goods to predict preferences only in the WTP condition. Finally, in this study we also rule out the possibility that the preference reversal is driven primarily by a lay belief that physical goods are more expensive to produce by controlling for the perceived cost of production for both goods.
Participants and Procedure
We recruited 504 participants (46.4% female; Mage = 34.6 years, SD = 9.7 years) online. We preexcluded all participants who indicated that they would not consider buying a video game for a discounted price (n = 88); we did not collect data from these participants. After removing those who failed the attention check (n = 27) and those who indicated indifference (n = 73), 316 responses remained.
At the outset, participants were asked to report the name of a video game that they did not own but would be interested in owning. Next, participants were assigned to one of two conditions: In the WTP condition, participants indicated their WTP for a physical and digital copy of the game, respectively. In the choice condition, participants were asked to choose between a physical copy of the game, a digital copy of the game, or indifference. After participants provided their WTP amounts and choices for the game, they were asked to provide their reference price and production cost estimates for its physical and digital copies. More specifically, all participants were asked the following (for each type of question, the order of physical vs. digital was randomly determined):
“How much do you think the total production cost of one physical hard copy of [video game] is?” “How much do you think the total production cost of one digital soft copy of [video game] is?” “How much do you think the retail price of one physical hard copy of [video game] is?” “How much do you think the retail price of one digital soft copy of [video game] is?”
Results
As in previous studies, participants in the WTP condition were more likely to indicate a preference for the physical copy (91.9% physical/8.1% digital) than participants in the choice condition (46.7% physical/53.3% digital) (χ2(1) = 72.0, p < .001, Cramer's V = .48).
To test our hypothesis that market beliefs predict WTP, but not choice, we ran an ordinal logistic regression (−1 = digital, 0 = indifferent, 1 = physical; see footnote 2) in which we regressed preference on condition (1 = WTP, 0 = choice), the difference in retail price estimates, and their interaction. 10 We calculated difference in retail price by subtracting the estimated retail price of the digital version from the estimated retail price of the physical version. We found a significant interaction, such that the difference in retail price between physical and digital predicted preference in WTP, but not in choice (b = .06, Z = 3.41, p < .001). More specifically, an analysis of the simple effects revealed that in the choice condition the difference in estimated prices did not significantly predict preference (b = −.017, Z = −1.69, p = .09). In contrast, in the WTP condition, the difference in the estimated price term did predict preference (b = .05, Z = 2.97, p = .003), demonstrating that beliefs about market prices played a role in WTP but not choice.
To rule out perceived production cost differences as the input to WTP judgments, we ran the same analysis but regressed preferences on the interactions between both the price and cost differentials. Specifically, we ran another ordinal logistic regression (−1 = digital, 0 = indifferent, 1 = physical) in which we regressed preference on condition (1 = WTP, 0 = choice), the difference in retail price estimates, the interaction between condition and price difference, the difference in cost estimates, and the interaction between condition and cost difference. We calculated difference in cost by subtracting the estimated cost of the digital version from the estimated cost of the physical version. The interaction between condition and estimated retail price differences persisted (b = .06, Z = 3.41, p < .001). As in the previous analysis, the difference in estimated prices did not predict preference in choice (b = −.015, Z = −1.54, p = .13) but did in WTP (b = .06, Z = 3.05, p = .002). However, there was no interaction between condition and estimated production cost on choice (b = −.005, Z = 3.41, p = .68). In other words, retail price matters more for WTP than for choice, but production cost does not.
Studies 6a and 6b: Moderation Through Compatibility
The purpose of Study 6 was threefold. First, we show our effect using scale formats that equate the kinesthetic properties of WTP and choice scales by requiring participants to use a slider to indicate their response regardless of the elicitation mode (Study 6a). Second, whereas in Study 5 we tested the role of respondents’ beliefs about retail price in WTP judgments, here we test the role of respondents’ beliefs about what others would be willing to pay for the product (Study 6a). Third, we provide more direct tests of the role of compatibility in WTP judgments. In Study 6a, we decrease compatibility by using a scale that requires verbal (rather than numerical) expressions of WTP amounts, thereby shifting preference away from the physical format. In Study 6b, we provide additional evidence for the compatibility account by adding another condition, purchase intentions (PI). Although PIs and WTP both represent an individual's willingness to make a purchase, the two differ in their compatibility with market valuations. Unlike WTP, PI is elicited on a scale from “not at all likely” to “extremely likely” and thus is not expressed on a scale compatible with market valuations. As a result, the compatibility account predicts that preferences elicited through PIs will show a shift in preference from physical to digital (similar to choice), as compared with WTP.
Study 6a Participants and Procedure
We recruited 1,019 participants online. Participants who indicated that they were not interested in purchasing a discounted video game (n = 215) were preexcluded, and we did not collect data from them. We randomly assigned 804 participants (48.1% female; Mage = 33.6 years, SD = 10.3 years), with 633 remaining in the analysis after removing those who failed an attention check (n = 82) and those who indicated indifference (n = 89). Participants in the WTP condition were assigned to one of two scale compatibility conditions. In the compatible-scale-WTP condition, participants responded to a continuous 100-point sliding scale measure anchored at $0 and $100, with additional dollar labels at $25, $50, and $75. Participants could express any dollar amount between $0 and $100. In the incompatible-scale-WTP condition, participants responded to the same continuous 100-point sliding scale measure, but instead of numeric dollar value labels, the sliding scale included five qualitative descriptions of numeric amounts: “nothing” (lowest anchor), “a little,” “a moderate amount,” “a lot,” and “a great deal” (highest anchor). Note that both scales for digital and physical were displayed and similarly aligned on the same screen, so that participants could easily reference the price they indicated for the first good when indicating their WTP for the second (we counterbalanced the order in which the goods appeared). Participants in the choice conditions were assigned either to a discrete scale with three options, as in our previous experiments, or to a continuous 100-point scale anchored by “Digital copy of video game” on one end, “Indifferent” in the middle, and “Physical copy of video game” on the other end. Thus, the continuous scale allowed respondents to express degree of preference. Web Appendix E displays the scales for compatible-scale-WTP, incompatible-scale-WTP, discrete-choice, and continuous-choice conditions.
After completing the preference elicitation task, participants used the same scale to predict how others would respond to the same question: “We are also interested in understanding how accurately people can predict the preferences of others. The following question will ask you about how you think other people (the general public) would respond to the same question that you just responded to about yourself.”
Study 6a Results
As in previous studies, participants in the compatible-scale-WTP condition were more likely to indicate a preference for the physical copy (80.9% physical/19.1% digital) than participants in the discrete-choice condition (49.0% physical/51.0% digital; χ2(1) = 31.3, p < .001, Cramer's V = .32). We found a similar preference shift toward digital between compatible-scale-WTP and choice when choice was expressed on a continuous scale (compatible scale WTP: 80.9% physical/19.1% digital; continuous choice: 59.1% physical/40.9% digital; χ2(1) = 16.3, p < .001, Cramer's V = .23).
We also found a significant difference between the two WTP scale conditions, such that individuals in the compatible-scale-WTP condition were more likely to indicate a preference for the physical copy (80.9% physical/19.1% digital) than participants in the incompatible-scale-WTP condition (52.2% physical/47.8% digital; χ2(1) = 25.95, p < .001, Cramer's V = .29). Thus, by manipulating compatibility we significantly attenuate the preference for the physical version in WTP. In fact, the incompatible scale wiped out the preference for physical over digital entirely (52.2% physical/ 47.8% digital; χ2(1) = .31, p = .58).
Correspondingly, the overall preference reversal between WTP and choice was significantly attenuated when comparing discrete choice with compatible scale WTP (χ2(1) = 31.3, p < .001, Cramer's V = .32) versus the comparison with incompatible scale WTP (χ2(1) = .20, p = .65, Cramer's V = .03, Z = 5.14, p < .001). The overall preference reversal was similarly attenuated when comparing continuous choice with compatible scale WTP (χ2(1) = 16.26, p < .001, Cramer's V = .23) versus the comparison with incompatible scale WTP (χ2(1) = 1.34, p = .25, Cramer's V = .06, Z = 2.87, p = .004). There was no significant difference between the two choice conditions (discrete choice: 49.0% physical/51.0% digital; continuous choice: 59.1% physical/ 40.9% digital; χ2(1) = 2.98, p = .08, Cramer's V = .09).
Next, we test the relationship between participants’ quantitative market beliefs and their WTP judgments. To make a direct comparison, we restrict our analysis to the compatible-WTP and continuous-choice conditions, which were both expressed on quantitative, continuous 100-point scales. Our analysis tests the degree to which the propensity to prefer physical over digital is related to respondents’ beliefs about others’ propensity to do the same. To this end, we first calculated the difference between WTP for physical and digital for both self and others’ valuations (in the choice condition, participants provide one response that reflects their propensity, so no transformation is required). Next, we standardized these propensity scores. 11 Finally, we regressed self-preference for physical over digital (standardized propensity score) on others’ predicted preference (standardized propensity score), condition (1 = WTP, 0 = choice), and the interaction between others’ predicted preference and condition. The results revealed a significant interaction between others’ predicted preference and condition (b = −.19, Z = −2.10, p = .036). Specifically, beliefs about others’ valuations were related to respondents’ reported preference for physical over digital to a greater extent in WTP (b = .46, Z = 7.30, p < .001) than in choice (b = .27, Z = 4.45, p < .001). In Web Appendix D (Study 6a replication) we present a replication of Study 6a with a different stimulus.
Study 6b Participants and Procedure
One thousand respondents (Mage = 25.2 years, SD = 8.0 years; 79.8% female) participated in a survey on preferences on Prolific Academic. After we excluded participants who failed an attention check (n = 52), 948 participants remained. The procedure of Study 6b mimicked Study 1a but included a third condition for PIs. First, participants indicated (1) a music album that they would consider buying, (2) a video game they would consider buying, and (3) a celebrity whom they would like to take a photo with. Participants then indicated their preference (using choice, WTP, or PI) for each of five goods: NYT, Star Wars: The Empire Strikes Back (used in Atasoy and Morewedge 2018, Experiment 3), the previously identified music album, the previously identified video game, and a photo with the previously identified celebrity.
In the PI condition, we asked participants to “Imagine that you have the opportunity to purchase a subscription to the New York Times in either the physical or digital format, for the same discounted price.” Then, we asked participants “How likely would you be to purchase a [physical/digital] one year subscription to the NYT at the discounted price?” (1 = “very unlikely,” and 7 = “very likely”). We classified participants in the PI condition into categories in the same way as WTP. Participants were classified as preferring the digital version if their PI for that version was higher than for its physical counterpart, and vice versa for the physical version. Participants indicating equal PIs were classified as indifferent.
After completing the main survey task, participants also indicated the identity relevance of the stimuli in the study using a measure adapted from Atasoy and Morewedge (2018). We told participants, “People vary on the extent to which they see different things as part of their personal self identity. Please indicate the extent to which you consider each of the following products part of your self” (1 = “not at all part of my self,” and 7 = “very much part of my self”). Participants answered this question for the NYT, Star Wars, the previously identified music album, the previously identified video game, and a photo with the previously identified celebrity. These data were used in exploratory analyses that we detail in the “General Discussion” section.
Study 6b Results
Following our preregistration, we compared choice with WTP and PI with WTP using chi-squares. We found a significant preference shift or reversal between WTP and choice, and WTP and PI, for all five stimuli. For NYT, 85.9% indicated a higher WTP for physical (14.1% digital), but only 30.9% chose physical (69.1% digital; WTP vs. choice: χ2(1) = 146.38, p < .001, V = .55), and only 20.7% indicated greater PI for physical (79.3% digital; WTP vs. PI: χ2(1) = 166.06, p < .001, V = .65). For Star Wars, 85.5% indicated a higher WTP for physical (14.5% digital), while only 39.9% chose physical (60.1% digital; WTP vs. choice: χ2(1) = 83.47, p < .001, V = .46), and only 40.5% indicated greater PI for physical (59.5% digital) (WTP vs. PI: χ2(1) = 66.76, p < .001, V = .46). For the album, 88.1% indicated a higher WTP for physical (11.9% digital), but only 55.2% chose physical (44.8% digital; WTP vs. choice: χ2(1) = 68.82, p < .001, V = .36), and only 45.9% indicated greater PI for physical (54.1% digital; WTP vs. PI: χ2(1) = 93.26, p < .001, V = .45). For the video game, 78.9% indicated a higher WTP for physical (21.1% digital), while only 39.9% chose physical (60.1% digital; WTP vs. choice: χ2(1) = 67.78, p < .001, V = .38), and only 27.5% indicated greater PI for physical (72.5% digital; WTP vs. PI: χ2(1) = 93.49, p < .001, V = .51). Finally, for the photo, 78.2% indicated a higher WTP for physical (21.8% digital), while only 44.6% chose physical (55.4% digital; WTP vs. choice: χ2(1) = 49.59, p < .001, V = .33), and only 54.6% indicated greater PI for physical (45.4% digital; WTP vs. PI: χ2(1) = 16.5, p < .001, V = .24). Thus, the results supported our prediction that PIs would resemble choice rather than WTP.
General Discussion
We document a new instantiation of preference reversals in which consumers price physical goods higher than digital goods in WTP judgments, but prefer digital goods relatively more often in direct choice. This preference reversal occurs across a variety of goods including both real products (Studies 1a, 2–6) and fictitious products (Study 2). Moreover, we show that this reversal occurs for incentive-compatible choices, by using the well-established BDM procedure in which a subset of participants receives their chosen option (Study 1b, Supplemental Study 4). This reversal can be explained by contingent weighting. In particular, we show that in choices between digital and physical goods, the most important attribute is convenience, which favors the selection of a product's digital version (Studies 1–4). Thus, the preference reversal is moderated when digital does not dominate on the prominent attribute (Study 4). WTP judgments, however, are associated with dimensions that are compatible with this elicitation mode, specifically, market valuations such as a product's retail price (Study 5) and beliefs about other consumers’ WTPs (Study 6). We moderate the preference for physical goods in WTP—and consequently the overall choice–WTP preference reversal—by using a nonquantitative monetary scale (Study 6).
Tables 1 and 2 summarize these results. Of the 29 comparisons in Table 1 where a preference shift was predicted, 21 constitute “full” reversals (72%) and 8 constitute “partial” reversals (28%)—and all 29 preference shifts are significant at p < .001. Using a more conservative test including indifference (and considering only cases where the 50% preference point is crossed for either digital or physical), 18 constitute “full” reversals (62%) and 11 constitute “partial” reversals (38%)—and all 29 comparisons remain significant at p < .001. When indifference is included, in choice, physical is preferred by greater than 50% of individuals in only 6 out of 29 comparisons (i.e., 21% of the time).
It is worth noting that when there is a difference in participants excluded due to indifference across conditions, there is almost always more indifference in WTP than choice (Studies 1a, 1b, 2, and 6; Supplemental Study 4; and some stimuli in Supplemental Studies 5 and S6; see Table W5-c). However, across all analyses, the reported preference reversal persists and remains significant when indifferent participants are included in the analysis. Moreover, although preferences elicited through purchase intent (Study 6b) lead to more indifference than WTP, purchase intent resembles choice rather than WTP, consistent with a prominence account. Similarly, although incompatible WTP leads to greater indifference than compatible WTP (Study 6a), incompatible WTP also resembles choice rather than WTP, suggesting that indifference is likely not a primary driver of the effect.
Role of Ownership
Previous research argues that individuals value physical goods over digital goods, and that this occurs because physical goods confer a greater sense of ownership (Atasoy and Morewedge 2018). In our studies, we replicate this effect of ownership and its connection with valuation of physical goods. However, when we consider the additional attributes that we measure in our studies—in particular, convenience and market valuations—we find that these attributes can systematically carry greater weight in people's preferences than sense of ownership. Specifically, convenience carries greater weight in choice tasks, and market valuations carry greater weight in WTP. Unlike convenience and market valuations, whose importance is contingent on elicitation mode, ownership exerts a similar effect on preferences regardless of how preference is assessed.
Convenience, market valuations, and ownership can combine to influence preference either in the same or in opposite directions depending on elicitation mode. In choice tasks, convenience and ownership work in opposing directions: whereas digital products are more convenient, physical products confer greater ownership. These opposing forces create a trade-off that attenuates the value of physical goods. In contrast, in WTP tasks, market valuations and ownership work in tandem: physical products are perceived as both having greater market value and conferring greater ownership. These combined forces enhance the perceived value of physical goods, as is reflected in Atasoy and Morewedge’s (2018) finding that physical goods are valued more than digital goods. The preference reversal we observe is the result of this combination of synergistic versus opposing forces. We expect to observe full reversals in categories where ownership plays a relatively less important role in the preference for the product. However, in categories where ownership is relatively more important, we expect to observe partial reversals wherein physical is preferred to digital, with elicitation mode affecting only the magnitude of this preference.
Drawing on the forces described previously, we would expect our preference shift to be smaller for purchases that confer greater ownership. Prior work suggests that ownership is relatively more important for goods that are identity relevant (Atasoy and Morewedge 2018). Therefore, we tested the relationship between identity relevance and our preference reversal or shift in Study 6b by asking participants how identity relevant each stimulus was. Consistent with this account, as identity relevance increased, the size of our preference reversal decreased (Table 4). As a concrete example, one stimulus where we often observe partial reversals is a photograph with a celebrity, which was rated as more identity relevant than the other stimuli we used. This identity relevance implies a greater importance for ownership (Atasoy and Morewedge 2018). For WTP, we expect a strong preference for physical: the compatible attribute (market beliefs) favors physical, the moderately important variable ownership favors physical, and the moderately important variable convenience favors digital. In contrast, for choice, we expect physical and digital to be much more similarly valued: the most important and compatible attribute (convenience) favors digital, whereas the moderately important variable (ownership) and the less important variable (market beliefs) both favor physical. Thus, because these forces push in opposite directions, and ownership is somewhat important, we see smaller effect sizes (and sometimes partial reversals) for less identity-relevant goods.
Relationship Between Product Attributes and Preference Reversals.

Notes: Numbers in brackets indicate 95% confidence interval.
In addition to being consistent with Atasoy and Morewedge’s (2018) model, this proposition is also consistent with the data they present. In their Study 4, when identity relevance of the stimulus (in their case, Star Wars) is ranked greater than 6.74/10, people prefer physical. However, when identity relevance was ranked less than 6.74, the authors observe no difference between digital and physical. Moreover, when identity relevance was ranked below 4.5, their model predicts that digital should be preferred in PI (Figure 2). Taken together, these findings converge to suggest that “full reversals” are likely to occur when ownership is less important, whereas “partial reversals” are more likely to occur when ownership is relatively more important. There is always a preference shift from physical toward digital in choice (and PI) relative to WTP. However, this shift is less likely to push individuals across the 50% line when ownership is important, thereby increasing preference for physical across conditions.

Figure 6 from Atasoy and Morewedge (2018): Intention to purchase The Empire Strikes Back by product format and identity relevance of the Star Wars series.
Practical Implications
Social proof
Studies 5 and 6 suggest that whether market beliefs correspond to judgments is contingent on elicitation mode. In particular, people appear to rely on their beliefs about other consumers’ valuations when assessing their own valuations, but not when making choices. We surmise that, in WTP, respondents substitute the internally focused question of “How much is this worth to me?” with the easier, externally focused questions of “How much does this cost to purchase?” (see Study 5) or “How much do people pay for this?” (see Study 6; Kahneman and Frederick 2002). In contrast, in choice, participants simplify the task by using a lexicographic strategy that does not require external considerations. Thus, our results are a manifestation of pluralistic ignorance: in WTP, people assume an underlying preference in the market that does not correspond to people's actual choices. One implication of this observation is that social proof may serve as a stronger input for WTP than for choice. Firms trying to close the valuation gap between digital and physical goods might consider alluding to the degree to which other consumers in the market are willing to pay for their digital product.
Highlighting convenience
Atasoy and Morewedge (2018) conclude that people's greater WTP for the physical version of goods implies that they value physical goods more than digital ones. Although our studies confirm that consumers indicate higher WTP for physical goods than their digital counterparts, our studies also suggest that these valuations do not necessarily correspond with underlying preferences. When given a choice, even one that requires payment (as in Supplemental Study 4), our participants were often more likely to choose the digital version over the physical version or to choose digital and physical at similar frequencies. Moreover, when we elicited WTP using verbal expressions of amounts, the preference for the physical good was significantly attenuated (Study 6). The higher WTPs for physical goods that Atasoy and Morewedge report are likely bolstered by a compatibility effect and may not indicate as meaningful an underlying difference in overall valuation between digital and physical goods as might initially appear.
In their experiments, Atasoy and Morewedge (2018) also demonstrate that the higher WTP for physical goods is due to the sense of ownership conferred by their materiality. The authors conclude that in order to increase the perceived value of digital goods, firms have to increase consumers’ sense of ownership of these goods, perhaps by increasing the degree to which a digital good has a physical appearance (e.g., Apple's digital books displayed on a virtual wooden shelf; Atasoy and Morewedge 2017, 2018). Although we find that the importance of ownership is indeed a factor that predicts the preference (choice and WTP) for physical goods, in both our pilot study and Study 3, convenience was consistently rated above any other attribute. Based on these findings, it is reasonable to believe that for digital goods, rather than focusing on the physicality and emphasizing ownership as Atasoy and Morewedge (2017, 2018) suggest, highlighting the importance of convenience may represent a greater return on marketing investment. In contrast, for physical goods, our results suggest that enhancing the perceived importance of ownership and touch—which are otherwise perceived as less important—is likely to increase choice probability.
Further potential evidence for this proposition comes from examining the effect size for different goods tested across our studies. Some of our goods with the smallest effect size include photographs (V = .24) and books (V = .30); movies show a moderate effect size (V = .39); and video games (V = .41, .48), music (V = .55), and NYT (V = .48, .49, .56) show the largest effect sizes. In reexamining the results of Supplemental Study 1, we observe that the effect size seems to correspond to the size of the gap between the most important and second most important attributes. In other words, the more prominent the “prominent” attribute is, the greater its effect—consistent with contingent weighting. Thus, by further emphasizing this prominent attribute, companies may be able to increase choice probability. Additional research is necessary to explore this possibility.
Horizontal differentiation
Although our studies suggest ways to increase the purchase rates of physical versions of a good, the results we report also indicate that the attributes that consumers consider most important are often ones that digital goods dominate on. Thus, there may be welfare gains by encouraging consumers to purchase the digital version of a good because it is more likely to align with the aspects that they consider important. Rather than highlighting the similarities between the product formats, as recommended by Atasoy and Morewedge (2017), one way to achieve this shift may be to make salient the different benefits that digital formats offer relative to physical ones. An added advantage of emphasizing the unique differentiators of digital formats—rather than the more common practice of emphasizing the interchangeability of digital and physical—is that such an emphasis on differentiation may dilute the perceived importance of ownership, touch, and materiality in the valuation of digital products. In summary, horizontally differentiating digital products rather than positioning them as mere substitutes for their physical counterparts will enable consumers and firms to reap the full benefits of digitization.
Supplemental Material
sj-pdf-1-mrj-10.1177_00222437211065020 - Supplemental material for Preference Reversals Between Digital and Physical Goods
Supplemental material, sj-pdf-1-mrj-10.1177_00222437211065020 for Preference Reversals Between Digital and Physical Goods by Rhia Catapano, Fuad Shennib and Jonathan Levav in Journal of Marketing Research
Footnotes
Associate Editor
Ann Schlosser
Declaration of Conflicting Interests
The author(s) declared no potential conflicts of interest with respect to the research, authorship, and/or publication of this article.
Funding
The author(s) received no financial support for the research, authorship and/or publication of this article.
Notes
References
Supplementary Material
Please find the following supplemental material available below.
For Open Access articles published under a Creative Commons License, all supplemental material carries the same license as the article it is associated with.
For non-Open Access articles published, all supplemental material carries a non-exclusive license, and permission requests for re-use of supplemental material or any part of supplemental material shall be sent directly to the copyright owner as specified in the copyright notice associated with the article.