
Abstract
Business-to-business (B2B) companies devote significant resources to measure customer satisfaction but lack guidance on critical aspects of implementing satisfaction programs. Accordingly, executives ask: (1) What are the key strategic attributes driving B2B customer satisfaction? (2) Are the strategic attributes satisfaction balancing, satisfaction maintaining, or satisfaction enhancing based on the pattern of asymmetry? (3) Do the sign and magnitude of asymmetry vary across industry and customer subgroups? and (4) Is there a generalizable link between satisfaction and financial performance for B2B firms? Study 1 uses qualitative and secondary research to identify and validate eight strategic attributes pertinent to B2B companies: quality of product/service, pricing, safety, sales process, project management, corporate social responsibility, communication, and ongoing service and support. Study 2 examines industry-subgroup heterogeneity in the nature of asymmetry across industries, then links satisfaction with performance (i.e., sales). Study 3 finds customer-subgroup heterogeneity in the nature of asymmetry within the customer base of a B2B service provider, then links satisfaction with performance (i.e., dollar value of purchase).
Executives at a facilities-management company with over $25 billion in revenue and more than 50,000 sites under management sought to develop a customer-driven strategy. From customer satisfaction surveys at its largest facilities, they summarized the highest- and lowest-rated attributes. The survey shows relatively high ratings for product quality and pricing, but low ratings for safety and social responsibility. How can executives use these results to increase customer focus and also predict sales and revenues?
This scenario pervades many business-to-business (B2B) companies, which generated $9.17 trillion of revenue in 2018, accounting for about 51% of the 2018 U.S. economy (Bonde et al. 2019). In an internal survey of 25 senior executives of the facilities-management company, only 49% of the executives believed customer satisfaction was associated with financial outcomes and 67% underestimated the potential financial benefits of improving customer satisfaction. To the chief executive officer’s (CEO’s) chagrin, 100% of the senior executives were unable to correctly describe the strategic attributes contributing to customer satisfaction, their weights in determining overall customer satisfaction, and how their functional form may differ among customer groups. Most executives assumed that safety had the highest weight in determining overall customer satisfaction with a monotonically increasing relationship. When the largest driver of customer satisfaction turned out to be ongoing service and support, the CEO undertook a complete overhaul of the company’s strategy to grow sales and margins through customer value. Thus, desired and actual outcomes of B2B companies’ customer satisfaction programs shows a clear gap (Thompson 2015).
Our study addresses these gaps in practice by answering four research questions: (1) What key strategic attributes drive B2B customer satisfaction? (2) Are these strategic attributes satisfaction balancing, satisfaction maintaining, or satisfaction enhancing based on their link with overall satisfaction? (3) Is the link context-dependent across industry and customer subgroups? and (4) Is there a generalizable link between customer satisfaction and financial performance in B2B markets? These research questions correspond to four critical issues identified in semistructured interviews with executives of B2B firms (see Study 1) and an extensive review of the literature on customer satisfaction in the B2B domain (see Table 1).
Literature Review: Empirical Marketing Studies on B2B Customer Satisfaction.

a The proportion does not include the current study.
Notes: Web Appendix Q provides the list of references.
First, as Table 1 shows, there is a paucity of research regarding the unique and specific attributes pertaining to B2B customers’ satisfaction. Frennea and Mittal (2017) found that only 27 of the 400 published articles (7%) on attribute-level customer satisfaction in the last two decades pertained to a B2B context. Examining the attributes in these 27 studies (see the last row in Table 1) shows a disproportionate use of quality (85% of the studies), sales process (52%), pricing (44%), and communication (44%). Very few studies examine safety (4%) and project management (4%), and none have examined ongoing service and support (0%) or corporate social responsibility (0%). Unlike consumer contexts, B2B interactions involve a buying center with complex and technical offerings (Grewal et al. 2015), making it unlikely that pricing and quality can adequately explain overall customer satisfaction. Our research identifies and validates eight key strategic attributes pertinent to B2B customer satisfaction (see Table 1). This comprehensive set of strategic attributes provides a meaningful conceptual framework for B2B firms to conceptualize attribute-level components of customer satisfaction. 1
Second, 85% of the B2B studies in Table 1 assume that attributes are satisfaction balancing, demonstrating symmetry such that a unit increase in attribute satisfaction has the same association with overall satisfaction as a unit decrease in attribute satisfaction. Perhaps this is because most investigations of attribute asymmetry have used consumer contexts (e.g., Anderson and Sullivan 1993; Mittal, Ross, and Baldasare 1998). Rather than assuming that most attributes are symmetric, there is a need to acknowledge both positive and negative asymmetry in the association that attributes have with overall satisfaction. Satisfaction-maintaining (enhancing) attributes display negative (positive) asymmetry such that the association between a unit decrease in attribute satisfaction and change in overall satisfaction is disproportionately larger (smaller) than the association between a unit increase in attribute satisfaction and change in overall satisfaction. As an example, Study 2 shows that (1) quality, communication, and ongoing service and support are satisfaction-maintaining attributes; (2) pricing, safety, and project management are satisfaction-balancing attributes; and (3) sales process and corporate social responsibility (CSR) are satisfaction-enhancing attributes. Study 3 shows that (1) pricing and project management are satisfaction maintaining; (2) quality, CSR, communication, and ongoing service and support are satisfaction balancing; and (3) safety and sales process are satisfaction enhancing attributes. As we discuss next, this is a key contribution showing the context-dependent nature of attributes in driving overall satisfaction.
Third, prior work on attribute asymmetry in a satisfaction context assumes the nature of asymmetry for an attribute is invariant to context. Mittal, Ross, and Baldasare (1998) as well as Anderson and Sullivan (1993) assumed that all attributes are satisfaction maintaining, showing negative asymmetry. However, there may be heterogeneity in the sign (satisfaction balancing, satisfaction maintaining, or satisfaction enhancing) and magnitude (low, high) of asymmetry across industry or customer subgroups (Oliver and DeSarbo 1988). Two decades ago, Anderson and Mittal (2000, p. 112) stated, “Attention should also be paid to segment-wise differences in the nature of the attribute.” Addressing this gap, Study 2 investigates heterogeneity across industry subgroups, while Study 3 examines differences across customer subgroups of a single company. Thus, pricing was satisfaction maintaining for one customer group but satisfaction balancing for another customer group. Rather than assuming that attributes are always satisfaction maintaining or satisfaction enhancing, executives need to clearly understand the changing nature of attributes across industries, customer groups, and other contexts. Conceptually, the current article takes an “empirical path” (McGrath and Brinberg 1983, p. 120) using multiple “set(s) of observations” to more thoroughly examine the empirical evidence on heterogeneity across attributes, industry subgroups, and customer subgroups.
Fourth, only three studies in Table 1 (11%) link customer satisfaction to financial outcomes in a B2B context: customer margin (Bowman and Narayandas 2004) and share-of-customer sales (Ahearne, Jelinek, and Jones 2007; Van Doorn and Verhoef 2008). As one senior B2B executive noted, “If upper management sees…cost savings or revenue gains it will garner some attention. This is more persuasive than industry trends…or believing it is the ‘right thing to do’” (Thompson 2015). Answering this call, Study 2 shows a one-point increase in satisfaction for an average company that is associated with a 12.96% increase in sales (worth $2.25 billion).
Our conceptual framework encompasses these four issues (Figure 1) and guides our studies (Table 2). Study 1 uses in-depth interviews and focus groups among managers, and content analysis of Form 10-Ks of the top 50 publicly traded B2B companies to validate eight strategic attributes used in subsequent studies. Study 2 examines industry-specific differences using surveys from 11,451 managers at customer firms of 1,785 public B2B firms in 25 industries from January 2017 to June 2019. Study 3 examines customer-subgroup-specific differences using a sample of 4,072 customers of a national service supplier.

Improving B2B customer satisfaction programs: assessment of asymmetry, heterogeneity, and financial impact.
Overview of the Current Studies

Attribute-Level Satisfaction in B2B Markets: Background
From a theoretical perspective, we argue that the application of previous typologies of classifying attributes as core or augmented (Kotler and Armstrong 2010), satisfier or dissatisfier (Anderson and Mittal 2000), or core versus peripheral (Churchill and Surprenant 1982) may need to be modified. Typically, attributes that have a larger (smaller) weight in determining customer value are seen as core (peripheral) attributes. However, as we argue subsequently, the weight of an attribute can be context dependent and may shift for different groups. Similarly, rather than being a satisfier or dissatisfier in all situations, an attribute’s disposition may also shift. The theoretical issues then pertain to understanding when and why attributes may be satisfaction balancing, enhancing, or maintaining, rather than classifying an attribute using a unilateral typology. More generally, this discussion suggests the need for surfacing and validating a set of attributes that apply to different B2B contexts and explicitly acknowledging that their weight and nature—balancing, maintaining, or enhancing—may vary in ways that cannot be specified a priori for each industry or customer subgroup.
Asymmetric Link Between Attribute-Level Satisfaction and Overall Satisfaction
The multiattribute model conceptualizing overall customer satisfaction as a compensatory function of attribute-level satisfaction is a cornerstone of customer satisfaction research (Churchill and Surprenant 1982; LaTour and Peat 1979; Mittal, Kumar, and Tsiros 1999; Oliver 2014). Theoretically, the multiattribute satisfaction model postulates that a customer’s satisfaction judgment about an attribute determines overall satisfaction in conjunction with satisfaction judgment about other attributes (LaTour and Peat 1979; Oliver 2014).
The original model assumes attributes as satisfaction balancing, such that there is a symmetric association between attribute and overall satisfaction. In other words, a unit increase in attribute satisfaction has the same association with overall satisfaction as a unit decrease in attribute satisfaction. Subsequent scholarship proposed the possibility of positive and negative asymmetry (Mittal, Ross, and Baldasare 1998).
Satisfaction-maintaining attributes (Anderson and Mittal 2000) demonstrate a negatively asymmetric relationship with overall satisfaction and are also called “dissatisfiers” (Friedlander 1964). In the case of a satisfaction-maintaining attribute, the association between a unit decrease in attribute satisfaction and change in overall satisfaction is disproportionately larger than the association between a unit increase in attribute satisfaction and change in overall satisfaction. This may occur in many cases where negatively valenced information is weighted disproportionately more than positively valenced information because negative information is processed more systematically (Baumeister et al. 2001; Ito et al. 1998).
Satisfaction-enhancing attributes (Anderson and Mittal 2000) exhibit positive asymmetry and are also called “satisfiers” or “delight attributes” (Oliver, Rust, and Varki 1997). For satisfaction-enhancing attributes, the association between a unit decrease in attribute satisfaction and change in overall satisfaction is disproportionately smaller than the association between a unit increase in attribute satisfaction and change in overall satisfaction. Theoretically, this may occur due to customer delight. Parasuraman et al. (2021) examined antecedents of delight and found that in 80% of the cases, customers experienced delight because of arousal-inducing positive emotions (e.g., elation, surprise), interpersonal interactions, and problem resolution efforts.
Early scholarship assumed that an attribute is always satisfaction balancing, maintaining, or enhancing. It was assumed that the potential symmetry or asymmetry between attribute satisfaction and overall satisfaction was invariant across industries, across customers, and over time (e.g., Anderson and Mittal 2000; Mittal, Ross, and Baldasare 1998). Yet, this may not be the case with variation based on (1) the attribute itself, (2) industry subgroups, and (3) customer subgroups. Figure 2 and Table 3 summarize this issue as discussed next.
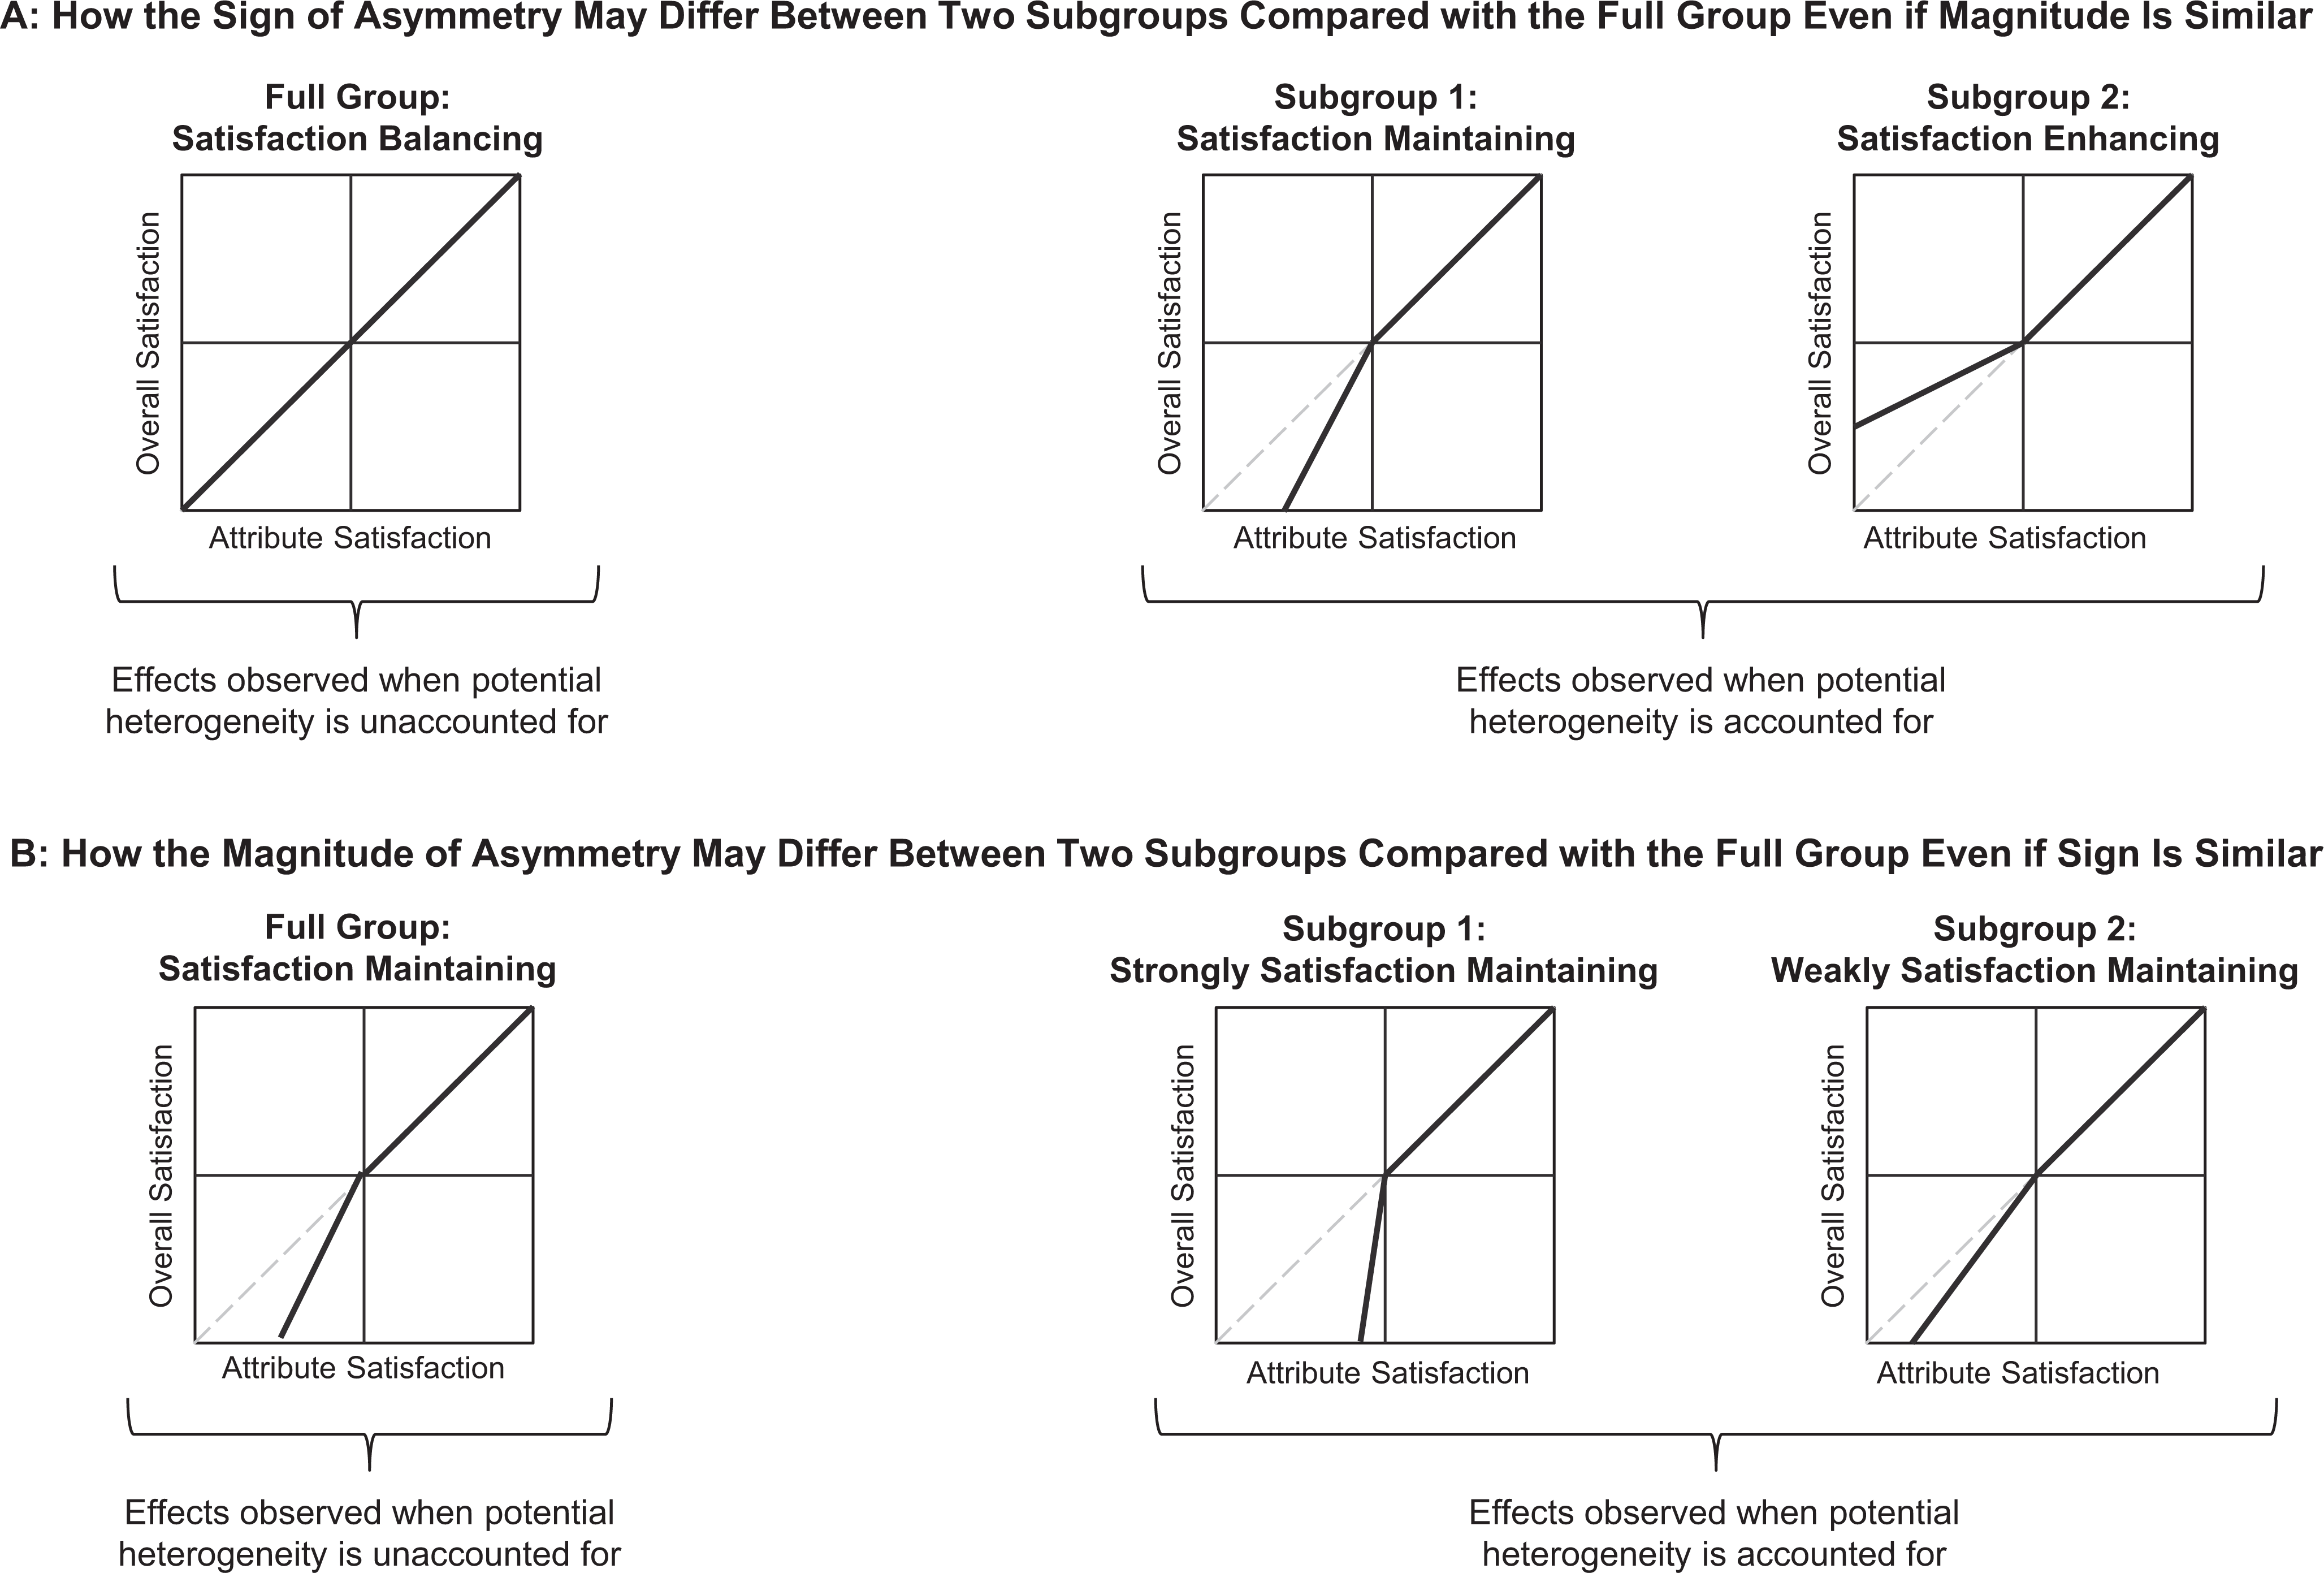
Theoretical illustration of heterogeneity in the sign and magnitude of asymmetry.
Source of Heterogeneity in the Sign and Magnitude of Asymmetry.

Heterogeneity in Satisfaction Balancing, Maintaining, and Enhancing Attributes
An attribute need not always be satisfaction balancing, satisfaction maintaining, or satisfaction enhancing. In the transportation industry, Van Doorn and Verhoef (2008) found that attributes were satisfaction maintaining among customers who experienced critical service incidents but were satisfaction balancing otherwise.
According to Rust and Oliver (2000), a satisfaction-enhancing attribute can migrate into a satisfaction-maintaining attribute if delight gives way to an expectation that the attribute is a must-have. Due to factors such as change in customer expectations, industry norms, or competitive offerings, “after the delight element has faded and symmetric effects are observed, the attribute further develops into a negative asymmetry” (Falk, Hammerschmidt, and Schepers 2010, p. 290). Further, an attribute is more likely to be satisfaction maintaining when it is offered by multiple competitors and becomes the basis of competition in an industry and is seen as the industry norm. Thus, the quality of equipment is satisfaction balancing for banking services but satisfaction maintaining for dental services (DeSarbo et al. 1994). Consistent with competitor effects, Bowman and Narayandas (2004) found both satisfaction-balancing and satisfaction-maintaining associations between attribute satisfaction and overall satisfaction, the latter occurring when competitors were better than the focal company on an attribute.
The magnitude of asymmetry can vary based on customer characteristics (Danaher 1998), usage situation (DeSarbo et al. 1994), and tenure with a brand (Mittal, Kumar, and Tsiros 1999). As an example, after the initial car purchase, the association of attribute satisfaction with overall satisfaction increased over time for attributes such as brakes but decreased for attributes such as transmission and roominess (Mittal, Kumar, and Tsiros 1999). Unless explicitly modeled, the extent of heterogeneity may be masked as shown in Figure 2. Panel A masks the heterogeneity in two subgroups with opposing asymmetries; executives may incorrectly presume that the attribute is satisfaction balancing for the full group. Panel B shows that the magnitude of asymmetry may differ between two subgroups compared with the full group even if the sign is similar.
Industry Subgroups as a Source of Heterogeneity: Cross-Sectional and Temporal Variation
Among B2B customers, differences in interfirm relationships (e.g., cooperation and trust; Palmatier et al. 2006), customer life cycle stage (Jap and Anderson 2007), and industry structure (e.g., Anderson 1994) can affect customers’ knowledge about and experience with attribute benefits. For example, safety is an important attribute in manufacturing, but its importance in commercial services has been recognized only recently (Ingram and Kent 2019). Anderson and Mittal (2000) highlight that the nature of asymmetric patterns may change over time (i.e., temporal variation), differ across customer segments and markets (i.e., cross-sectional variation), and vary due to competition. Specifically, industry competition and proportion of services firms in the industry may capture cross-sectional differences across industries, and industry growth and industry turbulence may capture temporal differences.
Industry competition
B2B firms in a highly competitive industry may introduce novel attributes to delight customers only to find that customers are likely to view these once-delighting attributes as must-haves over time (Rust and Oliver 2000). Anderson and Mittal (2000, p. 113) state that “industry structure is likely to affect the speed with which attributes migrate from the enhancement category to the maintenance category…the more competitive the category, the faster such migration.”
Prevalence of services firms in the industry
In their theory of delight, Parasuraman et al. (2021) find that attributes that help solve customer problems and generate unexpected positive emotions may become satisfaction enhancing. In contrast, Anderson, Fornell, and Rust (1997) suggest that the intangibility and variability in services makes standardization difficult, making it harder to delight customers. As such, the moderating role of services needs examination.
Industry growth
To meet customer needs, companies in high-growth sectors are more likely to offer new attributes than in mature markets, where most competitors offer very similar benefits, all satisfaction maintaining. As such, satisfaction-enhancing attributes may be more prevalent in high-growth sectors than in mature sectors.
Industry turbulence
Turbulent industries see rapid and unpredictable change in customer needs, which makes it harder for firms to provide attributes that can consistently delight customers. As such, firms may focus on only satisfaction-maintaining attributes.
Customer Subgroups as a Source of Heterogeneity
Anderson and Mittal (2000, p. 112) argue that “the same attribute can be satisfaction maintaining for one segment and satisfaction enhancing for another.” Inexperienced customers may be more easily satisfied than experienced customers (Mittal and Katrichis 2000), while customers who have had prior negative experiences with a company are more likely to regard attributes as satisfaction maintaining than satisfaction enhancing (Van Doorn and Verhoef 2008). Thus, we examine differences in the nature of asymmetry across customer subgroups.
Study 1: Surfacing and Validating Strategic B2B Attributes
Study 1 uses a theories-in-use process (Zeithaml et al. 2020) to identify a set of attributes that are conceptually pertinent to B2B contexts and ascertains their salience among B2B executives. The attributes were culled from the review in Table 1, the authors’ experience in conducting B2B satisfaction research, and a process consisting of (1) discussion, in-depth interviews, and focus groups among B2B managers to identify key attributes and (2) a textual analysis of Form 10-Ks of the top 50 publicly traded B2B firms to examine their prevalence in B2B firms.
Deeper Understanding of B2B Customer Satisfaction Attributes
To expand on prior research in Table 1 and attributes identified in B2B satisfaction surveys, we conducted open-ended, semistructured discussions, interviews, and focus groups lasting 45 to 90 minutes with over 50 executives in the B2B sector. This phase started in the summer of 2016 and lasted over 12 months. The B2B participants were recruited using snowball sampling and represented many titles (e.g., analyst, manager, director, vice president, CEO), functional areas (e.g., sales, operations, product development, customer service, finance, human resources), and industries (e.g., software, energy, chemicals, manufacturing, office supplies, technology). Confidentiality agreements precluded collecting demographic information to profile them.
The conversations were informal, eliciting executives’ views about (1) strategic attributes and benefits they receive from their suppliers and provide their customers, (2) using customer satisfaction studies for strategy planning, (3) analytical issues they face in analyzing customer satisfaction data, and (4) the company’s business strategy and financial goals. Eight key strategic attributes consistently emerged in early discussions. In later discussions, we asked participants to clarify their understanding of the eight strategic attributes with specific examples. Table 4 shows example quotes descriptive of these attributes, which are described next.
Example Quotes and Statements Reflecting Each Strategic Attribute.

a The firm to which each statement belongs is in parentheses.
Quality of product/service
Quality, defined as customers’ perceived performance of a supplier’s offerings, has been widely studied in B2B research, showing a positive (Homburg and Stock 2004) or a nonsignificant (Patterson, Johnson, and Spreng 1996) effect on customer satisfaction. Quotes illustrating this attribute include “You can do a lot of marketing, but eventually it turns on performance and quality” and “We get many no-bid jobs because of quality. We are the go-to guys for large projects that don’t compromise quality.” Conceptually, quality is traditionally viewed as a core attribute that is always satisfaction maintaining, although the veracity of this assertion has not been verified in a B2B context.
Pricing
Pricing refers to the extent to which customers perceive the price of a supplier’s offerings as fair and competitive. Interviewees stated, “Clients are always looking for a good competitive price.…[They] don’t like companies that low bid and then issue change orders to jack up price,” and “A lot has to do with price, especially with companies having large purchasing departments. They basically compare you on price at the end.” Pricing could be satisfaction balancing or maintaining in mature industries, but also satisfaction enhancing for some customer who may use it as a cue for quality or prestige.
Safety
Safety refers to customer perception of the extent to which a supplier assures its products, customers, and employees to be safe. B2B participants view safety as going beyond a narrow concept of product safety, stating, “Many complex jobs have problems. Right now, safety is one of the major problems,” and “We have a strong safety culture that is ingrained down to labor hands.” Pagell, Veltri, and Johnston (2016, p. 12) assert that “most managers say employee safety is a top priority,” but this has received scant attention in the B2B literature.
Sales process
Sales process refers to customer perceptions of the supplier’s understanding of customer needs to provide accurate proposals as well as the degree of its sales team’s competency, and it has been a key focus of B2B scholarship (Ahearne, Jelinek, and Jones 2007; Doney and Cannon 1997). Exemplar quotes include “I want the sales reps to visit our locations to fully understand how our location managers work” and “Their salespeople need to do a better job understanding our needs so that the proposals are streamlined to our needs.”
Project management
Project management refers to a supplier’s ability and desire to support the planning, execution, and support of specific initiatives and projects with which the supplier is involved and is considered a distinct competency by many B2B suppliers (Barkley and Saylor 1994). Interviewees stated, “A tremendous amount, thousands of policies and procedures that need to be followed to execute a project,” and “It’s about the empowerment of the people to make decisions at the project level and get them done quickly.” Executives saw the inclusion of this attribute as critical for conceptualizing B2B satisfaction.
Corporate social responsibility (CSR)
CSR refers to customer perception of the extent to which a supplier voluntarily incorporates societal and stakeholder concerns in its value proposition. In many B2B decisions, CSR is a “general rubric of noneconomic buying criteria—criteria other than price…[and] quality” (Drumwright 1994, p. 1) and a key decision factor (Homburg, Stierl, and Bornemann 2013). Interviewees stated, “They have to care about the well-being of all the stakeholders—environment, local employees, and even nonemployees,” and “It is important to be a community partner by creating local jobs…local content and training.”
Communication
Communication represents the extent to which customers perceive the supplier as being receptive to and sharing appropriate and accurate information in a clear and timely manner. It is viewed as a core antecedent of B2B customer relationships (Crosby, Evans, and Cowles 1990; Mohr, Fisher, and Nevin 1996; Palmatier et al. 2006). Interviewees stated, “Timely and consistent communications are key to our customers. Many have experienced significant time lags in getting a response to their inquiry,” and “Clients do not know how to contact the right people to solve their problems.”
Ongoing service and support
Ongoing service and support refers to the customer’s perception that the supplier is able to support the client’s need during the consumption phase of a product or service sold in the past. It conceptually overlaps with after-sales service (Kasper and Lemmink 1989) or ongoing relationship management (Mohr, Fisher, and Nevin 1996). Interviewees stated, “For many contracts, we will need to have a guarantee that no issues will be happening after delivery,” and “Who can we call when things go wrong? Service after sales is just as important as sales.”
Textual Analysis for Validating Attributes
Next, we text analyzed Form 10-Ks that provide a comprehensive overview of the executive team’s perspective on strategy (Griffin 2003). Form 10-Ks have been used to capture strategy elements (Germann, Ebbes, and Grewal 2015). The information in the 10-K is up to date, accurate, and reflective of senior management’s thinking and unlikely to be manipulated because it is subject to review by the Securities and Exchange Commission. The inclusion of these eight strategic attributes in 10-Ks will validate the attribute classification, offer initial evidence for their utilization, and support their role as antecedents of overall satisfaction.
We obtained Form 10-Ks of the 50 largest publicly traded B2B firms in the U.S., by annual sales for 2016, from the Securities and Exchange Commission (https://www.sec.gov/edgar/) and followed these steps: First, we extracted a total of 4,697 sentences that included the word “customer” or “client” from each 10-K. Such sentences are more likely to reflect a firm’s customer-relevant perspective. Second, an independent coder and an author coded each sentence for any mention of the eight attributes. A single sentence could contain multiple attributes. Sentences that were not classified in any of these categories (e.g., sentences describing market conditions, accounting rules) were removed, leaving 3,673 sentences. Table 4 shows sentence fragments corresponding to each attribute. Third, for each firm, the relative intensity of each attribute was calculated as the proportion of sentences for each attribute among all sentences that included the word “customer” or “client.” The results show that quality (52.98%) and pricing (23.41%) have the highest relative intensity while project management has the lowest intensity (1.79%). Collectively, these eight attributes account for 73.79% of all sentences reflecting a firm’s customer focus. The results, reported in Figure 3, show that the eight strategic attributes are pertinent and salient to B2B executives. Yet they do not indicate (1) whether each attribute is satisfaction balancing, satisfaction maintaining, or satisfaction enhancing and (2) whether its relationship with overall satisfaction varies across industries and customers. We next describe a modeling approach to answer these questions.
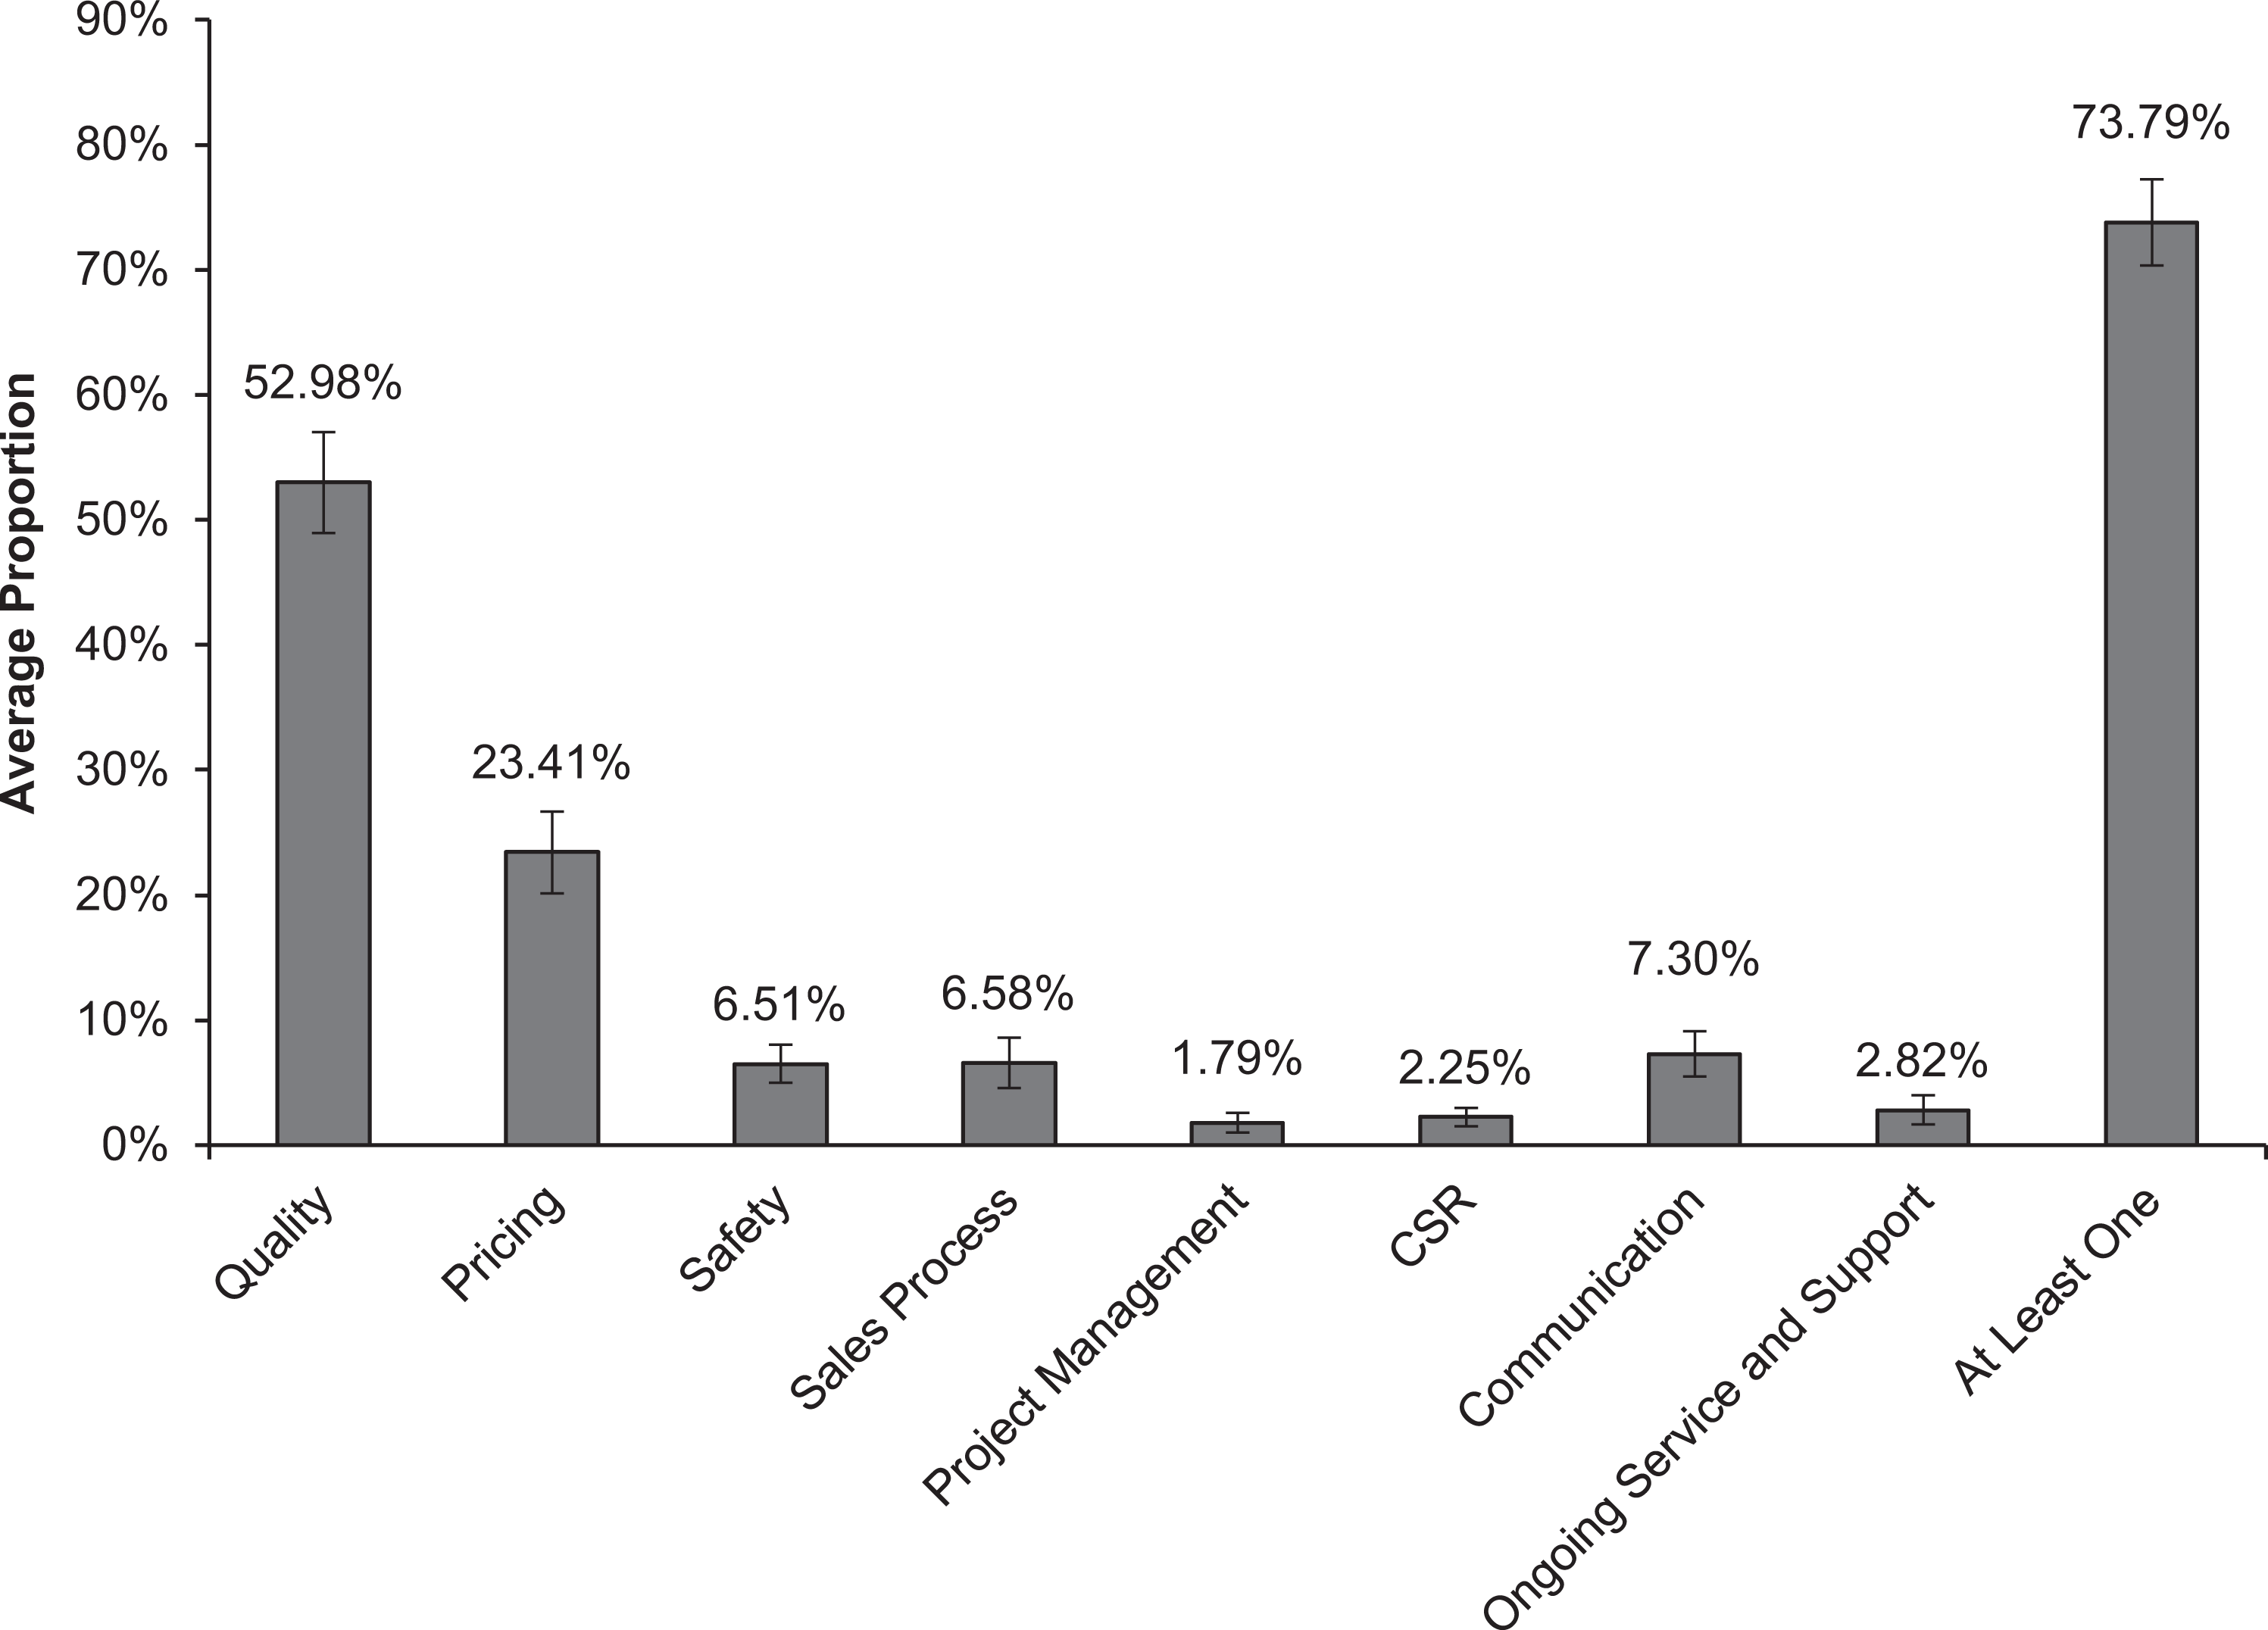
Study 1: B2B firms’ emphasis on key attributes.
Modeling Approach
Asymmetric Association Between Attribute Satisfaction and Overall Satisfaction
We begin with a well-established framework linking attribute satisfaction to overall satisfaction (Anderson and Sullivan 1993; Mittal, Ross, and Baldasare 1998). Specifically, dissatisfaction and satisfaction are denoted as follows:

and

where Score is the composite rating and Reference is the reference point that determines dissatisfaction versus satisfaction for a strategic attribute. For customer i rating firm j in group k at time t, the association of attribute dissatisfaction and attribute satisfaction with overall satisfaction is specified as
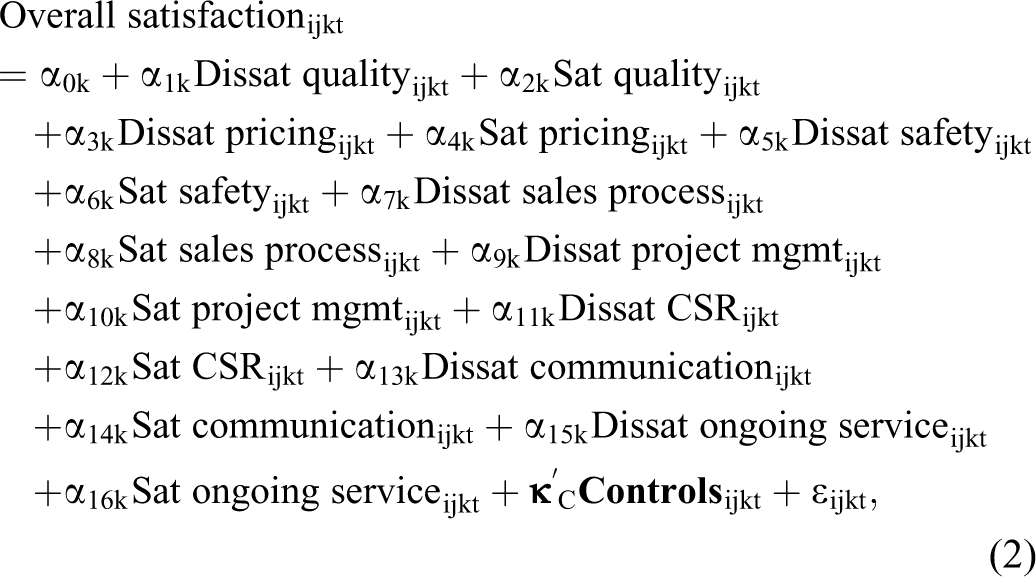
where Dissat (Sat) attribute indicates dissatisfaction (satisfaction) with the attribute for each of the eight attributes and
Incorporating Unobserved Heterogeneity in Asymmetry Modeling
Myriad group-specific factors could determine whether an attribute is satisfaction balancing, maintaining, or enhancing, based on the asymmetric association between attribute dissatisfaction/satisfaction and overall satisfaction. We account for unobserved heterogeneity by allowing the intercept term (i.e., α0k) and the slope terms for attribute dissatisfaction/satisfaction (i.e., α1k–α16k) in Equation 2 to vary across groups:
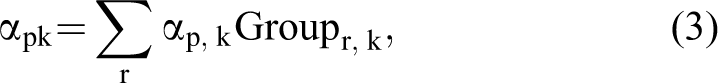
where Groupr, k is the rth dummy variable for group k. We model industries as groups in Study 2 and customer groups as groups in Study 3. Combining Equations 2 and 3 leads to
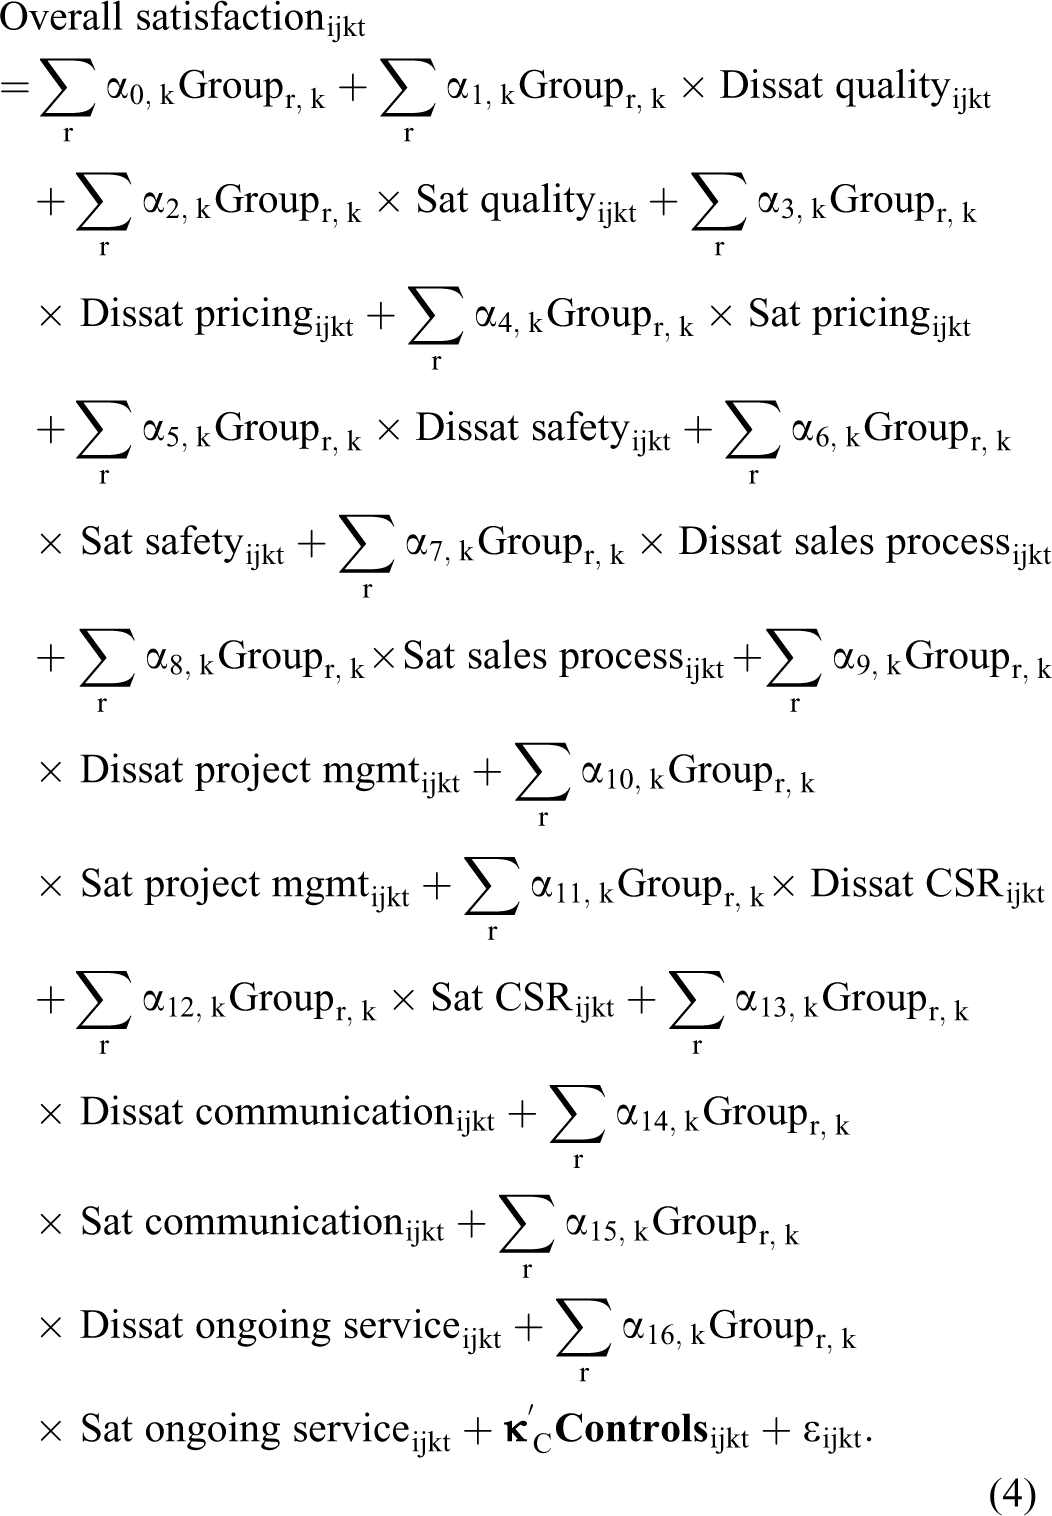
In Equation 4, αp, k represents the pth association of attribute dissatisfaction/satisfaction on overall satisfaction for group k. Conceptually, incorporating unobserved heterogeneity allows for a test of whether an attribute’s status as satisfaction maintaining, balancing, or enhancing is invariant across groups. Anderson and Sullivan (1993) and Mittal, Ross, and Baldasare (1998) assume a lack of heterogeneity within an attribute’s association with overall satisfaction.
A methodological challenge in Equation 4 is that the number of coefficients quickly increases as the number of categories in the group variable increases. Thus, in Study 2, the 16 heterogeneous slopes and 25 levels of the group variable (i.e., industries) lead to 400 additional interaction terms, introducing prohibitive multicollinearity. We need an approach that selects only the necessary additional predictors contributing meaningfully to unobserved heterogeneity.
Many approaches are available to select more important variables from a large set of predictors. First, researchers may identify a subset of important variables by testing whether each additional predictor, one at a time, enhances model fit (e.g., Bijmolt, Van Heerde, and Pieters 2005). This approach alleviates multicollinearity, but it is an ad hoc approach for selecting variables. Second, researchers may use factor or principal component analysis to reduce the dimension of the predictors in the first stage and regress the dependent variable on the extracted factors (e.g., Rust, Lemon, and Zeithaml 2004) in the second stage. This approach may leave a certain portion of variance unexplained due to unextracted factors in the process of reducing the dimensionality of the predictors. Third, regularization approaches such as the lasso approach may be used to select important variables (Tibshirani 1996). These approaches attain the goal of variable selection, but making statistical inferences based on the estimates can be a challenge.
Against this background, we use the Bayesian stochastic search variable selection (BSSVS) approach (George and McCulloch 1993) to select the predictors. BSSVS is an objective approach to select a subset of independent variables based on their relative importance or coefficient magnitude in predicting a dependent variable. In addition, a straightforward statistical inference can be made based on the posterior credible intervals. The BSSVS approach has been used in many marketing contexts including consumer choice (Chandukala, Edwards, and Allenby 2011), direct marketing campaigns (Tillmanns et al. 2017), movie performance (Boatwright, Basuroy, and Kamakura 2007), and market segmentation (Kim, Fong, and DeSarbo 2012). The BSSVS approach uses a spike-and-slab prior on the coefficients as follows:

where βm is the mth element of the coefficients

where
Signs of Coefficients Incompatible with Theory
One challenge in building a model is the presence of coefficient estimates with signs inconsistent with theory (Boatwright, McCulloch, and Rossi 1999). For example, attribute dissatisfaction (satisfaction) may have a positive (negative) association with overall satisfaction, which is contrary to the established theoretical expectation (e.g., Mittal, Ross, and Baldasare 1998). We address this challenge by imposing a prior distribution on the coefficients that is compatible with theory (Rossi and Allenby 2003). Information on the prior distribution may come from theory, prior research, and/or experts’ beliefs (Montgomery and Rossi 1999). We follow prior research (Boatwright, McCulloch, and Rossi 1999; Gelfand, Smith, and Lee 1992) and employ a truncated normal prior on the coefficients for attribute dissatisfaction/satisfaction as follows:

where lm and um are the lower and upper bounds for the coefficients. 2
Asymmetry Inference at the Group Level
Instead of a single estimate for the entire sample, we aim to use Equation 4 to obtain statistical inference for asymmetry for an attribute at the group level by comparing the size of the coefficients for attribute dissatisfaction versus attribute satisfaction within the group. If the absolute value of the coefficient for attribute dissatisfaction is statistically larger (smaller) than that for attribute satisfaction, the attribute would be satisfaction maintaining (enhancing). An attribute would be satisfaction balancing if the absolute value of the coefficients for attribute dissatisfaction and satisfaction is statistically identical. These tests are performed for each group (e.g., industry, customer). Formally, for the qth attribute (q = 1, 2,…, 8) and group k, we test whether the 95% credible interval of |α2q, k| – |α2q −1, k| includes zero.
For example, we test the association of satisfaction with quality and overall satisfaction for the first group through the 95% credible interval of |α2,1| – |α1,1|. If the 95% credible interval includes zero, then the attribute is satisfaction balancing. If the 95% credible interval does not include zero, we examine if the 95% credible interval is greater (smaller) than zero to determine whether the attribute is satisfaction enhancing (maintaining).
Addressing Potential Endogeneity in the Attribute Satisfaction–Overall Satisfaction Link
Correlated unobservables such as a respondent’s intrinsic preference for a supplier or the procurement process of a buying organization may jointly affect the customers’ attribute rating and overall satisfaction. Left unaddressed, this may bias executives’ conclusion about the link between marketing inputs and outputs (Albers, Mantrala, and Sridhar 2010). To address endogeneity, we use the latent instrumental variable (LIV) approach, which decomposes the potentially endogenous variable (attribute satisfaction in our case) into an exogenous and endogenous component (for details, see Ebbes et al. [2005]). 3 The exogenous component serves as a valid instrument for the endogenous variable in Equation 4. The LIV approach is widely applied in marketing (Kanuri, Chen, and Sridhar 2018; Lee et al. 2015) and is well suited for survey-based settings (Gupta et al. 2019). Following Ebbes et al. (2005), we construct a discrete LIV with C categories (where C > 1) and obtain latent clusters on attribute dissatisfaction and satisfaction as follows:

where Xq, ijkt is the qth element of the vector
After splitting the vector

where
We choose the number of clusters, C, that minimize the Akaike information criterion (AIC).
4
Then, we obtain the predicted values (

where the coefficient vector
Incorporating the Overall Satisfaction–Financial Performance Link
To demonstrate the financial impact of increasing overall customer satisfaction in a B2B context (Mittal and Sridhar 2020), we include the following equation:
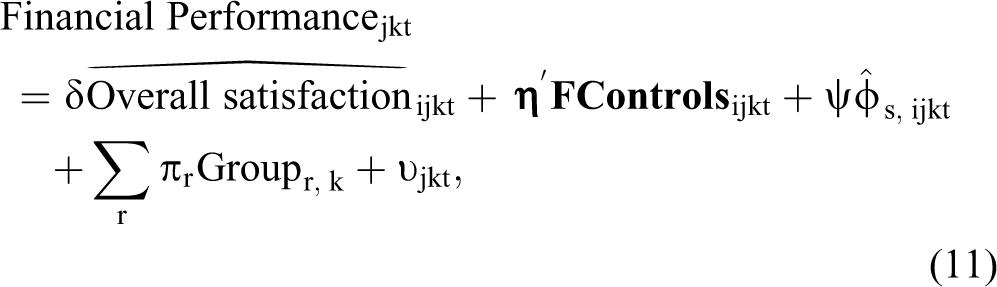
where
This modeling approach introduces five new elements for customer satisfaction research in B2B settings: (1) it incorporates subgroup heterogeneity in attribute coefficients; (2) it utilizes a variable selection approach that empirically optimizes fidelity and parsimony; (3) it determines whether an attribute is satisfaction balancing, maintaining, or enhancing at the industry or customer-segment level; (4) it corrects for potential endogeneity in the model; and (5) it shows a link between customer satisfaction and financial performance for B2B firms.
Study 2: Industry-Subgroup Heterogeneity in a Multifirm Setting
Data and Sample
Data for Study 2 were provided by a research collaborative conducting a monthly, national survey of B2B managers since January 2017. Participants provided the name of a supplier of their firm and rated their (1) satisfaction with eight strategic attributes (e.g., sales process, pricing) and (2) overall satisfaction. They also provided demographic information. Only participants who were at least a manager/supervisor were included in the study to ensure that the informants were knowledgeable about their own company as well as the supplier. We also measured participants’ involvement with the supplier and included it as a covariate in the empirical model. We were provided access to surveys completed from January 2017 to June 2019 (N = 24,601). In this cross-sectional nested panel, each participant completed only one survey, but multiple participants could have rated the same B2B supplier within a month or across months.
We matched supplier names with publicly listed B2B firms from Compustat to verify them and obtained financial performance of the B2B suppliers rated by the participants. This matching process used a predetermined set of guidelines and yielded 13,744 surveys. Three researchers on the team did the matching, with an interrater agreement of 92%, and disagreements were resolved through discussion (for details, see Web Appendix B).
After matching, 11,451 surveys were complete and usable. The sample comprised 1,785 suppliers operating in 65 industries. Industries with fewer than 40 observations were grouped together to obtain reliable estimates. This procedure reduced the number of industries from 65 to 25 (for industry groupings, see Web Appendix C). The supplier firm, customer firm, and participants are described in Web Appendix D.
To assess nonresponse bias, we compared participants who completed the survey within a week with those who took more than a week. Following Armstrong and Overton (1977), the average satisfaction scores with the eight attributes and overall satisfaction were statistically similar for early and late respondents (all ps > .15). Therefore, nonresponse bias is deemed a nonissue.
Measures
Attribute satisfaction
We used 19 items to measure the eight attributes (1 = “extremely dissatisfied,” and 7 = “extremely satisfied”; Web Appendix E shows the items). Attribute satisfaction scores were computed as the predicted latent variable scores from a confirmatory factor analysis (CFA). Using the composite ratings, and zero (i.e., average score) as the reference point, we operationalized attribute dissatisfaction and attribute satisfaction separately (Equation 1).
Overall satisfaction
Consistent with prior research (Anderson and Sullivan 1993), we measured overall satisfaction with a single item. Taking their entire experience into account, participants rated the supplier (1 = “extremely dissatisfied,” and 7 = “extremely satisfied”).
Control variables
The control variables (i.e.,
Measurement model
In an exploratory factor analysis (EFA) with Varimax rotation, each item loaded on one of the corresponding eight factors (cumulatively explained variance = 86.47%; Cronbach’s alpha of .85 or higher). A CFA of the 19 items showed the composite reliability of each construct exceeded .60 and the average variance extracted (AVE) by each construct exceeded .50, indicating convergent validity (Fornell and Larcker 1981). The AVEs exceeded the maximum squared correlations between constructs (.71), indicating discriminant validity. The full results are in Web Appendix E.
Common method variance (CMV)
Lindell and Whitney (2001) propose using a marker variable to partial CMV out of the observed correlations between attribute satisfaction and overall satisfaction. An effective marker variable should (1) be theoretically unrelated to our focal variables (i.e., attribute satisfaction and overall satisfaction), (2) reflect similar cognitive processes and response tendencies with those of our focal variables, and (3) share similar response formats with our focal variables (Simmering et al. 2015). For robustness, multiple marker variables should be used (Lindell and Whitney 2001).
We used two items (“If I had another option, I’d stop using this supplier,” and “I only use this supplier because I have no other choice”; 1 = “strongly disagree,” and 7 = “strongly agree”) as the marker variables in two separate models. After partialling out CMV through the marker variable, all bivariate correlations between attribute satisfaction and overall satisfaction remained positive and significant (ps < .01), indicating minimal influence of CMV (see Web Appendix H).
Results
We first estimated Equation 2 with ordinary least squares to replicate Mittal, Ross, and Baldasare (1998). Table 5 shows the results. Sales process and CSR are satisfaction enhancing; quality, project management, communication, and ongoing service and support are satisfaction maintaining; and pricing and safety are satisfaction balancing. However, these results do not address unobserved heterogeneity and endogeneity and do not provide subgroup estimates. They assume the coefficients are homogeneous across industries and attribute satisfaction is exogenous.
Study 2: Attribute Satisfaction, Dissatisfaction and Overall Satisfaction.

*p < .10.
**p < .05.
***p < .01.
Notes: The model includes industry, year, and month dummies. Estimates are obtained from ordinary least squares.
The results from Equation 10 address these empirical issues and are described in Table 6, Panel A. M1 includes only main effects. M2 includes the interaction effects. 5
Study 2: Association Between Attribute Satisfaction and Overall Satisfaction.
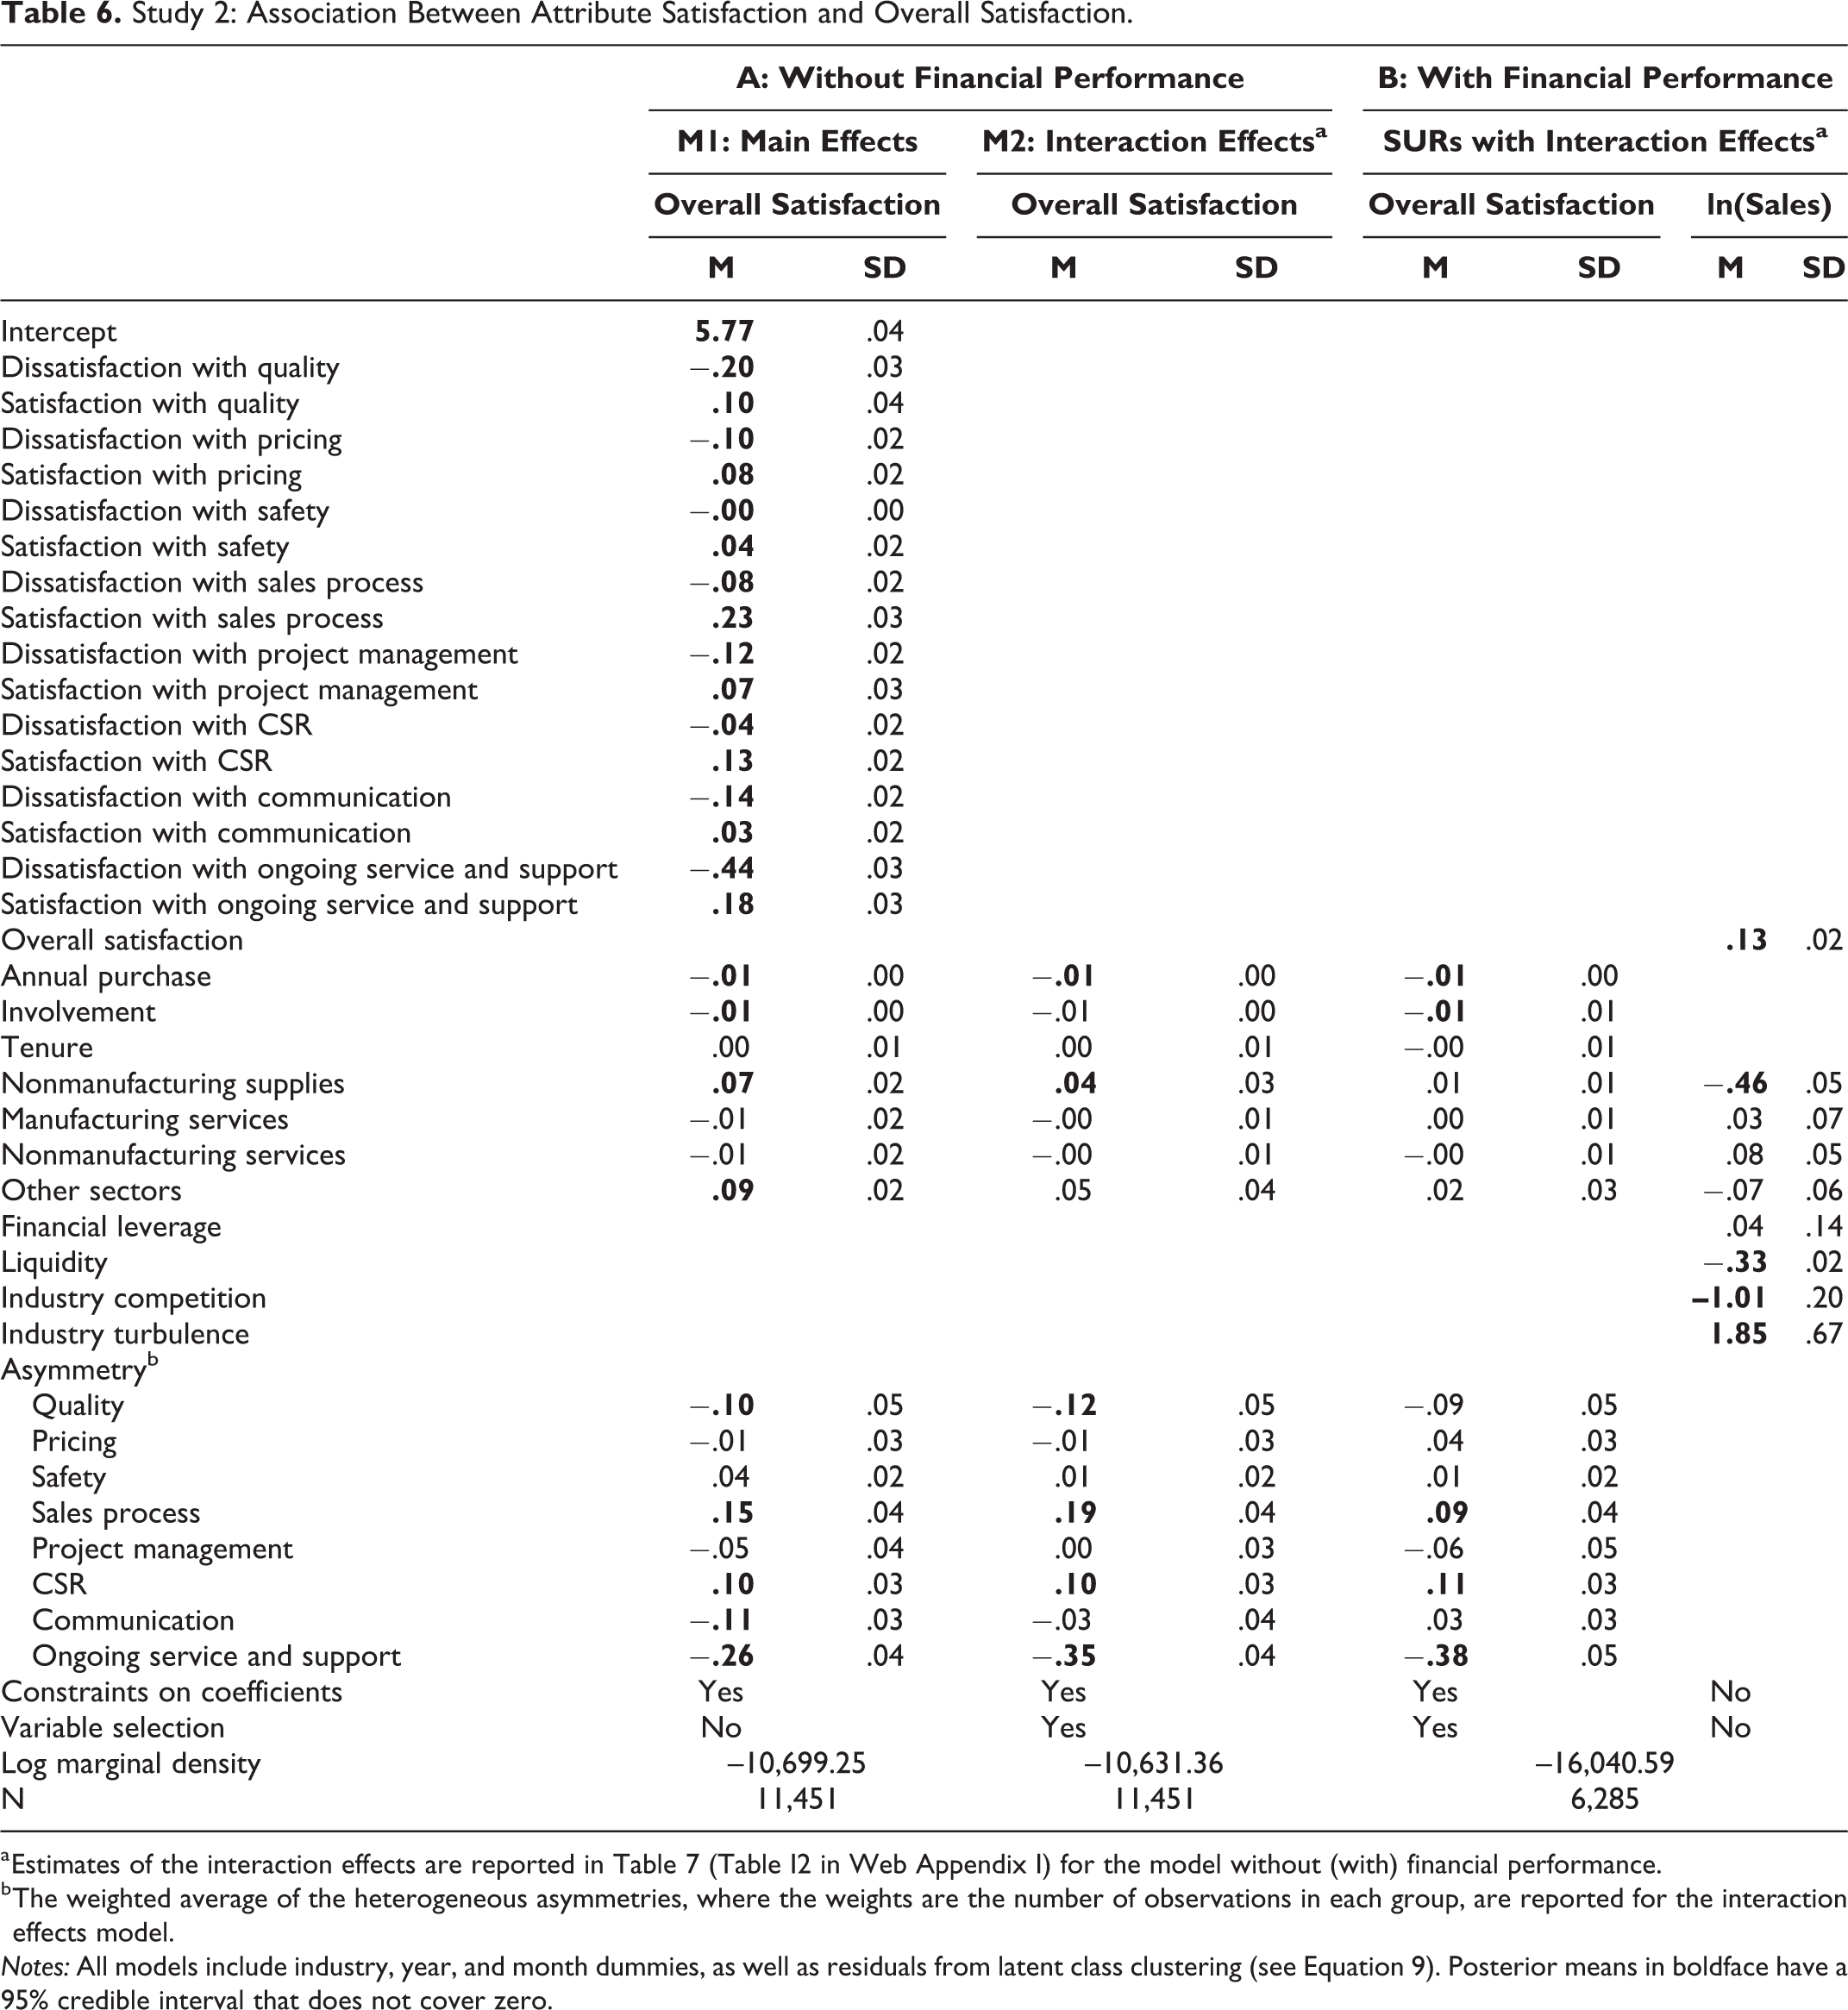
a Estimates of the interaction effects are reported in Table 7 (Table I2 in Web Appendix I) for the model without (with) financial performance.
b The weighted average of the heterogeneous asymmetries, where the weights are the number of observations in each group, are reported for the interaction effects model.
Notes: All models include industry, year, and month dummies, as well as residuals from latent class clustering (see Equation 9). Posterior means in boldface have a 95% credible interval that does not cover zero.
Asymmetric effect of attribute dissatisfaction and satisfaction
M1 in Table 6, Panel A, provides the estimates. Attributes with a negative asymmetry are satisfaction maintaining, those with a positive asymmetry are satisfaction enhancing, and those without asymmetry are satisfaction balancing. Quality (asymmetry = −.10), communication (asymmetry = −.11), and ongoing service and support (asymmetry = −.26) are satisfaction-maintaining attributes because the deleterious effect of dissatisfaction with these attributes is larger than the beneficial effect of satisfaction. In contrast, sales process (asymmetry = .15) and CSR (asymmetry = .10) are satisfaction enhancing: the impact of attribute satisfaction is greater than that of attribute dissatisfaction. Finally, pricing, safety, and project management are satisfaction balancing because the effects of attribute dissatisfaction and attribute satisfaction are statistically similar.
Heterogeneous estimates of asymmetry
M2 in Table 6, Panel A, and Table 7 show estimates from a model incorporating interactions between attribute dissatisfaction/satisfaction and industry dummies as proposed in Equation 10. The box plot in Figure 4 shows that the asymmetry estimates differ significantly across industries for all eight attributes.

Study 2: Heterogeneity in asymmetry across industries.
Study 2: Heterogeneous Effects of Attribute Satisfaction on Overall Satisfaction.

Notes: Coefficients with selection probabilities greater than .50 are reported. Posterior means in boldface have a 95% credible interval that does not cover zero.
The industry-specific asymmetry estimates for the eight attributes are described in Figure 4. As an example, Panel G in Figure 5 and Table 7 shows the asymmetry estimates for communication in the 25 industry groups. Although communication is satisfaction maintaining for the overall sample (asymmetry = −.11; M1 in Table 6, Panel A) it differs by industry. Specifically, communication is satisfaction maintaining (asymmetry = −.85) in the metal industries and metal products industry (i.e., two-digit Standard Industrial Classification [SIC] codes 33 and 34) but satisfaction balancing in other industries. As another example, satisfaction with safety is a satisfaction-balancing attribute for the overall sample. Yet, Panel C in Figure 5 shows that safety is satisfaction maintaining (asymmetry = −.28) for the chemical/petroleum/coal products industry (i.e., two-digit SIC codes 28 and 29) but satisfaction balancing in other industries.

Study 2: Heterogeneous estimates of asymmetry across industries.
The nature of attributes also differs across industries. Thus, in the business services industry (two-digit SIC code 73), satisfaction with quality (asymmetry = −.39) and ongoing service and support (asymmetry = −.41) is satisfaction maintaining, whereas sales process (asymmetry = .30) and CSR (asymmetry = .22) are satisfaction enhancing. Other attributes are satisfaction balancing in the business services industry. This profile differs for the finance, insurance, and real estate industry (two-digit SIC codes 60–67), where all attributes are satisfaction balancing.
In conclusion, ignoring industry-specific heterogeneity may be misleading for B2B executives examining a specific attribute or comparing different subgroups on all attributes.
Examining sources of heterogeneity in asymmetry
To examine industry-level differences in asymmetry, we estimated a second-stage model with the dependent variable being a stacked vector of eight asymmetries across the 25 industry groups. The predictors included: industry competition, prevalence of services firms in the industry, industry growth, and industry turbulence along with attribute fixed effects. 6 That is, for attribute a and industry k,

Web Appendix F shows the measures. Industry competition (λ = .15), industry growth (λ = 1.34), and industry turbulence (λ = 4.52) increase positive asymmetry (i.e., higher prevalence of satisfaction-enhancing attributes). More services in an industry decrease positive asymmetry (λ = −.02; i.e., higher prevalence of satisfaction maintaining attributes; see Web Appendix J).
Robustness Checks
Alternative measures of attribute satisfaction
Instead of using the predicted latent variable scores from the CFA model, we reran the models using attribute satisfaction measured with the EFA scores and average value of the items with the reference point set as zero. We set the cross-loadings to zero to calculate the EFA scores. For the average scores, we used standardized values. The results replicate (for the full results, see Tables I3 and I4 in Web Appendix I).
Addressing endogeneity using a control function
As described in the Appendix, the results were replicated with a control function approach (Petrin and Train 2010). The exclusion restriction was the average level of attribute dissatisfaction (satisfaction) among other customers of the same supplier and its sector in a given year.
Overall Satisfaction and Financial Performance
Data and sample
Among the 1,785 suppliers included in the initial data set, 1,137 firms were no longer publicly listed for the 2017–2019 time frame (e.g., OfficeMax merged with Office Depot). The analysis uses 6,285 observations from the remaining 648 suppliers.
Measures
We measured a firm’s financial performance using sales from Compustat, which was operationalized as the natural logarithm of a firm’s quarterly sales.
Control variables
For overall satisfaction, we controlled for annual purchase, involvement, job tenure, and the supplier’s business sector (i.e.,
Results
Panel B in Table 6 and Table I2 in Web Appendix I show the results. Aside from attribute-level estimates, we find that overall satisfaction is positively associated with sales (δ = .13). Specifically, a one-point increase in satisfaction results in a 12.96% increase in sales.
Discussion
Study 2 supports our conceptual model using multi-item measures for each attribute and a large sample of B2B customers in multiple firms across 25 industries. Whether an attribute is satisfaction balancing, maintaining, or enhancing can vary across industry sectors, as Figure 5 illustrates. First, using these graphs, executives can identify an attribute that contributes most to overall satisfaction and, ultimately, revenue. Moreover, they can learn whether their goal should be to increase satisfaction with the attribute or mitigate dissatisfaction with it. For example, within the chemical/petroleum/coal products industry, firms may benefit from investing resources to further enhance the sales process because it is a satisfaction-enhancing attribute with high importance. For this industry, investments in sales process are more likely to create overall customer value and improve financial performance than investments in other attributes.
Study 3: Customer-Subgroup Heterogeneity in a Single-Firm Setting
Study 3 shows how a firm can identify satisfaction-balancing, -maintaining, and -enhancing attributes among customer subgroups and link overall satisfaction to financial performance.
Institutional Setting
We worked with the CEO of a North American company that wishes to remain anonymous. The company leases modular offices. The senior leadership disagreed on the attributes providing the most customer value. An internal assessment showed that senior leadership believed the top three attributes included safety, CSR, and communication. Fewer than 50% of the senior executives rated them as the top three attributes, suggesting that the CEO would not garner the full support of the senior leadership team by focusing on them. Moreover, the firm had not measured attribute-level or overall customer satisfaction to validate this assumption.
Data and Sample
First, the company sent an email survey (with three reminders) to the supplier’s customer list and obtained 4,590 complete surveys. Second, the company provided the clients’ purchase amount for the quarter during which the customer survey was conducted.
Measures
Customer groups
In consultation with senior leadership, we defined customer groups on the basis of different combinations of the eight product categories offered (Categories A–H). Each customer may have leased different combinations of the service categories. Of the possible combinations (i.e., customer groups), only 104 had at least one customer included. To obtain reliable estimates, we removed customer groups with fewer than 40 customers, which resulted in 19 customer groups. We used the remaining 4,072 surveys from these 19 customer groups. Web Appendix L provides the final list of customer groups.
Financial performance
We used the dollar value of purchase scaled to a range of 1–100 to maintain confidentiality. Results replicated with units leased as an alternative measure.
Attribute satisfaction and overall satisfaction
All items were measured using a seven-point scale (1 = “extremely dissatisfied,” and 7 = “extremely satisfied”). Most of the items measuring the eight attributes were identical to those used in Study 2, but some items were customized for this company’s specific needs. The 17 items for attribute satisfaction are shown in Web Appendix M. We used CFA to predict latent variable scores, which were used to measure attribute satisfaction. We operationalized attribute dissatisfaction and satisfaction as in Equation 1, where zero (i.e., average score) served as the reference point.
Control variables
We controlled for the self-reported annual purchase the participant’s company made from the supplier, their personal involvement with the supplier, and their job tenure at the company (for measures and summary statistics, see Web Appendices F and N).
Measurement model
We used the same process as in Study 2. In an EFA, eight factors explained 92.30% of the variance, with Cronbach’s alphas exceeding .86. In a CFA, all items loaded on the pertinent factor (ps < .01), the composite reliability (AVE) was greater than .60 (.50) for all constructs, and the AVEs exceeded the maximum squared correlation (.78) for all dimensions except for quality (.76). This establishes convergent and discriminant validity (see Web Appendix M). Two separate tests for CMV with two different marker variables showed no evidence of common methods bias (Lindell and Whitney 2001; see Web Appendix H).
Results
We jointly estimated Equations 10 and 11 with SUR. Results are in Table 8. Panel A shows the main effects, and Panel B includes interaction effects (for full results, see Web Appendix O).
Study 3: Association Between Attribute Satisfaction, Overall Satisfaction, and Purchase.

a Estimates of the interaction effects are reported in Table 9.
b The weighted average of the heterogeneous asymmetries, where the weights are the number of observations in each group, are reported for the interaction effects model.
Notes: All models include customer-group dummies as well as residuals from latent class clustering (see Equation 9). Posterior means in boldface have a 95% credible interval that does not cover zero.
Asymmetric effect of attribute dissatisfaction and satisfaction
Table 8, Panel A, shows that pricing (asymmetry = −.13) and project management (asymmetry = −.48) are satisfaction maintaining; safety (asymmetry = .09) and sales process (asymmetry = .30) are satisfaction enhancing; and quality, CSR, communication, and service and support are satisfaction balancing.
Heterogeneous estimates of asymmetry
Table 8, Panel B, and Table 9 show the model with interactions between attribute satisfaction and customer-group dummies. Attribute-specific coefficients for customer-groups are in Web Appendix P—they differ across customer groups. For example, Panel B in Web Appendix P shows that pricing is satisfaction maintaining for customer groups 1 (asymmetry = −.26) and 14 (asymmetry = −.36) but satisfaction balancing for other customer groups. CSR, on the other hand, is satisfaction balancing across all customer groups (see Panel F in Web Appendix P). An assumption that any of the attributes is always satisfaction maintaining or enhancing for all customer groups can mislead executives.
Study 3: Heterogeneous Effects of Attribute Satisfaction on Overall Satisfaction.

Notes: Coefficients with selection probabilities greater than .50 are reported. Posterior means in bold have a 95% credible interval that does not cover zero.
Overall satisfaction increases the dollar value of customers’ purchase as indicated by the positive and significant coefficient (δ = 1.03). Executives used these results to target specific interventions for each customer group to optimize overall customer satisfaction and achieved corresponding financial results.
Insights and Actions for Firm Strategy
This study provides several key insights for executives of the company. Specifically, Among the eight attributes, ongoing service and support, project management, and sales process explained 70% of the variance in overall satisfaction.
7
The executives instead had focused on safety, CSR, and communication. For academic researchers, it is notable that the top three attributes do not include quality or pricing, as presumed in previous B2B research, and the research overview in Table 1 could mislead executives in this company. The CEO designated service and support and sales process as satisfaction enhancing. Improvements in these increased overall satisfaction by .34 and by .38 while decrements had a weaker impact on overall satisfaction (−.26 and −.08). These increase (decrease) the dollar value of purchase by 35.18% (27.46%) and 40.19% (8.32%), respectively. The CEO designated project management as a satisfaction-maintaining attribute on which dissatisfaction (−.53) was more consequential than satisfaction (.05). This increases (decreases) the dollar value of purchase by 4.74% (55.15%). The company’s goal evolved to mitigating dissatisfaction, rather than amplifying satisfaction on this attribute. Contrary to the assumption in prior asymmetry research, executives found quality and pricing to be relatively less consequential. They also found that an attribute could not be assumed invariant for all customer groups.
The CEO made ongoing service and support, project management, and sales process the pillars of the company strategy. Each pillar was spearheaded by a senior executive who oversaw specific initiatives aimed at improving these strategic attributes and eliminating initiatives that did not directly support the three pillars. Study 3 results were implemented in a B2B company.
General Discussion
Practical Implications and Contributions
Conceptually, this article provides B2B executives with a robust, comparable, and usable attribute typology for monitoring their customer performance. Study 1 goes beyond the oft-used attributes of quality, pricing, sales process, and communications by showing the relevance of safety, CSR, project management, and ongoing service and support for B2B companies. Surprisingly, pricing and quality were not among the top attributes driving overall satisfaction in Studies 2 and 3, while ongoing service and support—an attribute that was not included in any of the 27 studies in Table 1––is among the top attributes in Studies 2 and 3.
Studies 2 and 3 also extend previous research that assumes the attributes are always satisfaction maintaining (Anderson and Sullivan 1993). Mittal, Ross, and Baldasare (1998, p. 45) stated that “for any given attribute it is more important to eliminate negative performance first and then focus on increasing performance in the positive direction.” Yet Studies 2 and 3 show that an attribute’s disposition as being satisfaction balancing, maintaining, or enhancing differs by industry and customer group. As an example, satisfaction-enhancing attributes occur more frequently in industries with higher competition, growth, and turbulence. Executives can formulate and implement a nuanced and contingent strategy using these insights.
Studies 2 and 3 provide strong support linking overall satisfaction to the financial performance metrics: sales and units leased. Senior B2B executives consistently worry about their inability to link customer satisfaction efforts to financial outcomes. Study 2, a multifirm and multi-industry study, shows that a one-point increase in satisfaction yields a 12.96% increase in sales, providing confidence that using customer satisfaction programs for strategy formulation and execution can be a pathway to financial excellence. Firms can also trace the financial outcomes to specific attributes—mindful of heterogeneity—to develop resource allocation based on customer satisfaction.
Theoretical and Conceptual Insights
First, this article extends previous research that assumes the nature of attributes is fixed. Recognizing that an attribute can be differentially satisfaction balancing, maintaining, or enhancing depending on industry and customer groups, we develop a consistent and replicable statistical approach to address this issue. Executives can address multicollinearity and obviate the need for including hundreds of interaction terms in estimating the heterogeneous effects of attribute asymmetry on overall satisfaction.
Second, this study uncovers new attributes that prior B2B research has ignored. We demonstrate the robustness of the eight-attribute typology in a cross-industry study as well as for a single B2B firm. These attributes have now been replicated in more than 30 applications and exemplify the “theories-in-use” framework to enhance the ecological validity of conceptual models such as attributes used in B2B research (Zeithaml et al. 2020).
Methodologically, this article extends asymmetry modeling in customer satisfaction in five ways: (1) capturing heterogeneity across known subgroups, (2) providing a variable selection approach to empirically arrive at the subset of attributes affecting overall satisfaction, (3) conducting asymmetry inference at the subgroup level, (4) correcting for potential endogeneity in customer satisfaction surveys, and (5) making the business case for customer satisfaction by correlating it to financial performance. Notably, these methodological contributions can be readily implemented by B2C companies. First, the set of consistent, validated, and usable attributes has been used by dozens of B2B companies in sectors such as oil and gas, software technology, engineering services, aviation testing equipment, engineering and procurement, modular offices, pipeline manufacturing, coating services, and hospitality services. Second, this work shows firms a way to identify satisfaction-balancing, -maintaining, and -enhancing attributes for different customer groups and segments.
This research is limited to a single threshold or linear inflection point but could be extended to more complex relationships between attribute and overall satisfaction. Future researchers could also test these attributes and the framework with more individual firms to establish the robustness, identify additional attributes and outcomes, and understand implementation hurdles. In addition, lack of data precluded estimating dynamic effects of attributes. Finally, non-U.S. samples could generalize results to other countries. Future studies could investigate the dynamic and cross-cultural effects of strategic attributes on customer satisfaction.
Supplemental Material
Supplemental Material, sj-pdf-1-mrj-10.1177_00222437211013781 - Improving Business-to-Business Customer Satisfaction Programs: Assessment of Asymmetry, Heterogeneity, and Financial Impact
Supplemental Material, sj-pdf-1-mrj-10.1177_00222437211013781 for Improving Business-to-Business Customer Satisfaction Programs: Assessment of Asymmetry, Heterogeneity, and Financial Impact by Vikas Mittal, Kyuhong Han, Ju-Yeon Lee and Shrihari Sridhar in Journal of Marketing Research
Footnotes
Appendix: Alternative Approach to Addressing Endogeneity
The control function approach requires an observed instrument for an attribute’s rating of satisfaction and dissatisfaction (Petrin and Train 2010). We use the average attribute rating among other customers of the same supplier and its sector in a given year as an instrument. We exclude the focal customer when calculating the average. Attribute rating of other customers is a valid instrument given that customers of the same supplier receiving similar offerings (i.e., supplier operates in the same sector) may have similar experiences with an attribute. Thus, other customers’ ratings may have a significant association with the focal customer’s rating (i.e., meets the relevance criterion). However, it is logically not possible that other customers’ rating of a single attribute may influence the focal customer’s overall satisfaction since the focal customer may have different experiences on other attributes (i.e., meets the exclusion restriction). Thus, in the first stage, we regress attribute dissatisfaction (and satisfaction) on other customers’ dissatisfaction, other customers’ satisfaction, and the control variables. 8 For each attribute,
Then, we include the predicted residuals (i.e.,
Associate Editor
Dhruv Grewal
Declaration of Conflicting Interests
The author(s) declared no potential conflicts of interest with respect to the research, authorship, and/or publication of this article.
Funding
The author(s) received no financial support for the research, authorship, and/or publication of this article.
Notes
References
Supplementary Material
Please find the following supplemental material available below.
For Open Access articles published under a Creative Commons License, all supplemental material carries the same license as the article it is associated with.
For non-Open Access articles published, all supplemental material carries a non-exclusive license, and permission requests for re-use of supplemental material or any part of supplemental material shall be sent directly to the copyright owner as specified in the copyright notice associated with the article.