
Abstract
Before their launch, many new products generate word of mouth (WOM) on social media. Such WOM typically increases toward the release date and contains sudden spikes. These spikes capture manifestations of peak consumer attention and are therefore of managerial importance, yet they have not received research attention. This article is the first to provide a comprehensive descriptive treatment of WOM spikes. The authors propose a conceptual framework to present spikes as a standalone WOM dimension and explain their emergence. They employ a robust filtering procedure to detect spikes and apply it in a data set of 90,000 prerelease online WOM messages on 157 Hollywood movies. The results indicate that prerelease spikes are widely prevalent: While some of them are event-driven, emerging in response to firm-created communications (e.g., trailer release), they are far more likely to emerge spontaneously. Content analysis reveals that WOM in spikes is more positive in sentiment and is more likely to deal with factual details than is WOM outside spikes. Prerelease WOM spikes also contribute significantly to the predictability of future product sales.
Keywords
The temporal dynamics of word of mouth (WOM) in many product categories does not evolve smoothly but rather contains sudden “spikes,” or bursts of interpersonal communication among consumers. These WOM spikes are likely to be of managerial importance because they capture abnormal manifestations of focused awareness of, attention to, and interest in the product, above and beyond random fluctuations. Moreover, WOM spikes provide an early indication of the market’s level of interest: as we show later, spiky prerelease WOM positively correlates with the brand’s future sales.
Consider, for example, the movie Friends with Benefits. The volume of online WOM (i.e., number of messages) about this movie before its release increased as the release date approached, and it contained spikes (see Figure 1). This pattern is not unique to Friends with Benefits. Spikes occur in both pre- and postrelease WOM for many movies, as well as for items in other product categories, such as books, video games, and music CDs (see Figure 1). Interestingly, as we show later, many of these spikes do not co-occur with promotional or press events related to the new product.
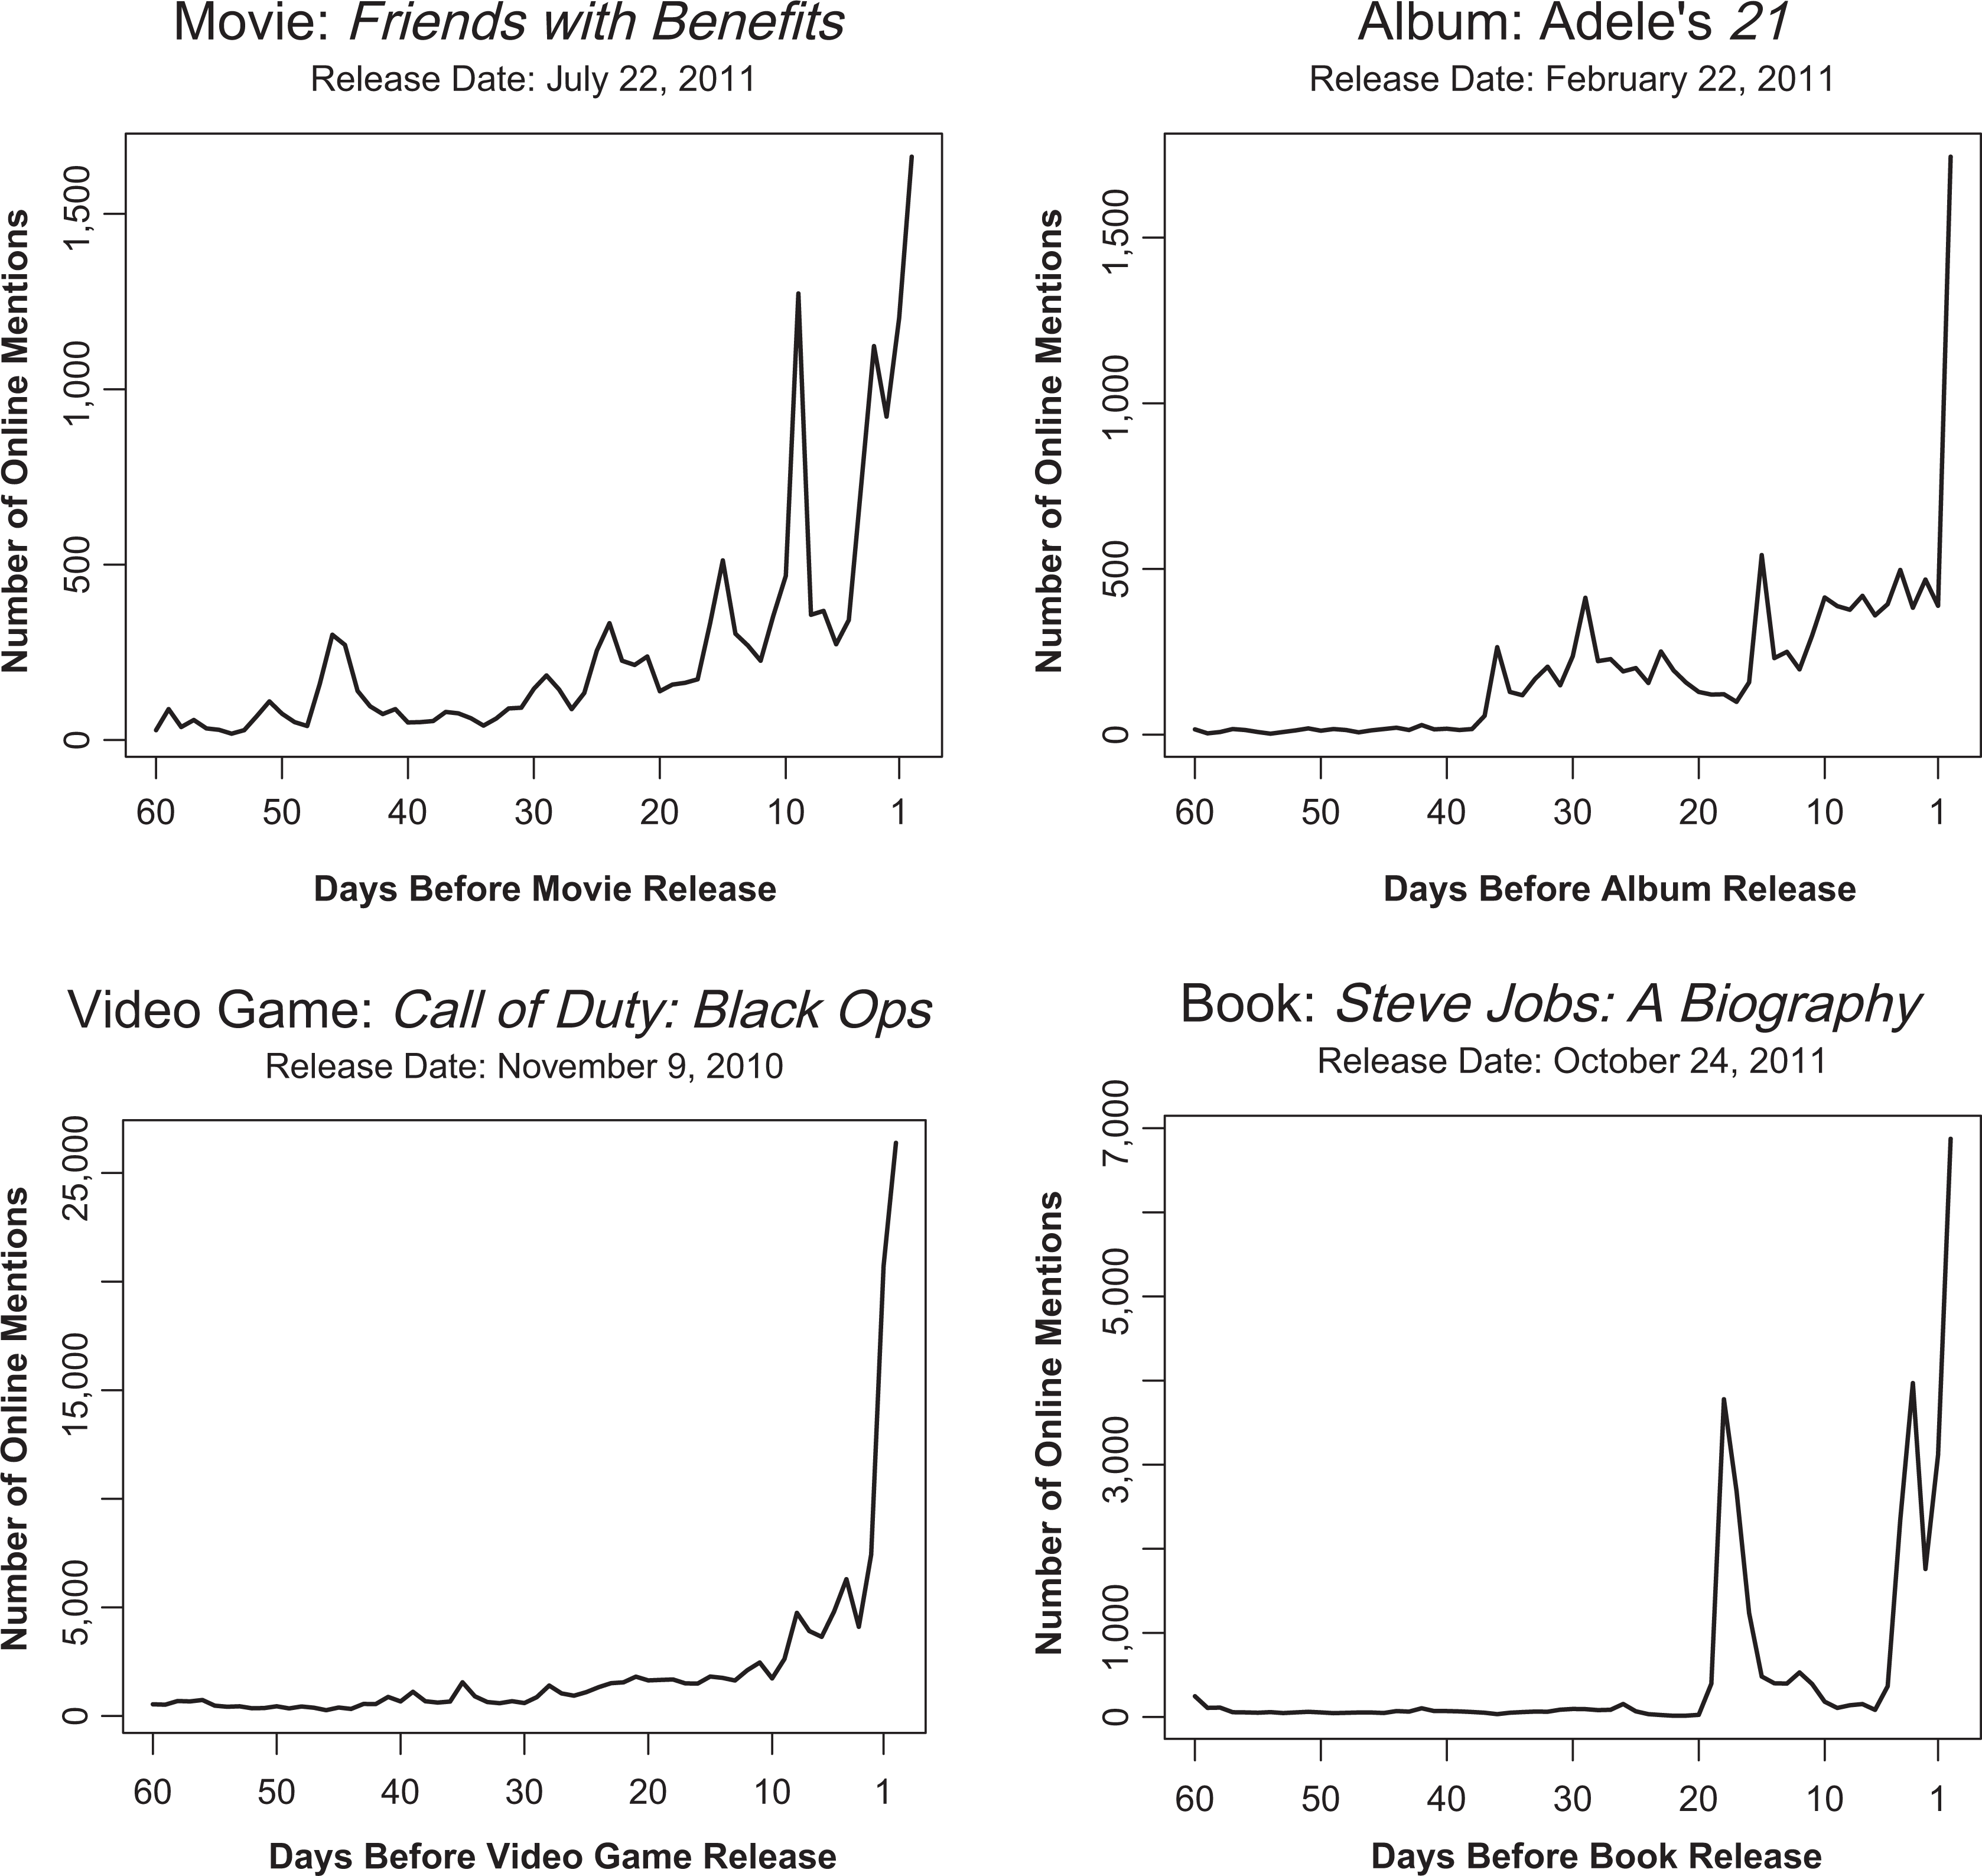
The number of online WOM messages from Twitter, Blogs, and user forums for four entertainment products.
The spiky nature of social interactions has been recognized in the social network literature (e.g., Barabási 2005; Crane and Sornette 2008). It reflects a growing research interest in “emergent phenomena,” or large-scale, ordered behavior that emerges from interactions among individual elements of a natural system (Darley 1994). Yet, the marketing literature has ignored spikes. Studies of WOM in marketing have mostly focused on aggregate volume, valence, and cross-sectional variance of WOM (e.g., Babić Rosario et al. 2016; Kim and Hanssens 2013; Lovett, Peres, and Shachar 2013). Some works have explored the effect of WOM at time t on sales at time t + 1 (e.g., Godes and Mayzlin 2004; Liu 2006), whereas others have focused on trends by smoothing out the spikes (O’Connor et al. 2010; Xiong and Bharadwai 2014); Regardless, the overall dynamic patterns of WOM over time were disregarded.
The goal of this article is to provide a comprehensive descriptive investigation of WOM spikes. We define spikes and examine their emergence, characteristics, and content, and we investigate how they relate to product performance. In this sense, this work can be viewed as a “phenomenon investigation,” similar in spirit to the work of Zhang, Bradlow, and Small (2015) on the clumpiness phenomenon and the work of Pham, Lee, and Stephen (2012) on the emotional oracle effect.
We contribute to the extant WOM literature by addressing four aspects of spikes. First is the conceptual aspect: We define spikes and claim that they represent an aspect of WOM not captured by frequently used measures such as volume and valence. We review social network theory to show that spikes emerge either as a result of out-of-network sources (referred to as “event spikes”) or because of spontaneous synchronization of consumer activity (referred to as “rogue spikes”). Although we do not directly test this theory empirically, it provides a framework to guide our empirical analysis, and we found it to be consistent with our results. Second, we address the measurement aspect: we introduce a model for spiky WOM and propose a robust filtering approach for detecting spikes and distinguishing them from random noise and regular trends. Third, we address the empirical aspect, or the prevalence, duration, magnitude, and content of spikes, and their relationships to firm-initiated communications. We conduct large-scale sentiment and content analyses of online WOM messages using Amazon Mechanical Turk (MTurk), and we analyze those data to compare the content of spikes with that of regular, nonspike WOM. Fourth, we explore the managerial aspect, or the extent to which the number, magnitude, duration, and types of spikes (event driven vs. rogue) can be used as predictors of postrelease sales.
Our analysis focuses on prerelease WOM in the context of the movie industry. Movies, as well as other entertainment products, receive elaborate WOM before release. Such prerelease WOM provides a unique natural setting for studying spikes: focusing on the prerelease period enables WOM to be detached from the purchase itself, ensuring that the WOM spikes that we study are not influenced by fluctuations in sales.
Our data set consists of prerelease online messages relating to the top 157 movies released in the United States during 2010 and 2011, as well as their box-office revenues, advertising expenditures, and PR communications. We find that prerelease WOM spikes occurred for nearly all of these movies, and that they occurred more frequently as the release date approached. Only 20% of the WOM spikes are event driven (i.e., occurring on the same day as a firm-initiated movie-related event, such as a trailer release). The remaining 80% are rogue spikes (i.e., they do not co-occur with movie-related events, and they appear to emerge spontaneously). Our content analysis suggests that spike messages, more than nonspike messages, deal with specific movie-related topics such as the actors, the director, or the trailer. Our sentiment analysis shows that spike messages are generally more positive than nonspike messages.
Analyzing the relationships between spike occurrence and box office revenues, we find that when controlling for WOM volume, WOM valence, and movie characteristics, movies whose prerelease WOM patterns are spikier, on average, generate more box-office ticket sales. This finding is especially the case for movies with many rogue spikes.
Conceptual Background: WOM Spikes
In this section, we establish a conceptual background for WOM spikes. We first define spikes and discuss how spikiness can be regarded as a new WOM dimension. Then, we review social network theory on how individual-level interactions can create spiky aggregate WOM.
What Is a Spike?
The behavior of many social systems is characterized by a nonsmooth temporal pattern, with sudden bursts between periods of lower activity. A wide range of behaviors, such as riots, strikes, voting, migration waves, crime waves, memes, diffusion of rumors, and personal productivity, come in bursts or spikes (Barabási 2010; Biggs 2003; Leskovec, Backstrom, and Kleinberg 2009; Myers and Leskovec 2014). The study of spikes reflects social scientists’ growing interest in emergent phenomena, or micro-level interactions between individuals that give rise to macro-level collective behaviors (Darley 1994).
The literature discussing spikes in social activity primarily defines spikes qualitatively and cites two characteristics: first, spikes are outliers relative to average activity levels (Barabási 2010), and, second, spikes both occur and disappear within a short period. In this article, we refer to a specific type of spikes—WOM spikes—and define them as an abnormal positive transient shock in the volume of WOM, above and beyond the volume’s trend and random fluctuations. Later, we explain how to formally detect spikes in WOM time-series data.
Spikes as a Dimension of WOM
As a manifestation of social interactions, WOM is complex and multidimensional. Surprisingly, research on WOM thus far has barely referred to this inherent complexity and instead has tended to address characteristics such as volume and valence (Babić Rosario et al. 2016).
Volume is the intensity of social interactions regarding a brand. It is the most commonly used WOM metric (Babić Rosario et al. 2016) and is usually measured as the count of WOM mentions of the brand in a given time period (Liu 2006). The volume of WOM serves as an indicator of the market’s overall interest in the brand as a topic of conversation. Valence, the other commonly used WOM metric (Babić Rosario et al. 2016), is the sentiment of WOM, capturing attitudes toward the brand. Valence can be measured through classification of WOM messages into “positive,” “negative,” “mixed,” and “neutral” sentiments (e.g., Grewal, Cline, and Davies 2003) or as numerical user ratings of sentiment (e.g., Moe and Trusov 2011).
Whereas most studies have examined aggregate WOM volume and valence, fewer studies have addressed their variation across people and over time. Table 1 maps the main metrics used in the literature. The table clearly indicates the gap between the inherent richness of WOM and the limited diversity of the metrics heretofore used. The literature has mostly relied on metrics that capture aggregate levels of volume and valence. Metrics capturing temporal dynamic patterns, both in volume and in valence, have hardly been employed.
Dimensions of WOM Used in the Literature.

We argue that variation in WOM volume over time is important because it captures temporal changes in the market’s interest in the brand. Specifically, we suggest looking at the spikiness of WOM, or the extent to which WOM volume on a given brand is characterized by short periods with intense conversations. Whereas the overall volume of WOM represents the general level of interest in the brand, spikiness represents the number of times that the brand managed to generate an exceptionally high level of interest. A brand’s capacity to not only arouse interest but also evoke bursts of particularly intense social activity might be an indication of its future success.
Spikes as a Result of Individual Interactions
We build on social network theory to understand the emergence and decay of spikes. Models of information flow in social systems (outside the WOM context) typically assume that a network member can be exposed to a conversation topic either via extranetwork sources (for instance, by reading a newspaper article) or via other network members (Leskovec, Backstrom, and Kleinberg 2009). Then, each network member decides whether to discuss this topic within the network. Although some topics do not catch on (i.e., they generate no cascade or only short cascades), others receive high levels of activity and might develop into a spike (e.g., Myers, Zhu, and Leskovec 2012). 1
We therefore suggest that spikes in a social system can fall into two categories. The first, termed “event spikes,” are ignited by an event that happens outside the network and creates a direct, large-scale reaction. In the context of prerelease WOM on movies, the release of a trailer can cause consumers to talk about the upcoming movie. In addition, extensive evidence shows that spikes can be ignited by cumulative, unplanned spontaneous synchronization of individual actions (Crane and Sornette 2008; Naaman, Becker, and Gravano 2011; Strogatz 2004). We term these spikes “rogue spikes.” The term “rogue” is borrowed from oceanographic research, which defines rogue waves as large, unpredictable, spontaneous open-water waves that occur in calm weather for no apparent reason (Solli et al. 2007).
The social network literature suggests that the growth of spikes is dependent on social interactions. Biggs (2003) argues that the growth of spikes is contingent on a “positive feedback” mechanism, capturing the tendency of individuals to follow and reinforce popular behaviors. In WOM, the positive feedback effect means that network members prefer discussing popular topics. Thus, receiving more WOM on a topic makes someone more likely to also spread WOM on that topic, in turn contributing to the spike’s growth.
While positive feedback is responsible for spike growth, wear-out mechanisms operate simultaneously in the opposite direction. As new topics flow in, old topics lose popularity, and interest in them saturates (e.g., Calder and Sternthal 1980). This process creates a “recency” effect, whereby network members prefer to discuss recent topics (Leskovec, Backstorm, and Kleinberg 2009), and the spike on the previous topic decays.
Integrating the principles discussed previously and applying them to the context of online WOM, we conceptualize a social system in which discussion topics may either emerge from extranetwork sources, such as events, or be initiated within the social system by network members. Once a topic has entered the social system, its progression is driven by mechanisms of positive feedback and recency. The positive feedback mechanism, or people’s tendency to talk about what other people are talking about, could probabilistically lead to a chain reaction of responses, causing a sharp increase in WOM volume. This increase is temporary, and the spike decays because of the recency effect, i.e. people’s preference to talk about recent topics.
Spike Detection and Measurement: A Robust Filtering Approach
To study WOM spikes empirically, the ability to detect spikes in time-series WOM data is necessary. That is, we need a means of detecting an abnormal positive transient shock in the volume of WOM, consistent with our conceptual definition stated previously, beyond the volume’s trend and random fluctuations. This ability is not trivial, because WOM volume increases toward release, and we need to determine whether an increase in WOM indicates a spike, a trend, or a normal random deviation from the trend. For example, in Figure 1, for the movie Friends with Benefits, while many might agree that the WOM 9 days before release is a spike, do the smaller peaks in WOM on prerelease days 51 and 29 also qualify as spikes? In what follows, we propose a formal procedure for spike detection.
Modeling the Time Dynamics of WOM
We first present a model for the dynamics of the WOM volume without spikes. We relate to the WOM volume regardless of the mechanisms that might have generated it. We denote by WOMt the observed volume of WOM for a movie on day t (defined as the number of mentions of the movie on that day). Applying Hyndman et al.’s (2002) additive trend specification, we see that WOMt consists of three components: the baseline level at t − 1 (Levelt − 1), the trend at t − 1 (Trendt − 1), and a random noise component et. Hence

where

We include a time-varying error volatility given by

where ηt is a zero-mean random noise component with finite variance.
The level on day t (Levelt) is modeled as the level on the previous day (Levelt − 1) plus a trend (Trendt − 1) and a zero-mean random noise component:

To allow for changing trends over time, the trend is modeled as a local trend:

Parameters λ1 and λ2 are smoothing constants between 0 and 1 (Hyndman et al. 2002) and will be estimated using the robust filter. The smaller they are, the smoother the time series is. Equations 1 to 5 are essentially the updating equations of the forward filter step of the Kalman filter for the local-linear-trend normal state-space model (West and Harrison 1997). We chose this particular specification out of the multiple variations presented in Hyndman et al. (2002) because it is flexible enough to describe a time-varying trend, yet it can be estimated using the fairly simple Holt–Winters updating equations (see further discussion below).
Adding Spikes to the Model
Previously, we defined a spike as an abnormal positive transient shock in the volume of WOM, above and beyond the volume’s trend and random fluctuations. Consistent with this definition, the model incorporating spikes is

where Levelt− 1, Trendt − 1, and et remain the same as in Equations 2 to 5. We assume that spikes are additive, that is, they are an additional amount of WOM volume above level, trend, and noise. If, as is mostly the case, no spike occurs on day t, then Spiket is zero. If a spike is present, then Spiket is a positive numerical value representing the number of WOM mentions over and above the level, trend, and random noise.
Spike Detection
To detect whether a WOM spike has occurred on day t, assume that we know the level, trend, and random noise of WOM up to the previous day, t − 1. A spike is detected when the observed WOM on day t is much larger than the expected WOM based on the level, trend, and random noise at t − 1. We thus compute the expected WOM on day t, assuming that day t does not have a spike, and then compare it to the observed WOM on that day. Following Equation 6, the expected WOM on day t in the absence of a spike, E(WOMt | Spiket = 0), is obtained as follows:

To evaluate whether a spike has occurred on day t, we define a spike detection threshold of τt above E(WOMt | Spiket = 0). Consistent with our conceptual definition of a spike, upward jumps that exceed that threshold are identified as spikes, irrespective of why such upward jumps occur, such that
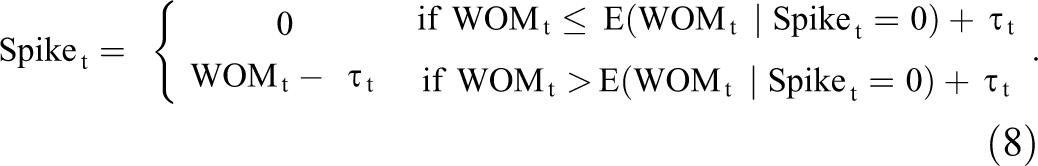
Thus, Spiket equals 0 when no spike is present, which is the case most of the time. When a spike is present, Spiket equals the number of mentions by which WOMt exceeds the threshold τt. Threshold τt is time-varying and depends on the random noise at t. If WOM at that time point is noisy, then the observed WOMt should be considerably high to be identified as a spike. If the WOM time series at that point has low noise, then smaller deviations can be identified as spikes. Thus, we define τt as τt = kσt, where k > 0 is a tuning parameter automatically selected in a data-driven way, as explained subsequently.
Figure 2 illustrates the spike detection process for the movie Captain America (released on July 22, 2011) with k = 5. Panel A shows the WOM up to June 22, 2011, one month before release. The expected WOM volume in the absence of a spike on June 23 is given by the asterisk. The horizontal line indicates the spike detection threshold τt. Next we observe the actual volume of WOM about the movie on June 23. If the observed WOM is below the threshold (see Panel B), we conclude that no spike occurred on June 23. If, however, the observed WOM on June 23 is as in Panel C, exceeding the threshold, then a spike is detected.

Spike detection for the movie Captain America (released July 22, 2011) based on observed prerelease WOM (solid line), expected WOM (*), and the time-varying threshold τt.
Estimation Using the Robust Filter with Automatic Threshold Selection
To estimate the local linear trend model with spikes defined in Equations 2 to 6, we use robust filtering. In particular, as noted, we can estimate the model using the robust Holt–Winters updating equations (Gelper, Fried, and Croux 2010). The robust Holt–Winters method is a recursive estimation method tailored to time series with outliers. The estimated components Levelt, Trendt, and σt are obtained as the weighted average of these components at t − 1 together with new information gained on day t. The weights given to current information are determined by the model parameters λ1 for the level, λ2 for the trend, and λ3 for the volatility. Thus,

where
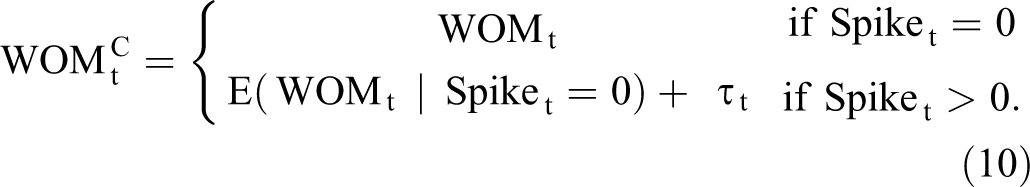
Equation 10 is the one-sided Huber psi-function, used in robust statistical analysis of data with outliers (Maronna, Martin, and Yohai 2006). Intuitively, the cleaned WOM is equal to the observed WOM when no spike is detected, but it is equal to the spike detection threshold when a spike is detected. The bounded Huber psi-function ensures accurate estimation of the level in the presence of spikes; this accuracy is not guaranteed by the classic Holt–Winters updating equations. Such “huberization” is standard in robust filtering (e.g., Calvet, Czellar, and Ronchetti 2015).
After estimating the level,

and the volatility,
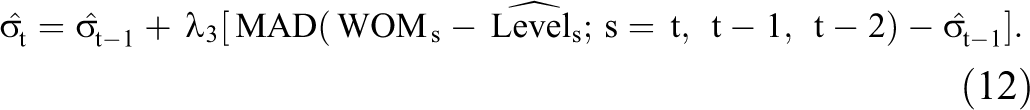
Here,

For q = 1.4826, MAD(x) is a consistent estimator for the population standard deviation of x (Maronna, Martin, and Yohai 2006).
The advantage of the estimation approach in Equations 9 to 13 as compared with a standard Kalman filter approach is twofold. First, a standard approach is not designed for a spiky time series and thus cannot be used to detect spikes. Second, because WOM spikes could be considered outliers, a standard estimation approach is highly unstable in the presence of spikes. By using the cleaned WOM and a robust scale estimator (Equations 10 and 13), the spikes’ influence on the estimates is bounded. The procedure we use thus provides an estimation of the level, trend, and volatility that is robust with respect to outliers.
We can apply the robust filter in Equations 9 to 13 only if we know the model parameters λ1, λ2, and λ3 as well as the tuning parameter k. We obtain these parameters jointly so as to minimize the one-step-ahead mean absolute percentage error (MAPE):
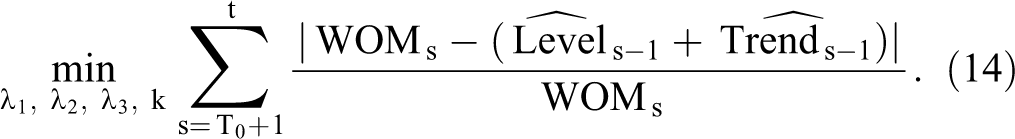
The advantage of using the MAPE as the objective function is twofold. First, because it calculates the percentage error, rather than the absolute deviation, the MAPE is well suited to our WOM time series, which trend over time. Second, the MAPE is less sensitive to extreme values than are metrics using the squared error, such as the mean squared error, thus rendering the MAPE better suited for our time series with spikes.
In Equation 14,

where T0 is the index of Day 3 after the first day the movie is mentioned online (which is long before the 60 prerelease days). The exact value of T0 is specific to each movie because some movies generate interest earlier than others. Because we start the filter well before the 60-day time window, the effect of the start values dies out as the estimation window moves forward, and thus the spike detection only minimally depends on the start values.
On any day t, we solve the minimization problem in Equation 14 using data up to day t. This expanding-window approach thus allows time-varying parameters, and it aligns with the managerial scenario, in which only past information can be used for spike detection. To minimize the MAPE, we use Byrd et al.’s (1995) limited-memory version of the Broyden–Fletcher–Goldfarb–Shanno quasi-Newton method. Note that the MAPE will be constant as soon as k gets large enough such that no spikes are detected. When the minimum value of the MAPE is reached for this range of constant values of the MAPE, no spikes are detected. Web Appendix A presents an extensive simulation study to assess the accuracy of our robust filter with automatic threshold selection for spike detection as compared with several alternatives, such as manual spike detection, rolling average, robust filter with fixed threshold, and a filter with mixture distribution. The simulations indicate that while the filter with automatic threshold is slightly inferior to the filter with a fixed threshold in terms of its true negative rate, its true positive rate is considerably better than that of all the other methods. Also, it is data driven and does not use a heuristic, predetermined threshold. Therefore, we chose it for our analysis in this article.
Data
Word-of-Mouth Data
Our data set consists of prerelease online WOM messages on 157 movies released between August 20, 2010, and August 10, 2011, from Twitter, blogs, and user forums. We compiled the corresponding WOM data using Nielsen-McKinsey’s Incite Buzzmetrics tool. This tool was a proprietary text-mining engine that crawled continuously and extensively through social media websites (e.g., blogs, user forums, discussion boards, Twitter) and archived their content. Movies, as well as any other product, in this archive could be searched for using designated keyword-based queries. 2 For each movie, we applied the appropriate query in the engine to search for mentions of the movie, to count the daily number of messages, and to download the text of the messages from the time the movie was first mentioned online until its release date.
We conducted an extensive content analysis of the text messages. This task was complicated because the vocabulary used to discuss movies is large, people talk about movies in various contexts, and many of messages contain nonstandard words (e.g., “OOOOH,” “Yayyy”), spellings (e.g., “viooz” instead of “views”), acronyms (e.g., “OMG,” “LOL”), or punctuation (e.g., “quick!?!:;;”). Previous text analyses of WOM, often aided by computer software, focused on one or a few content dimensions and a limited number of categories per dimension. Examples include studies analyzing sentiment (see Table 1), quantifying volume and classifying mentions (Sadikov, Parameswaran, and Venetis 2009), determining whether a given review recommends a movie (Turney 2002), and identifying key elements of the movie (e.g., story line, acting, visuals) discussed in the review (Simmons et al. 2011). Our objective was to explore a broader range and more intricate dimensions of WOM content. To perform such a task, we used MTurk, a crowdsourcing platform that enables labor-intensive tasks to be carried out by many human workers. Researchers are increasingly using MTurk for behavioral experiments (Mason and Suri 2012) and content analysis (Conley and Tosti-Kharas 2014). Each online message was classified along four content dimensions: Topic: the main movie aspect to which the message relates. Studies of WOM among moviegoers show that people discuss aspects such as the story line, acting and actors, director, cinematography, and soundtrack (Corrigan and White 2012; Peacock 2000; Simmons et al. 2011). Because it is usually necessary to watch a movie in order to discuss its soundtrack and cinematography, we did not include those categories in our prerelease data set. Instead, we added several topics that, according to our observations, were mentioned frequently in the prerelease WOM data. Our final list of categories for the topic dimension included actor, director, the movie itself (e.g., its production, story line, or filmmaking), the trailer, professional critics’ reviews, the genre, another movie, and the movie listing.
3
Although a message might cover several topics, we asked the workers to choose the most prominent one. Tone: the emotional quality or manner in which the topic is presented. Categories in this dimension are ordered hierarchically according to their emotional intensity as follows: “calls for others to watch the movie” (see Simmons et al. 2011), “watching intentions of the message author,” “opinion,” “gossip,” “nonopinionated description of the movie,” or “mere mention of the movie” (e.g., “The Smurfs—next week in theaters”).
4
Some categories in this dimension are embedded within others (e.g., every call for others to watch the movie is also an opinion). We instructed the workers to choose the option that was highest in the hierarchy. For example, the tweet “Soul Surfer should be awesome! Go see it!!!” was classified as a call for others to watch the movie. Sentiment: the overall sentiment of the message. Categories in this dimension included the following: “positive,” “negative,” “neutral” (no sentiment; e.g., “James Franco is the main character in 127 Hours”), or “mixed” (containing both positive and negative statements; e.g., “Danny Boyle is an excellent director, but he did a bad job”). In addition to our manual analysis, the Buzzmetrics data also contain a sentiment analysis (valence measure) ranging from −5 to 5 (with 0 being neutral) for each day, which measures the polarity of the messages (proportion of positive vs. negative) on that day. Although our sentiment analysis is conducted per message and is therefore richer, we use the Buzzmetrics valence measure in some of our analysis, when a numeric overall valence measure is required. Event driver: the workers had to decide whether the author clearly identified in the message an event that was likely to have served as the motive for posting. Categories included “no external event,” “a trailer,”
5
“other advertising,” “press or media event,” “early release,” and “movie premiere.”
6
Note that the workers’ judgment was based solely on the message text. Of course, we do not know the actual motive for posting a given message, unless the text explicitly refers to it (e.g., “I just watched the trailer, and…”). Thus, the “no external event” option means that the text did not clearly identify any event. Note that these data are gathered in addition to our collection of data on the true occurrence of events. Our choice to include this dimension was inspired by studies in natural language processing that use contingency between events, or between events and content (Hu et al. 2013). To our knowledge, this approach has not previously been applied in the context of WOM and promotional events.
We conducted this classification of the messages for each movie for which text was available for 60 days prior to the release date (this requirement reduced the sample from 157 to 106 movies). We sorted the WOM messages for each movie and each channel (Twitter, blogs, and user forums) chronologically, and for each movie, we systematically sampled one of each ten WOM messages. Overall, we analyzed 67,740 tweets, 11,655 blog posts, and 12,840 messages from user forums. Each message was classified on the basis of the four dimensions discussed previously, resulting in a massive total of 368,940 classifications. Examples of the user interface for all the content dimensions can be found at http://bschool.huji.ac.il/bs/MTurk/.
Altogether, 1,953 MTurk workers participated. The items to be classified were grouped into human intelligence tasks (HITs), to use the MTurk terminology; each HIT included 20 tweets, five blog posts, or ten user forum messages on a specific movie on a specific content dimension. The average time per HIT was three minutes, and the payment was $.15 per HIT plus a bonus of 20% for every ten HITs done correctly. We selected workers who had high ratings, and their work was supervised daily by a team of research assistants; unsatisfactory work was rejected and sent for reclassification. To ensure consistency, about 17% of the messages were classified by two different workers. As an additional validation of the classification, 12.3% of the messages went through a benchmark evaluation by a team of ten trained research assistants who served as experts. Comparison with the experts’ manual evaluation indicates high accuracy of the MTurk classification 7 : in the topic and sentiment dimensions, our results are comparable and even higher than those in the literature (see Wilson, Wiebe, and Hoffmann [2005] and Joachims [1998], respectively). The tone and event dimensions are, to the best of our knowledge, presented here for the first time and therefore have no benchmark in the literature. However, the performance on these dimensions is commensurate with that of the other dimensions. Comparing classification performance across tweets, blogs, and user forum messages, we found that the accuracy for blogs was slightly higher than for the other two message types.
Table 2 summarizes the overall classification results (spike/nonspike WOM messages are not distinguished from each other in this case). Regarding message topics, we see that a considerable share of the messages address the movie’s story line or filmmaking (57.3%). This finding is consistent with the importance of the plot dimension found by Simmons et al. (2011). As for tone, while many messages were categorized as opinionated, expressed watching intentions, or called on others to take action, a substantial share were simply mere mentions of the movie (31.85%). Most of the WOM sentiment was either positive (43.92%) or neutral (44.79%), consistent with earlier findings (Liu 2006; Nagle and Riedl 2013; Onishi and Manchanda 2012; Turney 2002). As for the event dimension, a large share of the messages (49.68%) mentioned some type of event, whereas 45.33% did not (the remaining 4.68% were classified as “other” or got no response). This finding is consistent with previous research documenting that nonevent content is prominent on social media because people share personal information, feelings, and random thoughts (Becker, Naaman, and Gravano 2011).
Summary Statistics of the MTurk Classification (n = 92,235 Messages for Each Dimension).

Additional Movie Data
We augmented the data set by collecting, for each movie, an additional set of variables: production budget (from Box Office Mojo), weekly advertising expenditures (using Kantar Media’s Ad$pender data set), Motion Picture Association of America rating (from IMDb), genre (action, animation, comedy, drama, horror, science fiction, thriller; from IMDb), and star power. To measure star power, we used the IMDb measure, which sums the box-office revenues of the past three movies in which an actor appeared, and averaged the star power of the two lead actors in the movie. This ranking can vary on a weekly basis. Because our analyses are based on data starting 60 days prior to release, we used star power averaged over the 60 days prior to the release date. 8 We represented the genre with seven dummy variables, whereby one movie can be assigned multiple genres (e.g., the movie Bridesmaids is both comedy and drama).
To analyze the co-occurrence of spikes with movie-related events, we collected, using IMDb, the movies’ websites, and the LexisNexis news archive, for each movie, the dates of all press events and firm-created marketing communications related to the movie and its cast during the 60 days prior to release. Specifically, we collected the dates of trailer releases, early movie releases, press events, and the movie premiere.
As a key performance metric for each movie, we used opening-weekend box-office revenues, collected from Box Office Mojo. We focused on opening-weekend revenues because these figures are less affected by postrelease WOM than cumulative box-office revenues are, allowing us to isolate the connection between prerelease WOM and ticket sales (we note, however, that the correlation between opening-weekend and total box-office revenues is .87 in our data set).
Results: The Characteristics of Spikes
Spike Prevalence, Duration, and Magnitude
For each of the 157 movies in the data set, we analyzed the prerelease period beginning 60 days before the movie’s release, not including the release day itself. Table 3 presents summary statistics on the spikes during this period. On average, spikes are identified by the threshold τt = kσt with k = 3.71, resulting in an average of 6.96 spikes per movie. A spike lasts for 1.78 days on average, with 6.49 days on average between two consecutive spikes. The magnitude distribution of the spikes, measured as the number of standard deviations by which the highest point of the spike exceeds the threshold of the robust filter, follows a power law, with many small spikes and a small number of large spikes. The average spike magnitude is 8.22 standard deviations (median of 4.85) above the spike-detection threshold. Measuring the number of spikes as a function of the time before release, we found a sharp increase in the occurrence of spikes about one week before release. We further note that the correlations between spikiness (operationalized as the number of spikes) and the aggregate volume and valence are relatively low (.33 and .28, respectively; see correlation table in Web Appendix B). This observation supports our argument in the conceptual section that spikiness is a dimension of WOM that differs from volume and valence.
Number, Duration, and Magnitude of Spikes.

For completeness, we also ran the spike detection algorithm on 67 movies for which we had postrelease data. We found that in the 60 days after release, a movie has, on average, 5.7 spikes. See Web Appendix C for more details.
Spike Versus Nonspike WOM: Differences in Topic, Tone, and Sentiment
This section explores the content of WOM in spikes. Specifically, we ask whether WOM in spikes differs from regular, nonspike WOM or whether it is just “more of the same”.
We used the content classification obtained via MTurk to run three multinomial logit models, one for each of the first three content dimensions we examined, namely, topic, tone, and sentiment. 9 The dependent variable (DV) was the probability that the message content corresponds to a specific category within the focal dimension (e.g., that the topic is “actor”). The focal binary explanatory variable was whether or not the message was posted on a spike day (as detected by our robust filter). For control variables, we used the number of days prior to release and event dummies to note whether a trailer release, a press event, an early release of the movie, or a premiere occurred on the day the message was posted. We also included movie and WOM channel fixed effects to account for potential unobserved movie- or channel-specific confounders. For each content dimension (e.g., topic), we used a multinomial logit model for the probability that Cijlt, defined as the content of message i on movie j in channel l (Twitter, blogs, user forums) written t days before release, equals category option c (e.g., “actor”) relative to a reference option c0:

We estimated the multinomial logit model using maximum likelihood to test whether spike WOM is different from regular nonspike WOM. One may raise the concern that because our DV is not free of measurement error (it is based on manual MTurk classification), the estimated parameters might be biased. To test this possibility, we ran a simulation in which we generated synthetic data with various levels of measurement error. The simulation showed that while measurement error in the DV of the multinomial logit model biases the estimated parameters toward zero, the correct signs are retrieved. See Web Appendix D for details.
Topic
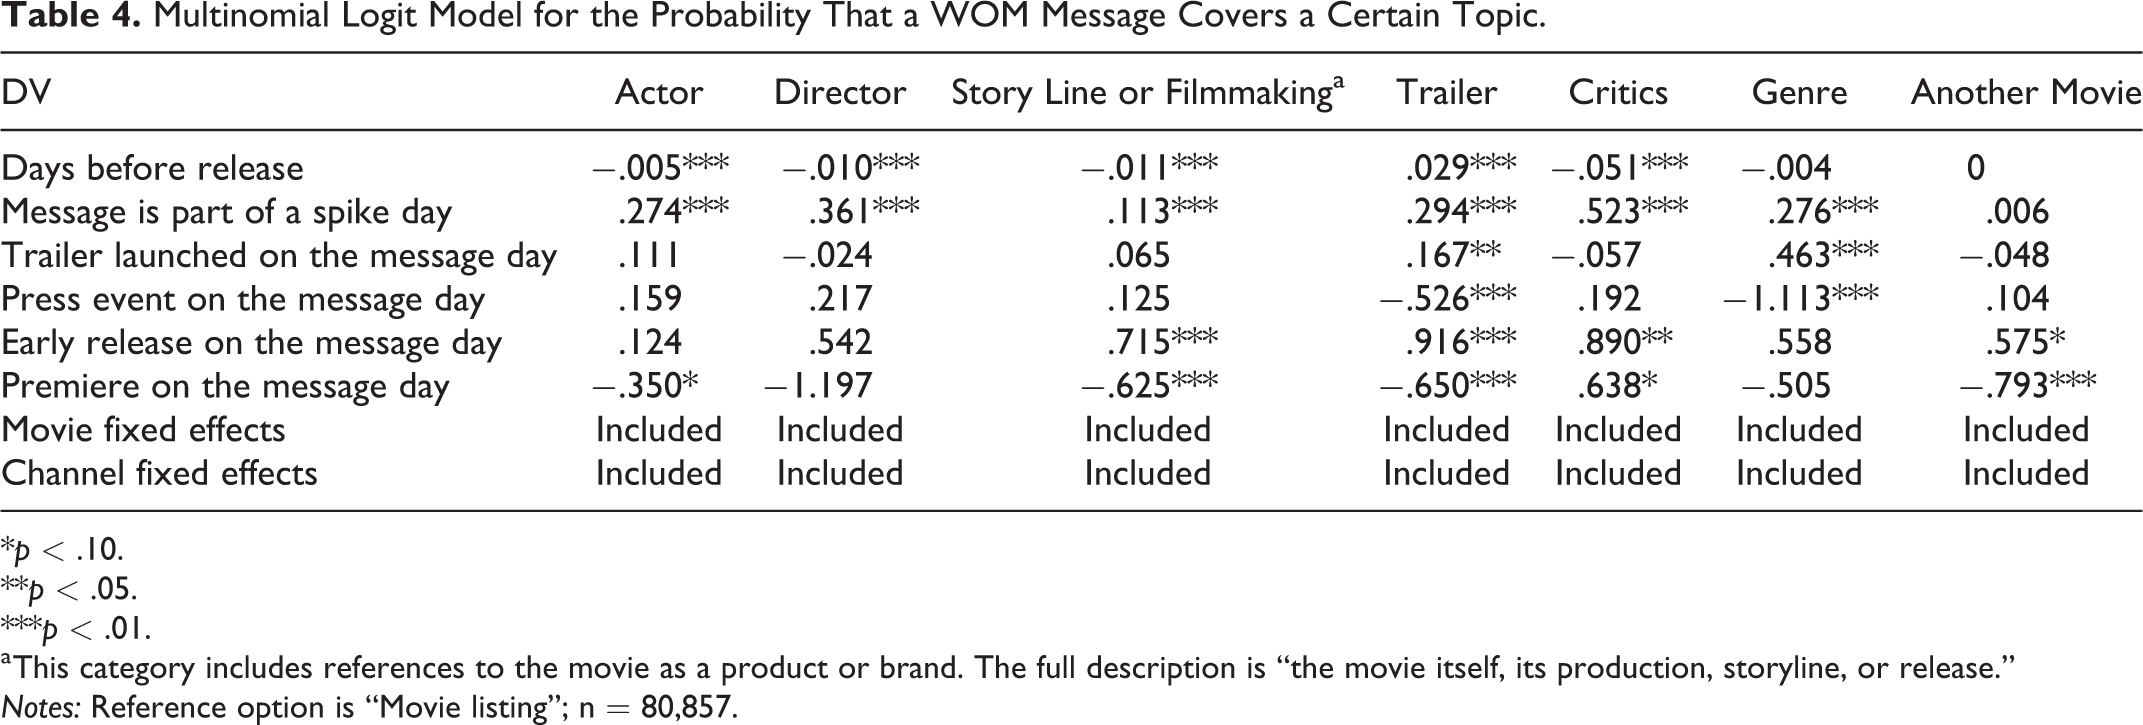
Table 4 displays the results of the model for the topic dimension. 10 The reference category (k0) is “movie listing,” which is simply a list of movies without any further information on the movie. The odds that a message discusses the movie using factual details, namely, the actor, director, story line or filmmaking, trailer, genre, and critics’ reviews, as opposed to simply presenting a list of movies, are higher on a spike day versus a nonspike day.
Multinomial Logit Model for the Probability That a WOM Message Covers a Certain Topic.
*p < .10.
**p < .05.
***p < .01.
a This category includes references to the movie as a product or brand. The full description is “the movie itself, its production, storyline, or release.”
Notes: Reference option is “Movie listing”; n = 80,857.
Tone
Table 5 displays the analysis for the tone dimension, with “mere mention” as the reference category. Consistent with the results for the topic dimension, the table indicates that the tone of spike messages shows higher movie-specific engagement compared with that of nonspike messages: the odds that a spike message calls for action, is opinionated, or provides a description of the movie, versus simply mentioning the movie’s name, are higher than the corresponding odds for nonspike messages. Notably, no such difference was observed for tone categories that did not relate to the content of the movie, such as intentions to watch it, or gossip. This finding suggests that spikes represent a large-scale exchange in the social system in which consumers’ opinions are formed and shared.
Multinomial Logit Model for the Probability That a WOM Message Has a Certain Tone.

*p < .10.
**p < .05.
***p < .01.
Notes: Reference category is “mere mention”; n = 83,918.
Sentiment
Table 6 presents the results of the multinomial logit estimation for the sentiment dimension. The reference category was “neutral.” The odds that WOM messages that are part of a spike have a positive or mixed sentiment, relative to neutral sentiment, are higher than these odds for nonspike WOM. This finding is consistent with our observations for the tone dimension (Table 5), namely, that spike messages tend to be more opinionated than nonspike messages. Note also that the sentiment tends to be more positive on the days of a press event and the movie premiere and more negative on the days of a trailer release.
Multinomial Logit Model for the Probability That a WOM Message Has a Certain Sentiment.

*p < .10.
**p < .05.
***p < .01.
Notes: Reference option is “neutral”; n = 86,866.
To summarize, our findings indicate that spike WOM differs in topic, tone, and sentiment from nonspike WOM. Spike messages are more likely than nonspike messages to discuss the actor, director, story line, and so forth, as opposed to merely mentioning the movie title as part of a list. They are also more opinionated and more positive than nonspike messages.
Event Spikes and Rogue Spikes
In this section, we discuss the extent to which spikes in prerelease WOM can be linked to events. We refer to the four types of events discussed in the “Data” section: trailer releases, early movie releases (e.g., at film festivals), press events, and the movie premiere. On average, in our data set, a movie has nine such events in the 60 days prior to release. These events increase in frequency as the release date approaches (a simple linear probability model with P(event occurs t days before release) = b × t gives
To examine the types of movie-related events that ignite spikes, we estimated a logit model that identifies which event types are more likely to co-occur with a spike. The model controls for time-to-release and weekly advertising spending, and includes movie fixed effects to control for unobserved movie-specific confounders. Table 7 indicates that spikes are significantly more likely to occur on days of an event, and this finding holds for each event type. The dynamic weekly advertising does not seem to have an impact on the likelihood of a spike occurring. 11 Controlling for the movie-related events and weekly advertising spending, we find that spikes are more likely to occur close to release. This observation is consistent with our conceptual framework because when a movie’s release approaches, the level of interest in it increases, and thus an initial ignition of a WOM spike is more likely to catch on and evoke positive feedback.
Results of Logit Regression of the Probability of Observing a Spike as a Function of Types of Movie-Related Events and Dynamic Advertising Spending.

a The variable t ranges from 1 to 60, such that day t is t days before release. Therefore, for all our models hereafter, a negative coefficient means that probability of a spike increases as release approaches.
b Because our advertising data are on a weekly basis, advertising spending is measured as the total spending in the week of day t.
Notes: DV is probability of a spike occurring t days before release; n = 9,420: 60 days for each of the 157 movies.
Using the event driver dimension of the content analysis, we can test whether the events are reflected in the spike content. We ran the same multinomial logit analysis that we ran for the other three content dimensions. The results for the five categories in the event driver dimension are presented in Table 8, with “no event driver” as the reference category. As can be seen, the odds that a WOM message on a spike day mentions an event as the driver for posting, relative to not specifying such an event, are higher than the corresponding odds for nonspike WOM.
Multinomial Logit Model for the Probability That a WOM Message Mentions a Movie-Related Event as the Motive for Posting the Message.

*p < .10.
**p < .05.
***p < .01.
Notes: Reference option is “no event driver”; n = 82,599.
An interesting validity check is to consider the relationship between the actual occurrence of an event and the user’s probability of mentioning the event as a driver for engaging in WOM related to the movie. The findings reported in Table 8 indicate that a press event on a certain day is likely to encourage the posting of messages citing the press event as the driver for the posting. Similar significant coefficients are obtained for the premiere and for a trailer release.
Although these findings suggest that events are important to the emergence of spikes, we also observe that many spikes emerge on days with no events. Indeed, our comprehensive data collection regarding events indicated that only 20% of the spikes in our data set co-occurred with events, whereas the remaining 80% of the spikes appeared to be rogue. To determine whether events trigger spikes with a delay, we checked the lagged correlations between events and spikes. These lagged correlations were significantly smaller than the same-day correlations. Thus, we only consider same-day co-occurrences to distinguish between event-driven spikes and rogue spikes. To test whether something specific might trigger a rogue spike, we also compared the content of event spikes and rogue spikes (see Web Appendix C). As expected, compared with event spikes, rogue spikes deal less with events. They include more mentions of the movie’s story line (in the topic dimension), their tone is less opinionated, and they contain more messages in the “mention” category. Interestingly, these differences hold when we look only at the first three hours of the spike, supporting the notion that rogue spikes are not triggered by external events and instead represent a spontaneous synchronicity of activity.
In sum, although days on which events occur are more likely than other days to contain WOM spikes, and spike messages are more likely than nonspike messages to mention these events, 80% of spikes emerge on days without such events. These results align well with our conceptual framework, which describes spikes as outcomes of individual-level interactions that might relate to events but are much more than a mere collection of individuals’ independent responses to these events.
Spikes and Sales
We now turn to studying spikes as covariates of sales. Such a relationship, if exists, has significant managerial implications, mainly with regard to predicting future performance. If prerelease WOM spikes are indeed bursts of focused attention for a given movie in a social system, then one might expect them to reflect the awareness and possibly interest that consumers have in the movie. Therefore, WOM spikiness might be useful as an indicator of box-office revenues. To investigate this relationship, we operationalized spikiness as the total number of spikes that occurred during the 60-day period prior to release, and we tested its relationship to opening-weekend box-office revenues. In what follows, we compare several regression models, controlling for the aggregate (nondynamic) prerelease WOM volume (measured as the total number of messages on the movie in the same 60-day period), prerelease WOM valence (averaged over the 60-day period), and other movie characteristics. The descriptive statistics and correlation table are in Web Appendix B. Table 9 presents the estimation results of six box-office revenue models. Model 1, a simple regression on the number of spikes over 60 days prior to the movie release date, shows a strong correlation between spikes and revenues: spikier WOM patterns during these 60 days correlate to higher subsequent box-office revenues.
A Model for log(Box Office Revenues).

*p < .10.
**p < .05.
***p < .01.
a The genre dummies are jointly significant (F-test; p-value < .01 for all models).
Notes: DV = log(opening weekend box office revenues); n = 157.
Model 2 is a benchmark that includes movie characteristics, WOM volume, and valence, but no spikes. We control for advertising spending because it has been shown to explain variations in box-office revenues (Onishi and Manchanda 2012). The advertising elasticity is .66, and the prerelease WOM volume elasticity is .6. We find no significant effect of valence.
In Model 3, we add the number of spikes. The spikier the WOM pattern, the higher the expected box-office revenues, controlling for movie characteristics, advertising spending, WOM volume, and WOM valence. One may conjecture that this result can be explained by the fact that strong WOM pulses increase recall and persuasiveness, and as a result lead to higher message effectiveness (Janiszewski, Noel, and Sawyer 2003, Nordhielm 2002).
To study the effects of event spikes (spikes that co-occur with firm-created movie events) and rogue spikes (spikes that do not co-occur with firm-created movie events), Model 4 includes the number of event-driven and rogue spikes as separate explanatory variables. Both types of spikes have a positive coefficient of similar magnitude, 12 but the coefficient of rogue spikes is more significant. This finding does not mean, however, that firm-initiated events are irrelevant to spikes. As shown earlier, content analysis of the WOM spike messages reveals that these events are mentioned and discussed in spikes.
In Model 5 we test whether additional spike characteristics, beyond number of spikes, add to the explained variation in box-office revenues. For each movie we include the average spike duration, measured in days, and the average spike magnitude. These spike characteristics do not add explanatory power to the model. We also tested other operationalizations of spike magnitude and did not find an effect.
Model 6 additionally accounts for the occurrence of movie-related events. It includes the number of trailer releases, number of press events, number of early releases, and number of premieres, none of which has a significant coefficient. We tested alternative specifications of the model with variables related to the distribution of WOM over time; 13 see Web Appendix E. As this Web Appendix suggests, models that incorporate spikes perform better than models that do not include spikes but instead consider volatility, or other time-varying variables. This finding supports our theoretical claim that spikiness represents a facet of WOM that goes beyond mere variance of WOM over time.
Discussion
This article addresses the underexplored aspect of dynamic WOM: spikes. Our conceptual framework and empirical findings suggest that WOM spikes do not represent mere noise or measurement errors: they reflect focused awareness of, attention to, and interest in the focal brand. Our findings further suggest that spikiness is a dimension of WOM that should be considered separately from the commonly used dimensions such as volume and valence. We summarize the results of our investigation by answering four key questions: How do spikes emerge? Our conceptual framework suggests that WOM spikes emerge as the result of an ignition related to a movie-related event (event spikes) or occur spontaneously (rogue spikes). After ignition, mechanisms of positive feedback and recency cause a sharp increase in WOM activity, followed by decay. Empirically, we find that in our data set, 20% of the spikes are event related, co-occurring with promotional or news events related to the movie and especially with early-release events. The other 80% of the spikes are rogue spikes, that is, spikes that do not co-occur with a movie-related event. Nonetheless, WOM spike messages are more likely than nonspike messages to discuss movie-related events: users explicitly mention them as the driver for posting their messages. How prevalent are spikes, how long do they last, and what is their magnitude? On average, we counted 6.96 spikes per movie over the 60 days prior to release. Spikes are short: a spike lasts 1.78 days on average, with 6.49 days on average between two consecutive spikes. As release approaches, spikes occur more frequently. Spike magnitude follows a power-law distribution. How does spike WOM differ from regular (nonspike) WOM? Our findings clearly show that spikes are not merely higher levels of the same WOM. In particular, we find that compared with regular WOM, the content of WOM in spikes covers more factual details of the movie’s elements, and WOM in spikes is more opinionated. Do movies with spikier prerelease WOM realize higher sales? We find that movies with more prerelease WOM spikes tend to have higher opening-weekend box-office revenues, controlling for WOM volume, valence, and movie characteristics. This relationship is particularly pronounced for rogue spikes.
Our work contributes to the social network literature. First, it contributes to research on the dynamic aspects of WOM. We explicitly model the temporal pattern of WOM and focus on deviations from the trend, or spikes. Studying WOM spikes also contributes to the emerging discussion on the roles and implications of irregularities, outliers, and out-of-trend observations (Barabási 2005; Goldenberg, Lowengart, and Shapira 2009; Stephen and Galak 2012; Taleb 2007). Spikes, as well as other irregularities, carry valuable information on the dynamic social interactions in complex systems.
From a managerial perspective, the 60 days before a movie’s release is the period during which the public’s interest in the movie needs to be piqued. Because our analysis suggests that the spikiness of a movie’s prerelease WOM is positively associated with its opening-weekend performance, monitoring spikes can help movie producers to more finely tune capacity scheduling and screen allocation. Movie distributors can try adjusting the timing and content of PR activities to stimulate WOM spikes. Because we show that spike messages are more likely to discuss the actor, director, trailer, and critics’ reviews, distributors might also want to make more information on these movie elements available in their prerelease communications.
Our work opens several avenues for further research. First, in light of our preliminary data showing that WOM spikes also occur for other products (e.g., books and DVDs; Figure 1), it will be interesting to study these more thoroughly. Second, our analysis focuses on online WOM. Although media and entertainment brands are discussed extensively online (Lovett, Peres, and Shachar 2013) and the entertainment industry monitors WOM mostly on online channels (e.g., by means of services such as Coosto, Hootsuite, or Naymz), we should keep in mind that more than 85% of WOM is offline (Keller and Fay 2012). Although we were not able to obtain data from offline resources, we believe that the underlying mechanisms of spike creation—that is, external or internal ignition, positive feedback, and recency—are general and hold for both online and offline WOM. Thus, one could assume that at least some online spikes occur alongside offline spikes. Had we obtained offline data, our spike detection procedure would still be valid, as would the division into event versus rogue spikes and in turn the basics of our box-office revenue model. We see two possible differences between the analysis of offline versus online WOM: First, because the flow of information in the offline channel is slower and offline networks are less connected (Liu et al. 2012), offline spikes might take longer to generate and longer to decay. Second, the distribution of spike magnitude for offline spikes might be even more skewed than for online spikes, with fewer large spikes and a larger number of small spikes. A major challenge in working with offline data is the content analysis. Current methods for monitoring offline WOM (Lovett, Peres, and Shachar 2013) involve self-report diaries, and while these methods can be effective in monitoring the number of mentions, they are limited in their ability to catch the conversation content.
A third avenue for further research is to study private online WOM channels, such as Facebook Messenger or WhatsApp, in which the WOM content can differ from that on public channels (Schweidel and Moe 2014). Because these private messaging tools are becoming more and more popular, they provide an interesting context for studying spikes. Fourth, studying postrelease spikes can be of interest: while we have demonstrated that spikes can be detected postrelease (Web Appendix C), many questions remain as to the nature of the content of spikes versus nonspikes in the postrelease context (e.g., will our results on sentiment hold in the postrelease period?). Moreover, the box-office model might need to change to include incremental viewers, screen allocation, and so forth. Fifth, although our analyses show that prerelease WOM spikes are important for opening-weekend box-office revenues, we did not consider other performance indicators, such as cumulative box-office revenues or postrelease WOM activity. Sixth, although the dimensions and categories used in our content analysis were based on discussion in the literature, they could be improved by studying their mechanisms. Such a theoretically derived framework is needed to improve our understanding of the content of WOM. Finally, ways to optimize the content analysis procedure, such as to address the tone hierarchy, the case of posts with equally dominant topics, and the recall of external events, could be further studied.
Supplemental Material
Supplemental Material, JMR.16.0138_Web_Appendix - Talk Bursts: The Role of Spikes in Prerelease Word-of-Mouth Dynamics
Supplemental Material, JMR.16.0138_Web_Appendix for Talk Bursts: The Role of Spikes in Prerelease Word-of-Mouth Dynamics by Sarah Gelper, Renana Peres, and Jehoshua Eliashberg in Journal of Marketing Research
Footnotes
Acknowledgments
We gratefully thank our research assistants at the Hebrew University: Shira Aharoni, Liron Ashton, Aliza Busbib, Yoav Haimi, Guy Keren, Dana Leikehmacher, Sria Louis, Haneen Matar, and Hillel Zehavi for the hours and hours of their life. We thank Ido Shatzky for his support with the MTurk experiment. We thank Ryan Hamilton from the Goizueta Business School for suggesting the terminology of rogue spikes and Mark Censits for being the first audience for it.
Associate Editor
Fred Feinberg served as associate editor for this article.
Declaration of Conflicting Interests
The authors declared no potential conflicts of interest with respect to the research, authorship, and/or publication of this article.
Funding
The authors disclosed receipt of the following financial support for the research, authorship, and/or publication of this article: this study was supported by the Marketing Science Institute, the Israel Internet Association, Kmart International Center for Marketing and Retailing at the Hebrew University of Jerusalem, and the Israel Science Foundation.
Notes
References
Supplementary Material
Please find the following supplemental material available below.
For Open Access articles published under a Creative Commons License, all supplemental material carries the same license as the article it is associated with.
For non-Open Access articles published, all supplemental material carries a non-exclusive license, and permission requests for re-use of supplemental material or any part of supplemental material shall be sent directly to the copyright owner as specified in the copyright notice associated with the article.