
Abstract
Emotions are central to consumer communications, and extracting them from user-generated online content is crucial for marketers, given that such consumer opinions significantly shape brand perceptions, influence purchase decisions, and provide essential insights for marketing analytics. To leverage vast user-generated data, marketers and researchers require advanced text-to-emotion converters. However, existing tools for fine-grained emotion extraction face several limitations: Lexica are constrained by their dictionaries, machine learning models by human-annotated training data, and large language models by insufficient validation. As a result, marketing research still tends to rely on mere sentiment detection instead of extracting more nuanced emotions from text. This article introduces NADE (Natural Affect DEtection), a novel text-to-emoji-to-emotion converter that first “emojifies” language and then converts these emojis into intensity measures of well-established, theory-grounded emotions. This approach addresses the limitations of existing tools by leveraging the inherent emotional information in emojis. Using human raters and state-of-the-art converters as benchmarks, the authors establish the benefits of exploiting emojis, validate NADE, and demonstrate its use in several marketing applications using data from various social media platforms. Users can apply the proposed converter through an easy-to-use online app and programming packages for Python and R.
Because humans feel first and think second, emotions strongly influence their judgments and decision-making processes (Bagozzi, Gopinath, and Nyer 1999; Berger 2014; Lowenstein and Lerner 2003). They express emotions naturally, including in written language that contains traces of their emotions (Lee 2021; Melumad, Inman, and Pham 2019). Linguistic cues, therefore, provide indicators of emotions (Ludwig et al. 2013; Ortony, Clore, and Foss 1987). Particularly on social media, consumers frequently post emotionally charged messages, offering companies and researchers unique access to these cues. By extracting emotions from social media texts, companies and researchers can monitor how consumers feel about brands and may relate their expressed emotions to relevant marketing outcomes (Berger et al. 2020; Lee, Paas, and Ahn 2024; Roberts et al. 2015; Villarroel Ordenes et al. 2017).
Through such social media listening efforts, organizations monitor social media for mentions of their brand, competitors, and related topics (Rust et al. 2021; Schweidel and Moe 2014). Spending on social listening tools is projected to reach US$8.44 billion by 2024 (Mordor Intelligence 2024), as companies seek and invest in text converters that can transform unstructured text into structured data that they can monitor, visualize, and analyze. These tools in turn usually rely on sentiment analysis to extract the emotional tone, or valence, of text (e.g., positive, neutral, negative) (Babić Rosario et al. 2016). Yet valence does not tell the full story (e.g., Cavanaugh, Bettman, and Luce 2015; DeSteno et al. 2000; Herhausen et al. 2023; Kranzbühler et al. 2020); emotions of the same valence do not exert identical effects on consumer behavior. For example, consumers consider angry reviews less helpful than sad ones (Yin, Bond, and Zhang 2014); fearful and angry newspaper articles go viral more than sad articles (Berger and Milkman 2012); and online text containing anxious, angry language holds attention, but sad language discourages it (Berger, Moe, and Schweidel 2023). From a valence perspective though, all of these emotions are negative. Thus, differentiating between specific negative (or positive) emotions might improve marketers’ ability to describe, predict, and explain consumer behaviors, beyond the level offered by valence. Despite this promise, nearly 70% of studies published in top marketing journals that use text-to-emotion converters rely solely on sentiment analysis (see Web Appendix A).
Consider some examples of how measuring more fine-grained emotions expressed on social media might help marketers address various challenges. Tracking nuanced brand emotions enables brand managers to detect and react to perceptual shifts, shape online narratives, and monitor reactions to marketing activities. If a brand activism campaign pertains to a polarizing topic, marketers need to move quickly to address adverse consumer reactions, such as calls for boycotts (Mukherjee and Althuizen 2020). Emotion analysis applied to online reviews in particular can be key, in terms of its predictive value for demand forecasting, predicting products’ success potential, detecting fake reviews, and ascertaining which features drive perceptions of review helpfulness. Finally, understanding which emotions drive engagement with social media content is crucial for creating emotionally engaging content, such as attention-grabbing headlines (Banerjee and Urminsky 2024). As these scenarios illustrate, there is a practical need for nuanced emotion analysis tools that go beyond valence.
Existing tools attempt to offer such nuanced insights but also exhibit some limitations: First, lexicon-based text-to-emotion converters such as Linguistic Inquiry and Word Count (LIWC) or National Research Council's tool (NRC) can measure fine-grained emotions, but they rely on a static word-to-emotion mapping (i.e., a dictionary), which typically is aggregated across all words in the text (Dhaoui, Webster, and Tan 2017). As a result, they do not provide outputs for any sentences or words without a direct match in the dictionary, which makes them relatively ineffective for analyzing short, informal social media texts that contain typos and slang words that do not appear in the dictionary. Second, machine learning models overcome the limitations of static word-to-emotion mappings, but they require extensive human-annotated training data, which are expensive to create (Berger et al. 2020). Although some existing training datasets cover emotional intensities (see Web Appendix A), their availability remains limited. Accordingly, most machine learning models aim to detect the presence, rather than measure the intensity of, emotions in text, which limits marketing applications that need to determine, for example, if consumers’ expressed anger indicates mild annoyance or intense rage (Bagozzi, Gopinath, and Nyer 1999; Luangrath, Xu, and Wang 2023; Moore, Harris, and Chen 1995). Third, large language models (LLMs) can leverage vast amounts of unannotated training data through transfer learning, but they often still require fine-tuning with human-annotated data to perform downstream tasks such as text-to-emotion conversion (Bishop and Bishop 2023). In addition, few existing models are validated; they require in-depth operational knowledge and typically focus on detecting the presence rather than the intensity of emotions.
To address all these challenges, we propose a novel text-to-emoji-to-emotion converter that we refer to as NADE (Natural Affect DEtection). This tool first “emojifies” the available language and then translates the obtained emojis into a well-studied, theory-grounded set of eight basic emotions based on Plutchik's (1980) model. The eight core emotions and their combinations create a spectrum of 32 emotions in total (see Web Appendix A). By using emojis as implicitly human-labeled training data, NADE reduces the need for explicitly human-annotated data, overcomes the limitations of predefined dictionaries by allowing for inferences of the emotional intensities of out-of-vocabulary words, and effectively handles informal language such as slang or typos. To support its adoption, we present NADE as a freely available, user-friendly web app, 1 as well as in programming packages for both Python 2 and R. 3 It requires no specific programming skills or domain-specific knowledge; a standard laptop is sufficient to run it. In contrast with services such as OpenAI's ChatGPT, its inference happens locally, so no data leave users’ machines, which is particularly beneficial for applications with sensitive data. That is, we propose NADE as an effective, accessible tool for marketing applications and beyond.
Emotion Measurement
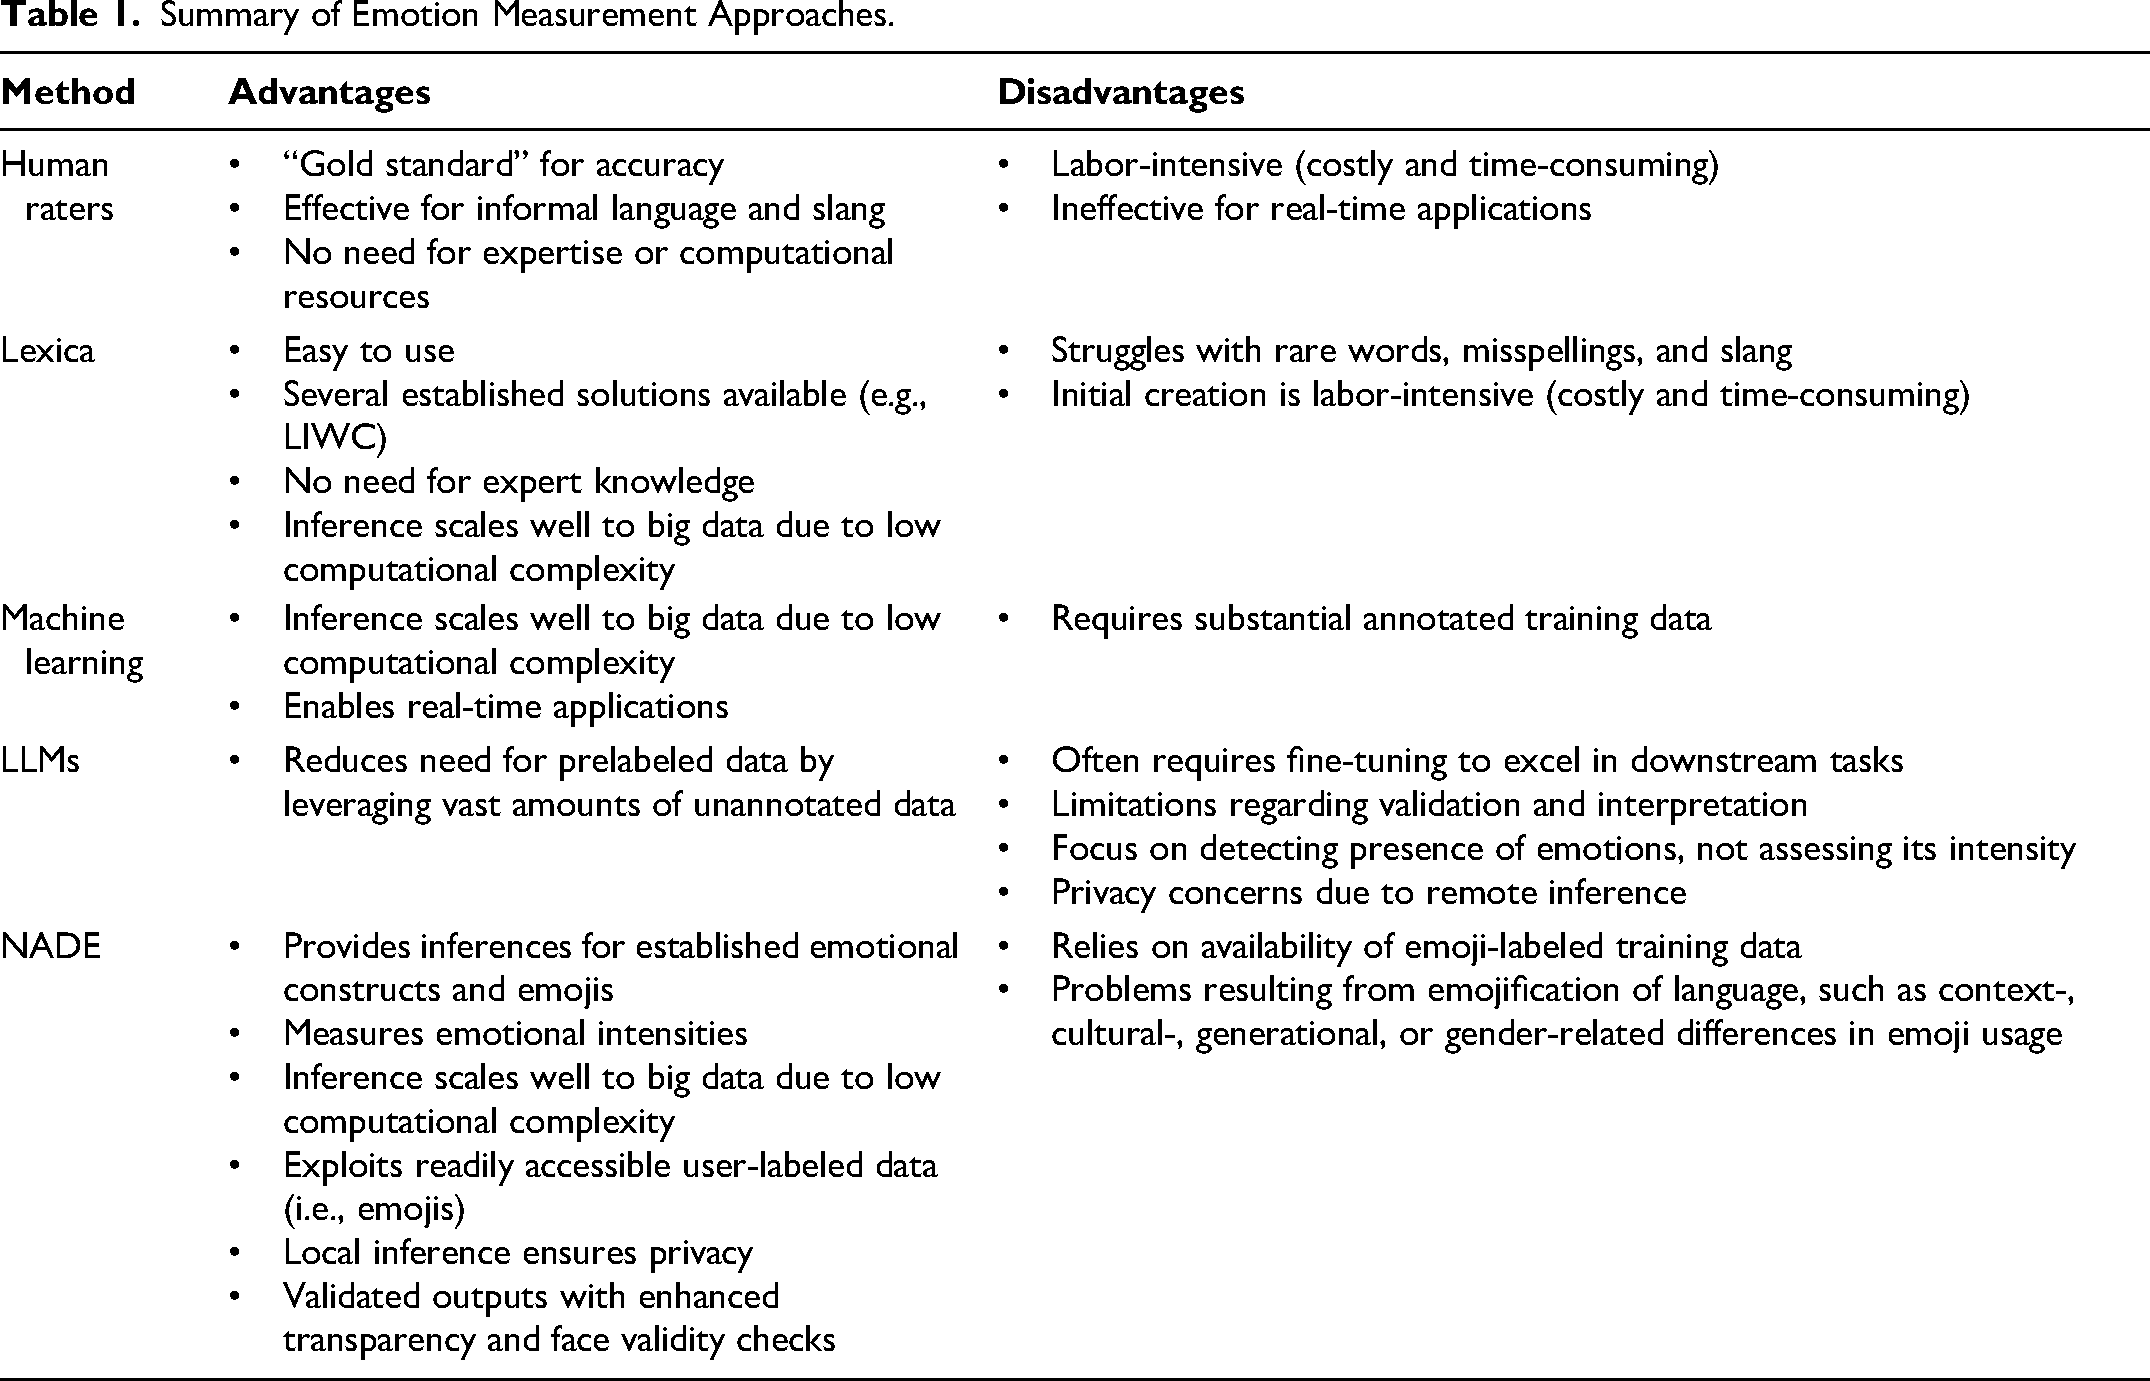
To establish a foundation for our proposed method, we first introduce the main existing methods for emotion extraction, including their advantages and disadvantages (see Table 1). The methods currently available to researchers include (1) human raters, (2) lexica, (3) machine learning models, and (4) LLMs. 4
Summary of Emotion Measurement Approaches.
Human Raters
Relying on actual human raters to label texts manually gained popularity with the advent of crowdsourcing platforms, such as Amazon Mechanical Turk (Berger and Milkman 2012; Teixeira, Wedel, and Pieters 2012). Humans experience emotions and, for the most part, can recognize them easily, even if the texts contain informal language or slang. Humans also do not require expert knowledge (e.g., programming skills) or computing resources to rate emotions. However, it is costly and time-consuming to solicit manual ratings, especially in big data contexts (Berger et al. 2020); it is impossible for applications that require real-time evaluations.
Lexicon-Based Converters
Lexicon- or dictionary-based converters started to appear in the early 1990s (Francis and Pennebaker 1992) and are frequently used in both academic research and practical applications (e.g., Berger, Sorensen, and Rasmussen 2010; Ludwig et al. 2013). These lexica, such as LIWC (Pennebaker, Booth, and Francis 2001) or NRC (Mohammad and Turney 2013), provide ratings of the emotional strength of a predefined set of words and range of emotions. Thus, human annotations are needed initially, as well as each time the dictionary is updated. Because lexical approaches do not require expert knowledge, and easy-to-use dictionary-based tools are widely available, this emotion extraction method remains very popular among researchers (see Web Appendix A). However, most dictionaries contain only a few thousand words, and they generally do not deal effectively with rarely used words, misspellings, or slang. This limit is a notable constraint for the informal language that usually appears in user-generated content, such as social media comments (Dhaoui, Webster, and Tan 2017).
Machine Learning-Based Converters
Traditional machine learning models (e.g., gradient boosting, support vector machines, and random forests) are scalable (Dhaoui, Webster, and Tan 2017; Felbermayr and Nanopoulos 2016), but they also require substantial annotated training datasets (Berger et al. 2020). The difficulty and expense associated with asking people to rate vast amounts of texts to define fine-grained emotions thus arise in this case as well (Dhaoui, Webster, and Tan 2017).
Large Language Model–Based Converters
Some more recent innovations in deep learning, related to self-supervision and transfer learning, have reduced the need for extensively prelabeled training datasets (Bishop and Bishop 2023). For example, LLMs can be trained to predict parts of sentences (e.g., randomly masked words, subsequent words) in a self-supervised manner, learning from large volumes of existing textual content, such as books, news articles, social media posts, or online reviews. However, LLMs may require fine-tuning with human-annotated data to excel at downstream tasks (e.g., emotion detection), and this element requires expertise and prelabeled data. As we noted, existing models largely lack proper validation, so the reliability of their outputs remains uncertain. In addition, most LLMs primarily detect the presence of specific emotions, rather than intensities. The propensity scores provided by these LLM classifiers do not accurately reflect emotional intensity, as they often struggle to identify moderate emotional levels due to their tendency toward overconfidence (Wang, Feng, and Zhang 2021).
Some of these LLM issues can be mitigated by using proprietary services, such as on-demand hardware from cloud providers, pretrained models from online repositories such as Hugging Face, or models developed by AI service providers like OpenAI and issued through accessible application programming interfaces (APIs). These services handle the training, maintenance, and inference steps for users, but the used datasets and model architecture are usually confidential, such that the models remain black boxes. Typically, the service providers also require users to share their data by sending them to a remote server for processing, which may conflict with company policies that restrict data sharing. The substantial environmental costs associated with training and operating LLM-based converters, including their significant energy consumption, raise additional concerns (Wu et al. 2022). 5
NADE: Bridging Text and Emotion Through Emojis
As a novel approach to emotion detection, we propose NADE, which uses emojis as an intermediate step to extract emotions from text. This “emojification” step leverages explicit emotional cues conveyed by emojis, offering several advantages over traditional methods. First, emojis provide direct representations of emotions, as intended by the writer. Thus, they offer a reflection of the writer's actual emotional state. Second, emojis are widely recognized and used, and they effectively capture emotional nuances in diverse texts. Third, an emojification approach enhances scalability, because it can leverage the vast amounts of user-labeled data that are readily available online, eliminating the need for human-annotated training data. Fourth, using emojis allows for face validity checks; researchers can compare observed and predicted emojis in sentences that contain emojis, which enhances the transparency of the model.
Beyond the emojification step, NADE offers two additional advantages. Because its inferences happen locally, NADE avoids privacy issues associated with LLM-based services like ChatGPT that require potentially sensitive data to be sent to remote servers. In addition, we thoroughly validate our model to ensure that it measures the intended emotional constructs accurately.
In summary, NADE leverages the inherent emotional information in emojis, leading to better emotion measurement than is available through existing text-to-emotion converters. This approach not only improves accuracy and scalability but also increases transparency. 6
App Implementation
NADE's Architecture
Despite extensive research, no consensus exists regarding the best way to conceptualize emotions. We turn to Plutchik's hybrid model, which (1) considers emotional intensities instead of the mere presence of an emotion, (2) captures a wide range of emotions that also appear in alternative theories (see Web Appendix A), (3) is easy to interpret, and (4) has been used frequently and across disciplines (e.g., Nguyen, Calantone, and Krishnan 2020; Smirnov and Hsieh 2022; Vosoughi, Roy, and Aral 2018). We also demonstrate NADE's adaptability to other emotion theories, such as the valence-arousal-dominance (VAD) framework (see our “Limitations and Future Research” section).
As noted, NADE differs from existing text-to-emotion converters in its novel use of emojis in an intermediate step; formally then, it is a text-to-emoji-to-emotion converter. Its application entails a two-stage approach. Figure 1 provides an overview of its architecture, detailing how we train the two stages.
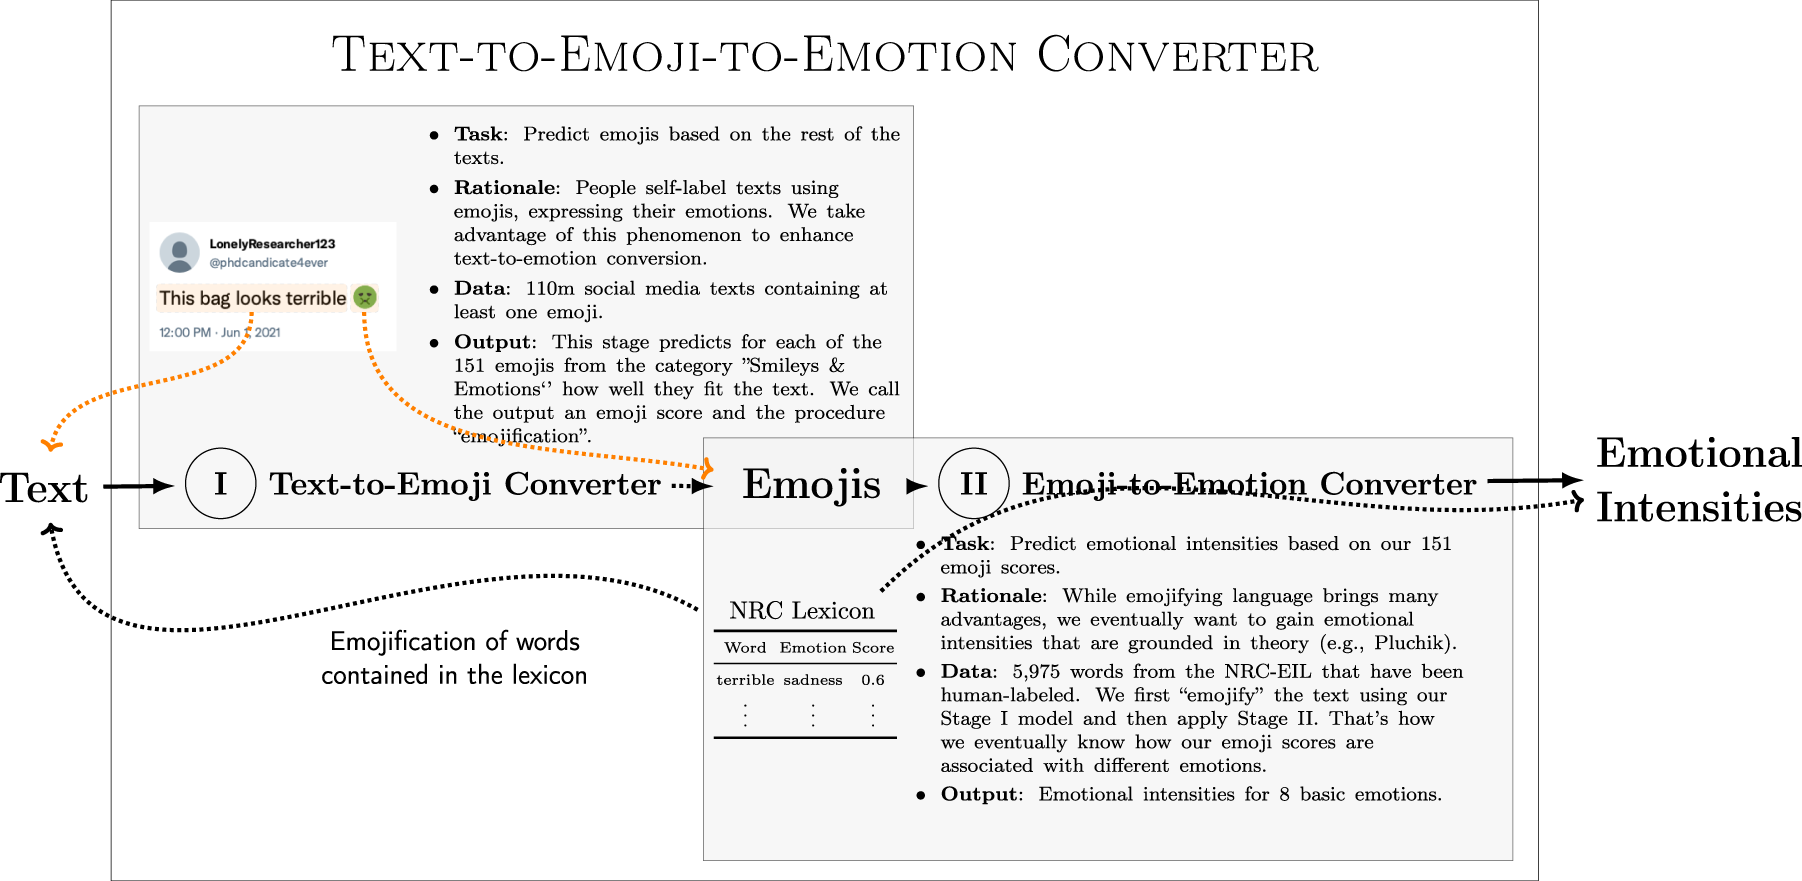
Model Architecture of NADE.
In Stage I, we train the model on emojis present in social media texts, according to a set of 151 emojis from the “Smileys & Emotion” category, as standardized in Unicode v13.0. 7 The texts are freely available in large volumes because users self-label their posts with emojis, which represent implicit human ratings. Researchers can use these predicted emojis directly in their analyses. Rather than relying on a vast set of emojis, researchers might prefer investigating fewer emotions that are grounded in theory. Therefore, Stage II consists of converting the predicted emojis into emotions. In detail, we convert the array of 151 emojis into the eight basic emotions defined in Plutchik's (1980) model by using the NRC lexicon, which is well-suited for rating the emotional content of online texts (Mohammad and Turney 2013; Vosoughi, Roy, and Aral 2018).
To emojify the text, we use multilabel classification (fastText) and predict emojis from text based on 110 million English-language tweets (see the subsequent section, “Stage I: From Words to Emojis” for details). Figure 2 shows the top emojis predicted by our Stage I model for the sentence “that's terrifying” (e.g.,  ,
,  ,
,  ). Notably, the emojis are only required for model training; inferences are possible for texts without emojis, as the example shows.
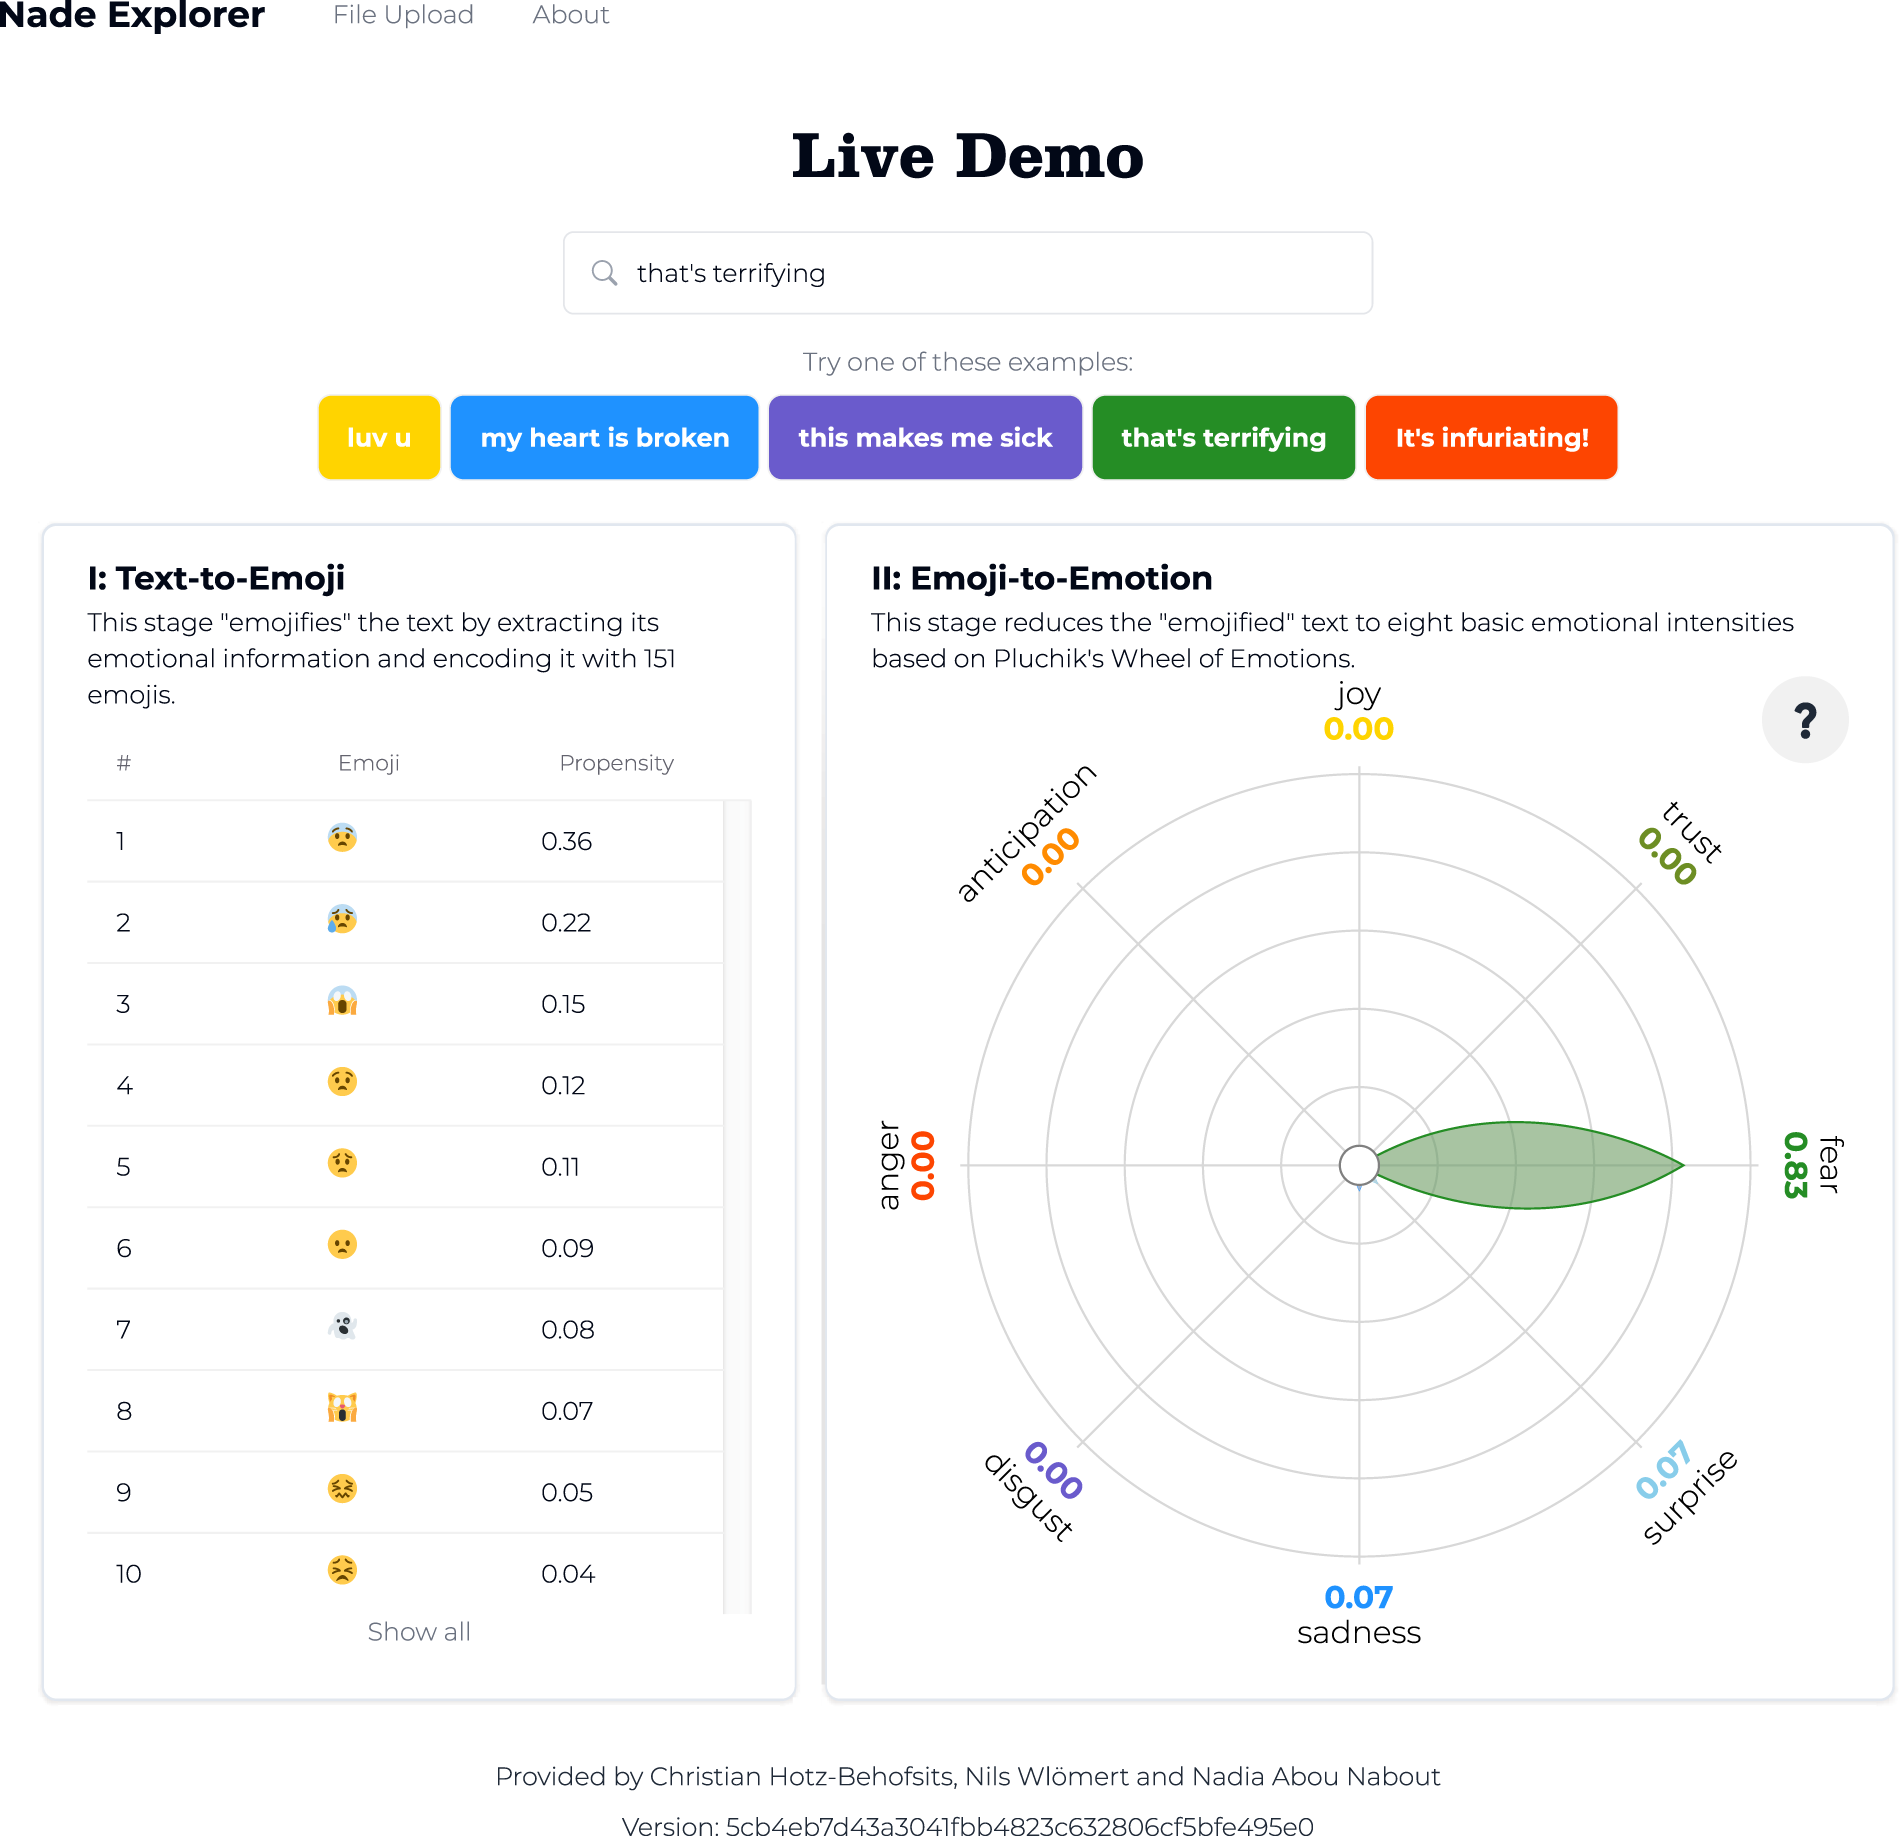
App Interface Showing NADE Conversion of “That's Terrifying.”
The training in Stage II thus reflects the intermediate step of emojifying the 5,975 words in the NRC lexicon (see our section, “Stage II: From Emojis to Emotions” for details). We create a 5,975 × 151 matrix to link each word to the 151 emojis using the trained Stage I model. Then, for each emotion, we regress the lexicon's emotion scores on the “emojified” words using gradient boosting, resulting in one model for each of Plutchik's eight basic emotions. Consider the word “unclean,” for example. In the NRC lexicon, it takes a disgust score of .586. Stage I converts it into a vector of 151 emoji scores, in which  ,
,  , and
, and  exhibit the highest scores. The trained model for disgust then predicts an emotional intensity of .57, close to the lexicon's score. Figure 2 also details the inferred emotions for the sentence “that's terrifying.” As we might expect, the text is associated with a high level of fear.
The example in Figure 2 thus demonstrates the app's process for text-to-emotion conversion on previously unseen texts. Users can enter text either directly or by uploading a file of texts to be rated. To install our progressive web app, users simply need to open it in their browser. NADE does not require further internet access. Rather, all data processing and inferences happen locally on each user's device.
Why We Emojify Language First
Both stages of the modeling architecture in Figure 1 rely on existing machine learning approaches (i.e., supervised word embeddings and gradient boosting), but combining them by using emojis in the middle is novel. 8 This section, therefore, outlines why we emojify language in the first stage and describes the advantages of this emojification step instead of directly converting the text to emotions (i.e., text-to-emotion converters).
Natural fit to emotion detection
The human ability to communicate relies on both language (phonemes, words, phrases, sentences, etc.) and nonverbal cues, like emojis, which represent paralanguage (Bai et al. 2019; Luangrath, Xu, and Wang 2023). The use of emojis has consistently and dramatically increased since their invention in the late 1990s (Bai et al. 2019); even the Oxford English Dictionary considers emojis a legitimate form of communication, choosing the emoji  (“face with tears of joy”) as its 2015 Word of the Year (Oxford Languages 2015). Although emojis can serve various purposes, their primary function is to convey feelings (Oleszkiewicz et al. 2017). Because they mirror human expressions, they add emotional context to text messages (e.g., smiley face indicating a joke) (Bai et al. 2019). Even young children with minimal computer experience can match emojis with corresponding emotions (Oleszkiewicz et al. 2017). Thus, emojis are ideal for emotion detection tasks.
Direct representation of emotions
Emojis provide a direct representation of the emotions intended by the writer. Leveraging the emotional cues they provide (instead of relying only on words, independent of their emotional content) makes the emotional context of the message clearer. In support of this claim, we test an approach similar to NADE, but without emojis, and find that it cannot achieve the same performance (Web Appendix B).
Cost-effective model development
Unlike direct text-to-emotion conversion efforts, emojification (Stage I) can leverage vast, existing, observational datasets, which significantly lowers model development costs. In addition, efforts to adapt NADE to other emotional theories can build on existing emojification, without requiring additional adjustments in Stage I.
Universal language and ease of extension
Emojis constitute an independent language (Bai et al. 2019). Converting text into standardized emojis abstracts away from natural language, as emojis are used worldwide (Kralj Novak et al. 2015) and general semantics are preserved across different languages (Barbieri et al. 2016). In turn, extending NADE to other languages also is straightforward.
Extended vocabulary coverage
Even though NADE builds on a well-established lexicon in Stage II, converting text into emojis first can reveal emotions that a lexicon alone cannot, due to its limited vocabulary. Consider the sentence “I’m tired of this lol.” It consists of five terms and expresses emotional content. The NRC lexicon can assess the similar phrase “tiredofit,” assigning it an intensity of .6 on the anger dimension, but it does not include either “tired” or “tired of this.” The word coverage of different dictionaries varies, but this example reflects a common problem: Dictionaries contain similar phrases and provide ratings for known words, but inferences are only possible if the words exactly match their entries. By augmenting ratings such as those provided by the NRC with the emoji predictions, we can infer emotional intensities for out-of-vocabulary words.
Improved face validity and transparency
Researchers can use the emojis predicted in Stage I to check the face validity of their results by comparing the observed and predicted emojis in sentences that already contain emojis. Such a capacity helps open the black box around the model's operations, in contrast with deep learning approaches, for which the middle layers of the networks represent latent meanings rather than well-defined emojis.
In summary, not only is it natural to use emojis as readily available human-annotated training data, but emojis also improve measurement by allowing us to focus on explicit emotional content. We believe that these reasons likely explain the superior performance of NADE compared with other approaches, as we show subsequently.
Methodology
In this section, we offer further detail about how we trained the two stages to establish NADE in the first place.
Stage I: From Words to Emojis
Not all emojis express emotions, so we purposefully focus on those contained in the “Smileys & Emotion” category. This set comprises 151 emojis, including hearts (e.g.,  ,
,  ,
,  ), faces (e.g., ,
  ,
,  ), and other objects (e.g.,
  ,
,  ,
,  ) that can express emotional states. Because it encompasses such an expansive set of emojis, NADE can go beyond text-to-emoji converters that feature a limited subset of only the most popular emojis (see Web Appendix A). Such a capacity is particularly relevant, because less frequently used emojis have greater power to discriminate among emotions, as we demonstrate subsequently.
Emojis mostly appear only once in a given text (see Web Appendix B), so we gauge whether an emoji is present in a text rather than how often it occurs. Similar to traditional sentiment analysis or discrete emotion detection, this first stage of NADE thus can be considered a classification task. We train the classifier to predict observed emojis readily available in social media texts, which represent implicitly provided human ratings.
Sample
To establish NADE, we scraped over 7 billion tweets from Twitter (prior to its rebranding as X) between May 23, 2018, and February 8, 2021, without restrictions, except each text had to contain at least one emoji. Our use of Twitter for the data collection follows prior research (e.g., Liu, Singh, and Srinivasan 2016; Rust et al. 2021; Schweidel and Moe 2014). At that time, it was still possible to obtain substantial data from its streaming API with few restrictions. In addition, the site enforces short, concise texts through character restrictions, so we can extract clean training pairs of emojis and their corresponding texts. Prior research also suggests that consumer opinions generally correlate across platforms (Rust et al. 2021), so even if we train our model with Twitter data, we anticipate its generalizability; we can confirm this prediction with applications to data from other platforms.
From all English-language tweets in our sample, 4.12 million tweets include location information, which enables us to investigate emoji usage across cultures. The dataset is concentrated in the United States, but we also have substantial representation from Asia, Africa, and Europe.
In Figure 3, we depict the geocoded tweets on a world map to illustrate the density and distribution of tweets globally. With the exception of the three smallest regions in terms of population (i.e., Melanesia, Micronesia, and Polynesia), our dataset features thousands of tweets representing all regions defined by the United Nations. 9 These geocoded tweets also reveal high correlations in the frequency of emojis used across regions, offering some confidence that, for example, the average U.S. Twitter user is not too different from other Twitter users around the globe (see Web Appendix B for more details).
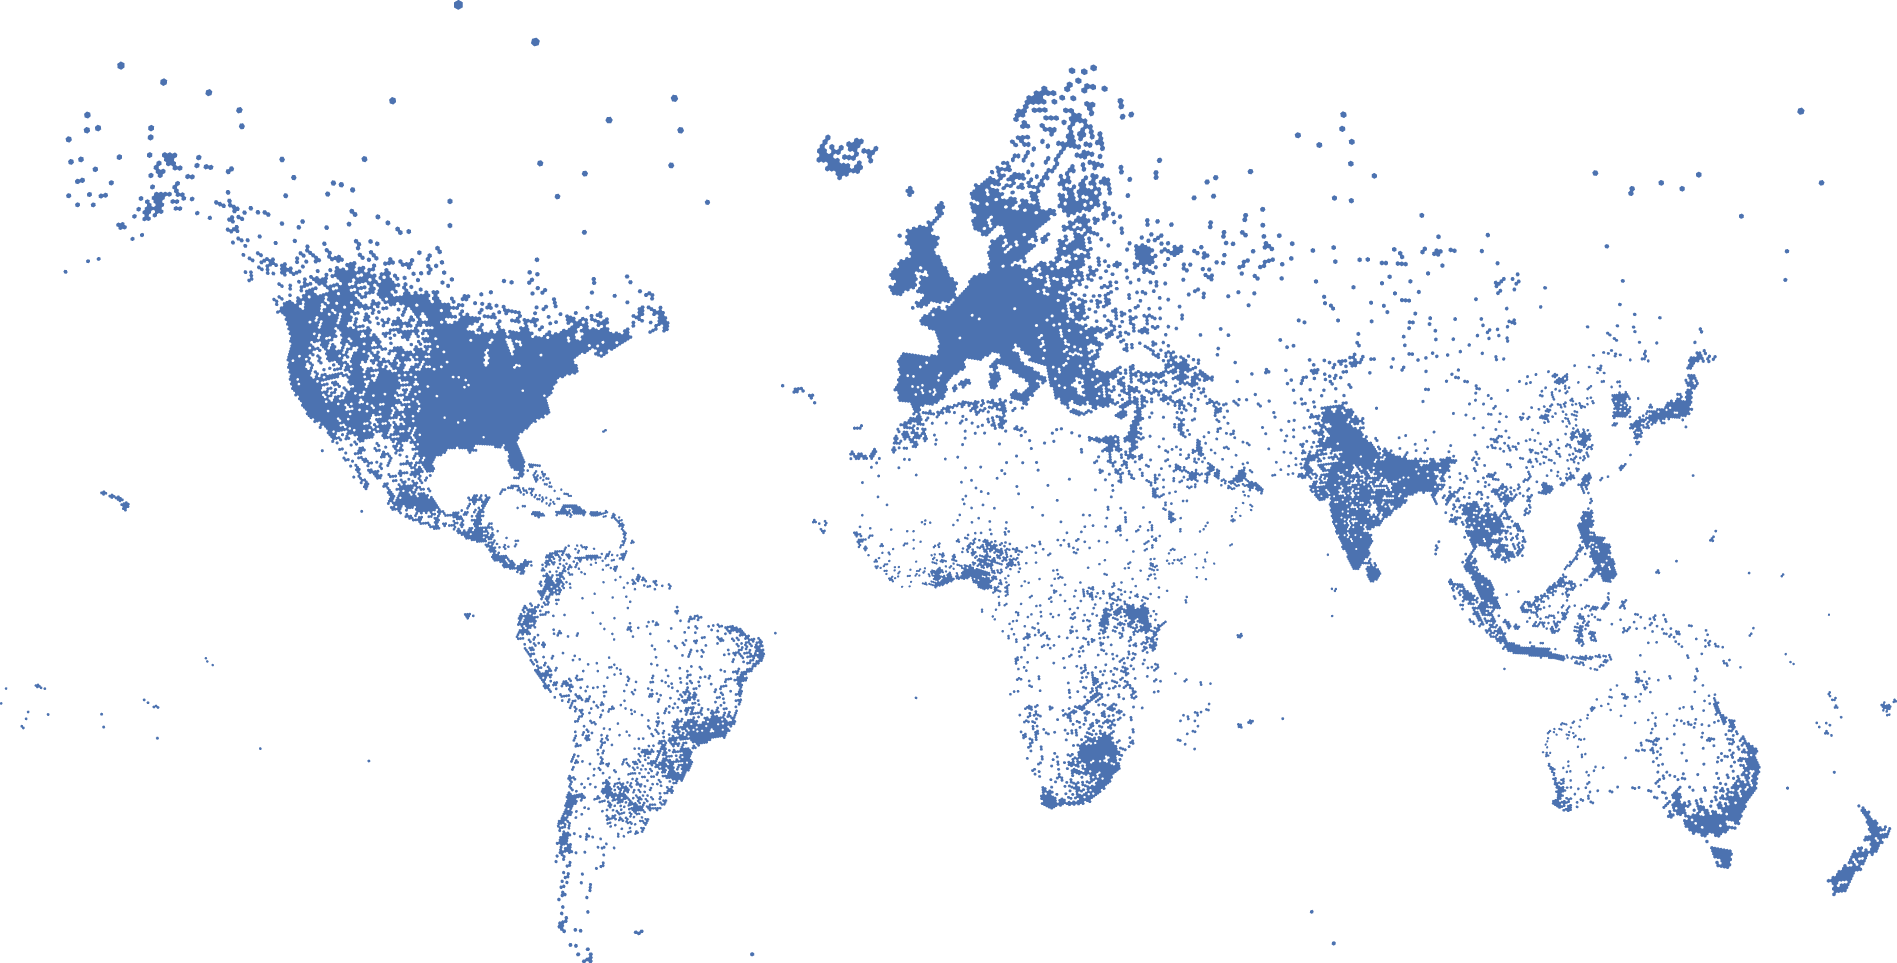
Geographical Origins of Geocoded Tweets.
Data
Following prior research (Felbo et al. 2017) and to ensure high-quality training data, we focus on a subset of approximately 110 million unique English-language posts that (1) do not contain any hyperlinks or media, (2) consist of a single sentence, and (3) contain at least one of the 151 emojis from the “Smileys & Emotion” category. Figure 4 displays the frequency of the top 50 emojis (Web Appendix B lists all of the emojis) and their skewed distribution.
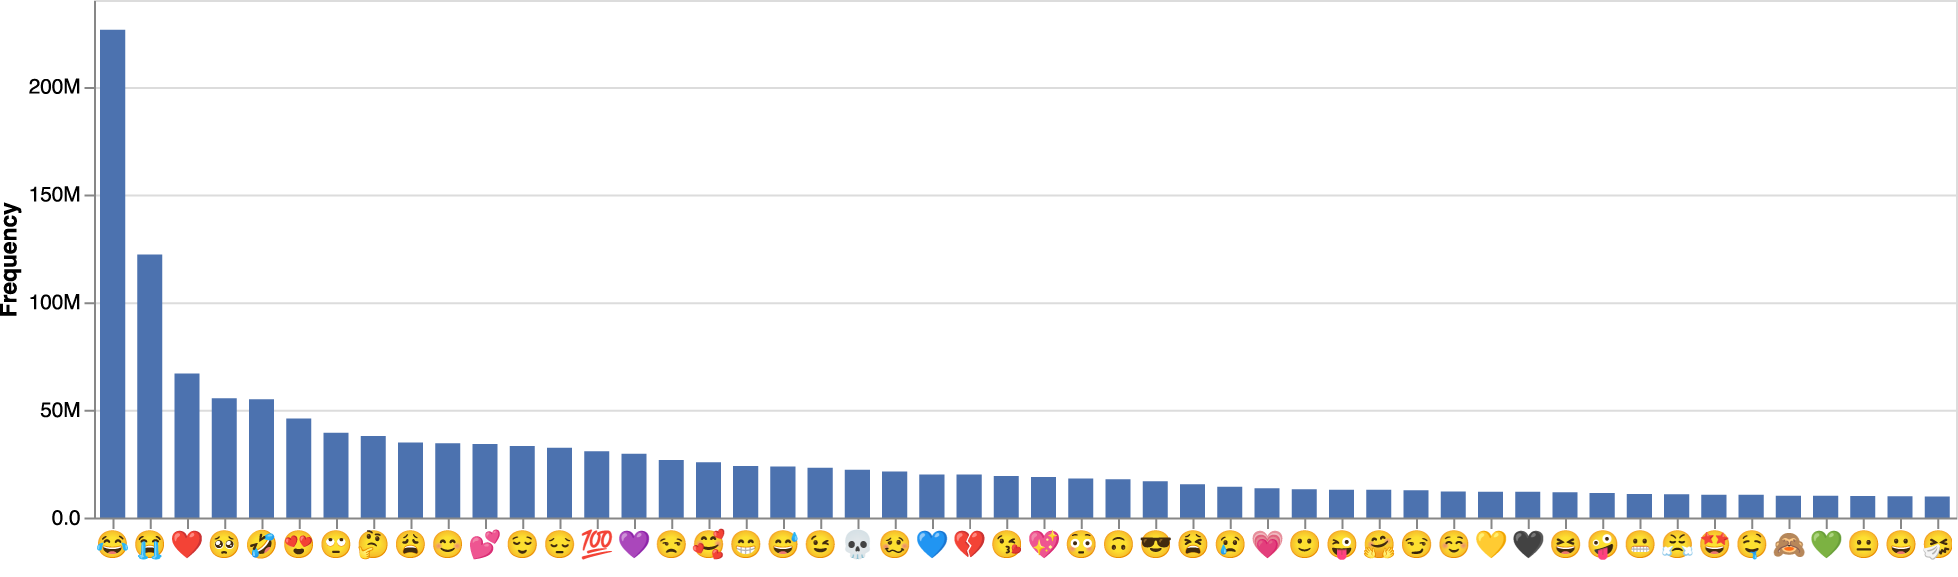
Frequency of Top 50 Emojis in Training Data.
Most classification algorithms would be biased toward the majority class (i.e., frequently used emojis), when applied to such an unbalanced dataset (Goodfellow, Bengio, and Courville 2017). To avoid such bias, we generate a subsample from the training set by randomly selecting 250,000 sentences for each class (i.e., emoji) (Felbo et al. 2017). With minimal preprocessing (Web Appendix B), we split the data into training (90% of the data), validation (5%), and test (5%) sets. We use the training set for the initial training, the validation set for hyperparameter optimization, and the remaining texts for model selection.
Modeling approach
Multiple emojis could appear in a single sentence, so we use multilabel classification. Each word of a sentence also could be a potential feature, which makes this classification task challenging, particularly if we consider smaller units of text (e.g., characters, word parts). Traditional bag-of-words approaches to such classification tasks operate on the word level and assume independence across words and their order. Alternative approaches that use word embeddings are computationally more efficient, because they represent words in a much smaller dense vector space (Goodfellow, Bengio, and Courville 2017).
Any text classifier that supports a multilabel objective can be used in the first stage. We opt for fastText, which relies on embeddings at the subword level (e.g., Bojanowski et al. 2017) and represents words as linear combinations of all the subword embeddings (Web Appendix B). It was developed by Facebook specifically for processing social media texts, and its efficiency and predictive performance make this model a popular tool in social science research (Alantari et al. 2022; Salminen et al. 2022). The trained model builds on a vocabulary of 9,796 words, of which 5.1% comprise nonalphabetic and 2.4% represent nonalphanumeric characters. As confirmed in recent research (Luangrath, Xu, and Wang 2023), these nonverbal communication cues (e.g., punctuation marks) are critical indicators of sentiment valence and intensity. Therefore, NADE accounts for them in the prediction of emojis by using nonalphabetic and nonalphanumeric characters as inputs. In addition, NADE can include unknown words if they are composed of already known (sub)words. To achieve both computational efficiency and predictive performance, we use the mean of all word vectors of a sentence to predict emojis. The result is a rather simple model that supports faster training and inference. Unlike state-of-the-art LLM-based converters, NADE does not require special hardware (e.g., graphics processing units, tensor processing units, large memory) to process large data volumes. More details about the first stage can be found in Web Appendix B.
Results
The first stage outcomes reveal the strength of the association (scaled between 0 and 1) between a word (or sentence or longer texts) and each of the 151 emojis. In a sense, Stage I constitutes a ranking problem among the 151 emojis, in which we sort the predicted emojis according to their emoji score. The lower the rank, the better the fit with the sentence, according to the model. If instead we were to predict emojis randomly, a true emoji would occupy a position past 75 (151/2) in half of the cases. In contrast, NADE achieves a rank lower than 20 in 50% of the cases (i.e., median rank). We also note the substantial heterogeneity across emojis in terms of Stage I performance. All emojis are noisy labels, but some are much easier to predict than others. Less noisy, more easily predicted emojis include ,  , and
, and  , whereas noisier, harder-to-predict emojis include, for example,
  ,
,  , and
, and  (see Web Appendix B for details).
To establish the predictive ability of Stage I, we provide an example of the top five predicted emojis for an illustrative set of tweets mentioning “Amazon” in different contexts in Table 2. The original tweets did not contain emojis, yet the predicted emojis appear face valid and fit the corresponding texts well.
Top Five Predicted Emojis for Amazon-Related Tweets.
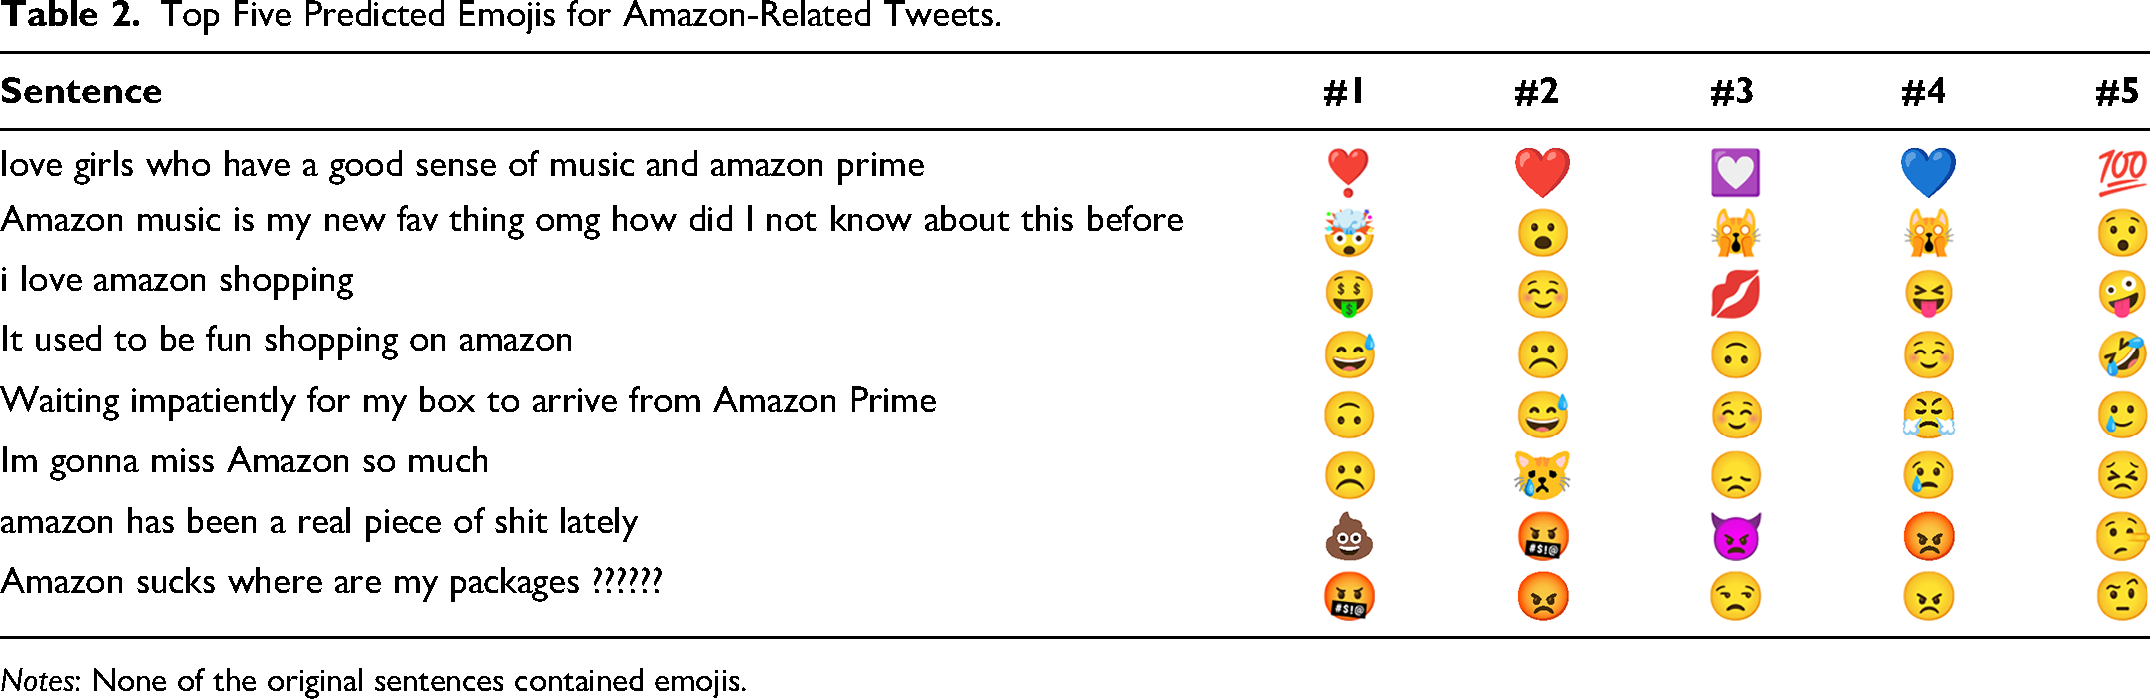
Notes: None of the original sentences contained emojis.
Stage II: From Emojis to Emotions
Using the emojis predicted in Stage I, we convert them into the eight basic emotions (Plutchik 1980) (and to VAD, in Web Appendix B). We seek intensities as outputs (i.e., strength of each emotion), rather than a binary output (i.e., the presence of an emotion). A simple mapping between emojis and emotions cannot capture the complex relationships, so we adopt a regression approach (Buechel and Hahn 2016) to obtain emotional intensities from predicted emojis.
Data
To transform emojis into emotional intensities, we use prelabeled texts from the NRC Emotion Intensity Lexicon, 10 a comprehensive, frequently used lexicon (e.g., Nguyen, Calantone, and Krishnan 2020; Smirnov and Hsieh 2022; Vosoughi, Roy, and Aral 2018) that generally outperforms other dictionaries in terms of classification precision (Felbermayr and Nanopoulos 2016) and that is available in multiple languages. It uses crowdsourced input to rate the intensity of Plutchik's (1980) eight basic emotions for 5,975 English words. Therefore, we combine the Stage I model results with the 5,975 words covered by the Emotion Intensity Lexicon to obtain the strength of the associations of the NRC words and all 151 emojis. These associations in turn provide the input for predicting the emotional intensity scores for the eight basic emotions covered by the NRC lexicon (Web Appendix B). That is, with the predicted emojis from Stage I, we can capture a broader spectrum of emotional expressions than present in the NRC lexicon alone, because it includes not only standard vocabulary but also colloquial language, idioms, and typographical errors.
To account for the confidence of the Stage I classifier, we use its propensity scores as an input for Stage II. Web Appendix B shows that a coarse distinction between a few distinct levels of certainty already enables the second stage to perform better than considering only emojis’ (predicted) presence.
Modeling approach
Tree-based methods perform well on sentiment analysis tasks (Felbermayr and Nanopoulos 2016; Hartmann et al. 2019), are robust to multicollinearity, and offer high run-time efficiency (Hastie, Tibshirani, and Friedman 2017). Therefore, we use gradient boosting to estimate an independent model for each of the eight core emotions, such that we could theoretically also extend the set of emotions if needed. In addition, gradient boosting models offer the valuable ability to quantify the importance of emojis based on how often they inform the necessary split decisions during tree-building. Moreover, to prevent the models from overfitting on the training data, we use early stopping, regularization, and holdout validation (see Web Appendix B). We optimize all the hyperparameters (e.g., number of trees) using a grid search based on fivefold cross-validation (Goodfellow, Bengio, and Courville 2017) for each emotion separately. We then retrain the final models with the whole training set.
Results
In Figure 5, we list the top 15 emojis per emotion and the number of times the model uses them as measures of discriminatory power. The associations between the specific emojis and emotions are face valid. In addition, more rarely used emojis tend to be responsible for the tree-building decisions, which highlights the importance of considering a broader set of emojis to improve discrimination across emotions. For example, the emojis  ,
,  , and
, and  are most relevant to discriminate across varying intensities of anger, yet they are not among the top 100 most frequently used emojis in our training data (see Web Appendix B). Among the 10 most important emojis for measuring anger, is the most frequently used, occupying only rank 43 in the full list of the most frequently used emojis. In addition, we note that basic emotions are not entirely independent, leading to some overlap among predictors. For example,
  is relevant for measuring both joy and trust. This, however, does not indicate the direction of the relationship; it only reveals that the emoji is important for tree-building decisions. The same emoji, accordingly, can correlate positively with one emotion and negatively with another.
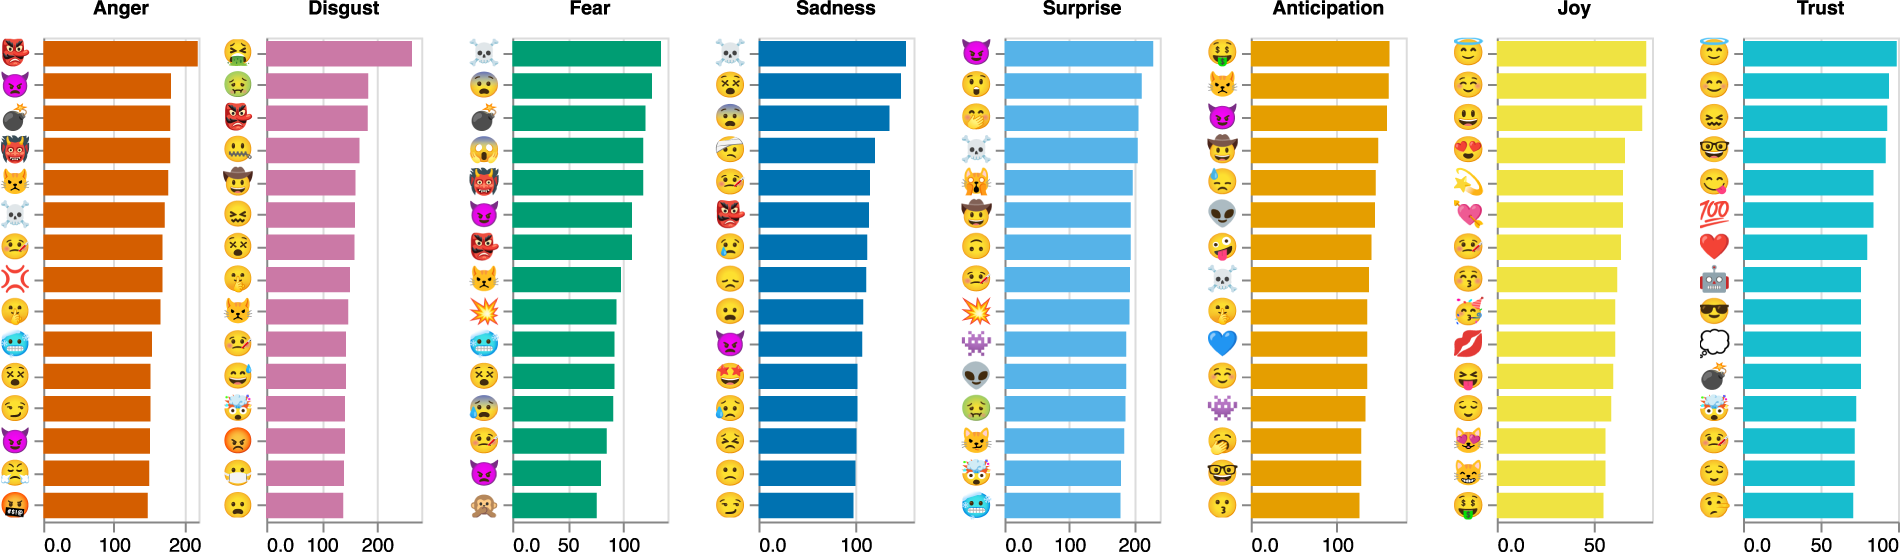
Importance of Top 15 Emojis for Predicting Basic Emotions.
Validation
Match with Human Ratings
A drawback of many existing text-to-emotion converters is the lack of validation of their outputs (i.e., the reported emotion constructs) (Berger, Moe, and Schweidel 2023), which is crucial to ensure their robustness for a wide range of contexts (Berger et al. 2020). To establish that the emotion scores of our model represent the underlying theoretical concepts, we benchmark our model against human raters, and then compare how NADE performs on this task with the performance attained by other state-of-the-art text-to-emotion converters. For this comparison, we selected two popular lexicon-based converters (NRC and LIWC) and five LLM-based converters. Four of these LLM-based converters represent especially popular models from Hugging Face: Emotion English DistilRoBERTa-base (EE-DistilRoBERTa), DistilBERT, PySentimiento, and EmoRoBERTa, all of which have been fine-tuned to perform emotion classification tasks. 11 The other converters provide inferences for some basic emotions defined by Plutchik (1980), but not all. Thus, we cannot report complete results for all eight emotions that NADE covers. In addition, we used OpenAI's API (GPT-4) to rate the intensity of emotions contained in the same texts (Web Appendix C).
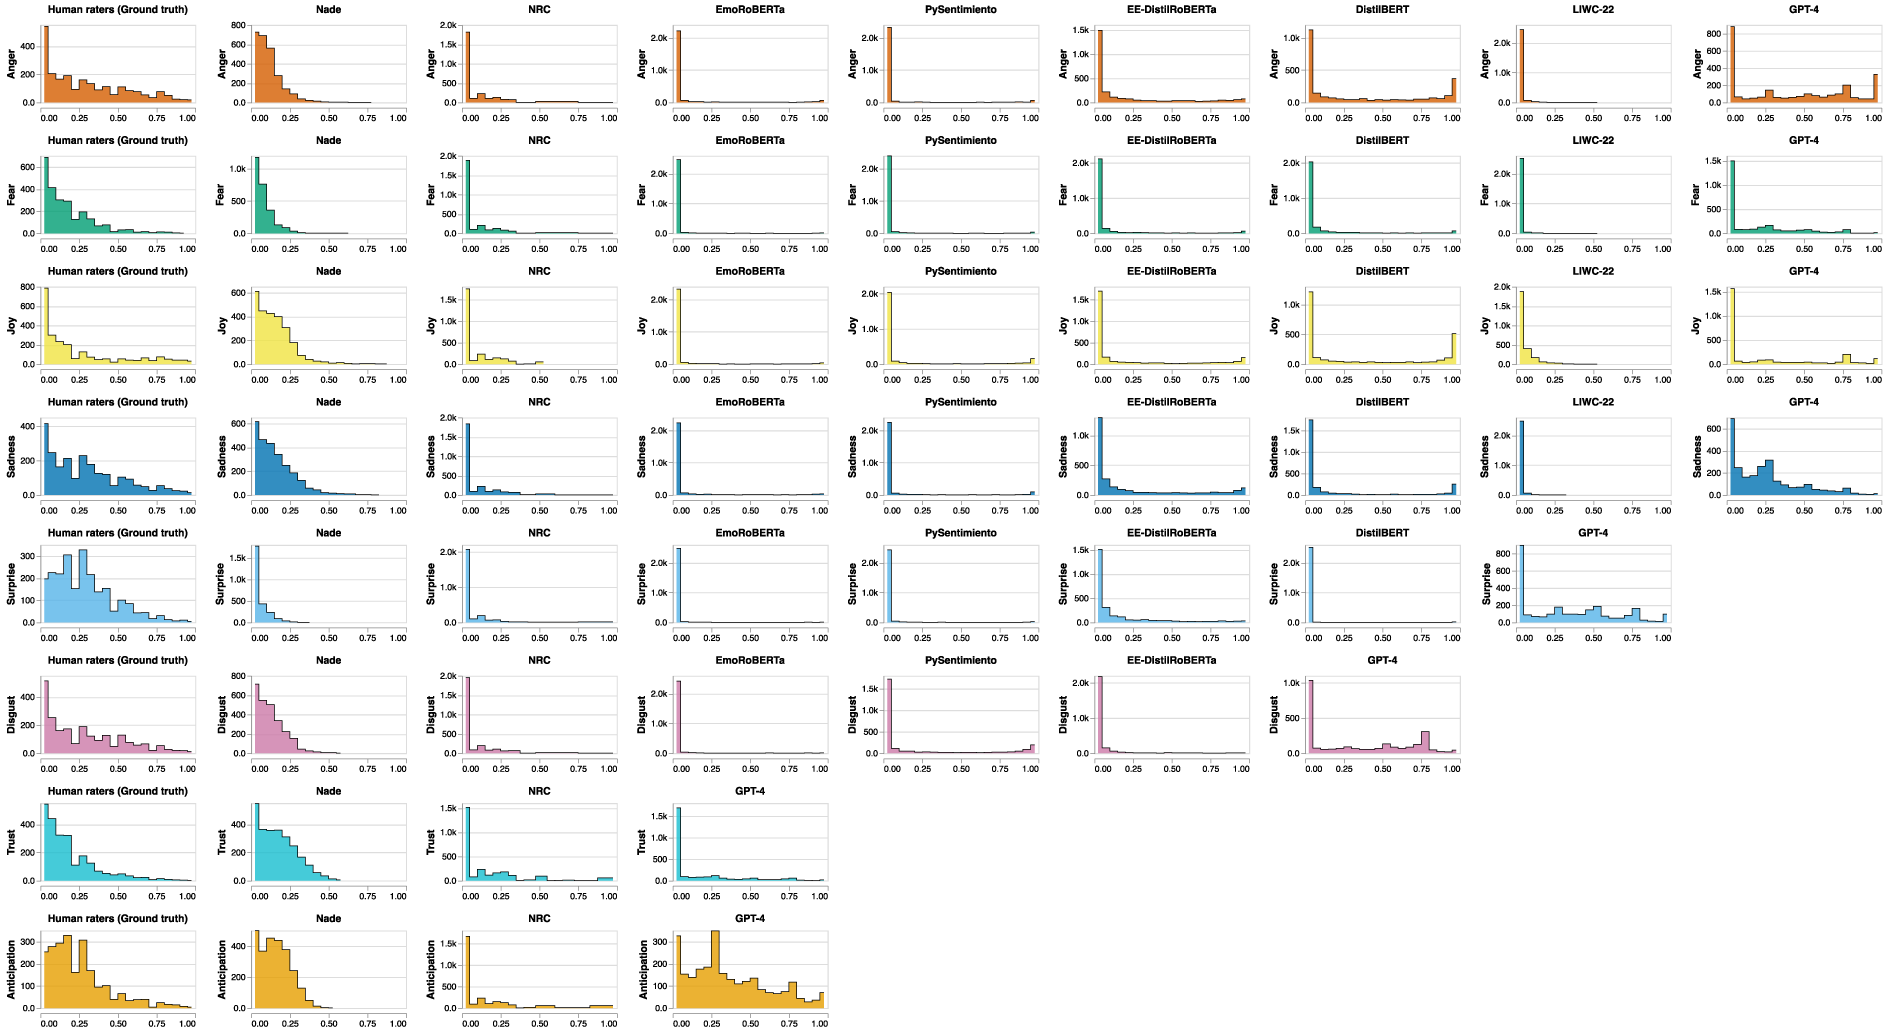
Distribution of Emotional Intensities in Human Ratings and Scores from Text-to-Emotion Converters.
To obtain the ground truth (i.e., human ratings), we recruited 920 workers from Prolific. Each worker rated 25 out of a total set of 2,605 random tweets about S&P 500 companies. On average, each tweet was assessed by eight raters. They annotated each tweet with emotional intensities on a five-point Likert scale for the eight basic emotions: anger, fear, sadness, disgust, joy, surprise, trust, and anticipation (Web Appendix C).
Because there is no single, standardized scale for measuring emotions, the scores obtained from the different converters vary. Typically, they apply a 0–1 scale or a five-point Likert scale. We applied min-max scaling to normalize all outputs to a range between 0 and 1 and thus achieve consistency without losing information. The tests of NADE's alignment with the human ratings reflect three metrics: root mean squared error (RMSE), mean absolute error (MAE), and cosine similarity (cos θ). Both RMSE and MAE refer to deviations between the true value (i.e., average human ratings of a tweet for the eight emotions) and NADE's prediction. Specifically, RMSE squares the differences between predicted and actual values before averaging, so it amplifies larger errors and is more sensitive to outliers. In contrast, MAE computes an average absolute difference between the predicted and actual values, with less emphasis on outliers. Finally, cosine similarity measures the angle between the prediction and ground truth, so it provides an assessment of the consistency in the direction of the emotional dimensions. Because it emphasizes the direction of the relationship between model outputs and ground truth, the cosine similarity measure is more robust to differences in scale and variance, which is pertinent for our study, because we rescaled the data to a 0–1 range, which may introduce mean and variance discrepancies. We summarize the comparison results in Table 3, with better values highlighted in bold. As they show, NADE outperforms the other converters for all emotions except for one instance where GPT-4 exhibits greater cosine similarity for surprise.
Comparisons of Text-to-Emotion Converters and NADE Against Human Raters.
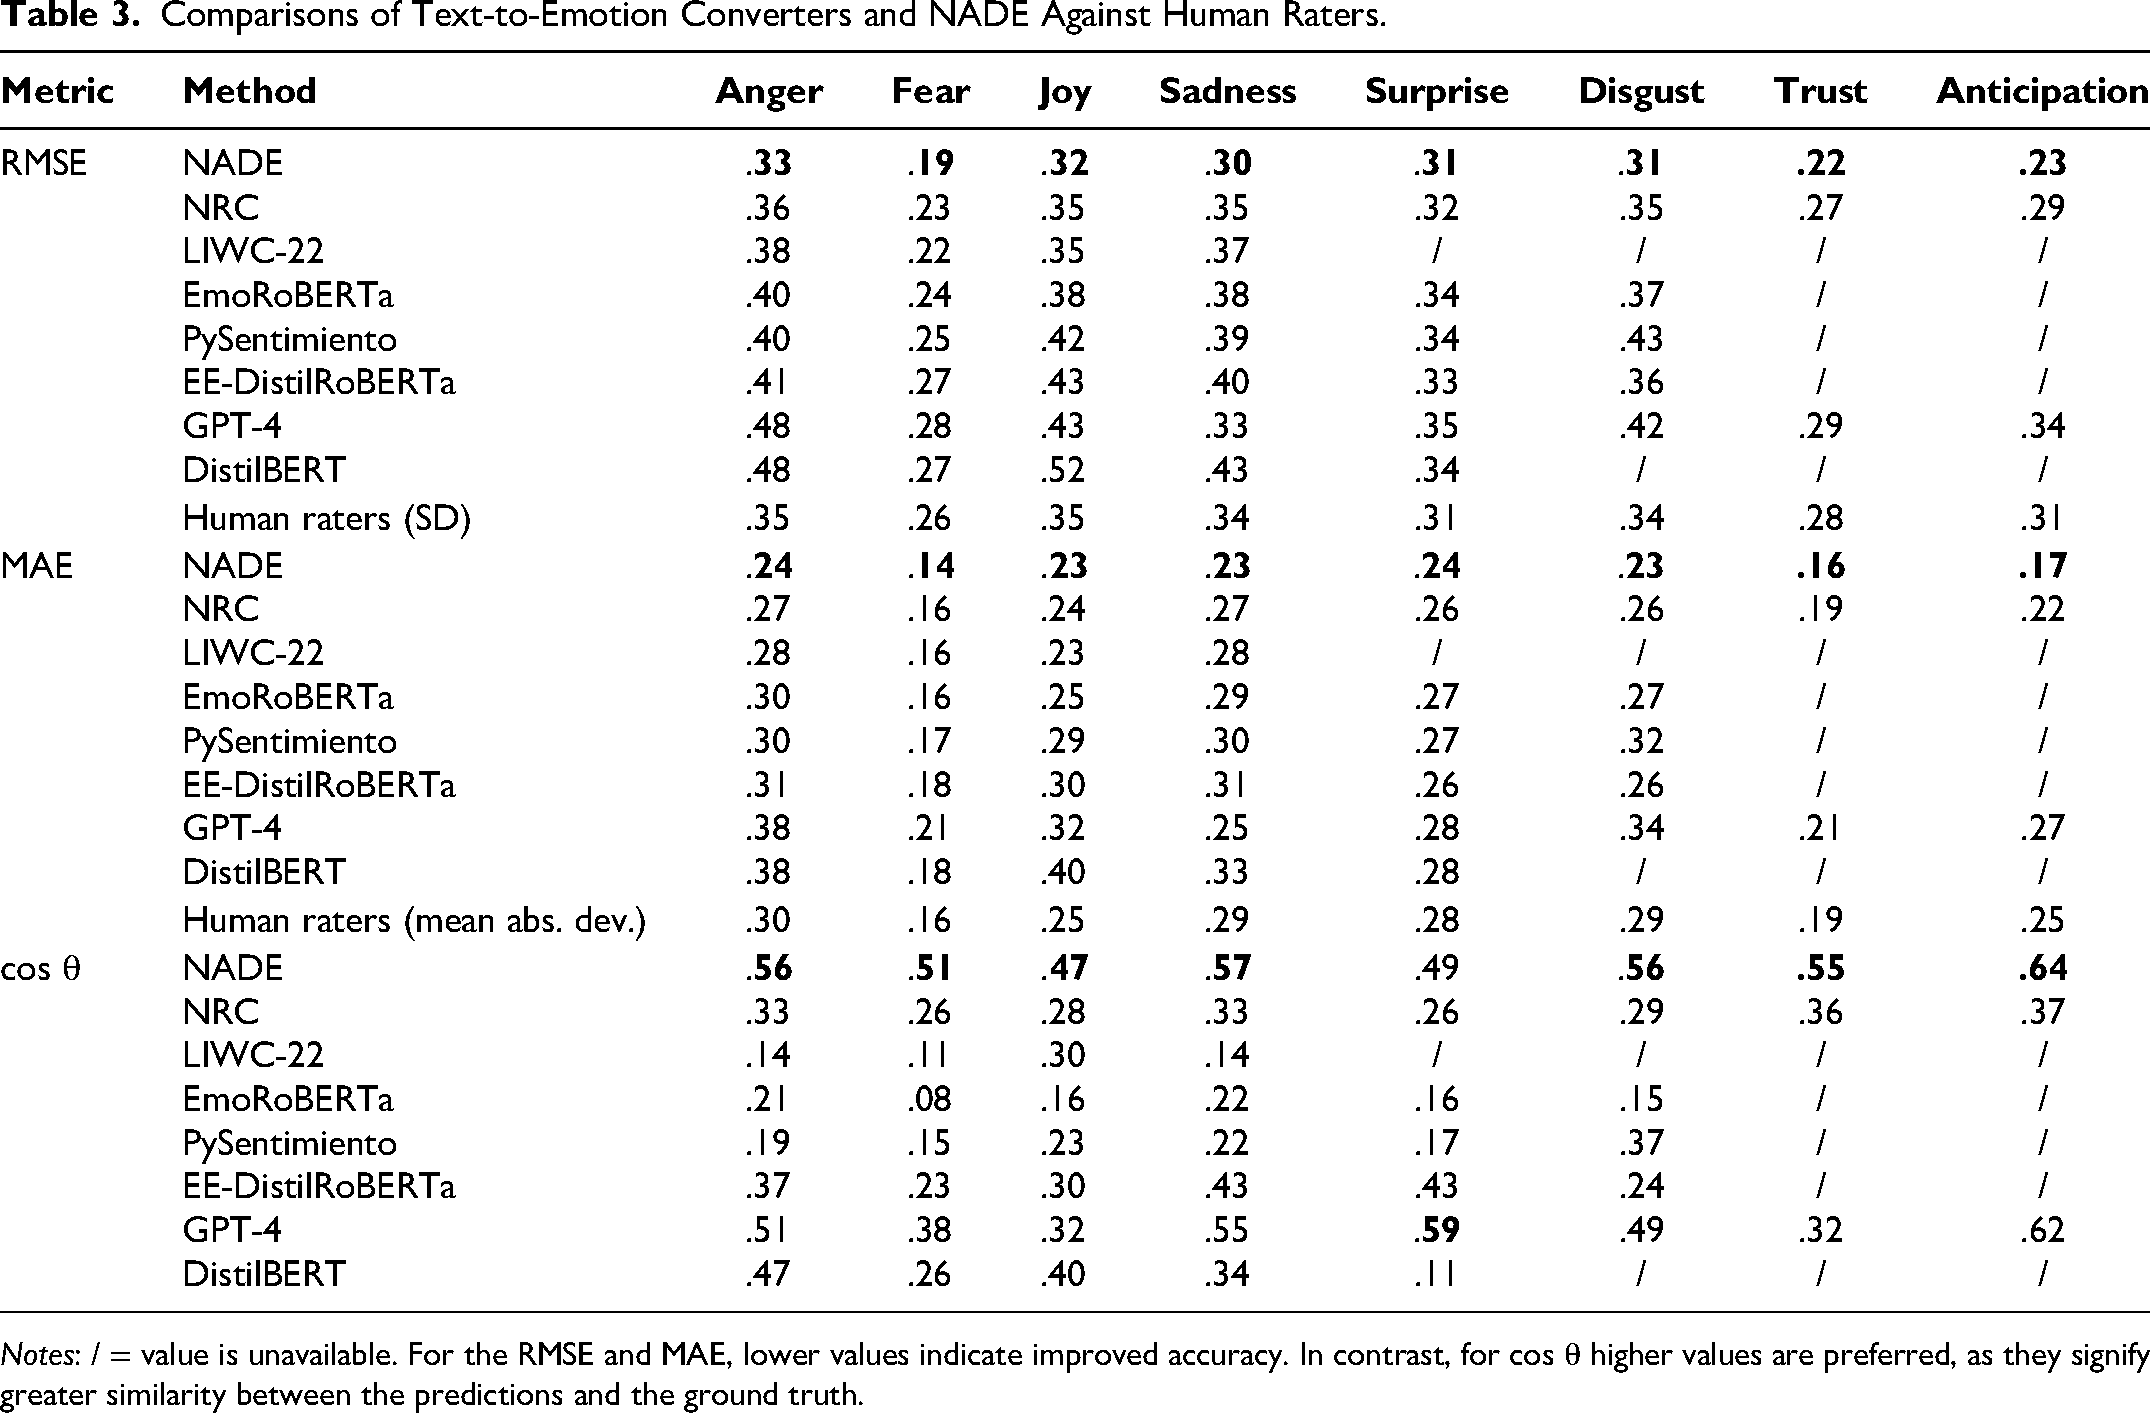
Notes: / = value is unavailable. For the RMSE and MAE, lower values indicate improved accuracy. In contrast, for cos θ higher values are preferred, as they signify greater similarity between the predictions and the ground truth.
Although the input and ground truth values are scaled between 0 and 1, interpreting the error metrics (i.e., RMSE, MAE) can still be challenging. Therefore, in Table 3, we also report the standard deviation between human ratings, as a baseline for comparison. For example, a value of .35 indicates that raters deviate from the mean by .35 on average. The mean absolute deviation (mean abs dev) values in Table 3 instead indicate the average absolute deviation of human ratings from their mean. As these values reveal, NADE's prediction error is comparable to the uncertainty observed among human raters, which strengthens our confidence in its validity.
Because NADE is trained on texts containing emojis but is used to predict emotions in texts both with and without emojis, we also check the validity of the results for both contexts. Therefore, we also conduct the analysis separately for texts with and without emojis in a robustness test (Web Appendix C). The findings remain similar; whether the texts include emojis or not, they are comparable in their emotional content. This result provides additional evidence of the validity of our approach.
To determine how well NADE can capture stronger versus weaker emotional intensities, we plot the distribution of emotional intensities derived from the different methods and compare these distributions with the distribution of the human raters’ scores in Figure 6. According to the human raters, the majority of tweets exhibit low emotional intensity, and a smaller number of tweets signal higher intensity levels of the respective emotions (Figure 6, first column). This pattern is broadly mirrored by the intensity scores we derived from NADE (Figure 6, second column), offering further confidence in these scores. The distributions of the derived scores from the comparison methods instead indicate that these classifiers consistently underpredict moderate intensities and overpredict extreme intensities. Although GPT-4 also indicates a similar pattern, because it is an LLM, the pattern is not as pronounced. Yet, the pattern all these converters offer is less consistent with the human ratings. Because the values obtained from NADE resemble the human raters’ pattern much more closely, as also mirrored in Table 3, we affirm that NADE outperforms the other converters in predicting emotional intensities.
For dictionary-based converters, another issue becomes apparent in Figure 6: The NRC and LIWC both overpredict low intensities and underpredict high intensities, relative to the human ratings, which translates into poorer performance compared with NADE (Table 3). To understand this outcome, we note that these dictionary-based converters require a 1:1 match between the text and the labeled vocabulary, which is particularly problematic when analyzing social media texts, with their frequent use of slang and typos. For example, the sentences in the 2,605 validation texts consist of 6,650 distinct words, of which only 18.08% (1,202 words) are covered by the NRC lexicon. This problem also arises at the sentence level, where only 49.57% of the texts contain at least one word covered by NRC. 12
Comparison with Scores from Other Converters
Even if NADE parallels human ratings better than other converters, we expect some degree of association between its scores and those obtained from the other converters, because all these methods aim to measure the same underlying constructs. Thus, we assess the convergent validity of NADE's outputs by investigating the cosine similarity of emotional intensity scores. This comparison relies on the same 2,605 tweets, for which we previously obtained human ratings. As Figure 7 shows, we find mostly positive associations between NADE's output and the outputs derived from other converters, revealing general agreement in the measurement of emotional intensities. In summary, NADE recovers human ratings better than other converters while also converging toward the same concept, which strengthens our confidence in the validity of its outputs.
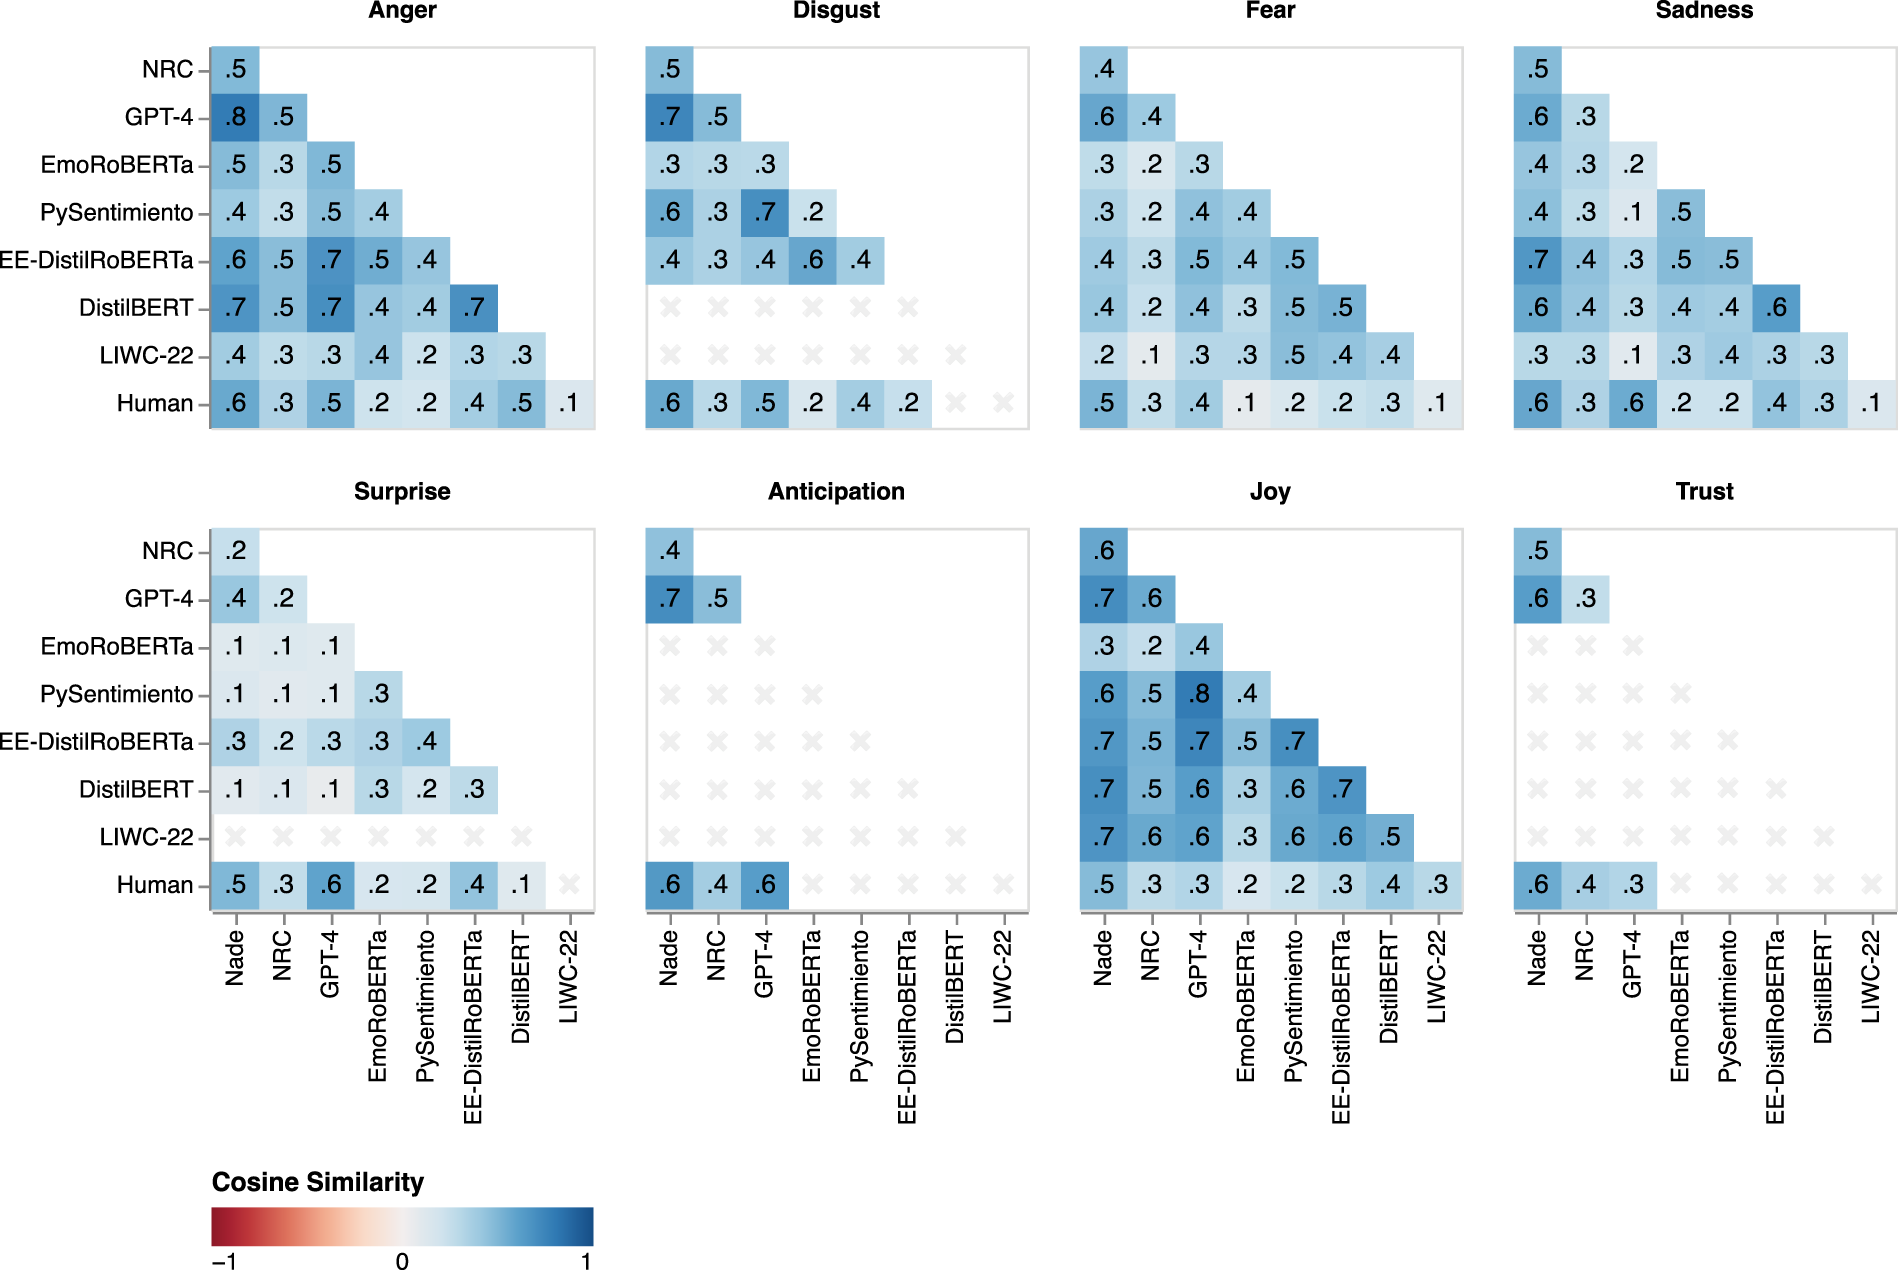
Cosine Similarity for NADE, Other Converters, and Human Raters.
Generating Marketing Insights with NADE
We explicitly make NADE freely and widely accessible to both programmers and nonprogrammers, to encompass the widest possible range of users, including managers, academics, students, and professionals from various fields. For users with programming experience, we provide Python and R packages (Web Appendix D). Users without programming experience can navigate an easy-to-use web app, available at https://nade-explorer.inkrement.ai. To demonstrate its applicability, we offer three example cases in this section, which illustrate how marketers can use NADE to address pressing marketing issues.
Application 1: Brand Perception Tracking
Context
Tracking real-time emotions associated with a brand allows managers to respond to changes in brand perceptions swiftly, as might be particularly needed during brand activism campaigns that can evoke strong consumer reactions and potential backlash. For Application 1, we analyze the impact of Nike's decision to sign Colin Kaepernick as an advertising ambassador. Kaepernick's public protest against police brutality and racial inequality made this campaign highly controversial (Draper and Belson 2018), providing a rich context for analyzing consumer emotions.
Data and methods
We scraped 285,839 English tweets about Nike in the two weeks before and after the campaign announcement on September 4, 2018. The descriptive statistics of these data can be found in Web Appendix E. As Figure 8, Panel A, shows, the number of tweets per day increased notably around the start of the campaign.
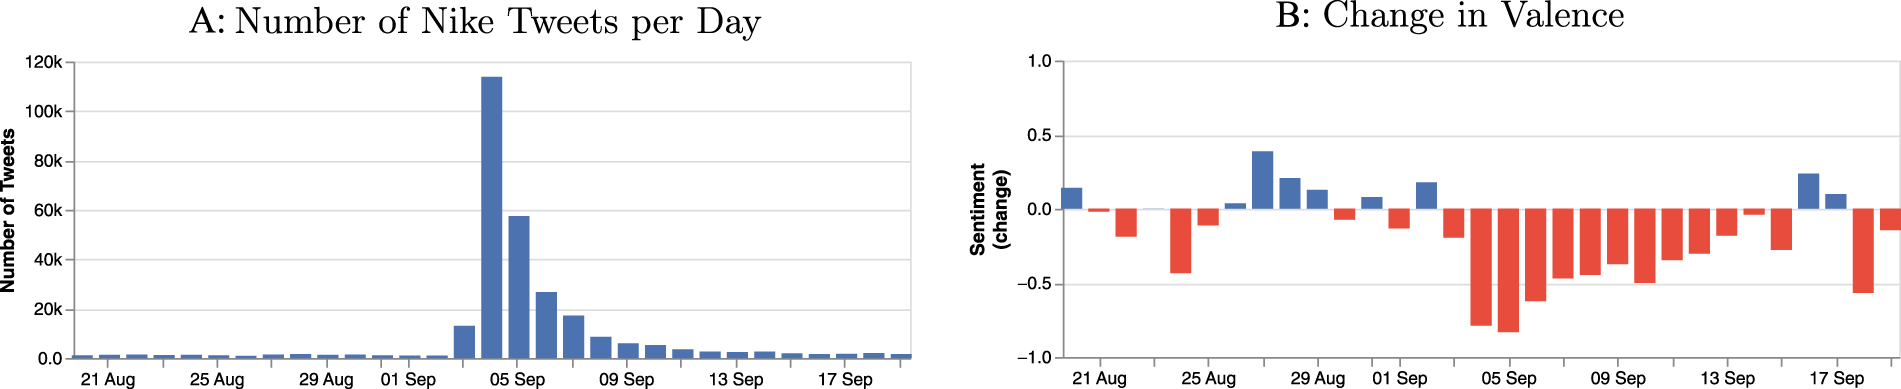
Volume and Valence of Nike Tweets around the Campaign.
In a first step, we compute the valence scores for these tweets using VADER Sentiment (Hutto and Gilbert 2014). It reveals a clear change in valence relative to the mean value in the precampaign period, indicated in Figure 8, Panel B. That is, the start of the campaign coincides with a significant drop in valence; the tone of tweets became substantially more negative, a finding that matches descriptive analyses of the campaign at the time (Terry 2018). Such an assessment might have led to the conclusion that the campaign would have adverse effects on the brand. Next, we use NADE to gauge the emotional intensity of the tweets in our dataset for the eight core emotions. We sum the values for all tweets per emotion per day, as depicted in Figure 9.
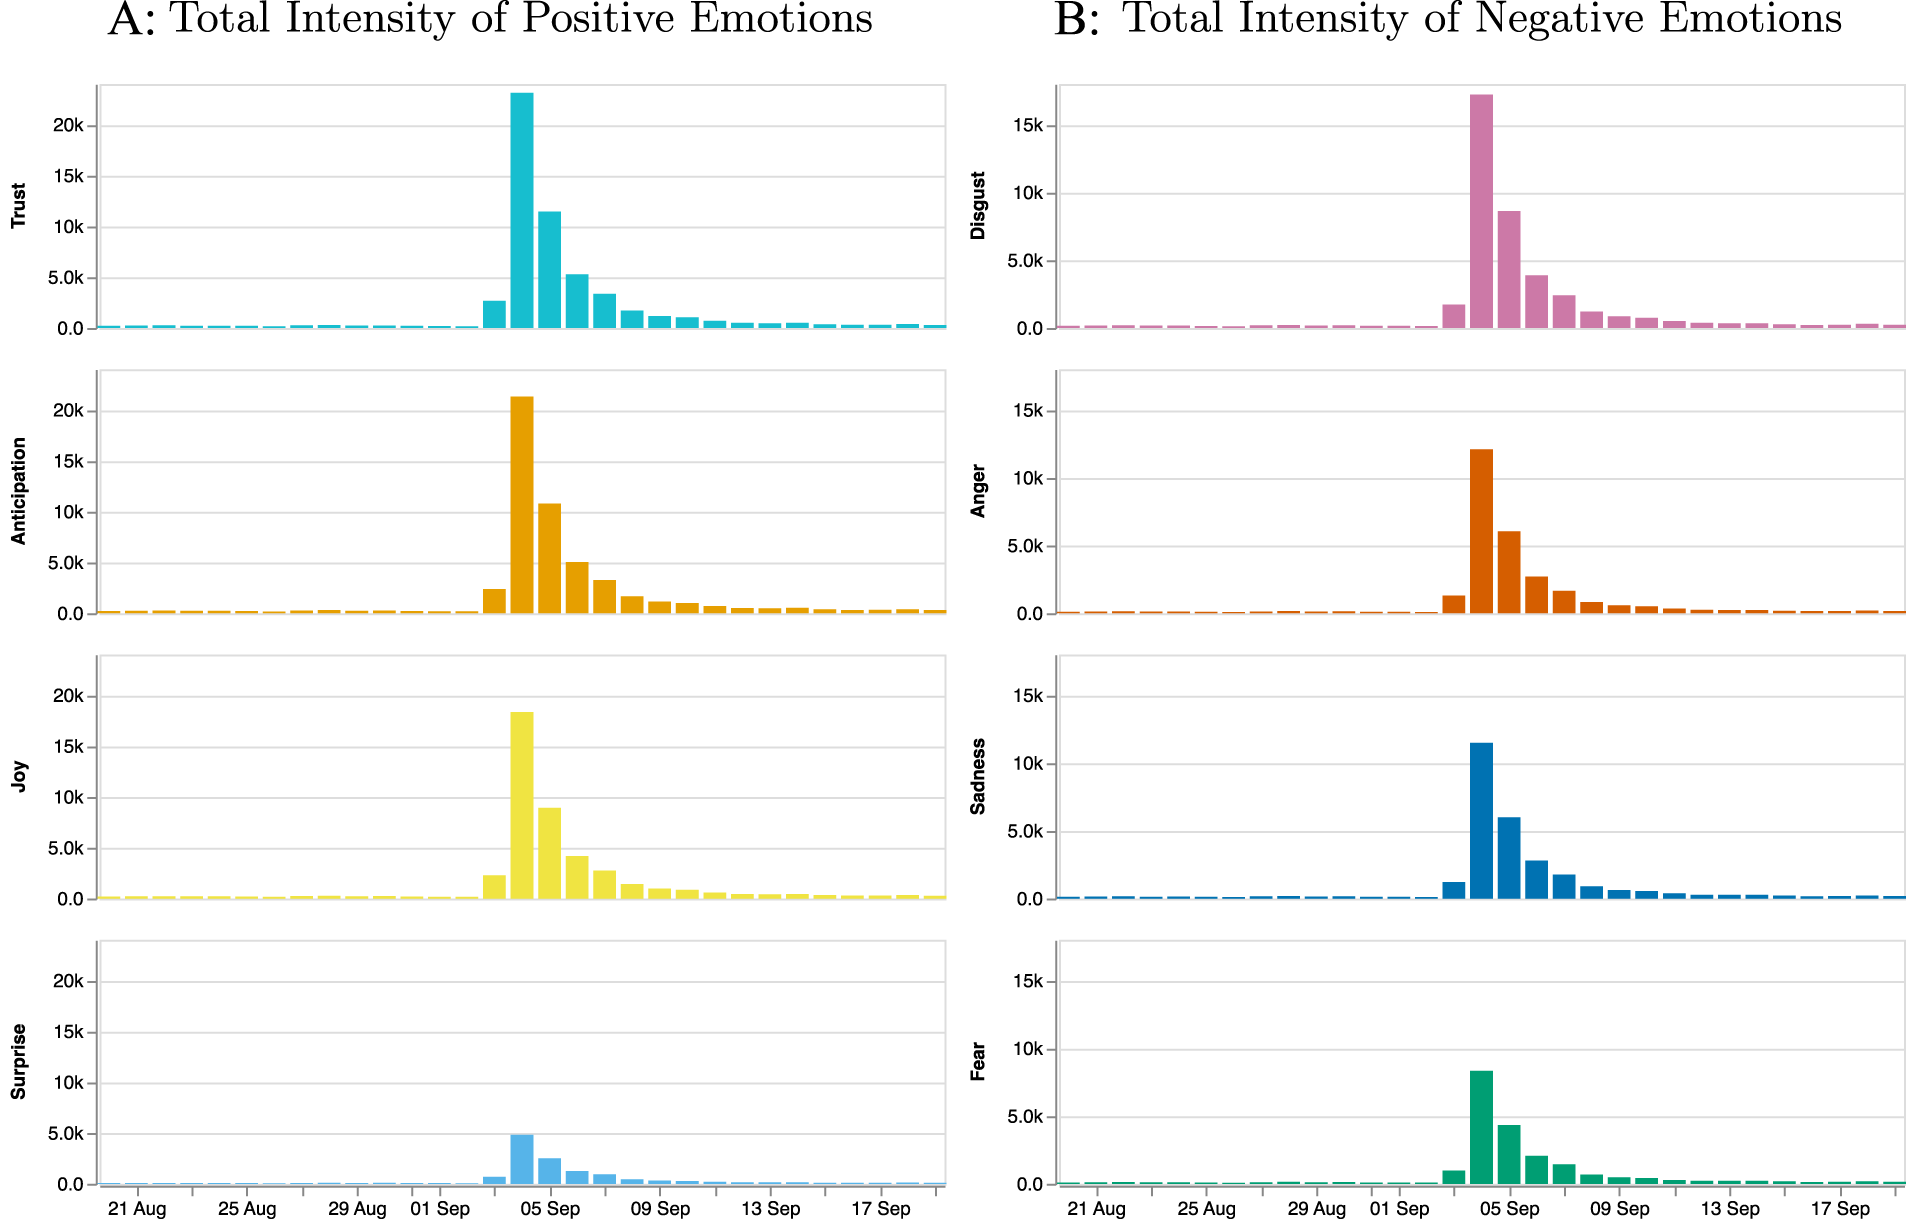
Specific Emotions of Nike Tweets around the Campaign.
Results
The more nuanced analysis depicted in Figure 9 reveals a strong increase in the positive emotion of trust, as well as joy and anticipation. The increase in overall emotionality is much stronger for positive emotions than for negative ones. This finding conflicts with the seeming interpretation derived from an exclusive focus on valence, which would have led managers to believe that consumers’ reactions to the campaign were predominantly negative.
As this application shows, by leveraging NADE, brand managers can gain deeper insights into consumers’ reactions to brand campaigns, particularly those that might evoke controversy. In turn, they can establish more precise and effective response strategies, such as by addressing specific concerns or reinforcing positive responses to the campaign (e.g., by sharing trust-inducing posts), to better manage brand perceptions and mitigate any backlash.
Application 2: Creating Emotionally Engaging Social Media Content
Context
Emotionally engaging, attention-grabbing content is essential to drive engagement on social media platforms, and the emotions conveyed in headlines can significantly influence user engagement (Banerjee and Urminsky 2024). Therefore, we demonstrate how to use NADE to design video titles on YouTube by linking specific emotions in the titles to audience engagement, measured by video views. In detail, for social media content creators seeking to generate titles (or text, such as posts and comments) that drive engagement, we recommend the following process: First, learn the relationships between emotions and relevant outcome variables (in this case, video views). Second, generate a list of possible texts (in this case, video titles), potentially by using generative AI tools such as ChatGPT. Third, leverage the NADE app to obtain the emotion scores for these titles. Fourth, predict expected engagement (number of views), on the basis of the derived weights and emotion scores.
Data and methods
To examine the link between specific emotions expressed in video titles and audience engagement (video views), we use data from YouTube. We first select the 4,000 most popular YouTube channels, according to https://socialblade.com. From these channels, we identify videos with English as the main language, resulting in a final sample of 1,330,531 videos by 3,966 channels. For each video, we collect the number of views, likes, dislikes, release dates (ranging from October 2015 to August 2018), and titles (see Web Appendix E for descriptive statistics). Applying NADE, we then infer the emotional intensities of the video titles. We also extract additional language dimensions with LIWC-22 (Boyd et al. 2022) to adjust for potential confounds.
Because video titles tend to be short (mean characters: 48, SD: 20), extracting emotions from them is challenging for traditional text-to-emotion converters, particularly dictionaries with their limited vocabularies. This constraint is evident in this case: Only 32%, 32%, and 31% of all video titles contain words for which ratings of the emotions of anxiety, anger, and sadness exist in LIWC-22. With NADE's unique architecture though, we can increase these shares to 95%, 93%, and 88% for the respective emotions.
To assess the associations between specific emotions and video views, we estimate the following model: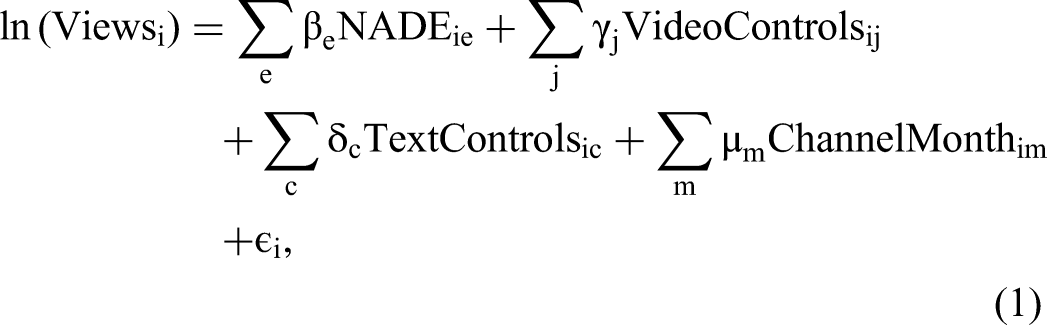
Association between Emotions Contained in Video Titles and Video Views.
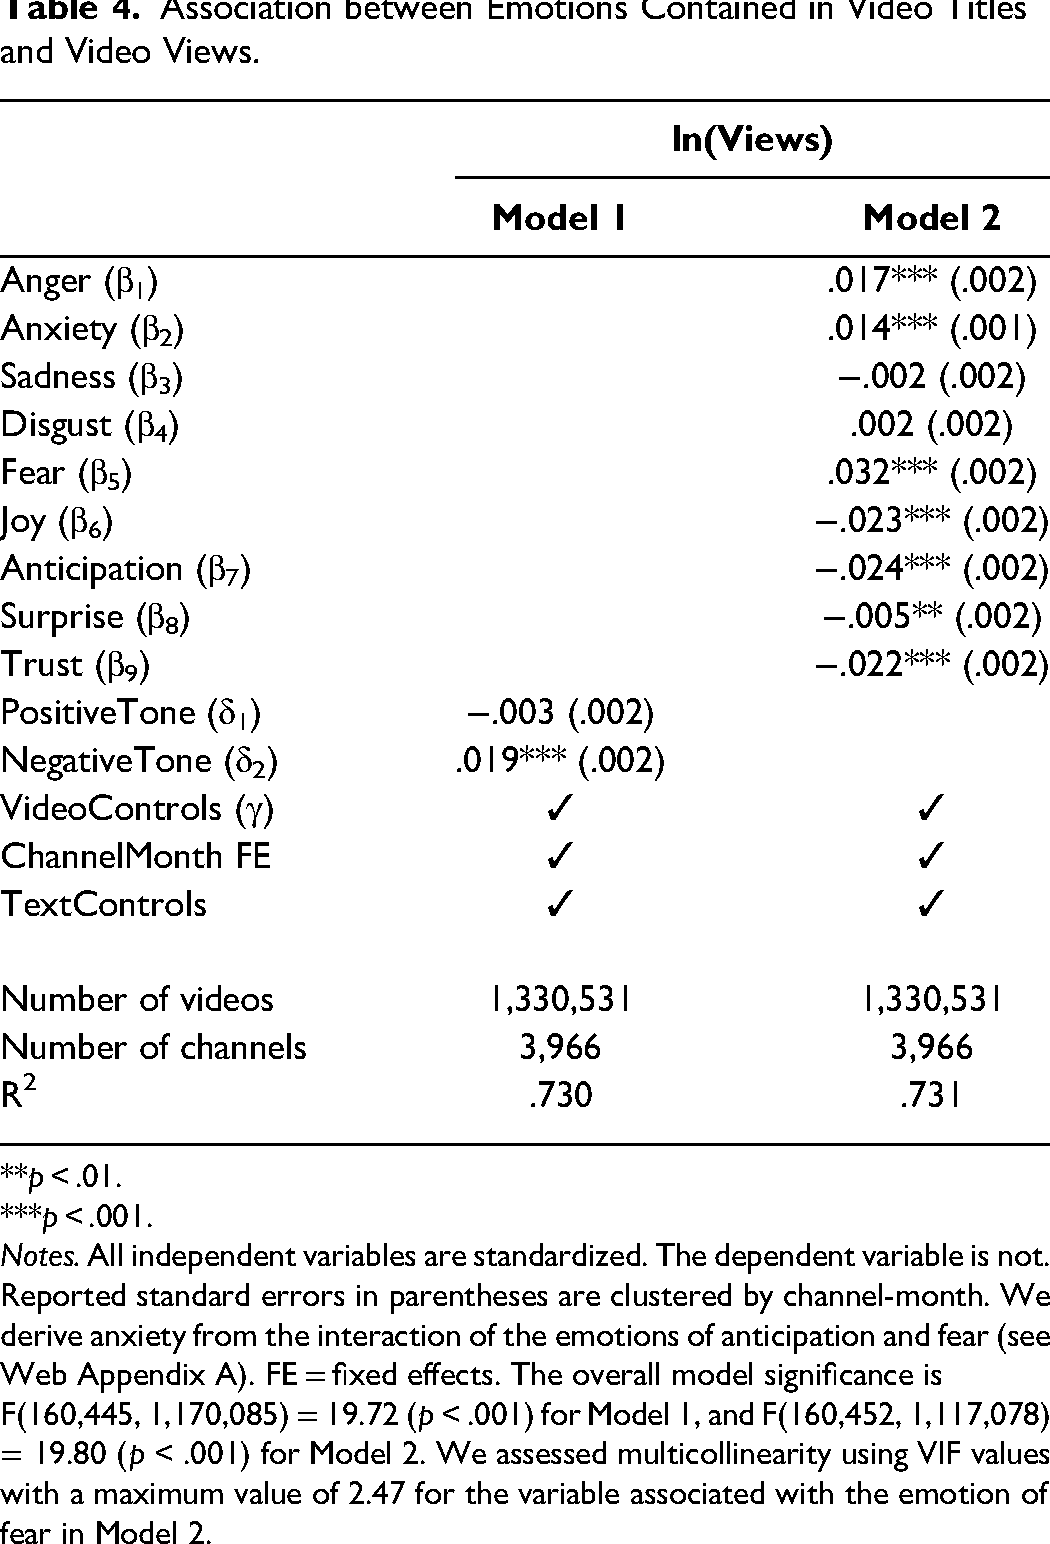
**p < .01.
***p < .001.
Notes. All independent variables are standardized. The dependent variable is not. Reported standard errors in parentheses are clustered by channel-month. We derive anxiety from the interaction of the emotions of anticipation and fear (see Web Appendix A). FE = fixed effects. The overall model significance is F(160,445, 1,170,085) = 19.72 (p < .001) for Model 1, and F(160,452, 1,117,078) = 19.80 (p < .001) for Model 2. We assessed multicollinearity using VIF values with a maximum value of 2.47 for the variable associated with the emotion of fear in Model 2.
Model 1 includes, in addition to the control variables, the variables “PositiveTone” and “NegativeTone” in the predictor set, which we extract from LIWC. That is, we replace the vector of specific emotions with δ1 × PositiveTonei + δ2 × NegativeTone in Equation 1.
Results
The Model 1 results show that positive tone is not significantly associated with views, whereas the association with negative tone is significant and positive. From this model, content creators might draw the (erroneous) conclusion that titles with a more negative tone are associated with stronger engagement. But the analysis of specific emotions in Model 2 clarifies that coefficients associated with emotions of the same valence have different signs. For the negative emotions, the coefficients associated with anger and anxiety are significant and exhibit a positive sign, while the associations with sadness and disgust are insignificant. These findings highlight the value of including more nuanced emotions; they also are in line with previous findings that the high-arousal emotions of anger and anxiety drive engagement and help retain attention (Berger and Milkman 2012; Berger, Moe, and Schweidel 2023). Among positive emotions (which also are less frequently analyzed), we consistently find negative associations with views. Such in-depth insights into these relationships can help content creators craft headlines that harness the engaging power of high-arousal emotions like anger and anxiety while avoiding the inclusion of low-arousal emotions like sadness. In practice, they should generate multiple variations, obtain their emotion scores from the NADE app, and thereby predict and identify the version that is likely to evoke the greatest viewer engagement.
Application 3: Using the Emotions in Online Reviews to Forecast Demand
Context
Marketing managers undertake demand forecasting to reduce uncertainty about product success and optimize inventory management. Online reviews offer a crucial source of information for such forecasts, yet a common issue hinders their usefulness—namely, the “positivity problem,” which arises because a large share of online reviews offer only positive feedback and the highest ratings. This bias makes it difficult to predict product success using numerical ratings alone (Rocklage, Rucker, and Nordgren 2021), which instead requires more nuanced analyses. To demonstrate the predictive power of the nuanced emotions identified by NADE, and in line with previous research (Rocklage, Rucker, and Nordgren 2021), we apply NADE to Amazon online review data to forecast demand and predict the success of books. Similarly, marketing managers can obtain detailed emotion scores from the NADE app for more accurate demand forecasts for their own products.
Data and methods
The data for this study comes from Amazon, spanning 233 million reviews posted between May 1996 and October 2018 (Ni, Li, and McAuley 2019). From the full dataset, we sample 5,000 books that together accumulated more than 6.6 million reviews. In these data, 63.6% of reviews offer five-star ratings, with just 20.6%, 8.5%, 3.8%, and 3.4% in the four-, three-, two-, and one-star categories, respectively. By using NADE to extract emotional intensities of all 6.6 million reviews, we can analyze the nuanced emotions that actually emerge from the reviews and thereby better predict product success, which we operationalize as the number of verified purchases of each book. We use four groups of predictor variables: (1) product controls (four features: average star rating, standard deviation of star ratings, average review length, and product age); (2) emotion scores from NADE for the eight core emotions and 24 additional emotions that reflect their interactions (Plutchik's dyads); (3) the 151 emoji predictions from NADE's Stage I; and (4) 126 text features extracted from other text tools, including Evaluative Lexicon, LIWC, and VADER (see Web Appendix E). We rely on Lasso regression to predict the log-transformed number of sales for each book; it facilitates both regularization and feature selection (Hastie, Tibshirani, and Friedman 2017). To mitigate the risk of overfitting, we apply tenfold cross-validation, systematically partitioning the data into ten subsets, with nine for training and one for validation, in rotation.
To ascertain the predictive power of NADE above and beyond that of features extracted from other text tools, we first test the impact of the four variable groups on predictive performance separately (feature sets 2–5 vs. feature set 1 in Table 5), then compare the predictive performance of a model that includes all variables from the other text tools, versus a model that also includes the NADE scores. In Table 5, we report on three out-of-sample prediction performance metrics: variance explained in cross-validation (VEcv; indicating the proportion of variance the model captures), Pearson correlation (γ; the correlation between predicted and observed values), and predictive errors (i.e., RMSE) (Luangrath, Xu, and Wang 2023).
Predictive Performance of NADE (Out of Sample) for Product Success at Amazon.
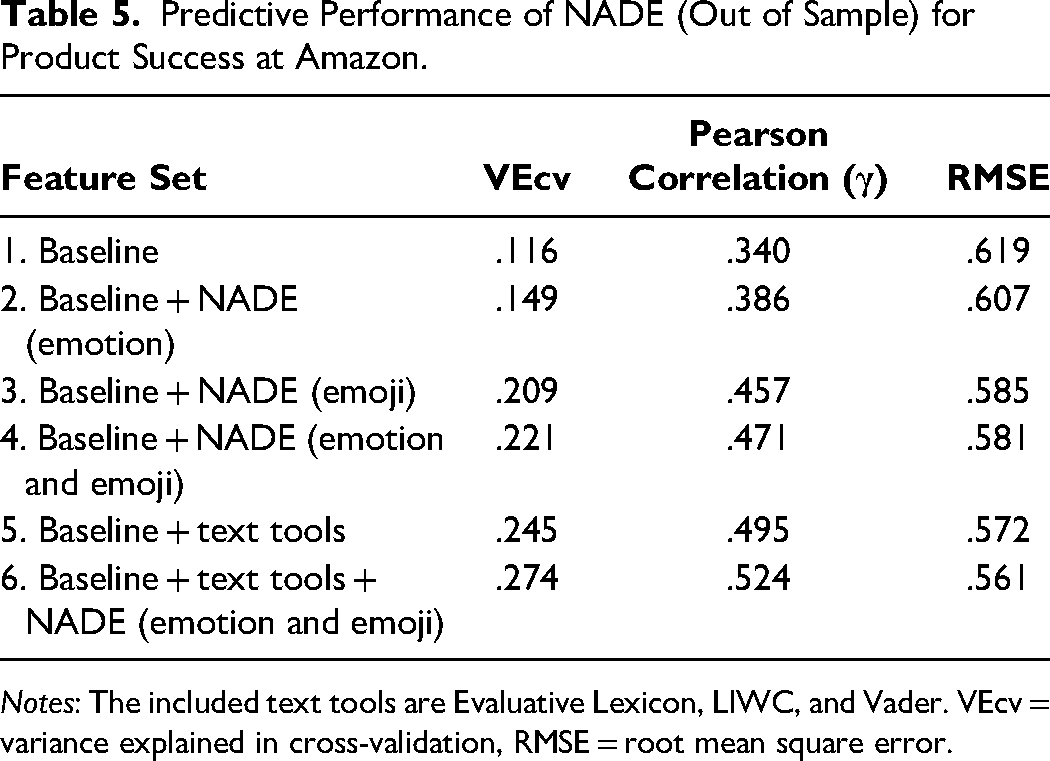
Notes: The included text tools are Evaluative Lexicon, LIWC, and Vader. VEcv = variance explained in cross-validation, RMSE = root mean square error.
Results
The results in Table 5 consistently confirm the improved predictive performance achieved by including each variable group, compared with the baseline. That is, the improvements in predictive performance for each individual group of variables (feature sets 2–5) against the baseline (feature set 1) are significant, as revealed by paired t-tests on the cross-validation samples. The overall performance of a model that includes all the NADE variables (feature set 4) is comparable to that of a model that includes all the variables available from other text tools (feature set 5). Furthermore, paired t-tests reveal a statistically significant improvement in predictive performance when we add the NADE scores to a model that includes all the variables from the other text tools (i.e., for feature sets 5 and 6, ΔVEcv = .029, t = 2.939, p < .05). Therefore, NADE improves predictive performance above and beyond the performance achieved with other text tools, including their sentiment measures.
Regarding feature importance, we find that NADE's emotion and emoji scores take top positions. For example, in feature set 6, the ten most important features consist of six emoji scores, one emotion score derived from NADE, and only one variable extracted from other text tools (i.e., a valence measure from VADER), as well as the star rating and its standard deviation. We provide more details regarding the feature weights in Web Appendix E. These findings highlight the value of NADE's Stage I output for predictive purposes and show that emojis may capture additional variation in outcomes that is not captured by the emotion scores. By incorporating NADE's emotion and emoji scores, marketers can improve the accuracy of their predictions of product success, which in turn can enhance their inventory management, marketing strategies, and understanding of customer sentiment, beyond simple star ratings and valence.
Discussion
Implications for Marketers
Marketers can leverage NADE in a variety of ways. We summarize some potential applications in Table 6 and discuss them in greater detail in the following subsections.
Potential Applications of NADE.
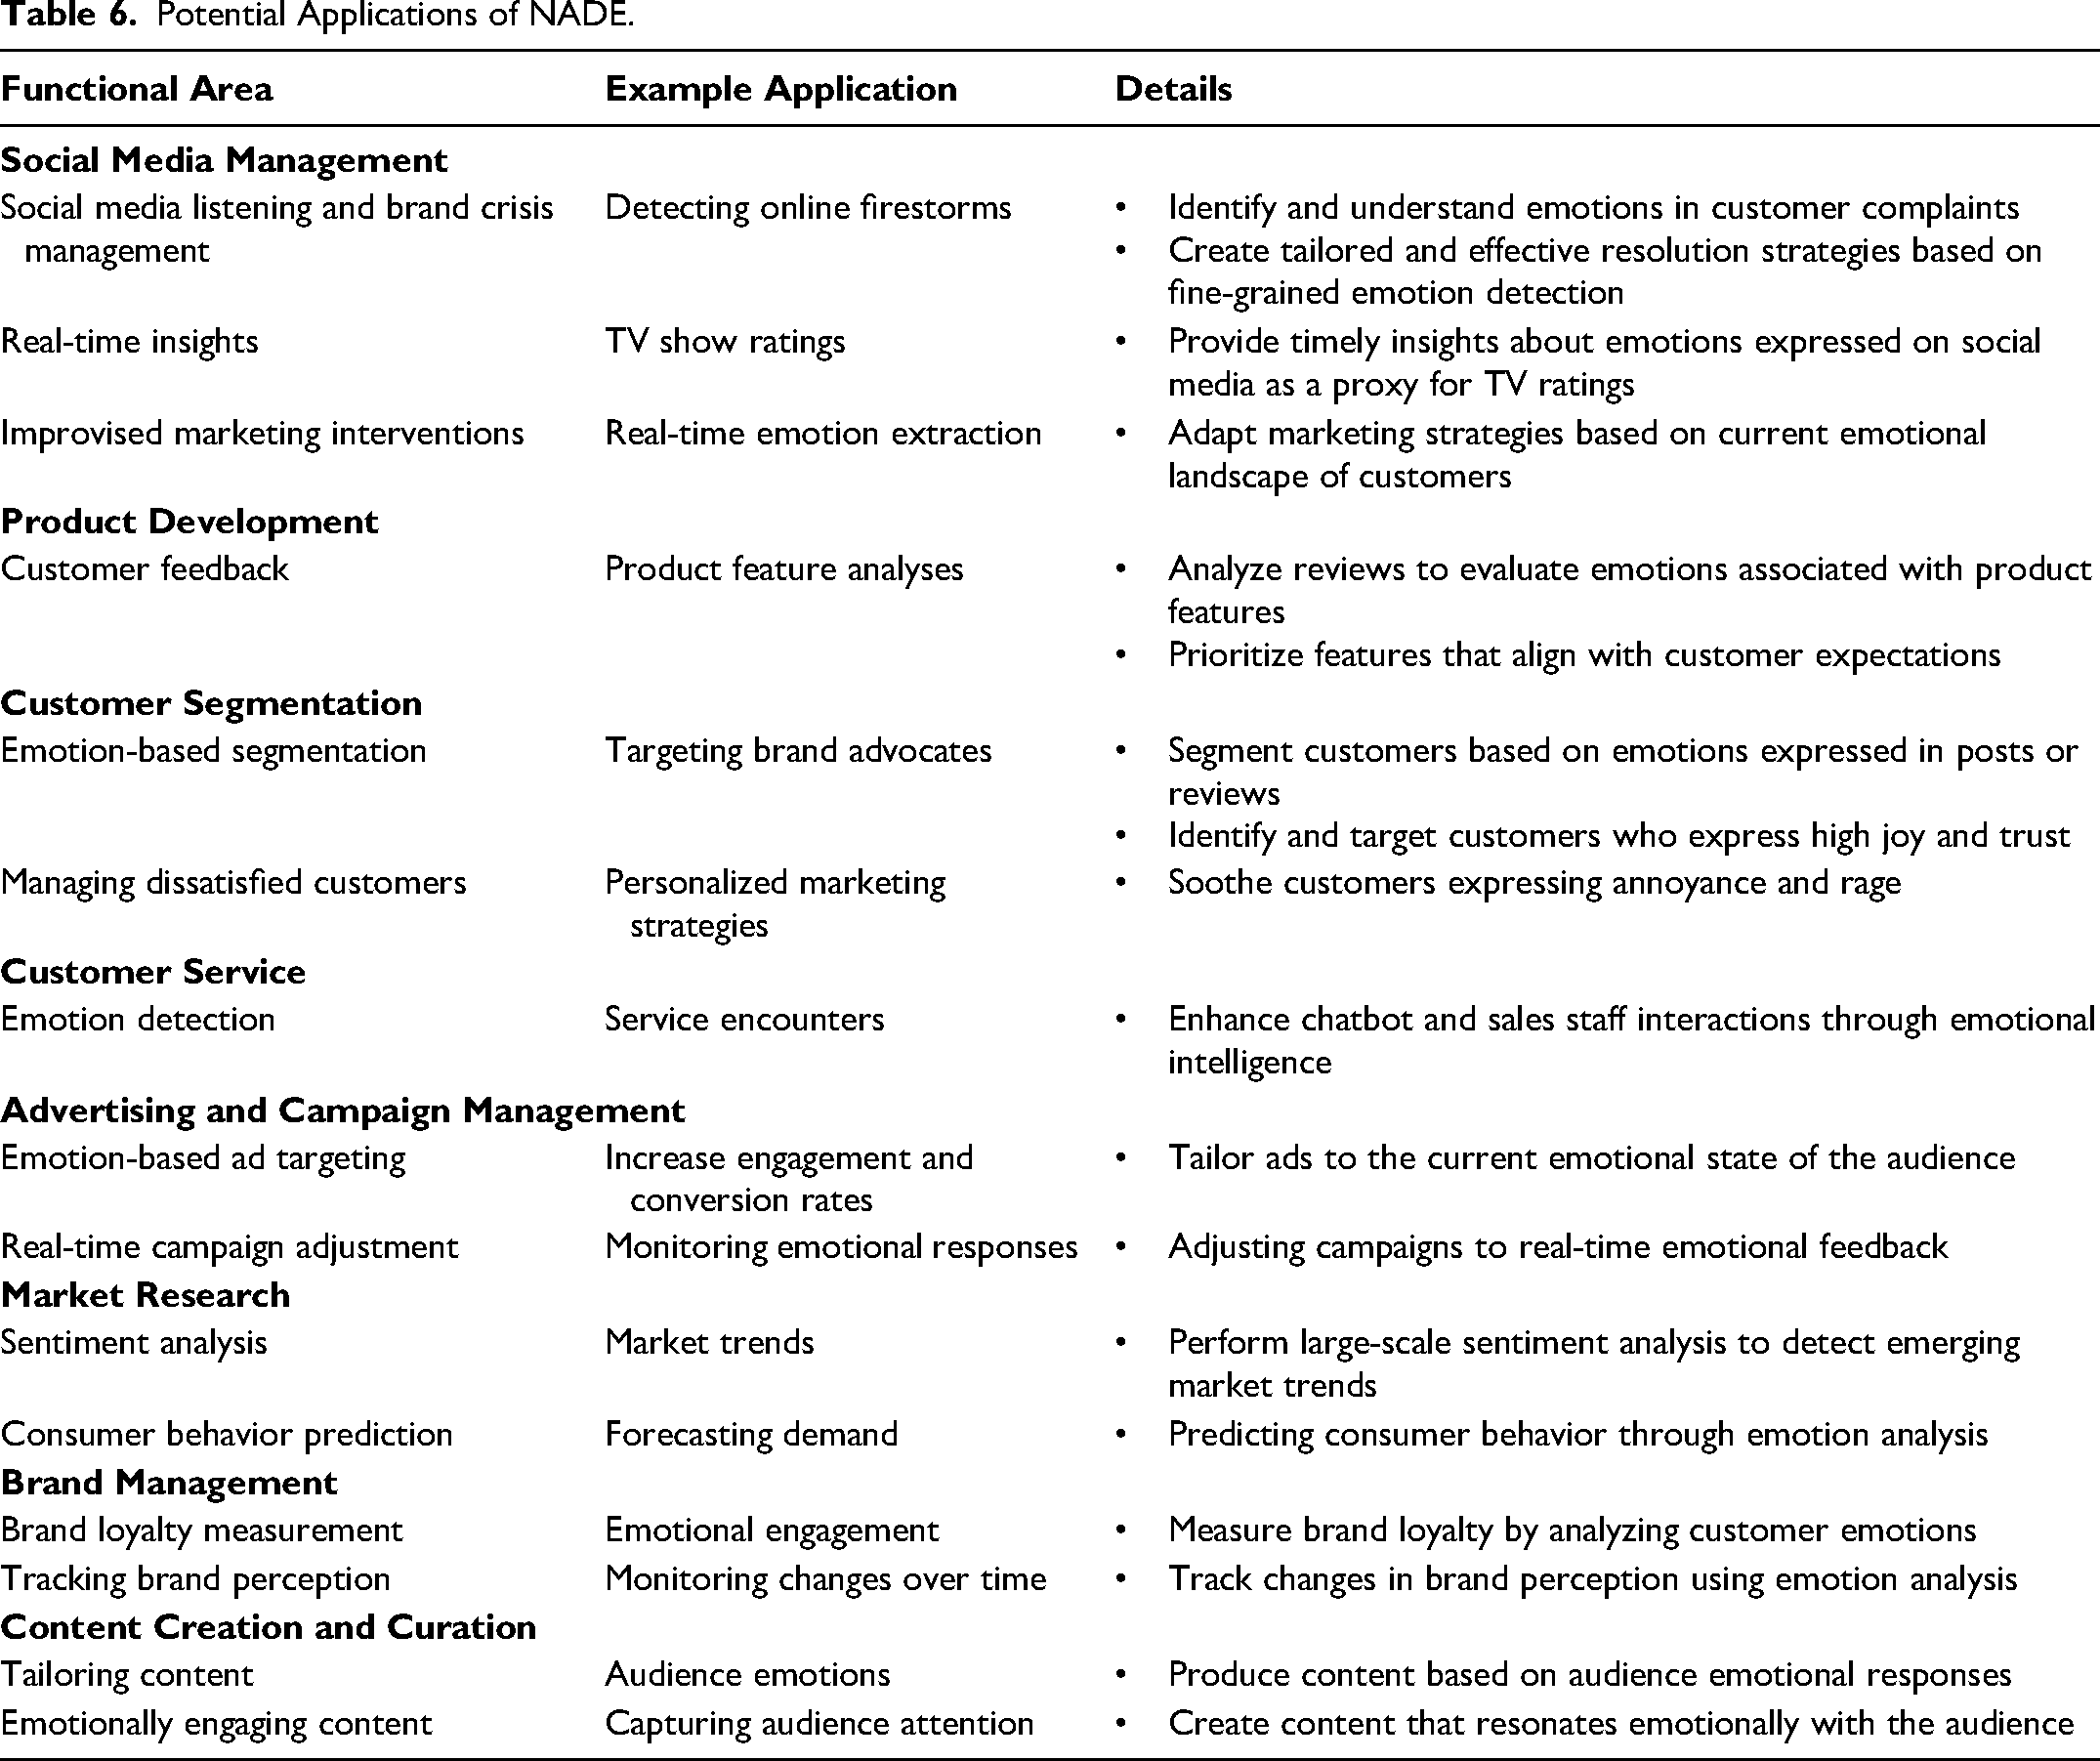
Social media management
Through social media listening, companies can achieve various insights, including detecting online firestorms to manage their brand reputations (Rust et al. 2021). If they must manage a brand crisis, identifying and understanding the emotions expressed in customer complaints or negative feedback is particularly vital (Herhausen et al. 2019). With NADE's fine-grained emotion detection, managers can distinguish between different types of negative emotions, such as anger or sadness, and thereby derive more tailored and effective resolution strategies. Borah et al. (2020) also highlight the benefits of improvised marketing interventions on social media, which require real-time emotion extraction. In this sense, NADE is especially beneficial, due to its accuracy and speed, such that marketers can adapt their strategies to the actual, current emotional landscape created by their customers.
Social media listening also can help companies even when they are not in crisis, such as when they lack real-time access to alternative metrics, like television show ratings. In such cases NADE can provide timely insights into the emotions that audiences express on social media about TV shows, which can be used as a proxy for its ratings (Liu, Singh, and Srinivasan 2016).
Product development
For customer feedback–driven product development, companies might analyze reviews (e.g., posted on Amazon) at the sentence level to determine precisely, which product features evoke which emotions. For example, features that evoke anticipation likely indicate desired characteristics; those linked to anger may suggest potential issues. Because NADE can detect specific emotions, companies can more effectively prioritize features that align with customer expectations and undertake improvements to those that do not.
Customer segmentation
Understanding emotional drivers of customer behavior can be helpful for sophisticated customer segmentation. By detecting specific emotions in text, using NADE, companies in turn can segment their customers according to the emotions they express in their posts or reviews. For example, they might identify and target customers who express high joy and trust as potential brand advocates (Narayanan and Kalyanam 2012). Alternatively, marketing managers might want to reassure and soothe customers who express annoyance and rage on social media (Schmitt 2009). Emotion-based segmentation can lead to more personalized marketing strategies that in turn can improve customer retention.
Customer service
Human customer agents have traditionally cared for customers, but chatbots are increasingly used for customer service and care, even in emotionally charged interactions (Huang and Rust 2024). When customers interact with service chatbots (or sales staff), companies can leverage NADE to detect and analyze the emotions expressed during service encounters. The resulting insights can help companies train both chatbots and sales staff to respond with more emotional intelligence during service encounters (Yadav and Pavlou 2011).
Advertising and campaign management
Online advertisers currently can target users on the basis of their location, demographics, interests, and behaviors; they also might want to target users in some more specific emotional state (e.g., high on anticipation related to a new product introduction). Such mood-based targeting represents a compelling new advertising tactic in practice (Mendez 2024), and NADE offers strong promise for supporting such tactics.
Market research
With regard to a company's marketing research efforts, a large-scale analysis of emotions through NADE could enable it to detect emerging market trends. In addition, NADE could offer improved demand predictions by including emotions in product demand models.
Brand management
To measure brand loyalty, companies can use NADE to track individual customer emotions over time (Pilecki 2021). Changes in expressed emotions offer hints that a once loyal customer may be preparing to end their relationship with the company. The application of NADE to track aggregate emotions over time also would reveal any shifts in brand perceptions and support more timely responses to them.
Content creation and curation
Finally, NADE can help content creators and curators design content that evokes specific emotions, a capability highlighted as pertinent in prior research (Berger and Milkman 2012; Berger, Moe, and Schweidel 2023).
Implications for Researchers
Researchers can use NADE to exploit three main contributions it offers. First, it enables marketing researchers to scale up their research, even with limited budgets. This democratization of resources supports broader participation in high-level research, without the need for extensive funding. Second, the ability to engage in inferences, without demanding programming skills, represents another major advantage. Commercial tools like LIWC offer such capability too, but NADE provides it in relation to more nuanced emotion analyses; it also is completely free. Thus, we hope it will open new doors for researchers who might have been deterred by financial or technical barriers. Third, the programming packages for R and Python allow researchers to extend NADE to other languages or other emojis (by retraining the word-to-emoji mapping in Stage I) and emotion theories (by retraining the emoji-to-emotion mapping in Stage II). We also hope that the applications agenda in Table 6 will inspire advanced, expanded applications of emotion measurement in marketing.
Limitations and Future Research
Although we provide arguments and evidence that using emojis as intermediaries offers many advantages, we still lack a precise understanding of how people use emojis in their communication (Pei and Cheng 2022) and how those usages might change over time (Barbieri et al. 2018). Emojis might not represent the full range of human emotions; they also might be interpreted differently across various contexts (e.g., business, leisure) (Miller et al. 2017), cultures (Barbieri et al. 2016), or generations (Herring and Dainas 2020). Furthermore, emojis sometimes supplement text, but they also can replace it (Karjus and Cuskley 2024). Just as with words, it is possible that the meanings and usage of emojis change over time. Such developments could be addressed and examined in greater detail using dynamic models. Since these changes likely span decades rather than years, exploring these dynamics provides avenues for future research. Moreover, we also note that the trained associations between words and emojis in our model would still produce accurate predictions, even if the meanings of emojis may change over time. This is the case because NADE does not use the observed emojis for the second stage, but the predicted emojis of the first stage.
Because (para)language effectively allows for various meanings, some emojis might reverse the meaning of a sentence (e.g., adding a crying emoji to a funny sentence) (Betz, Hoemann, and Barrett 2019) or signify sarcasm, which makes it difficult to detect underlying emotions, even for humans. Thus, users should check the face validity of the NADE Stage I output by comparing the predicted to the observed emojis for sentences that contain emojis. In addition, if there is any reason to believe that the user population who generated the texts differs from average Twitter (now X) users (whose data we used for training), a small study of focal text, inviting ratings by human raters, would provide a relevant comparison of NADE's performance against a ground truth (similar to our benchmark study).
Emojis are noisy labels, and there a several potential sources of noise including (1) emojis with multiple meanings, (2) similar meanings conveyed by multiple emojis, and (3) unobserved factors that influence emoji usage, such as popularity, observational learning, communication platforms, and input assistance or enhancement tools (e.g., autocompletion, emoji suggestions). In practice, shortcuts such as last-used emojis and text-to-emoji conversions encourage more abundant uses of certain emojis. Because more frequently used emojis are less effective for discriminating between emotions, increased usage of such tools may make emotion detection harder in the future.
A problem common to all text-to-emotion converters pertains to long input sequences: Generally, emotion detection is more difficult for longer texts that express more (potentially conflicting) emotions. In this case, the text usually prompts a low score on many emotions. This issue challenges NADE as well; it is designed for and works best for analyzing shorter social media texts (cf. formal writing or literature). To analyze longer texts, we suggest examining individual text segments (e.g., sentences) separately, then aggregating the results for several sentences using higher statistical moments, like the variance of emotions (Berger et al. 2020).
The construct validation process arguably could have introduced some bias. We compare the output of various LLM-based converters and NADE to human ratings of approximately 2,500 tweets related to S&P 500 companies. The dataset was generated by 922 English-speaking (i.e., indicated as first language) Prolific workers around the globe, who rated the tweets.
We use Plutchik's (1980) versatile theoretical framework as the basis for our app and provide inferences for texts in English. App users who seek to implement other emotion theories and constructs or languages can use the Python and R packages to extend NADE. As we noted previously, in this case, they will need to retrain Stage I to map a new language to the set of emojis or retrain Stage II to map alternative emotion constructs to emojis. For illustration, we adapt NADE to measure the three dimensions of the VAD model. In Web Appendix B, we validate its scores relative to those provided by human raters and other methods, including the established dictionaries and GPT-4. We also provide an option to obtain scores for the VAD dimensions in the online app.
We use publicly available data to train our models, such that Twitter users unknowingly become part of our training data. Although we always use anonymized, aggregated data to train our models, we also acknowledge the need to consider ethical concerns related to users’ data. As a benefit though, the data provided during inference never leave users' laptops when using our NADE web app or one of the programming interfaces.
As computational resources become more accessible and deep learning approaches more efficient, future research may explore their integration to enhance emojification (i.e., text-to-emoji conversion). For example, deep learning methods like attention mechanisms or transformer models can be adopted to capture a more nuanced interplay between text and emojis.
Conclusion
The innovative approach represented by NADE, which leverages user-generated content labeled with emojis, reduces model training costs and user effort and thereby democratizes access to advanced emotion detection. Its local data processing also ensures data privacy and security, meeting strict data-linked requirements. We thus hope NADE significantly advances marketing practice and research by enhancing emotion detection and analysis efforts. By offering a more comprehensive understanding of consumer behavior, it can support more effective marketing strategies; its introduction acknowledges the importance of advanced emotion detection for contemporary marketing.
Supplemental Material
sj-pdf-1-jmx-10.1177_00222429251315088 - Supplemental material for Natural Affect DEtection (NADE): Using Emojis to Infer Emotions from Text
Supplemental material, sj-pdf-1-jmx-10.1177_00222429251315088 for Natural Affect DEtection (NADE): Using Emojis to Infer Emotions from Text by Christian Hotz-Behofsits, Nils Wlömert and Nadia Abou Nabout in Journal of Marketing
Footnotes
Acknowledgments
The authors are grateful for helpful comments from Siham El Kihal, Jacob Goldenberg, Leonard Lee, Oded Netzer, Dominik Papies, and Gaia Rubera and seminar participants at Bocconi University, Tilburg University, University of New South Wales, WU Vienna, and the European Quant Marketing Seminar (eQMS).
Coeditor
Rajdeep Grewal
Associate Editor
Bob J. Meyer
Declaration of Conflicting Interests
The author(s) declared no potential conflicts of interest with respect to the research, authorship, and/or publication of this article.
Funding
The author(s) disclosed receipt of the following financial support for the research, authorship, and/or publication of this article: This work was supported by small-scale projects for junior faculty of WU Vienna University of Economics and Business.
Notes
References
Supplementary Material
Please find the following supplemental material available below.
For Open Access articles published under a Creative Commons License, all supplemental material carries the same license as the article it is associated with.
For non-Open Access articles published, all supplemental material carries a non-exclusive license, and permission requests for re-use of supplemental material or any part of supplemental material shall be sent directly to the copyright owner as specified in the copyright notice associated with the article.