
Abstract
This investigation examines how consumer durable goods producers can leverage virtual reality for new product development. First, the authors develop a prelaunch sales forecasting approach with two key features: virtual reality and an extended macro-flow model. To assess its effectiveness, the authors collect data from 631 potential buyers of two real-world innovations. The results reveal that the new approach yields highly accurate prelaunch forecasts across the two field studies: compared with the actual sales data tracked after the product launches, the prediction errors for the aggregated first-year sales are only 1.9% (Study 1a, original prelaunch sales forecast), .0% (Study 1b, forecast with actual advertisement spending), and 20.0% (Study 1b, original prelaunch forecast). Moreover, the average mean absolute percentage error for the monthly sales is only 23% across both studies. Second, to understand the mechanisms of virtual reality, the authors conduct a controlled laboratory experiment. The findings reveal that virtual reality fosters behavioral consistency between participants’ information search, preferences, and buying behavior. Moreover, virtual reality enhances participants’ perceptions related to presence and vividness, but not their perceptions related to alternative theoretical perspectives. Finally, the authors provide recommendations for when and how managers can use virtual reality in new product development.
Introducing a new consumer durable product to the market is an important but risky endeavor (Hauser, Tellis, and Griffin 2006). Research thus far provides rich insights regarding various aspects of new product development (NPD) that help firms manage these risks. For instance, investigators have examined customer integration during NPD (Chang and Taylor 2016) and drivers of new product success (Henard and Szymanski 2001). However, knowledge on how to leverage new technologies such as virtual reality to improve NPD is scarce, despite their high potential (Hauser, Tellis, and Griffin 2006) and several recent calls for such research (Marketing Science Institute 2018; Weingarden 2018).
The paucity of research on virtual reality use in NPD is especially surprising in a consumer durables context, as virtual reality technologies have improved significantly in terms of their visualization and automated-tracking capabilities, and they can now elicit and track extensive consumer experiences (Cipresso et al. 2018). Leveraging these technological improvements could help durables producers perform their NPD tasks. For instance, because the market success of durables may strongly depend on consumers’ experiences (Luo, Kannan, and Ratchford 2008), better simulation and capture of these experiences could improve prelaunch product assessments (Hoeffler 2003) and help firms decrease the high failure rates of durables, which range between 40% and 90% (Gourville 2006; Jhang, Grant, and Campbell 2012). In addition, evidence indicates that extensive experiences can be created and assessed in virtual reality, even for products that do not yet exist as firms only need a virtual blueprint or 3D model of the new product (Hershfield et al. 2011; Serranoa et al. 2013). Thus, durables producers could get consumer insights earlier in the NPD process by relying on virtual reality, resulting in advantages such as better aligned production and commercialization plans or cost reductions (Cao and Zhang 2021; Markovitch et al. 2015).
For these reasons, we examine how consumer durable goods producers can utilize virtual reality—a simulated environment that allows the consumer to interact with it (Lurie and Mason 2007)—to improve their NPD. We focus on virtual reality for prelaunch sales forecasting and then discuss implications for other NPD tasks. In particular, we examine the following:
To examine RQ1, we developed a new prelaunch sales forecasting approach that employs virtual reality, together with an extended macro-flow model. We tested the new approach in two field studies (Studies 1a and 1b) with two real-world innovations that our collaborating companies actually introduced. In total, a representative sample of 631 potential buyers participated in the field studies. Using one year of actual sales data provided by GfK, a leading European market research agency, we validated our prelaunch sales forecasts after the launch of the two innovative durables. The results show that the new approach achieves high prelaunch forecasting accuracy with errors for the aggregated first-year sales forecasts of 1.9% (Study 1a), .0% (Study 1b, forecast with actual advertisement spending), and 20.0% (Study 1b, original prelaunch forecast) as well as a mean absolute percentage error (MAPE) of 18.6% (Study 1a), 26.5% (Study 1b, forecast with actual advertisement spending), and 44.4% (Study 1b, original prelaunch forecast) for the monthly sales forecasts across the two studies. In addition, a comparison of our forecasts with the strongest benchmark model demonstrates that this new forecasting approach improves monthly forecasting accuracy by over 30%. In a supplemental analysis, we furthermore approximated that a substantial part of this improvement can be attributed to the virtual reality key feature of the approach.
To address RQ2, because we could not determine from the field studies why virtual reality contributes to sales forecasting accuracy, we conducted a laboratory experiment (Study 2, n = 210). Participants were randomly assigned to one of three conditions: (1) lab virtual reality, (2) online virtual reality, or (3) a studio test with real products. The findings reveal that the forecasting advantages of virtual reality emerged because virtual reality participants on average behaved more consistently in terms of their information search, preferences, and purchase behavior within the simulation than the studio test participants. The results also indicate that these differences can be explained by increased presence (i.e., the extent to which participants feel they are actually in the simulation) and vividness (i.e., the extent to which participants feel that the simulation is detailed and easy to imagine), but not through alternative theoretical lenses, such as decision uncertainty and convenience.
Overall, our approach and findings advance the understanding of whether and how virtual reality can improve sales forecasting (RQ1: Studies 1a and 1b) and of the reasons why these advantages arise (RQ2: Study 2). In concluding, we discuss the studies’ implications for future research—including a road map for future marketing studies on better prognoses, diagnostics, and customer linking through virtual reality (Day 1994)—and nonacademic audiences—including an action plan for the use of virtual reality in NPD.
RQ1: (How) Does Virtual Reality Improve Prelaunch Sales Forecasting?
Approach
Researchers have focused on forecasting models for new durables that are applied close to launch (Bolton 2003; Goodwin, Meeran, and Dyussekeneva 2014). However, firms need a precise sales forecast early in NPD to improve their investment decisions (Markovitch et al. 2015) and to align their production, marketing, and distribution plans (Cao and Zhang 2021). Although knowledge is lacking on the prelaunch sales forecasting of durables, sophisticated models for consumables exist that achieve high forecasting accuracy by using a trial-and-repeat logic (Fader, Hardie, and Huang 2004; Silk and Urban 1978). However, these models are not applicable to durables, which are purchased infrequently and are therefore not subject to trial-and-repeat purchases (Grewal, Metha, and Kardes 2004). We address this research gap and develop a new prelaunch sales forecasting approach for consumer durables with two key features: virtual reality and an extended macro-flow model.
Key Feature: Virtual Reality
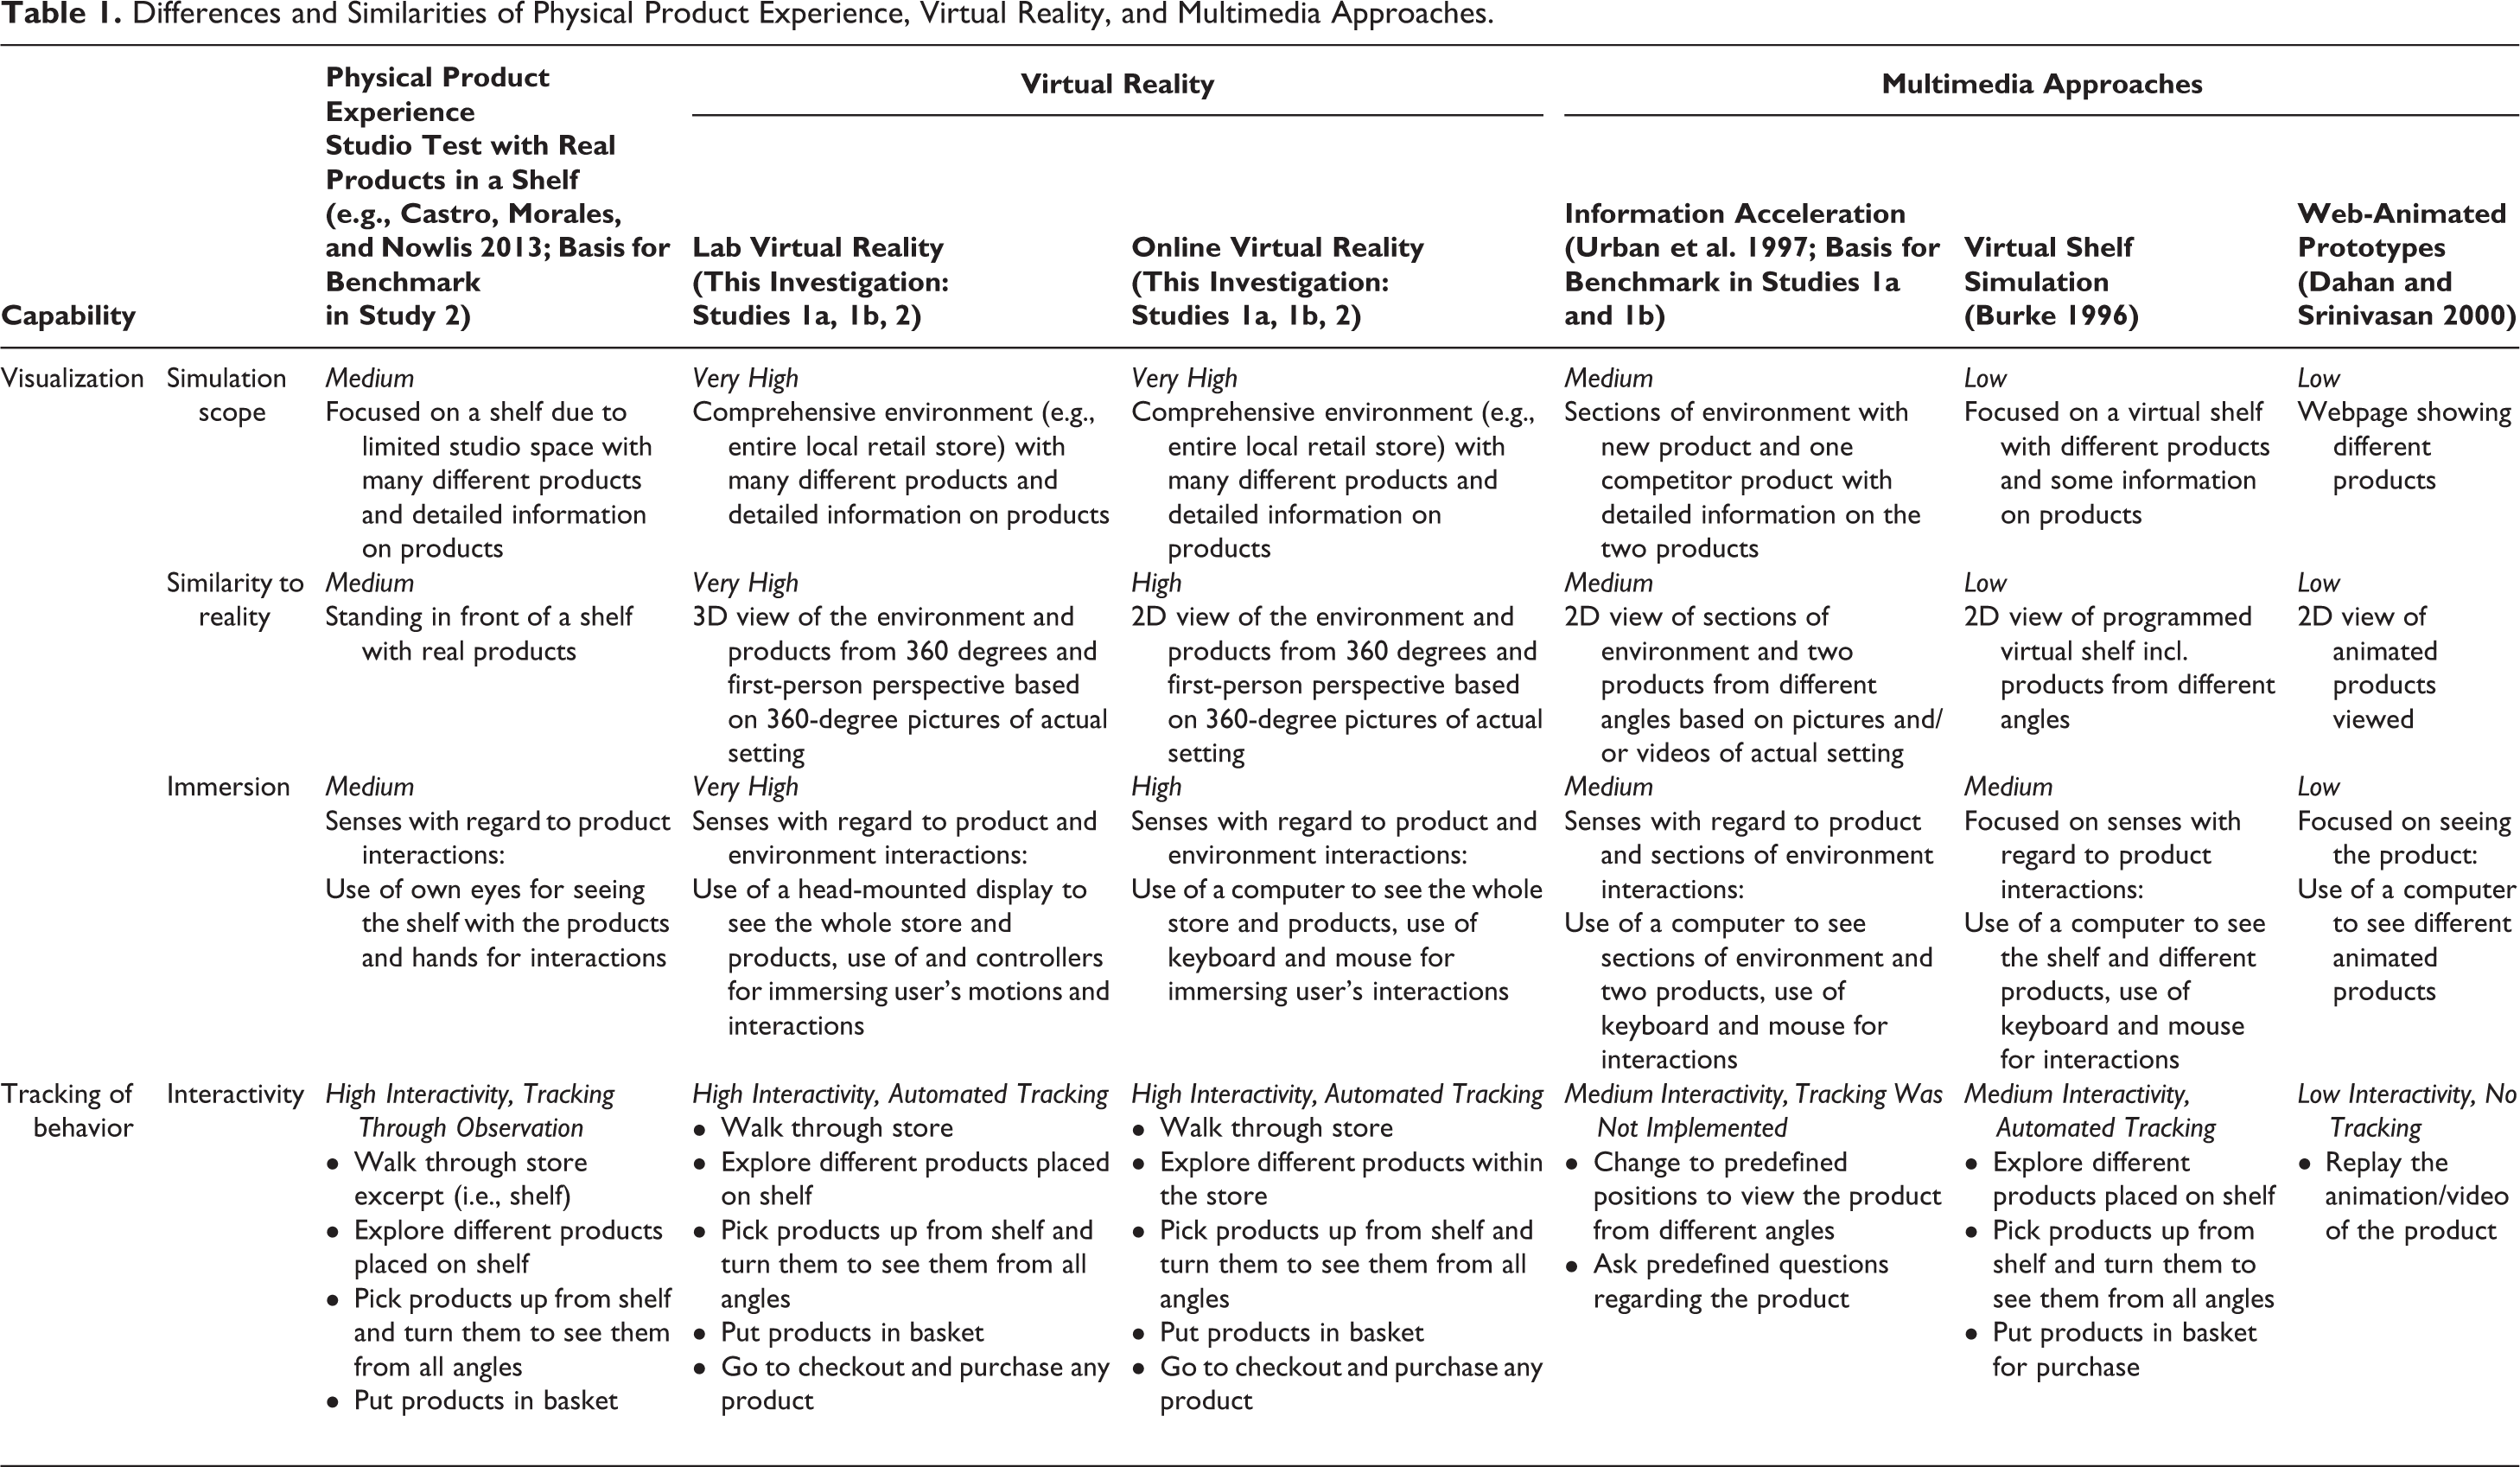
The use of a virtual reality simulation for the new approach was motivated by virtual reality’s visualization and automated-tracking capabilities. We explain these two capabilities and then discuss the virtual reality types that leverage these capabilities to a varying extent (Table 1).
Differences and Similarities of Physical Product Experience, Virtual Reality, and Multimedia Approaches.
Visualization capability
By “visualization capability,” we refer to the ability to simulate new products, customer touchpoints, and environments in a comprehensive, realistic, and engaging manner. Drawing on previous work (Cipresso et al. 2018; Lurie and Mason 2007; Morales, Amir, and Lee 2017; Urban, Weinberg, and Hauser 1996), we theorized that the visualization capability would be valuable for forecasting: if consumers are immersed into the simulation and the simulation is comprehensive and similar to reality, they might be more likely to act throughout the simulation as they would in a real durable purchasing situation. As Table 1 shows, virtual reality has a higher visualization capability than previous multimedia approaches or studio tests used for prelaunch forecasting. This advantage can be attributed to virtual reality’s simulation scope, similarity to reality, and immersion.
First, virtual reality can span a very high simulation scope. This attribute is due to its ability to simulate all facets of purchase journeys with many different products and detailed depictions of various information sources and shopping environments, such as online shops or local retail stores (Grewal et al. 2020; Lemon and Verhoef 2016). In building on these insights, we expected that, compared with previous multimedia approaches and studio tests, virtual reality would motivate more realistic consumer behavior due to the increased liveliness of the simulation (Morales, Amir, and Lee 2017; Schlosser 2006). This anticipation is because, to reduce costs and complexity, prior approaches relied on more focused and less detailed simulations, such as displaying the new product on a shelf alongside only a few competitors (Table 1).
Second, virtual reality can achieve a (very) high similarity to reality. This attribute is due to its ability to showcase the simulated shopping environment and products from 360 degrees and first-person perspective based on 360-degree pictures of the actual setting. Thus, in line with previous research in related fields (Grewal et al. 2020), we expected that virtual reality would increase similarity to reality compared with previous multimedia approaches and physical product experiences, such as studio tests (Table 1). This anticipation is because previous approaches relied on either third-person perspectives via pictures, image galleries, and infomercials or on simulating parts of reality (e.g., a shelf with physical products or only the products) in a less genuine manner.
Third, virtual reality simulations can achieve a (very) high immersion of consumers. This attribute exists because, using additional virtual reality equipment (e.g., head-mounted displays, motion controllers), it can deeply transport consumers into a simulation by stimulating their senses intensively (Swaminathan et al. 2020). In contrast, previous approaches would either immerse fewer senses or focus on consumers’ immersion related to the product (but not the environment) (Table 1). Thus, we expected that virtual reality (vs. previous approaches) would motivate more realistic behavior by further increasing consumers’ perceived transportation into the simulation.
Automated-tracking capability
Automated-tracking capability is the ability to directly collect data of consumers’ interactions with the simulation. The recorded data can encompass the type of interaction performed by the consumer (e.g., entering a simulated environment, operating a product in the use environment) as well as the duration of each interaction. We theorized that an automated-tracking capability would be valuable for sales forecasting: prelaunch sales forecasting models could integrate such behavioral data as inputs, which might increase forecasting accuracy (Morales, Amir, and Lee 2017; Urban et al. 1997).
Virtual reality has an automated-tracking capability advantage over previous approaches, which relied on observations to capture consumers’ actions and focused on collecting data on interactions with the products (Table 1). In contrast, due to sophisticated computer-based simulation technology and motion-tracking sensors, virtual reality offers additional options to interact with both the simulated environment and the products (Cipresso et al. 2018). Moreover, because these interactions occur digitally, they can be directly tracked (Cipresso et al. 2018; Grewal et al. 2020).
Virtual reality types
Virtual reality simulations essentially fall into two main categories: lab virtual reality and online virtual reality. Lab virtual reality requires data gathering in a central location, as it uses additional equipment for viewing and interacting with the simulated environment (e.g., head-mounted displays, sensory input devices, power walls). This equipment allows lab virtual realities to offer many highly intuitive interaction possibilities (Cipresso et al. 2018). For instance, head-mounted displays automatically react to the user’s head movements and change the perspective and picture. Moreover, hand movements can be detected by motion-tracking sensors or virtual reality controllers and mimic and perform these actions within the simulation. Thus, using gesture control, consumers within a lab virtual reality can move around freely in the simulation, pick up items from shelves, and operate or buy products (e.g., through hand movements).
In contrast, an online virtual reality can be accessed from anywhere via the internet as it is displayed on a computer and does not need additional equipment. Owing to sophisticated graphics and 360-degree views from the first-person perspective, online virtual realities can realistically depict products and environments at comparatively low costs (Bowman and McMahan 2007). However, compared with lab virtual realities, online virtual realities stimulate fewer senses and provide less intuitive interaction possibilities (e.g., clicking on a mouse vs. motion-tracking) while still offering high degrees of interactivity (Cipresso et al. 2018). For instance, in online virtual reality, consumers can freely navigate in any direction within the simulated environment by clicking in that direction, and the position and perspective changes automatically. Participants can select different products with the cursor, pick a product up by clicking on it, and then view it from 360 degrees, put it back on the shelf, or buy it as they would in a real store.
Thus, as Table 1 shows, lab virtual realities and online virtual realities are very similar in terms of their automated-tracking capability but differ with respect to their visualization capability. Both lab and online virtual realities can achieve similarly high levels of simulation scope and interactivity, but lab virtual realities are likely to create more immersive and realistic environments, due to the usage of additional virtual reality equipment. Figure 1 provides visuals and screenshots that illustrate both virtual reality types. See the subsection “Studies 1a and 1b: Research Setting, Data, and Analyses” for a depiction on how we use both virtual reality types in field studies.
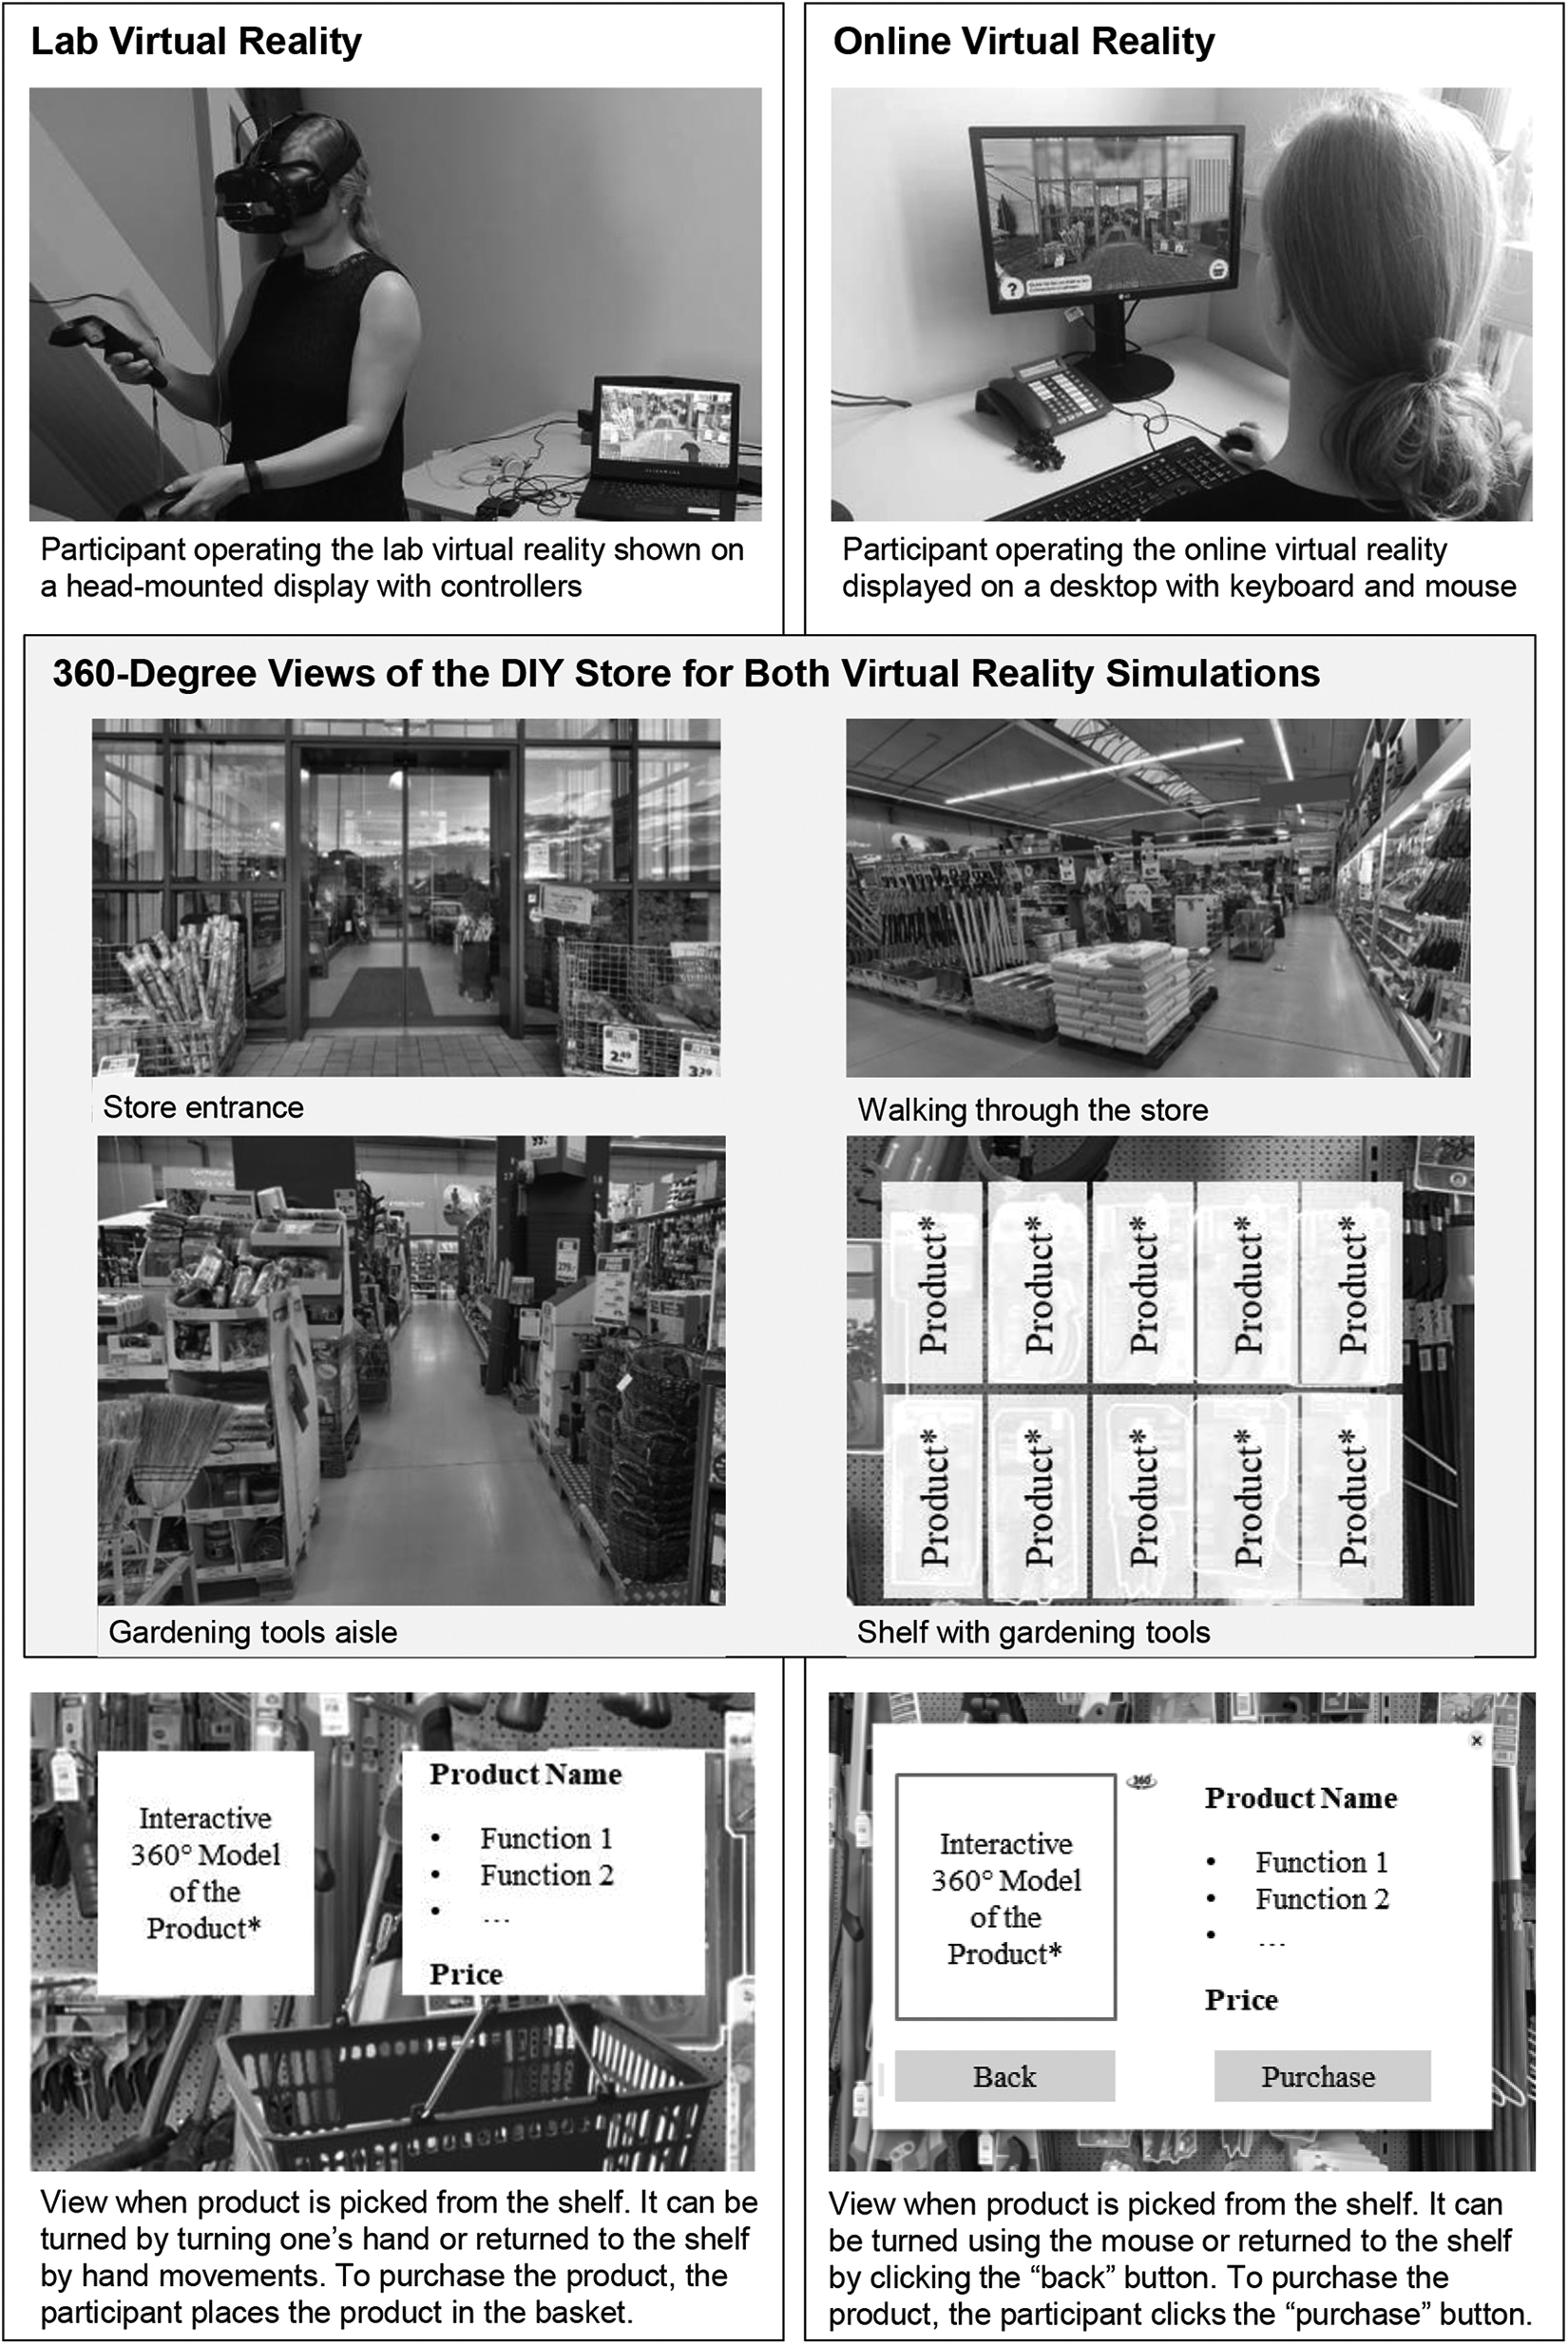
Visuals and screenshots of virtual reality environments.
Key Feature: Extended Macro-Flow Model
Macro-flow models forecast the sales of new products over time before their market launch (Urban, Hauser, and Roberts 1990). In contrast, alternative forecasting models either do not allow for a prediction over time (e.g., conjoint analysis) or cannot be applied prior to the launch (e.g., diffusion models). To derive a sales forecast over time, macro-flow models predict the flows of potential buyers from one state of the purchase journey to the next. To make these predictions prelaunch, they require a purchase journey simulation (Urban, Weinberg, and Hauser 1996). Macro-flow models consist of three elements: behavioral states, the flows between these states, and the determinants of these flows (Figure 2).
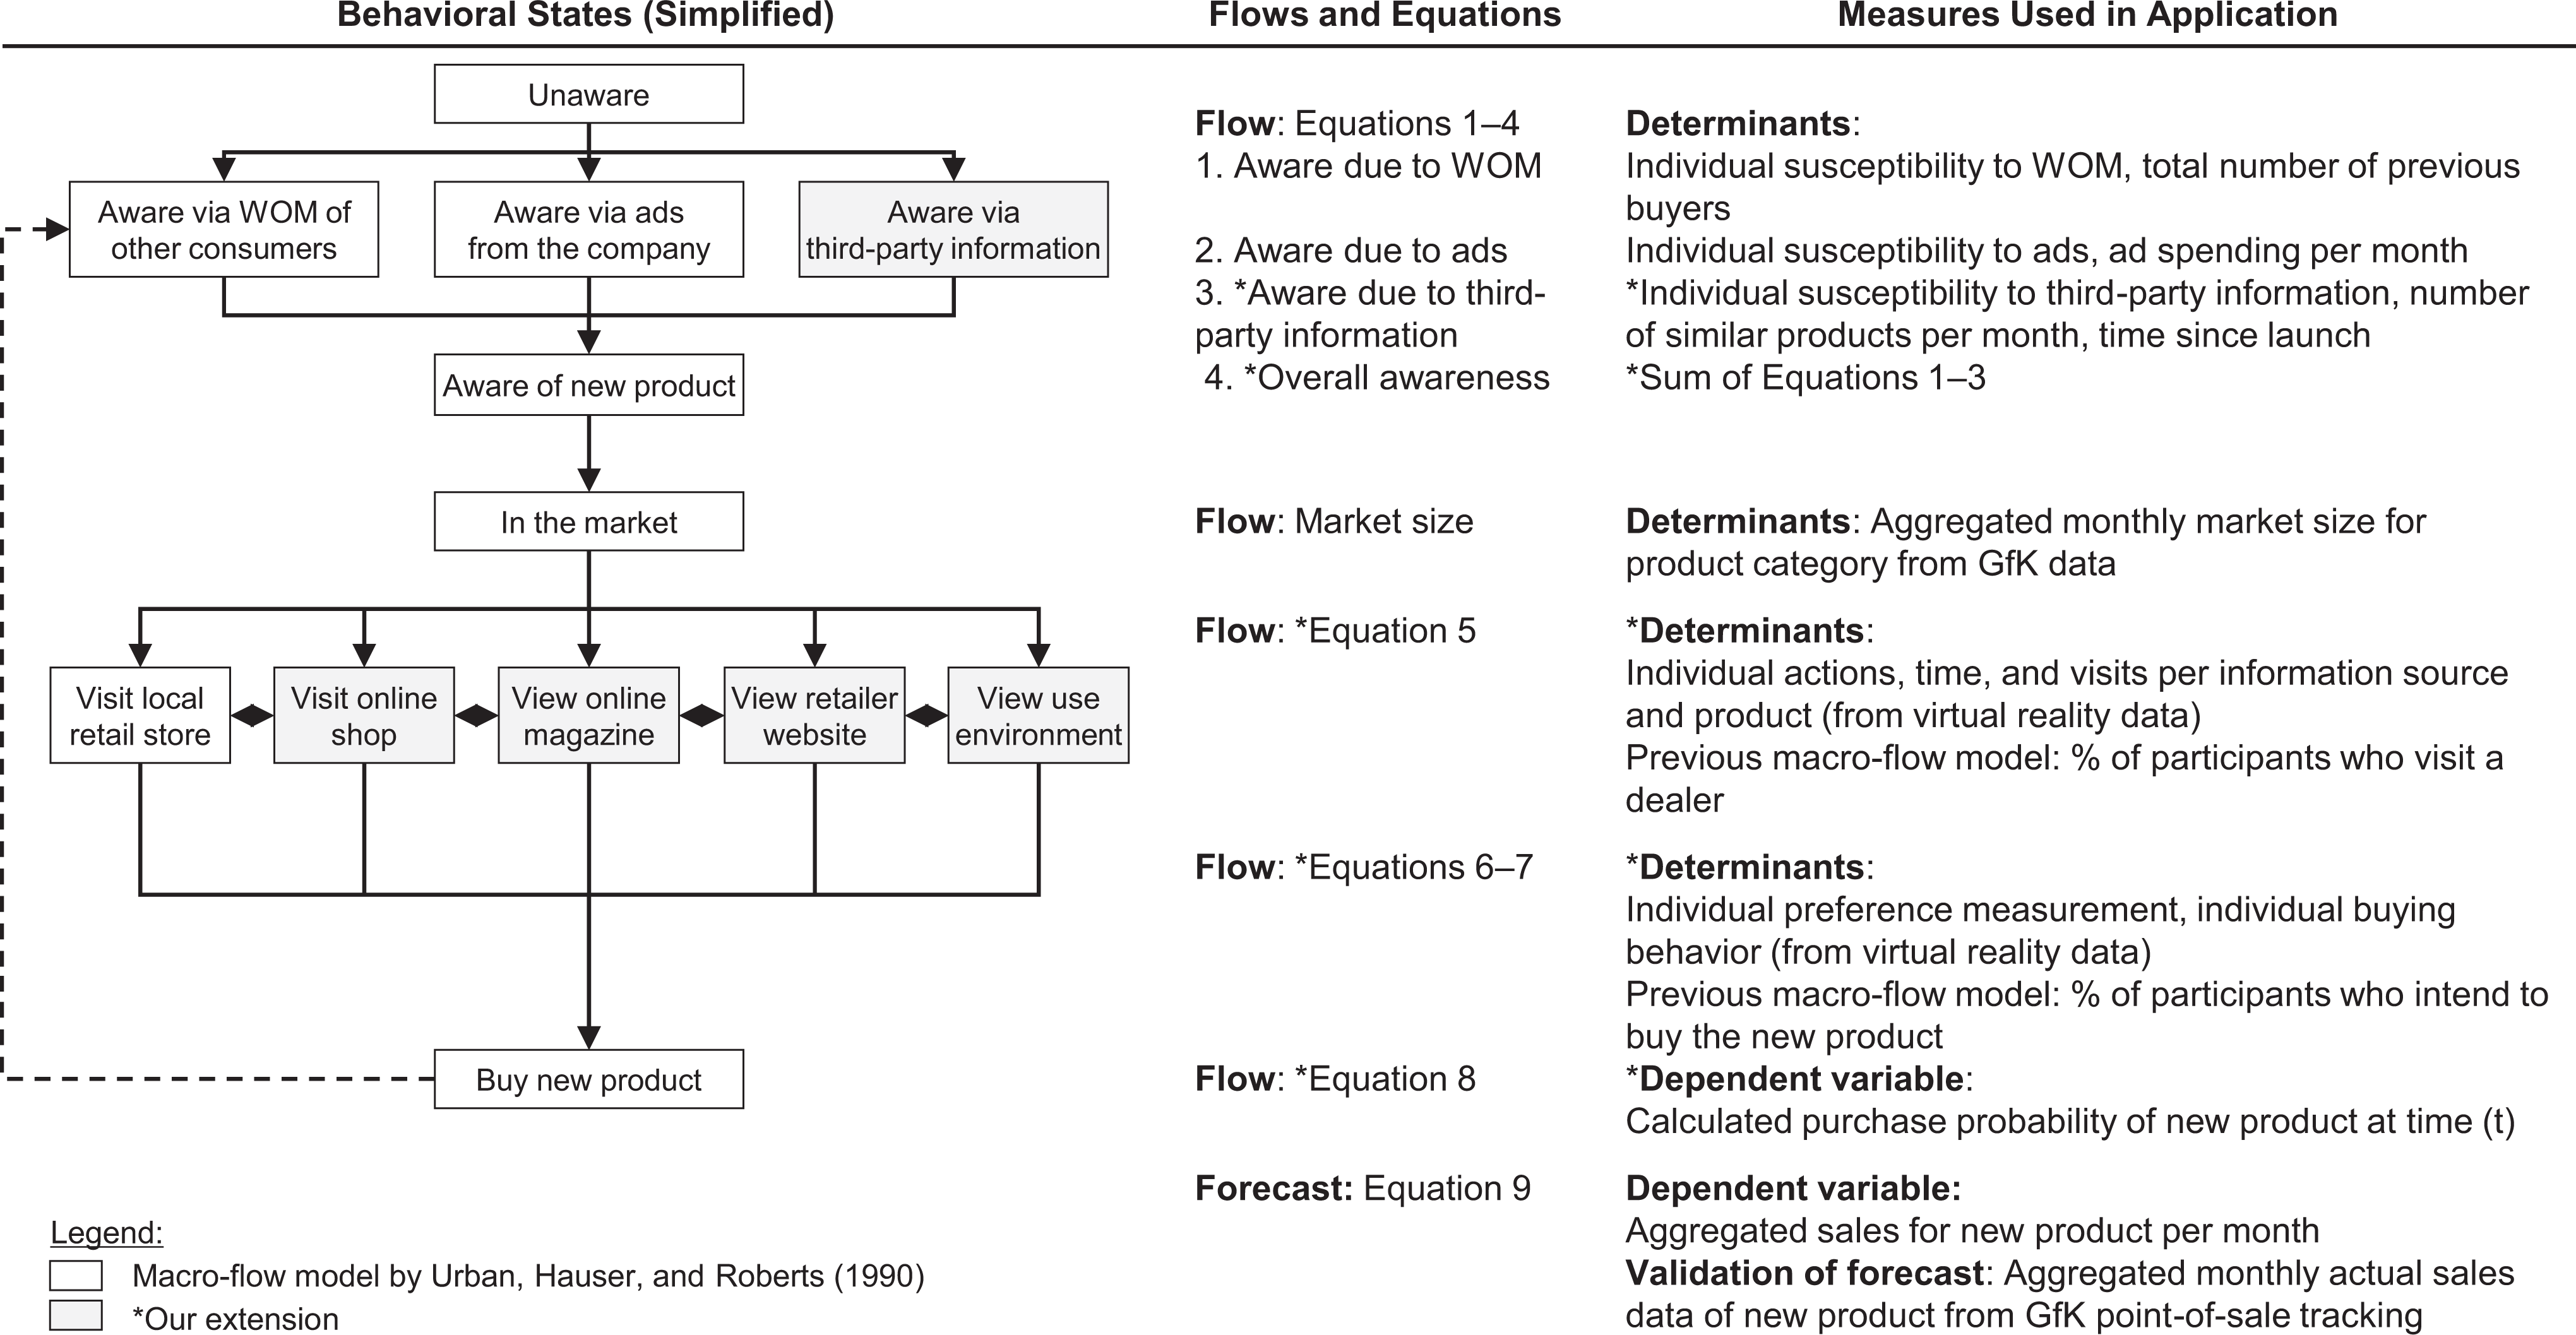
Behavioral states, flows, and determinants in the extended macro-flow model.
Behavioral states
Behavioral states are the attitudes and actions through which consumers flow in their purchase journey (Urban, Hauser, and Roberts 1990). As Figure 2 shows, we extended previous macro-flow models in the awareness, information search, and purchase decision state. For creating awareness, previous macro-flow models considered word of mouth (WOM) and advertisements (Urban, Hauser, and Roberts 1990; Urban, Weinberg, and Hauser 1996). To adjust for the presence of the internet (e.g., social media, blogs) and its impact on consumer behavior (Xiong and Bharadwaj 2014), we added awareness via third-party information. For information search, previous macro-flow models included a showroom visit, a test drive (Urban, Weinberg, and Hauser 1996), or a consumer magazine and recommendations from others (Urban et al. 1997). To capture consumers’ information search more broadly (Lemon and Verhoef 2016), our extended macro-flow model includes five frequently used information sources: a local retail store, an online shop, the producer’s website, an online magazine, and a use environment. Finally, previous macro-flow models captured the purchase decision state in terms of buying either the new product or a competitor product, thus forcing participants to make a decision. In contrast, to account for the possibility that consumers delay their purchase or refrain from buying (Grewal, Metha, and Kardes 2004; Srinivasan, Rutz, and Pauwels 2016), we added a no-purchase option.
Flows between the behavioral states
Flows between the states are defined as the proportion of consumers transitioning from one behavioral state to another (Roberts, Nelson, and Morrison 2005; Urban, Hauser, and Roberts 1990). All flows build on logit and negative exponential models (Hauser and Wisniewski 1982). We focus the description below on the new and updated flows but summarize all equations in Table 2.
Overview of Flows in the Extended Macro-Flow Model.
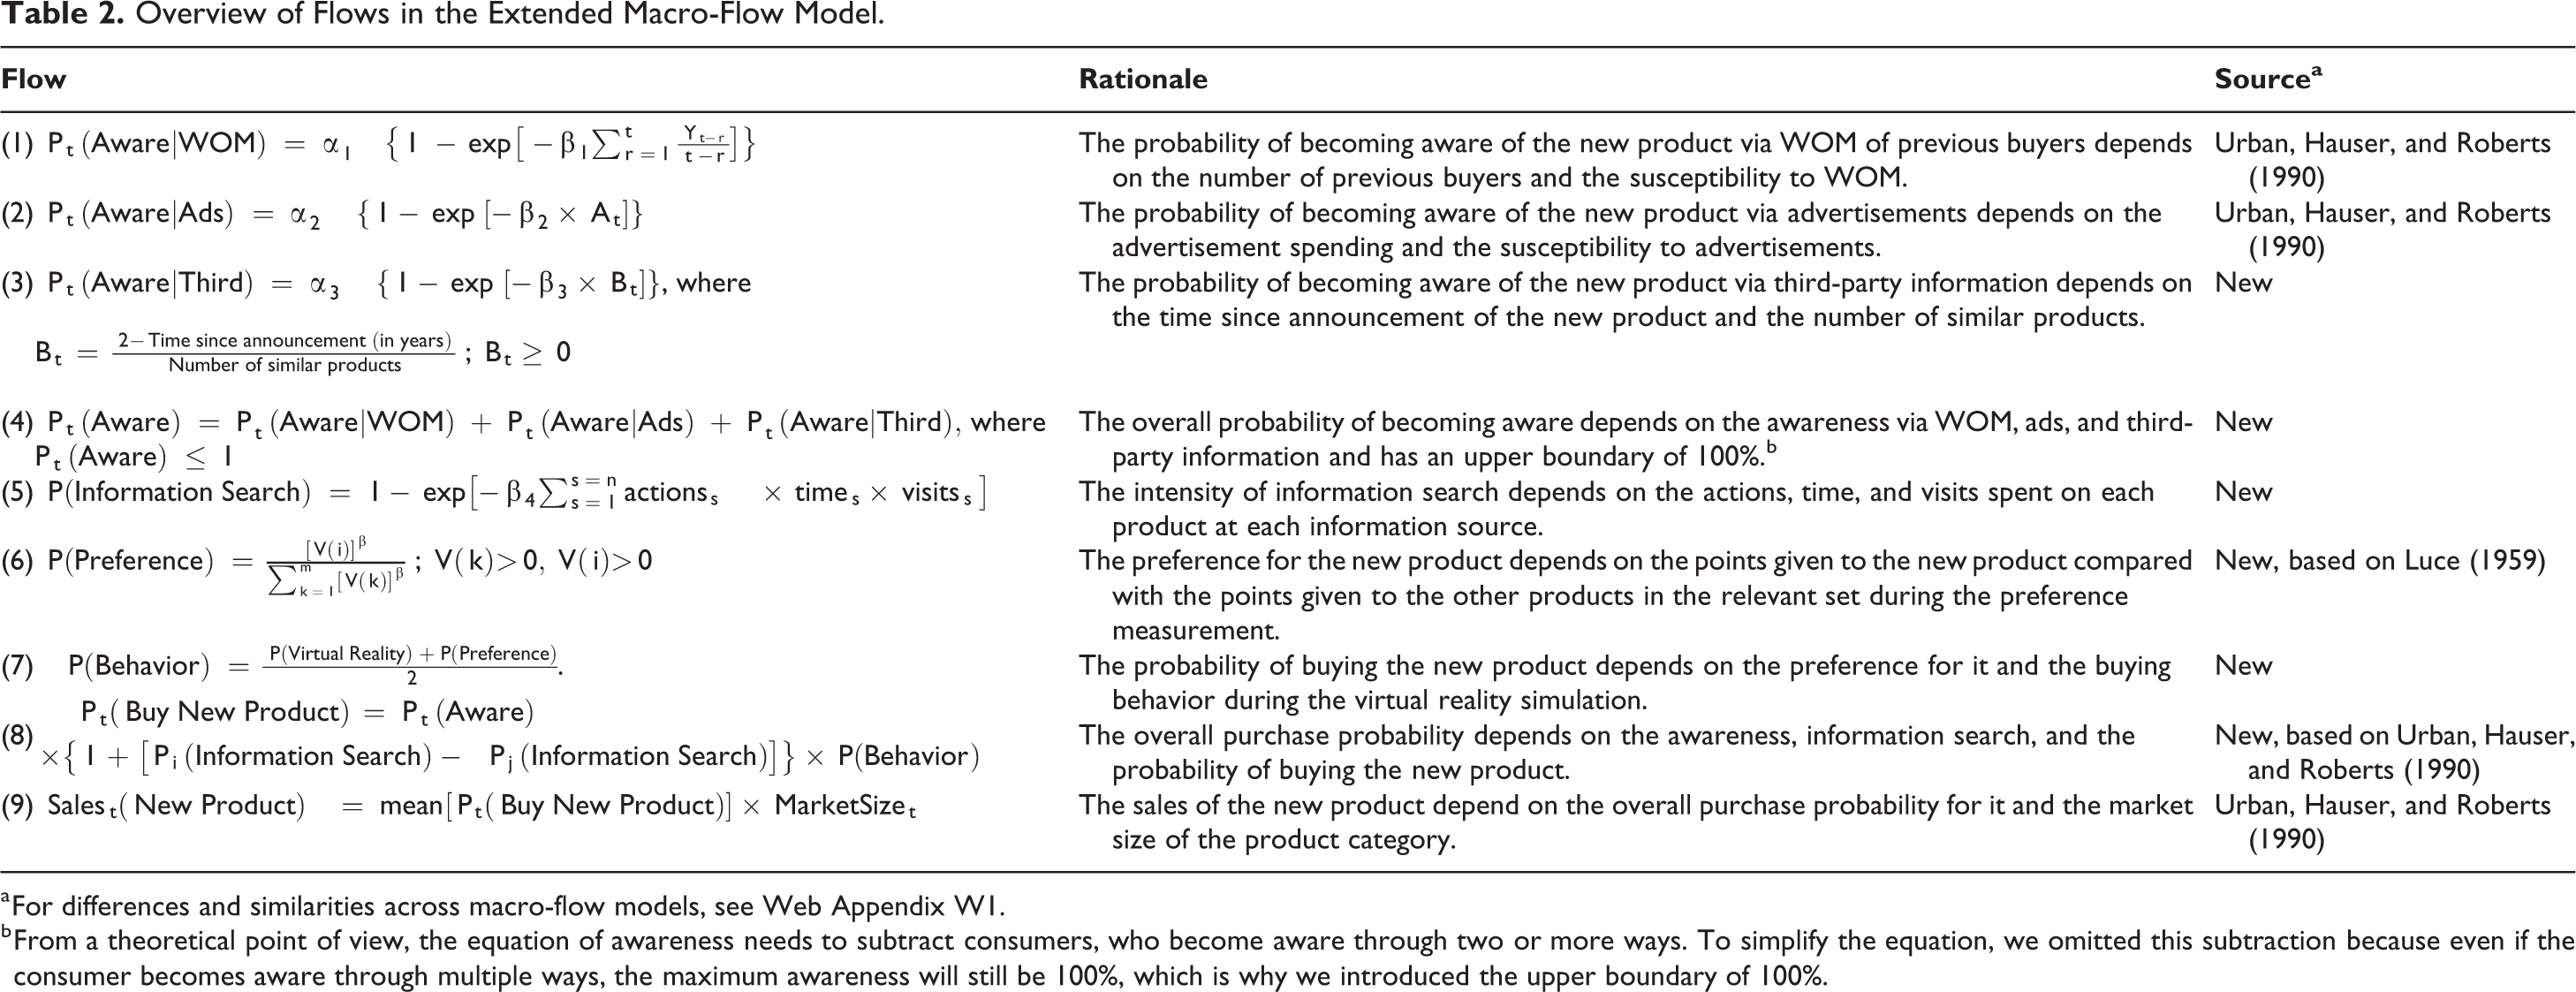
a For differences and similarities across macro-flow models, see Web Appendix W1.
b From a theoretical point of view, the equation of awareness needs to subtract consumers, who become aware through two or more ways. To simplify the equation, we omitted this subtraction because even if the consumer becomes aware through multiple ways, the maximum awareness will still be 100%, which is why we introduced the upper boundary of 100%.
The first new flow is the probability of becoming aware via third-party information (Equation 3, Table 2). We model this flow,
The next updated flow is from awareness to information search (Equation 5, Table 2). As the time and effort in the information search allocated to particular products indicates purchase interest in those products (Bronnenberg, Kim, and Mela 2016), we model the flow from awareness to information search, P(Information Search), for each consumer for each product depending on the number of actions, visits, and time spent at each information source.
The next new flow is from information search to the purchase decision. This flow, P(Behavior), is calculated as the mean of two components (Equation 7, Table 2): preferences and the observed virtual purchases. We model the preference of each participant, P(Preference), by asking participants to divide a fixed number of points according to their preferences between the products they would consider buying (Lim, Ahearne, and Ham 2009; Luce 1959). 3 We observe each participant’s virtual purchase decision, P(Virtual Reality), in the simulation and assign different purchasing probability values to it (i.e., 0 if no product or a competitor is bought, .2 if the product is on the wish list, and .7 if the product is bought), guided by previous findings on conversion schemes for purchase intentions (Chandon, Morwitz, and Reinartz 2005; Jamieson and Bass 1989). We calculated several sensitivity checks for these choices (Web Appendix W2) and found that forecasting accuracy only slightly decreases if alternative choices based on competing rationales are made.
We calculate the overall purchase probability for the new product
Determinants of flows
The determinants of flows are the independent variables that drive the flows between the behavioral states of the macro-flow model (Urban, Hauser, and Roberts 1990). We used the same determinants as Urban, Hauser, and Roberts (1990) for the adopted flows and new determinants for all newly introduced or updated flows (see Figure 2).
Studies 1a and 1b: Research Setting, Data, and Analyses
We implemented our new forecasting approach in two large-scale field studies (Studies 1a and 1b) collaborating with two different durables’ producers planning to launch new products. For data collection, we also collaborated with GfK to enlist participants from GfK’s representative retail panels. Following standard market research procedures, we employed a screener to identify a representative sample of consumers in the market willing to buy a product in this product category (Web Appendix W3).
For both field studies, the purchase journey simulation started by creating awareness, as awareness is the necessary precondition for consumers’ subsequent purchase journey behaviors, and because the new durable had not been announced to the market (Barroso and Llobet 2012). We created awareness by showing all participants actual marketing stimuli provided by the company launching the new product. Next, participants searched for information on the products in the purchase journey simulation. The simulation ended when participants bought any of the displayed products or they ended the simulation without making a purchase (Dhar and Simonson 2003). For both field studies, we captured a virtual purchase decision because an actual preordering of the new products was not yet possible. After the simulation, participants allocated a fixed number of points among the products in a preference measurement (Luce 1959). Finally, we conducted a survey with questions on additional input parameters (e.g., susceptibility to WOM) for the extended macro-flow model.
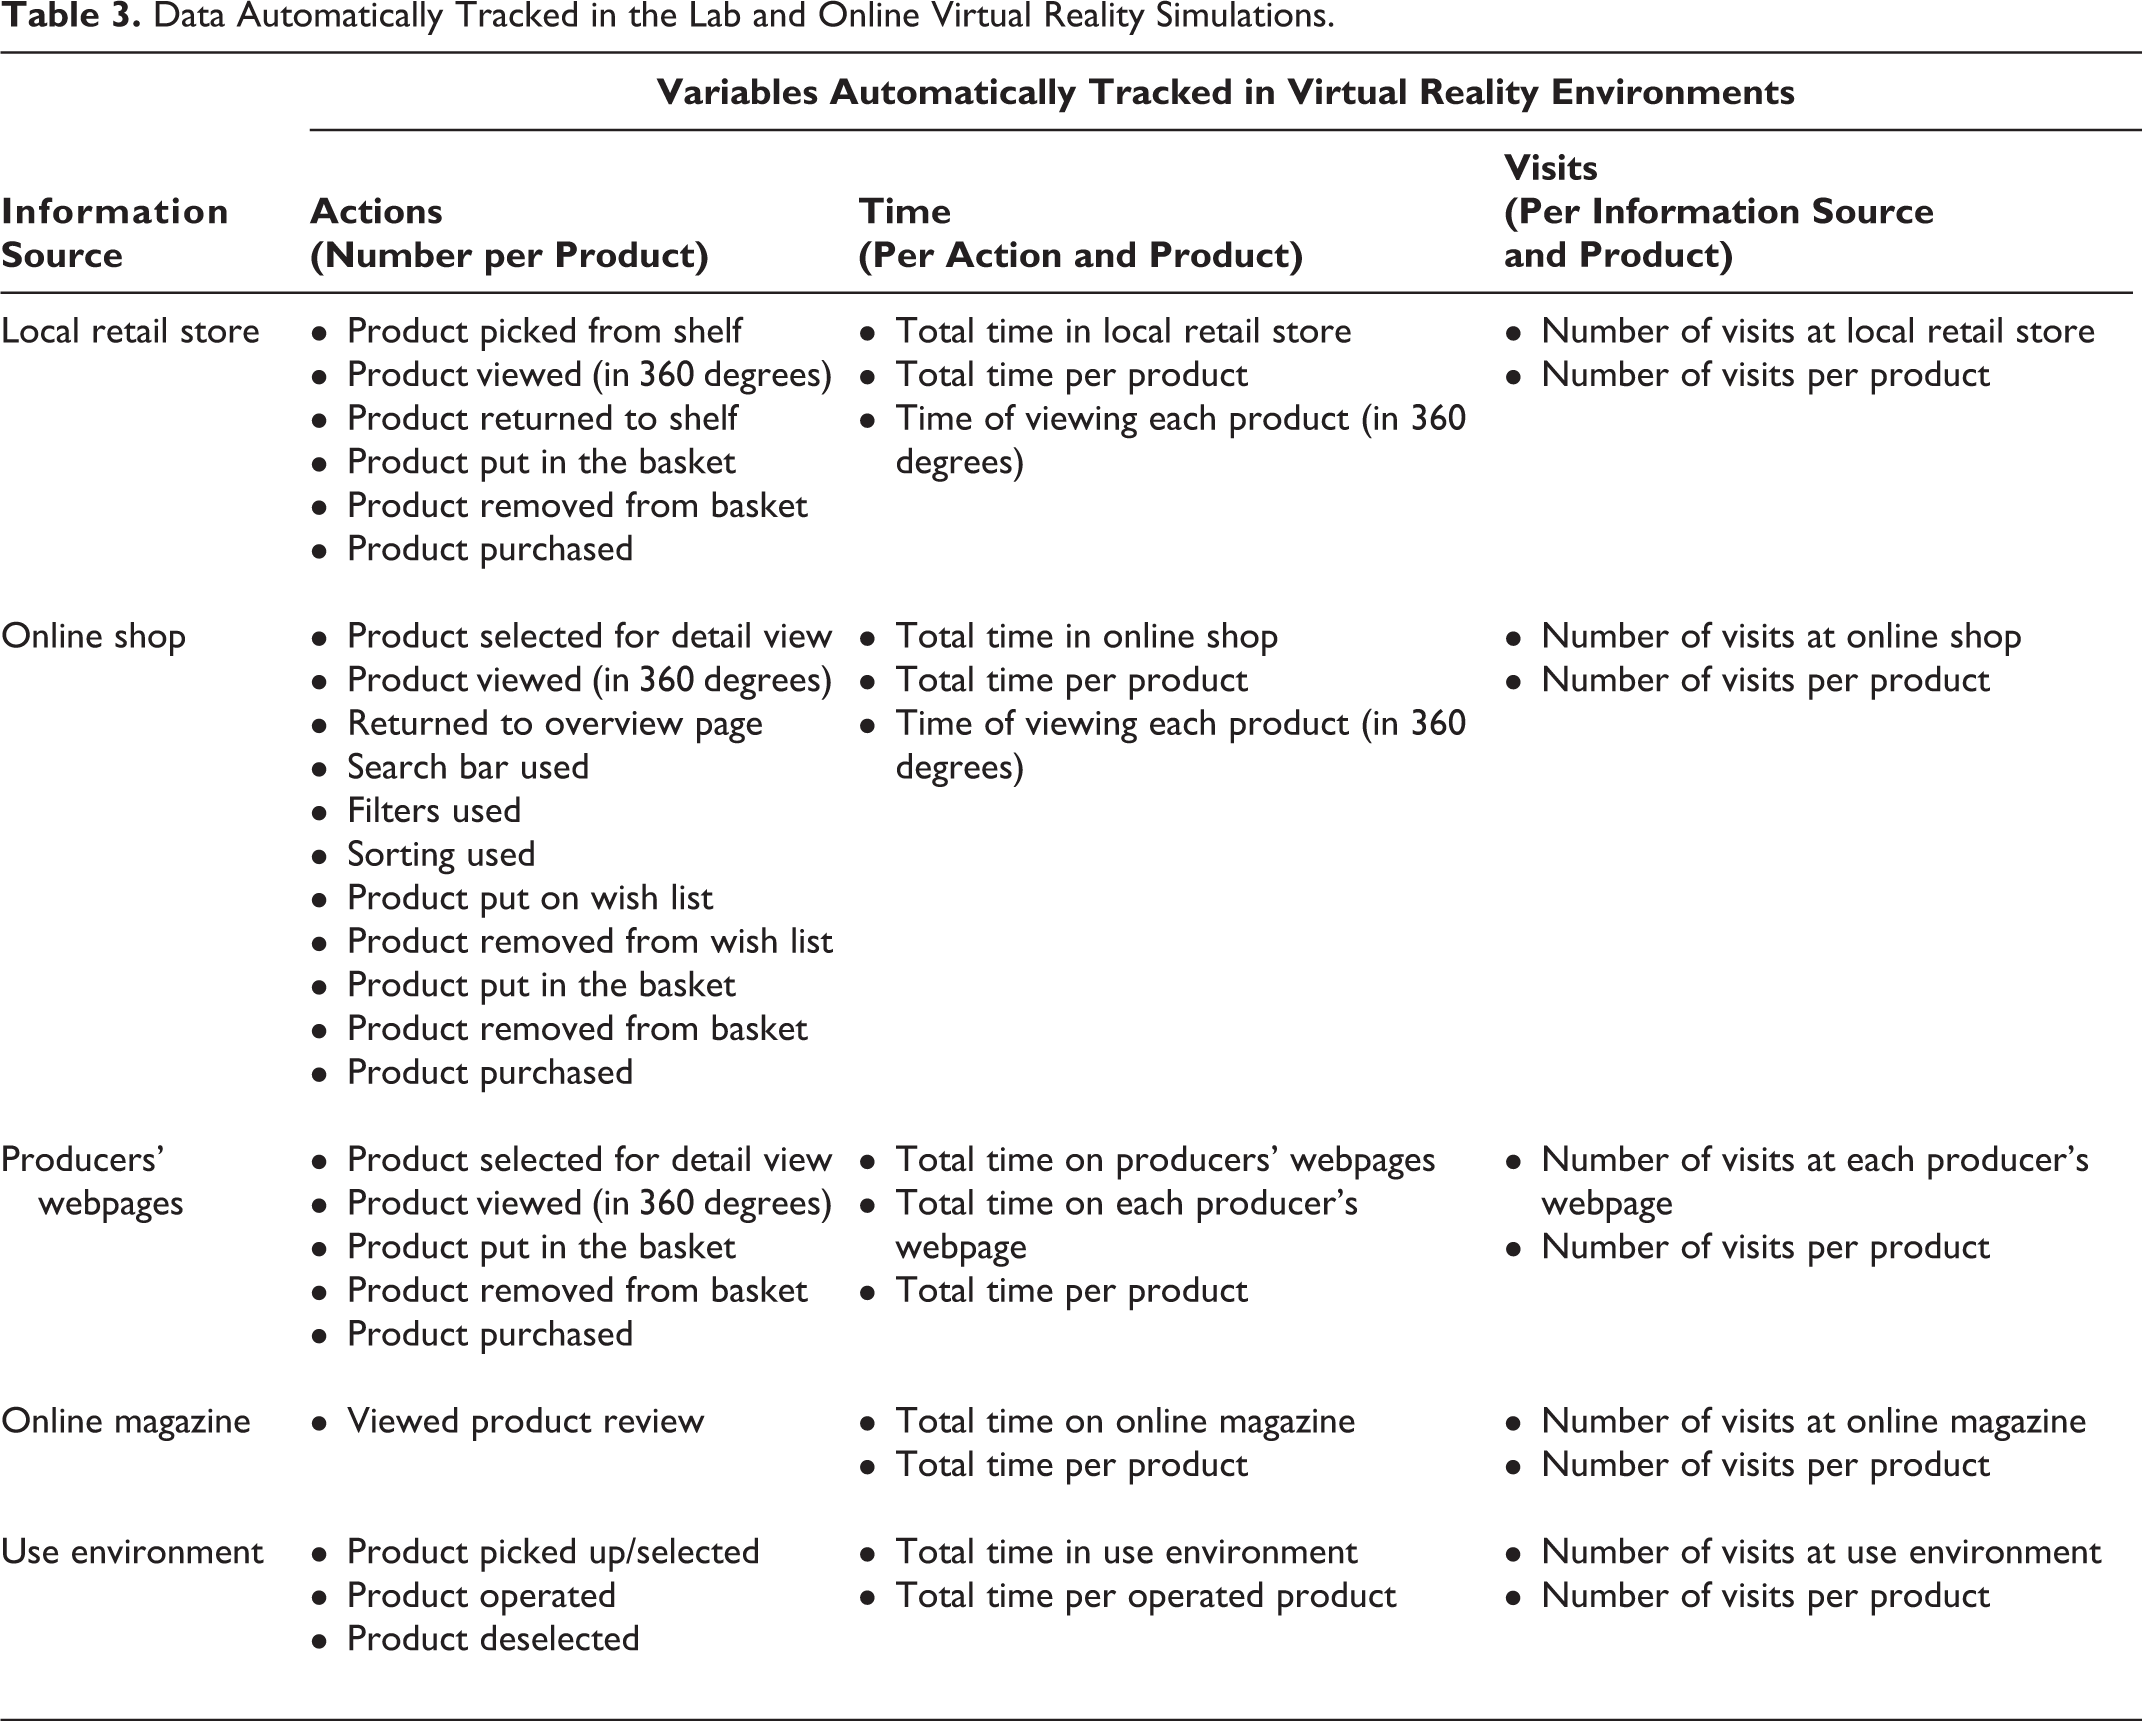
The purchase journey was simulated in virtual reality. Because our collaboration partners required accurate and cost-effective results, we used both types of virtual reality: a lab virtual reality (via a head-mounted display with virtual reality controllers and motion-tracking sensors for interactions) and an online virtual reality (via a computer screen with mouse and keyboard for interactions). Both types showed the same products in exactly the same environments (i.e., local retail store, online shop, producers’ webpages, online magazine, and use environment) and had exactly the same study flow (i.e., awareness creation, free information search, and the purchase decision). In addition, both types tracked identical individual-level behavioral data (Table 3): the type and number of actions per product at each information source, the time per action and product at each information source, and the visits per information source and product.
Data Automatically Tracked in the Lab and Online Virtual Reality Simulations.
Study 1a forecasts the sales of a new kitchen appliance. The market for this appliance is extremely competitive even though the product is highly priced. Thus, we agreed with the collaborating producer to include 18 products in the simulation to ensure appropriate market coverage. In total, 305 potential buyers participated in Study 1a, with 80 in the lab and 225 in the online virtual reality. Participants’ average age was 45 years, with 45% women. Study 1b forecasts the sales of a highly innovative gardening tool. Because of the tool’s novelty, we decided with the collaborating producer that the simulation would include nine competitor products with varying prices, from the product category most similar to the new tool’s area of application. Study 1b had 326 participants with an average age of 48 years and 50% women. In total, 101 participants completed the lab and 225 participants the online virtual reality simulation. We used the formulas summarized in Table 2 to calculate the forecasts in both studies. We report details on estimated flows in Web Appendix W4.
Studies 1a and 1b: Aggregated-Level Results
Figure 3 presents the sales forecasts calculated prior to launch for Studies 1a and 1b. We organize the aggregated results according to their focus on external validity (i.e., forecasts vs. actual sales and additional external validations) and internal validity (i.e., benchmark macro-flow model, other benchmarks, model variations, and comparison of virtual reality types) assessments of our new virtual reality forecasting approach.
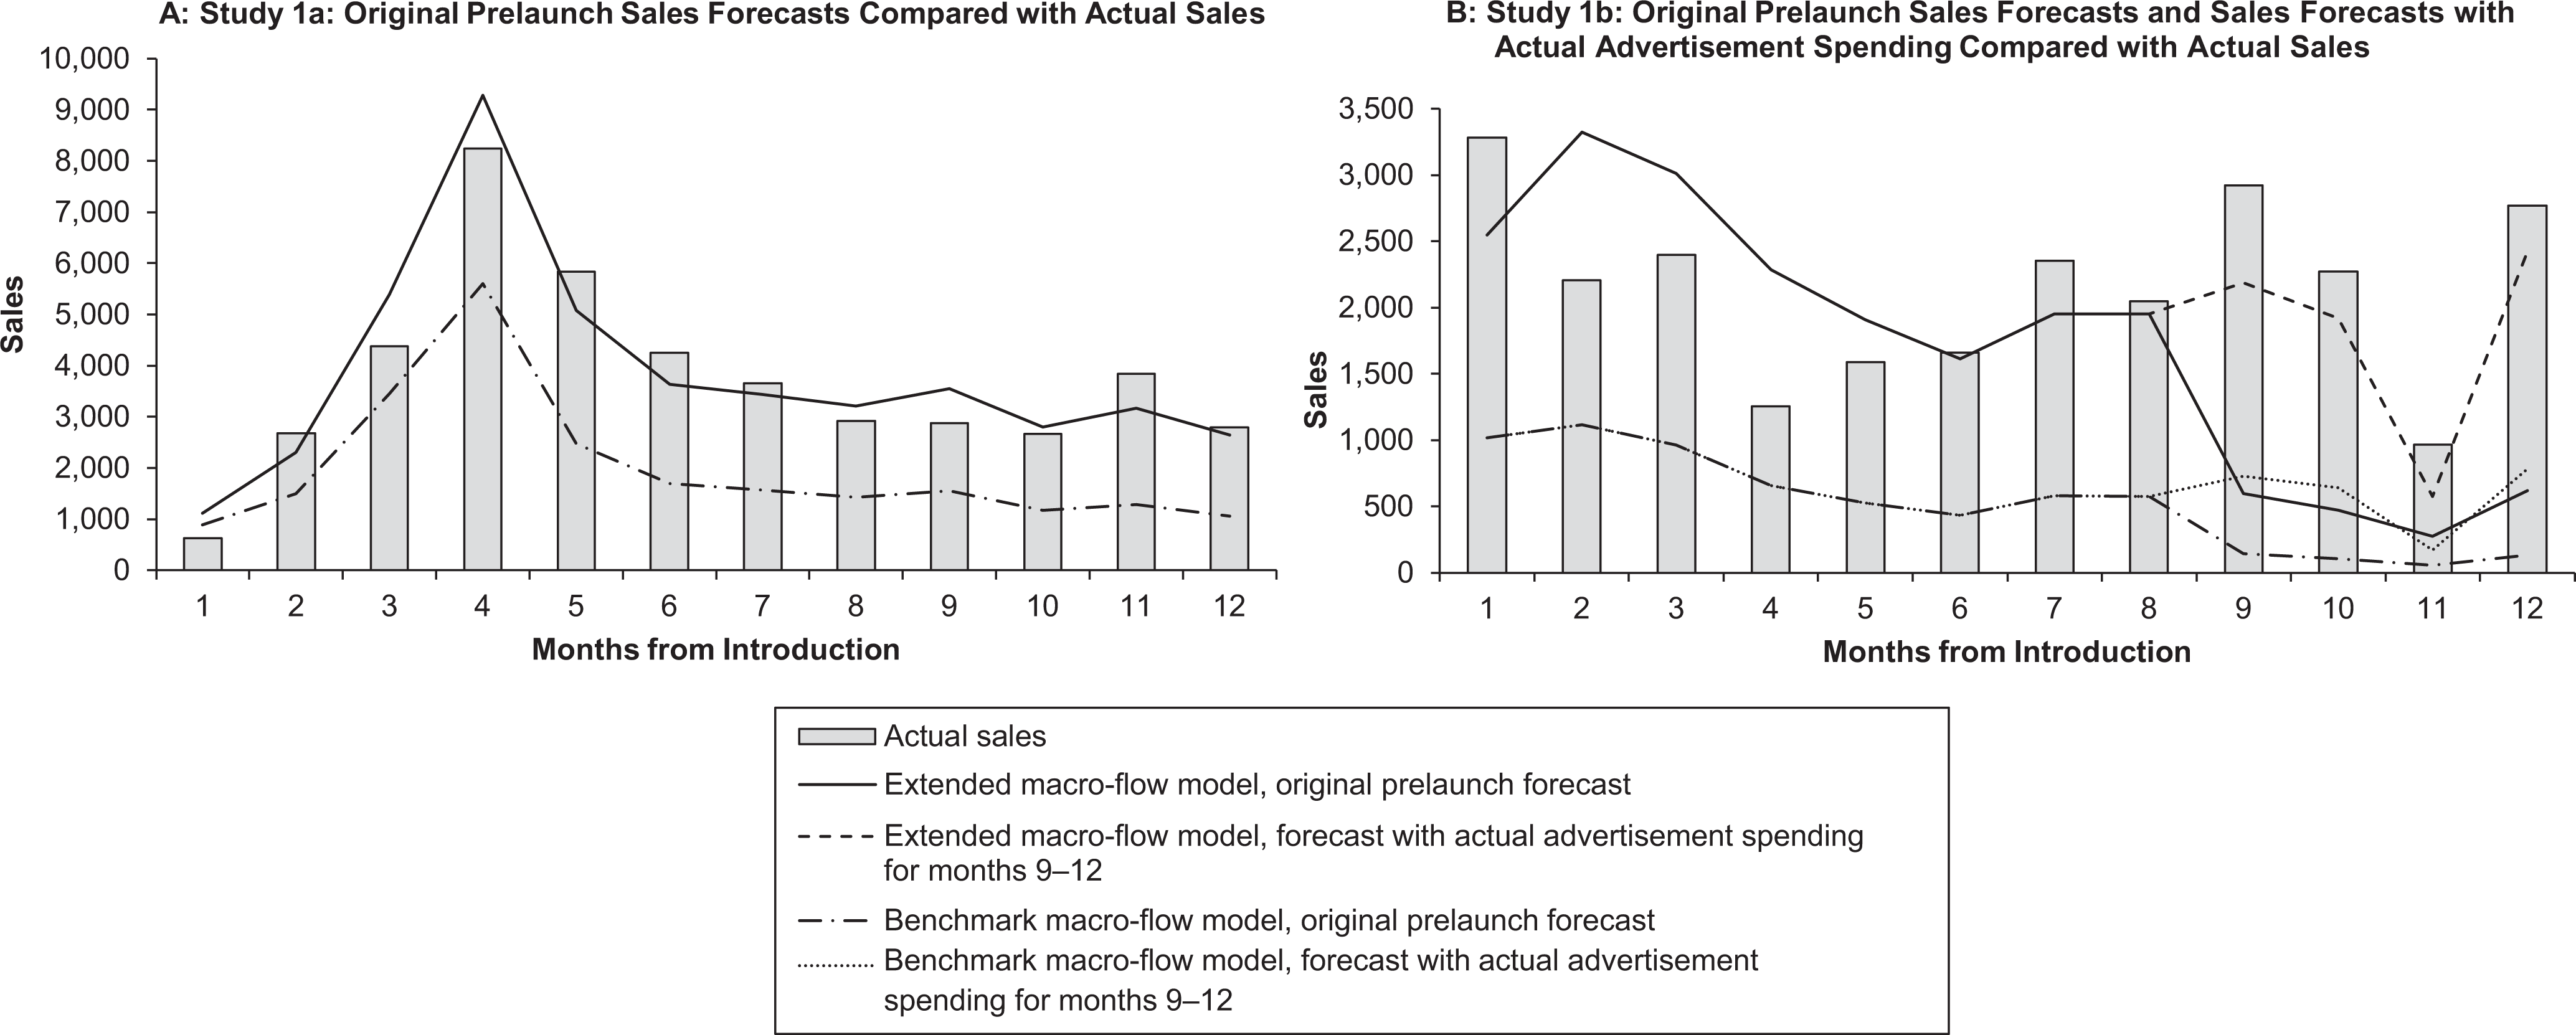
Studies 1a and 1b: sales forecasts compared with actual sales after launch.
Forecasts versus actual sales
To assess the accuracy of our new forecasting approach, we compared the prelaunch sales forecasts with the actual monthly sales of the respective new durable (i.e., aggregated number of units sold in one calendar month), as recorded by GfK through its point-of-sales scanning. To assess first-year model performance, we summed the monthly sales over the first 12 months after launch.
The results show that the prelaunch sales forecast (vs. actual sales data) in Study 1a achieves high forecasting accuracy with a MAPE for the monthly sales forecast of 18.6% and a forecasting error of only 1.9% for aggregated first-year sales. For Study 1b, the MAPE for the monthly sales forecast is 44.4%, and the forecast deviates from aggregated first-year sales by 20.0%, which is less accurate, mainly owing to deviations in months 9–12 (Figure 3). As our collaboration partner pointed out, these deviations were caused by the company’s decision to increase ad spending after initial sales were below expectations. To reflect the company’s decision in a recalculated sales forecast, we used its actual ad spending for months 9–12 as input (Equation 2 in Table 2). The forecast with the actual ad spending for months 9–12 is also shown in Figure 3 and achieves a high forecasting accuracy (i.e., 26.5% MAPE over 12 months and .0% forecasting error for aggregated first-year sales).
Additional external validations
Because, in both studies, the sales forecasting accuracy varies in different periods, we analyzed when and why deviations occur. We identified three factors that caused such deviations: external influences (e.g., unusual weather conditions that affected sales of gardening tools, as in Study 1b), problems during the product launch (e.g., supply chain issues, as in Study 1a, where sales started two weeks later than planned), and changes in marketing plans (e.g., an increase in ad spending, as in Study 1b). As outlined in Web Appendix W5, aggregating sales for longer time spans (e.g., quarterly), relying on confidence intervals, and calculating an updated forecast can remedy these deviations.
In addition, we assessed longer-term predictions, the speed of adoption, and early uses of our new sales forecasting approach (Web Appendix W6). The results show that the approach can be used for longer-term predictions, as we demonstrate by validating a forecast for 22 months with actual sales data from Study 1a. The results reveal that this longer-term forecast is also highly accurate, with a MAPE between 14% and 23% for the monthly sales. Moreover, the cumulative sales forecast can be used to assess the speed of adoption and identify the takeoff (Golder and Tellis 1997). In addition, the results show how the approach can be used early in NPD if a virtual blueprint of the new product exists: either by calculating confidence intervals, as in the real-world application, or by making scenario-based predictions.
Benchmark macro-flow model
To validate our new sales forecasting approach’s extended macro-flow model, we benchmarked it with its strongest precursor “information acceleration” (Urban et al. 1997). To ensure comparability, the benchmark macro-flow model uses the same behavioral states, flows, and determinants from management judgment, survey data, and virtual reality simulations as our new sales forecasting approach. However, we changed one component: the data used for estimating the purchase probability. Instead of using preferences and virtual purchases, we use the percentage of people who intended to buy the new product, as measured in the survey after the purchase journey simulation. This choice permits a prediction more in line with information acceleration and previous macro-flow models (Urban, Hauser, and Roberts 1990; Urban et al. 1997).
The sales forecast derived from the benchmark macro-flow model is also depicted in Figure 3 and has an average MAPE over the first 12 months after introduction of 49.6% in Study 1a and 74.4% in Study 1b (forecast with actual ad spending: 67.2%). It is, on average, more than 30% less accurate than the sales forecasts derived from the extended macro-flow model (Study 1a: 18.6%; Study 1b: 44.4% [forecast with actual ad spending: 26.5%]). This comparison of the extended macro-flow model with the benchmark macro-flow model, which still uses virtual reality and all other amendments of the macro-flow model, provides strong evidence of the new approach’s incremental contribution to the literature. However, we cannot assess from these results the incremental value of either the other amendments to the macro-flow model (for the value of different extensions, see the “Model Variations” subsection) or the use of virtual reality (for the value of virtual reality for prelaunch sales forecasting, see the “Supplemental Analysis” section).
Other benchmarks
For further benchmarking the sales forecast calculated using the extended macro-flow model, we also compare it with conjoint analysis, other approaches to sales forecasting that require different data such as diffusion and utility models, and purchase intention conversion schemes (Web Appendix W7). The results reveal that the new approach overall achieves the highest forecasting accuracy. However, other forecasting approaches, such as conjoint analysis or surveys on purchase intentions, are generally associated with fewer data-gathering efforts and therefore provide alternatives for firms that have time or money constraints or need different or more high-level insights (e.g., estimating willingness to pay or making go/no-go decisions).
Model variations
We validated the extensions of the macro-flow model using model variations, which take out one new component at a time. Importantly, we could take out only the amendments we made to the macro-flow model as they are not shown as a stimulus in the simulation. Assessing the relative impact of amendments related to the simulation (e.g., use of virtual reality, the no-buy option, or the search for information) is not possible because participants’ experiences in the simulation cannot be undone. To assess the impact of using virtual reality we ran a supplemental analysis, which we discuss after Study 2.
Comparing the model variations (Table 4), we conclude that the greatest impact on forecasting accuracy due to macro-flow model extensions comes from the combination of virtual purchases with preferences in the purchase decision stage (Equation 7, Table 2; average accuracy increases across Studies 1a and 1b by 54.0%, with 15.8% coming from virtual reality data on the purchase decision and 38.2% from the preference measurement; see Variants 5 and 6 in Table 4). Adding awareness via third-party information (Equation 3, Table 2) leads to an average accuracy increase across the two studies by 29.8% (see Variant 1 in Table 4), whereas the contribution to forecasting accuracy is lower for the extensions of previous macro-flow models in the information search states (Equation 5, Table 2; average accuracy increase across the two studies by 3.2%; see Variants 2–4 in Table 4).
Impact of Macro-Flow Model Extensions.
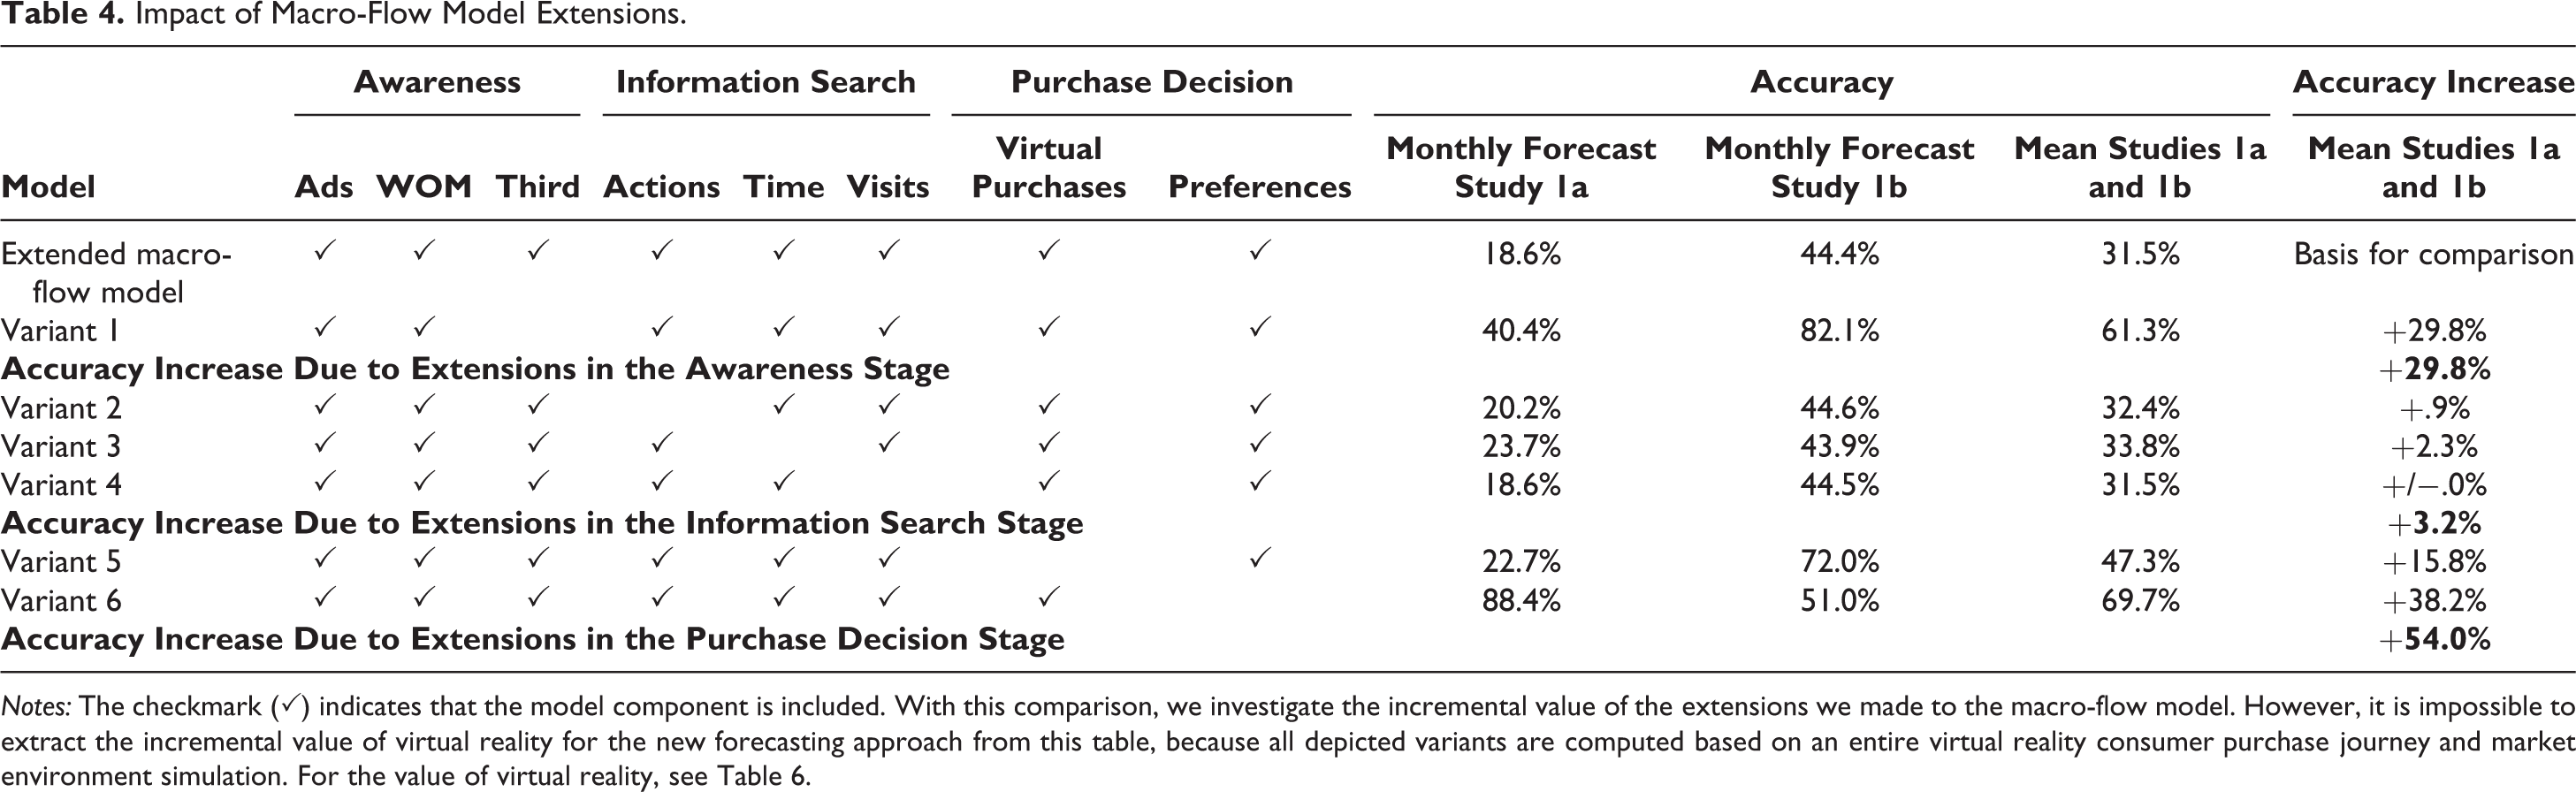
Notes: The checkmark (✓) indicates that the model component is included. With this comparison, we investigate the incremental value of the extensions we made to the macro-flow model. However, it is impossible to extract the incremental value of virtual reality for the new forecasting approach from this table, because all depicted variants are computed based on an entire virtual reality consumer purchase journey and market environment simulation. For the value of virtual reality, see Table 6.
Notably, findings showed that the preferences and the virtual purchases complement one another (Variants 5 and 6 in Table 4). Specifically, although observing a participant’s virtual purchase (i.e., yes/no decision between purchasing vs. not purchasing) may be more representative of their choice, observing a nuanced preference may help incorporate some of the participant’s uncertainty when making this choice. These rationales are also reflected in the results. First, the results reveal the highest forecasting accuracy across Studies 1a and 1b when virtual purchases and preferences are used together, confirming the intuition that combining the approaches allows for leveraging the advantages of both and increases forecasting accuracy (Granger 1989). Second, the results show that while preferences have a higher incremental value in Study 1a (expensive product from a high-involvement product category), the incremental value of including the virtual purchases is higher in Study 1b (lower-cost product from a low-involvement product category). This is in line with studies showing that uncertainty can lead to increased selection of the no-choice option when products are associated with either high involvement or high financial risk (Bloch and Richins 1983; Gunasti and Ross 2009).
Comparison of virtual reality types
Finally, we compared the lab and online virtual realities. To assess whether the differences in the similarity to reality and immersion between the two (Table 1) lead to differences in sales forecasting accuracy, we compared aggregate sales forecasts derived solely on the basis of the lab participants and the online participants. In line with our expectations, the results reveal that in both studies the forecasting accuracy is higher for the lab (vs. online) virtual reality and increases on average by 6%.
Studies 1a and 1b: Individual-Level Results
Individual-level purchases
To offer nuanced insight, we predicted individual purchase behavior within the virtual reality simulation from each participant’s information search behavior and preferences. For this purpose, we used Equations 5 and 6 and an adapted version of Equation 8, without awareness and using only preferences. The results reveal that across both studies, the lab (vs. online) virtual reality condition, on average, predicts participants’ purchase behavior within the simulation 6.5% more accurately. For Study 1b (Study 1a), we correctly predicted the purchase decision of 72.6% (54.1%) of the lab and only 62.4% (51.2%) of the online participants. The percentage of correct predictions is higher in Study 1b because Study 1a covers more products (Study 1b: 10 products; Study 1a: 18 products). In line with these aggregated findings, individual behavior prediction results show that, on average, lab (vs. online) virtual reality participants’ behavior in the simulation was more consistent with actual buyer behavior.
Behavioral consistency
Behavioral consistency refers to the extent to which consumers move through their purchase journey (i.e., from searching information to building preferences and making the purchase decision) in a coherent manner (Smith and Swinyard 1983). We focus on behavioral consistency, because actual purchase behavior for durables tends to be a result of—and therefore, consistent with—consumers’ information search behavior and preferences (Hauser, Urban, and Weinberg 1993; Howard and Sheth 1969; Hu, Du, and Damangir 2014; Lemon and Verhoef 2016). Understanding differences in behavioral consistency between the virtual reality simulation types could therefore provide first insights regarding the drivers of the prediction accuracy differences. More precisely, in integrating insights from research on durable purchasing behavior (Hauser, Urban, and Weinberg 1993; Lemon and Verhoef 2016) and virtual reality in other fields (Cipresso et al. 2018), we expect that lab virtual reality would motivate higher levels of behavioral consistency than online virtual reality—for instance, because it creates high immersion and comprehensive, realistic experiences (Table 1).
To operationalize behavioral consistency, we developed a score reflecting these rationales: we counted the occurrence of consistent behavior throughout the simulation and the preference measurement. The score increases by a count of 1 when consistent behavior occurs (e.g., if a participant assigns a preference to a product that they have previously viewed, or if a participant purchases any product for which they previously assigned a preference). Therefore, the minimum score is 0, indicating no consistent behavior at all (i.e., the participant only assigned preferences to products that they did not view and purchased a product to which they assigned a preference of 0). The maximum consistency score is the number of products plus 1. This maximum score can be reached if a participant assigns a preference to each product, views each product, and purchases one. 4 Confirming our expectations, the results reveal significant differences between lab and online virtual reality for Studies 1a and 1b, with lab participants behaving on average more consistently than online participants (Study 1a: F(1, 303) = 60.45, p = .000; MlabVR = 2.60 vs. MonlineVR = .93; Study 1b: F(1, 323) = 27.82, p = .000, MlabVR = 2.08 vs. MonlineVR = 1.33).
RQ2: Why Do Virtual Reality Simulations (vs. Traditional Studio Tests with Real Products) Lead to Advantages in Forecasting?
Approach
The results of Studies 1a and 1b show highly beneficial consequences of using virtual reality technologies for prelaunch sales forecasting. Moreover, the comparison between lab and online virtual reality participants hints at increased behavioral consistency between information search, preferences, and virtual reality buying behavior as a reason behind their superior forecasting performance. However, the two field studies can neither disentangle the underlying mechanisms of these benefits nor conclusively quantify the specific contribution of using virtual reality for forecasting accuracy. To address this void, we conducted Study 2 to examine why virtual reality simulations lead to forecasting advantages by comparing a lab versus an online virtual reality purchase journey simulation versus a traditional studio test with real products (RQ2). Finally, we use Study 2 data and results to approximate the impact of virtual reality within the new prelaunch sales forecasting approach.
Virtual Reality Mechanisms
Prior work in other contexts provides several clues why virtual reality might lead to advantages compared with previous visualization approaches. We organize these clues into two theoretical perspectives: presence and vividness. In addition, we consider alternative lenses (i.e., convenience and decision uncertainty), which we explain in the “Results” section. The focus on presence and vividness is in line with our conceptualization of virtual reality for prelaunch sales forecasting (Table 1). We argue that both lab and online virtual realities differ from traditional studio tests with real products in terms of simulation scope, similarity to reality, and immersion, whereas lab and online virtual realities differ only in their similarity to reality and immersion.
Presence perspective
“Presence” refers to the phenomenon of the participant feeling as if they are actually in the simulation (Bowman and McMahan 2007). Consequently, presence has an internal component (i.e., immersion—the degree to which senses are stimulated via interactions with the simulation) and an external component (i.e., realism of environment—the resemblance of the simulated environment of a real environment) (Baños et al. 2000; Cipresso et al. 2018; Lurie and Mason 2007; Roggeveen et al. 2015).
Studies indicate that virtual reality may enhance consumers’ presence. For instance, virtual reality simulations provide visual connections and realistic experiences (Grewal et al. 2020) or dynamic presentation formats that create feelings that the user is actually experiencing the product (Roggeveen et al. 2015). We therefore expect that lab and online virtual reality (vs. a traditional studio test with real products) leads to advantages in prelaunch sales forecasting. In addition, because lab virtual reality uses additional equipment that may facilitate both participant immersion and an environment that further resembles an actual environment (Table 1), we expect that individuals in a lab (vs. online) virtual reality would experience higher presence. Owing to higher presence, consumers would better imagine the simulated situation and thus behave in virtual reality much as they would in the real world (Cipresso et al. 2018; Morales, Amir, and Lee 2017).
Vividness perspective
Vividness denotes the extent to which consumers feel that a simulation is lively and detailed as well as easy to imagine and remember (Keller and Block 1997). According to vividness theory (Nisbett and Ross 1980), lively simulations enhance consumers’ imagination, which reduces the perceived effort to process the displayed information (Lurie and Mason 2007) and increases their involvement (Grewal et al. 2020).
In addition, studies show that interacting with a virtual object increases vividness and produces more images in the participant’s mind than static pictures or text (Schlosser 2006). Building on these insights, we expect that virtual reality simulations (vs. traditional studio tests with real products) will elicit higher vividness, which manifests in more consistent and realistic behavior. Because both virtual reality types can generate a very high simulation scope, we do not expect differences in vividness between them (Table 1).
Study 2: Aim, Design, and Measures
Study 2 is a between-subjects experiment (n = 210) in which we compare a purchase journey simulation between lab virtual reality, online virtual reality, and a studio test with real products. We randomly assigned participants to one of the three conditions, resulting in 70 participants per condition. All three groups were asked to assess the same ten gardening tools in the simulated local retail store as presented in Study 1b, which was a do-it-yourself (DIY) store selling hardware and tools for home improvement (for the lab and online virtual reality visuals, see Figure 1). The choice to use an excerpt from Study 1b is in line with our goal for Study 2 to be comparable to Studies 1a and 1b but to offer more control.
All information on the products was identical between the three conditions. However, in contrast to the virtual reality conditions with an entire DIY store with the ten gardening tools (very high scope of the simulation), participants in the studio test saw only a shelf with all ten gardening tools (i.e., medium simulation scope). This more focused visualization follows state-of-the art market research practice emphasizing the need for a focused, but realistic, depiction of the new product and its key competitors on a shelf as they would be in-store, but within a neutral and quiet environment to avoid any distraction. Compared with virtual reality simulations with 360-degree depictions of the environments and products, standing in front of a shelf with real products may create only partial similarity to reality. Moreover, the studio test is likely to create medium immersion, as it only stimulates senses with regard to product interactions (vs. stimulating senses with regard to product and environment interactions). Yet, in all three groups, participants could interact with the products and the shelf in a similar manner: they walked to the shelf, could pick up any of the ten products from the shelf as often as they liked, hold each one for as long as they liked, turn it to assess it from 360 degrees, return it to the shelf, or put it in their shopping basket for purchase. As in Studies 1a and 1b, participants could decide whether to assess all of the products or only some of them.
Before the simulation, participants were asked questions regarding demographics and general characteristics. Afterward, we conducted a preference measurement and a survey asking for participants’ assessment of the products and the simulation. Using confirmatory factor analysis, we assessed reliability and validity for each measure. Overall, the scales exhibit sufficient psychometric properties: for all constructs, the values for item reliabilities, composite reliability, and average variance extracted surpass the recommended thresholds (Bagozzi and Yi 2012; Hu and Bentler 1995). Moreover, the analysis of Fornell and Larcker’s (1981) criterion indicates that discriminant validity exists for all constructs. Table 5 provides an overview of the variables and their measurement.
Study 2: Overview of Variables.
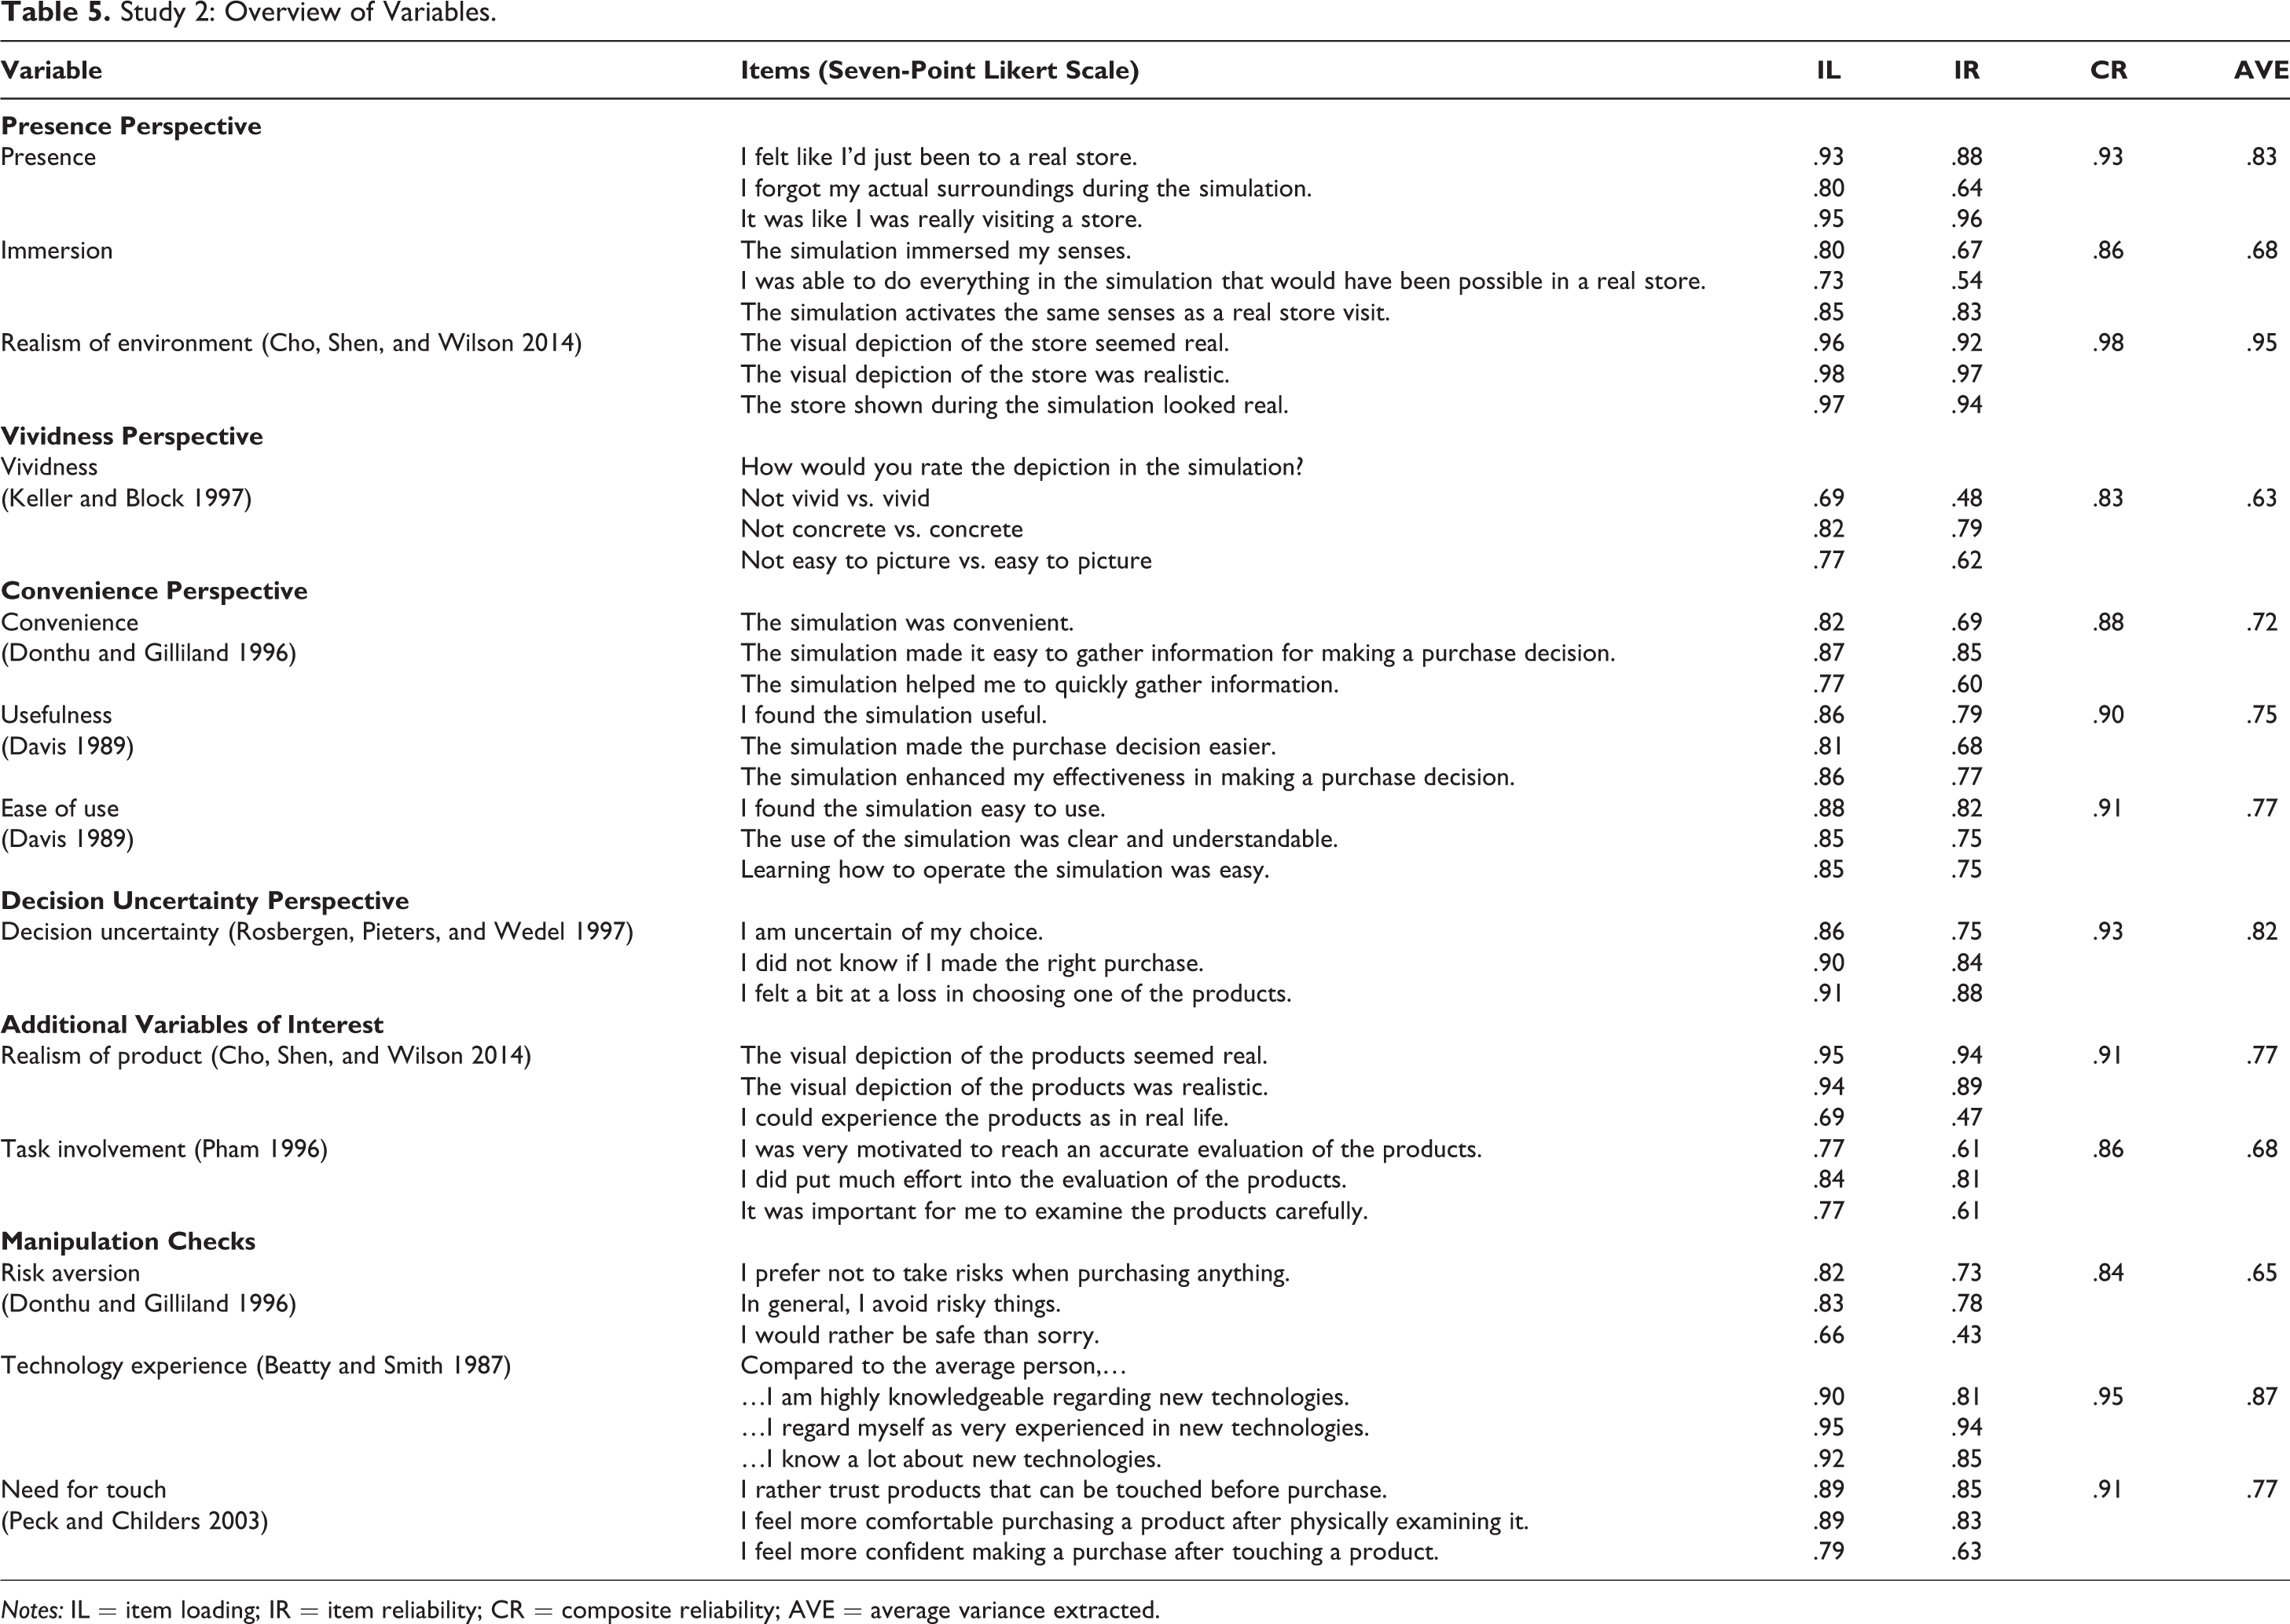
Notes: IL = item loading; IR = item reliability; CR = composite reliability; AVE = average variance extracted.
Study 2: Analyses and Results
Overview and manipulation checks
We used analysis of variance (ANOVA) to analyze the data obtained from the controlled laboratory experiment and summarize the results in Figure 4, Panels A–I. The findings reveal that the randomization of participants worked, as the groups did not differ with respect to gender (F(2, 207) = .11, p = .894) and other traits, such as risk aversion (F(2, 207) = .04, p = .961), technology experience (F(2, 207) = 1.05, p = .350), and need for touch (F(2, 207) = 1.40, p = .248).
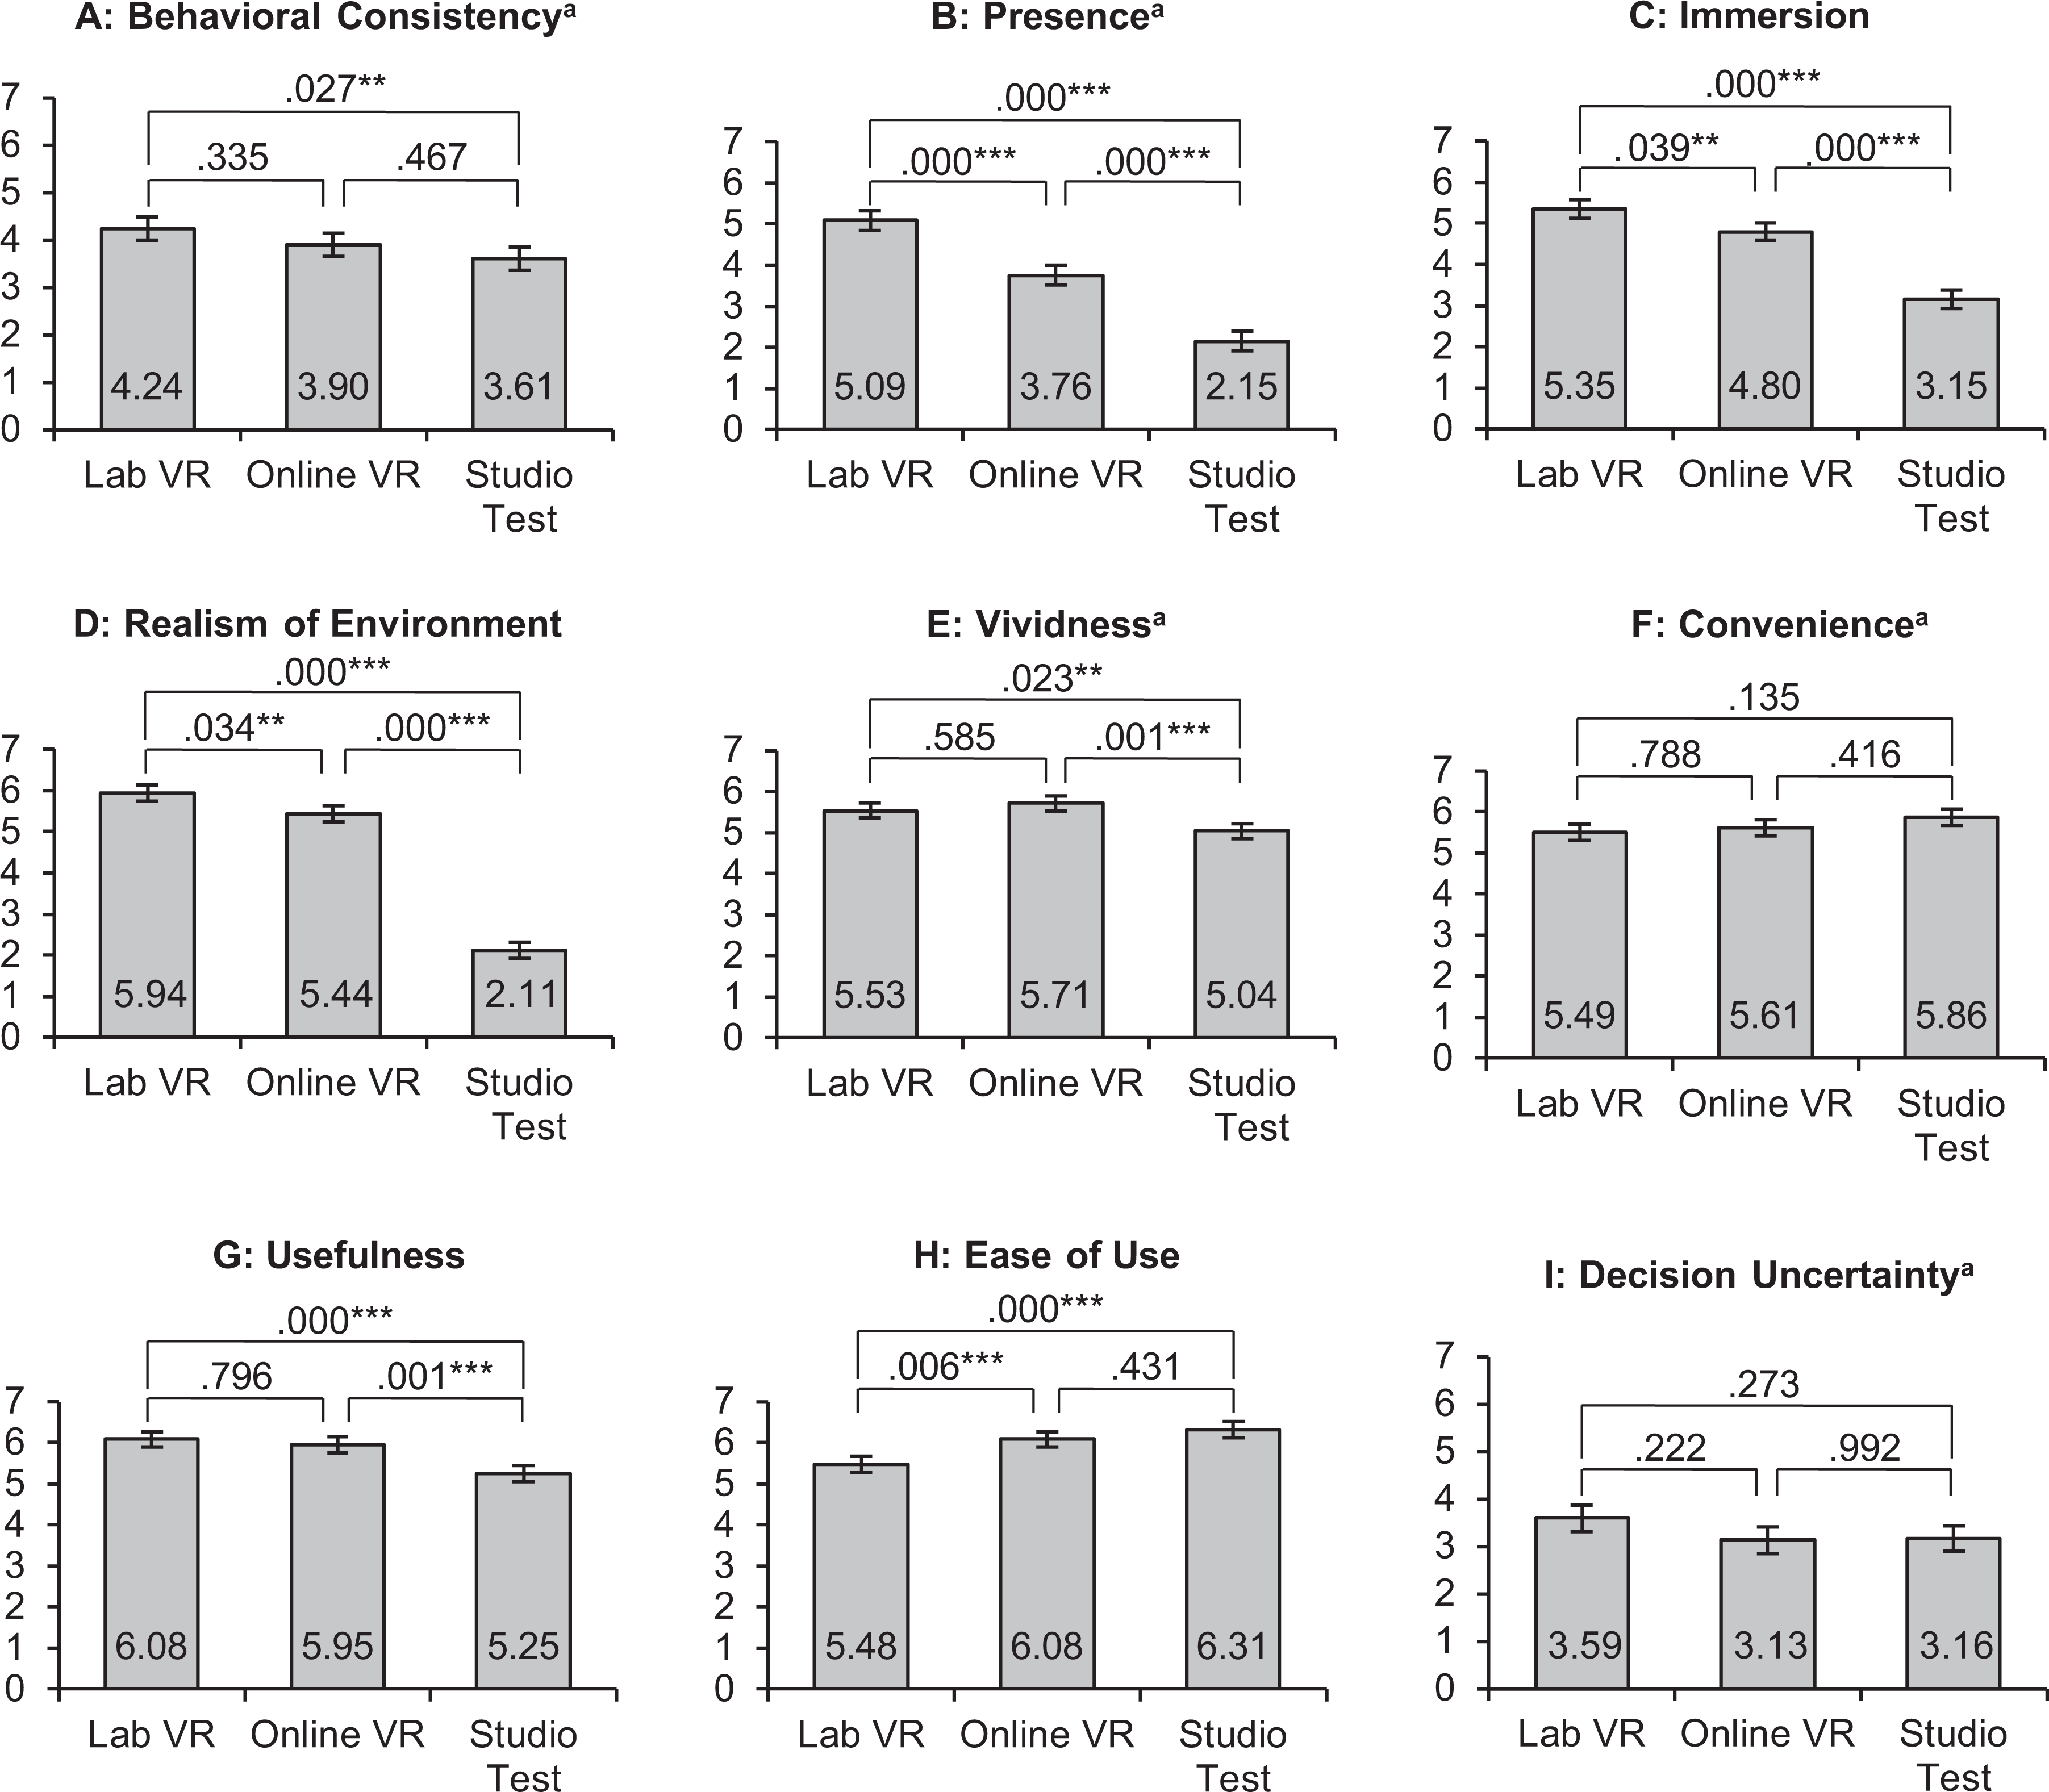
Study 2: ANOVA results for virtual reality mechanisms.
Behavioral consistency
Building on Studies 1a and 1b, using the individual-level information search, preference, and purchase behavior data from virtual reality, we assessed behavioral consistency. The results reveal significant differences in behavioral consistency between virtual reality and non–virtual reality participants (Figure 4, Panel A). Specifically, confirming the results of Studies 1a and 1b, we find that behavioral consistency is highest for the lab virtual reality, followed by online virtual reality and the studio test. Therefore, in line with our expectations, virtual reality participants show behaviors in the simulation that are closer to actual consumer behavior than studio test participants.
Presence and vividness
The ANOVA results provide support for the presence and vividness perspectives (Figure 4, Panels B and E). The findings show great differences between the groups for the direct measures of presence and vividness. The findings also show significant group differences for the constructs associated with the presence perspective (Figure 4, Panels C and D): immersion and realism of the environment. 5 Overall, the results confirm the rationales for why the virtual reality advantage occurs: lab virtual realities, due to the additional equipment use, generate higher presence than online virtual realities, whereas both virtual realities have advantages over a traditional studio test due to their higher presence and vividness.
Alternative theoretical perspectives
As Table 5 shows, we measured further constructs to rule out alternative explanations. For example, research on virtual reality suggests that it may facilitate consumers’ convenience (i.e., the extent to which consumers perceive the simulation as easy to use and useful) by expediting their access to relevant decision parameters or enhancing the possibilities to explore the products relative to visualization modes not relying on new technologies (Grewal et al. 2020; Heller et al. 2019; Lurie and Mason 2007). Moreover, virtual reality simulations could reduce participants’ decision uncertainty (i.e., the extent of difficulty in making a purchase decision) by collecting more information and better integrating information than visualization modes that do not use virtual reality (Bhagwatar, Massey, and Dennis 2018; Lurie and Mason 2007). However, the complexity of a virtual reality simulation, as well as usage troubles (e.g., dizziness, fatigue), could diminish potential convenience and decision uncertainty reduction advantages (Munafo, Diedrick, and Stoffregen 2017). In line with these rationales, the results do not reveal differences in the direct measures of decision uncertainty (Figure 4, Panel I) and convenience (Figure 4, Panel F), or for constructs associated with convenience (Figure 4, Panels G and H).
Additional variables of interest
To ensure that the virtual product representations in the lab and online virtual realities were displayed adequately, we assessed product realism (i.e., the extent to which the depicted product resembles the real product). We expected no differences, as the virtual product representations were created from 360-degree pictures taken of the actual products. The results confirm these expectations and show that the physical and virtual products are adequate benchmarks (F(2, 207) = .60, p = .550; MlabVR = 5.03 vs. MonlineVR = 4.90 vs. Mstudio test = 5.14). In addition, the results on task involvement (i.e., the extent to which participants were focused on the experimental task at hand) show no significant differences between the groups (F(2, 207) = 1.09, p = .338; MlabVR = 5.84 vs. MonlineVR = 5.61 vs. Mstudio test = 5.62).
Supplemental Analysis: Assessment of Virtual Reality Advantages in Sales Forecasting
Studies 1a and 1b reveal beneficial consequences of using virtual reality technologies for prelaunch sales forecasting. Study 2 offers suggestive evidence why these benefits occurred. However, due to the absence of a non–virtual reality control condition in Studies 1a and 1b and the more focused design of Study 2 (i.e., virtual reality mechanisms), we still cannot conclusively disentangle how much of the observed forecasting advantage can be attributed to virtual reality. To approximate this, we jointly used the results from Studies 1b and 2: Although Study 2 has a smaller scope and does not completely replicate the simulation of Study 1b, both studies are comparable because they include the identical DIY store simulation. We conducted the approximation in two steps.
First, we approximated the total effect of using (vs. not using) virtual reality for prelaunch sales forecasting. To do so, we built an artificial, non–virtual reality control condition for Study 1b in leveraging the non–virtual reality control condition of Study 2 (i.e., studio test using real products): we screened Study 2 data for differences between the virtual reality and non–virtual reality conditions in metrics that serve as inputs for forecasting. This screening revealed that while the preferences for the focal new durable product were highly similar across studies for the lab and online virtual reality participants, these preferences were 1.2 times higher for non–virtual reality participants. To account for this difference, we multiplied the preferences of Study 1b participants by 1.2 to create the artificial, non–virtual reality control condition. Using this control condition, we then calculated another sales forecast for Study 1b (Modification 1 in Table 6), which uses neither virtual reality data (i.e., no actions, time, or visits in the information search stage and no virtual purchases in the purchase decision stage) nor virtual reality for the visualization of the purchase journey (i.e., because participants’ preferences were adjusted; see previous step). Comparing the Modification 1 forecast with the Study 1b forecast indicates that the usage of virtual reality accounts for an accuracy increase of roughly 50%–70% (Table 6).
Approximation of Virtual Reality
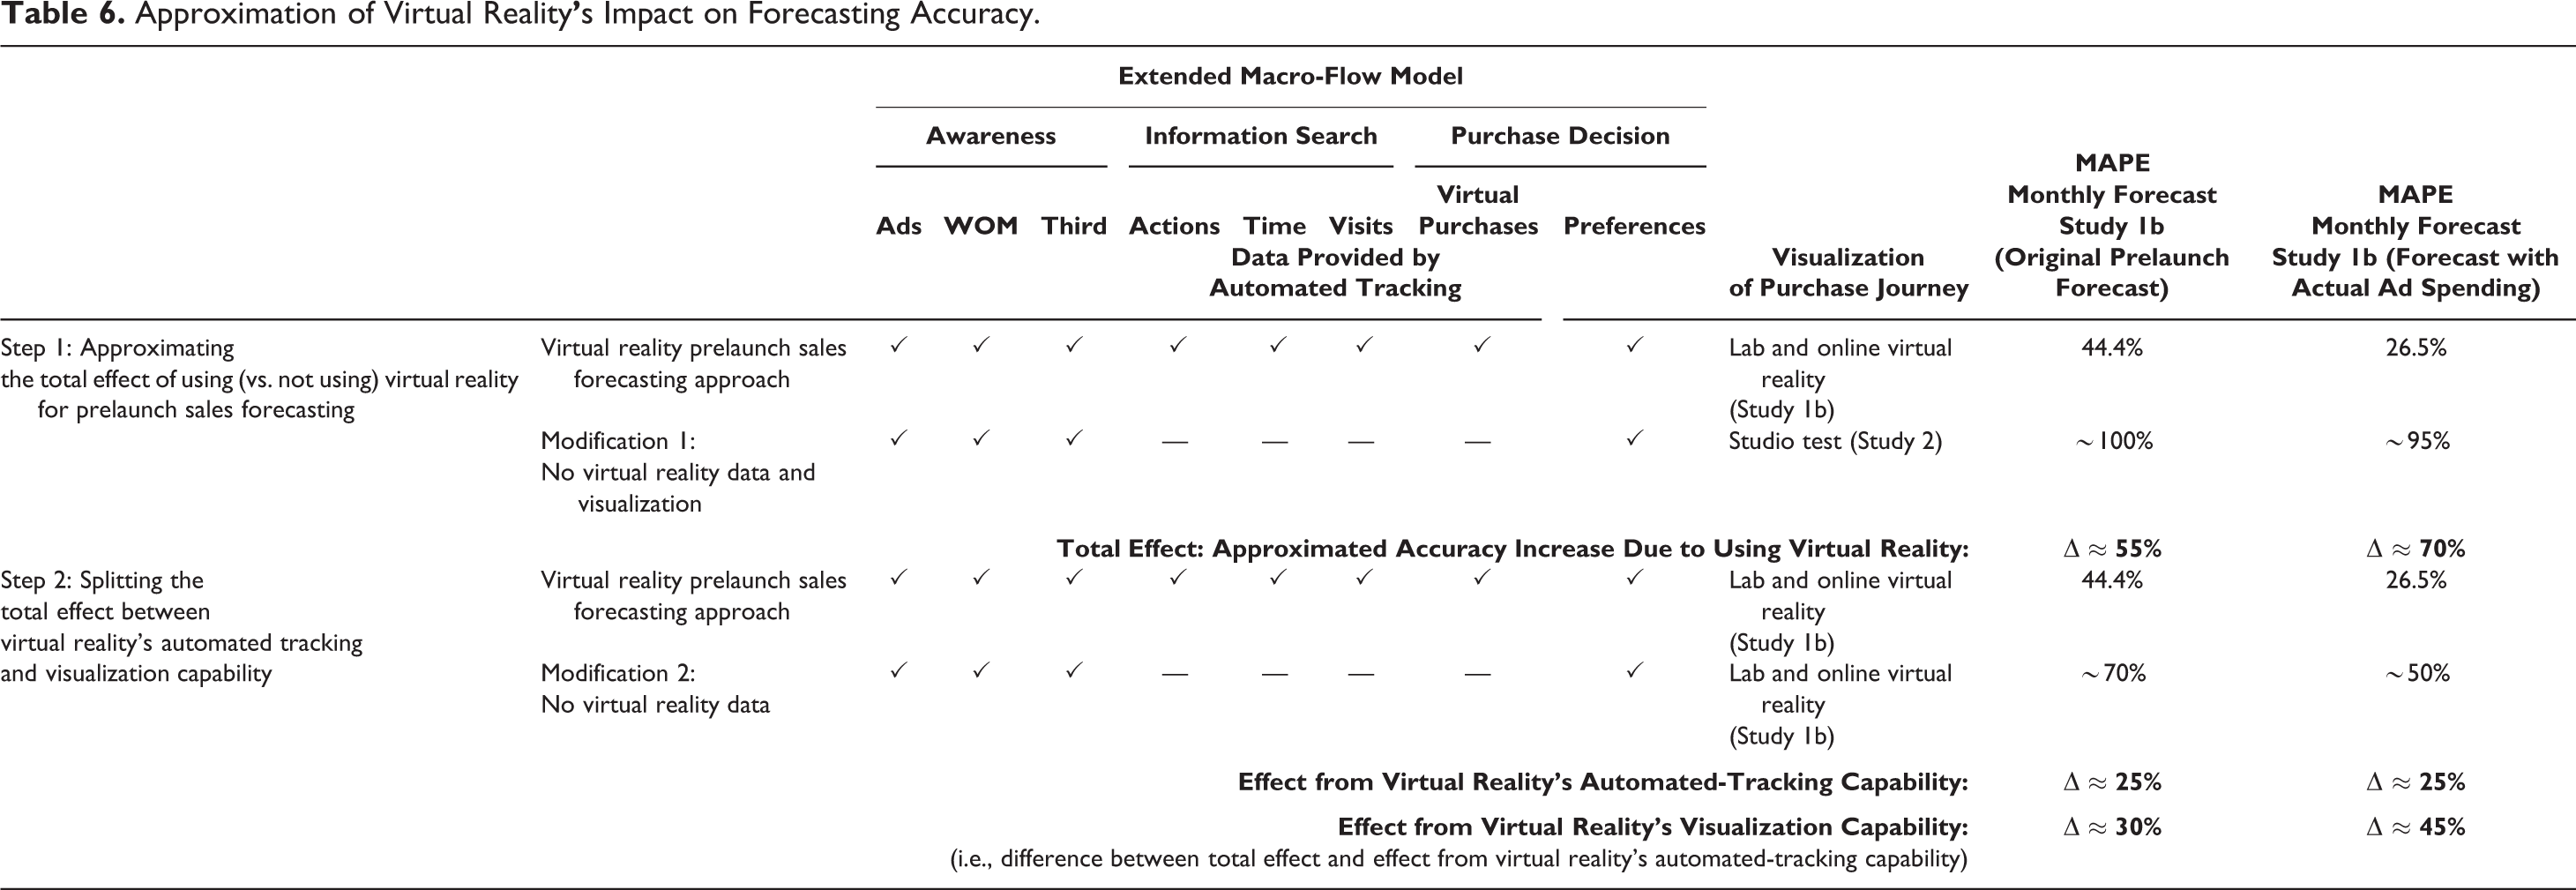
Second, we split the total effect between virtual reality’s automated-tracking and visualization capability. To do so, we calculated one more sales forecast (Modification 2 in Table 6) that contains virtual reality for the visualization of the purchase journey (i.e., by using original preferences of Study 1b participants) but does not include any virtual reality data (i.e., no data on actions, time, or visits during information search and no virtual purchases). Thus, comparing this modification with the original sales forecast of Study 1b provides insights on the contribution of virtual reality’s automated-tracking capability, which is roughly 25%. Next, to isolate the contribution of virtual reality’s visualization capability, we jointly interpreted the results of Modifications 1 and 2. The joint interpretation is necessary because it is impossible to calculate a sales forecast using data tracked in virtual reality without having a visualization in virtual reality. Findings indicate that virtual reality’s visualization capability accounts for a forecasting accuracy of roughly 30%–45% in Study 1b (Table 6). Thus, the impact of virtual reality’s visualization capability seems to be higher than its automated-tracking capability. However, due to the artificial nature of the non–virtual reality condition, we still cannot conclusively disentangle the exact impact of virtual reality.
Discussion
Summary of Key Findings
The results of Study 1a (kitchen appliance) and Study 1b (gardening tool) show that our new virtual reality sales forecasting approach yields highly accurate predictions. Moreover, these results indicate that these benefits occurred because lab virtual reality motivated, on average, consistent and realistic consumer behavior, whereas these metrics were at a lower level for online virtual reality. To provide further insight, in Study 2 we compared the two virtual reality types with a studio test with real products. The findings confirm that lab virtual reality simulations motivated more consistent consumer behavior than online virtual reality, and that virtual reality creates superior behavioral consistency compared with the studio test. Moreover, the findings indicate that these effects are due to advantages that virtual reality creates in terms of presence and vividness, not alternative theoretical explanations, such as convenience and decision uncertainty. Using Study 2 and Study 1b findings jointly allowed us to approximate that the forecasting advantage attributed to virtual reality is likely to range between 50% and 70% (Table 6).
Theoretical Contributions and Future Research Directions
This investigation yields results that advance prior work in several ways. First, researchers have developed forecasting models for new durables that are applied close to launch (Goodwin, Meeran, and Dyussekeneva 2014). We advance the literature by conceptualizing and testing a novel virtual reality sales forecasting approach that can also be applied in earlier NPD stages because firms do not need a fully developed product but only a virtual blueprint, which serves as input for the programming of the virtual reality simulation. This flexible application of the new approach is an important advancement, because in earlier NPD stages, investments in a new product are relatively small compared with investments in later stages (Markovitch et al. 2015). Future work could build on these insights and investigate important extensions. For example, in both field studies, our collaborating partners were able to categorize the products, anticipate the time until launch, as well as the market environment at launch. However, because for some innovations and at very early stages of NPD the categorization of a new durable may be difficult (Web Appendix W6), future investigators could develop more precise solutions that help anticipate the future market environment or simulate the exact time until launch.
Second, in developing the new virtual reality forecasting approach, we extended previous macro-flow models in three ways. We added new behavioral states (e.g., aware by third-party information, extensive and flexible information search); we introduced new equations for calculating the flows (e.g., Equation 5 in Table 2) and new determinants of the flows (e.g., behavioral data from virtual reality). Through these amendments, the extended macro-flow model covers the purchase journey comprehensively and realistically. It is therefore likely to be more generally applicable, as in our two field studies with two very different durables, than previous macro-flow models that focused on one particular industry (e.g., automotive in Urban, Hauser, and Roberts [1990]). Future work could build on these insights and examine how macro-flow models as well as the virtual reality simulations need to be adapted to adequately predict buyer behavior for other types of products or markets and therefore extend the external validity of the new forecasting approach. For example, if the product’s value is low (and buyers are not very systematic in their behavior), how should behavioral data and preference measurement data be combined for the purchase decision stage (Equation 7, Table 2)? If the innovation is a service, are there additional determinants that need to be included in the information search stage (Equation 5, Table 2) to account for the service’s individuality? How should competing services be depicted in virtual reality? Finally, if the new product is sold in a business-to-business market with different members involved in the decision making, should they jointly use the virtual reality simulation? How should their data be aggregated to predict the buying center purchase decision (Equation 8, Table 2)?
Third, researchers have focused on developing and testing prelaunch sales forecasting approaches (Urban, Hauser, and Roberts 1990; Urban et al. 1997). We advance the literature by providing additional insights into why forecasting advantages occur. In doing so, the findings also expand the knowledge on the mechanisms of virtual reality. However, while we show across two large-scale field studies that the two key features we add—virtual reality and macro-flow model extensions—substantially improve the forecasting accuracy, we cannot conclusively assess how much of the accuracy increase is due to virtual reality. Thus, we encourage future studies on virtual reality sales forecasting to include a non–virtual reality control condition and to more directly isolate the impact of virtual reality and the contributions by each of its mechanisms.
Finally, we offer the first systematic marketing study of virtual reality in NPD. Future work should build on these insights to further examine how firms can use virtual reality to advance their capabilities. For example, as Day (1994) has shown, firms’ marketing capabilities fall into two main categories: customer linking and market sensing. While we leverage virtual reality for an improved market sensing in terms of highly accurate prognoses, future work could focus on how to use virtual reality to improve the market sensing related to diagnostics (e.g., by studying consumer heterogeneity or idiosyncratic purchase journeys, testing marketing materials, or optimizing the marketing mix) and customer-linking purposes (e.g., by integrating this knowledge into new products, offering remote services or trainings).
Managerial Implications
Our study contains actionable implications that fall into three categories: (1) application fields of virtual reality for NPD, (2) visualization mode selection, and (3) guidance for implementing virtual reality for NPD. These implications are derived from our field studies (Studies 1a and 1b), the controlled laboratory experiment (Study 2), and several in-depth interviews that we conducted with senior managers of leading durable producers.
Application fields
Despite the increasing interest in virtual reality, the in-depth interviews revealed that many companies remain reluctant to use virtual reality as a matter of routine, given, for instance, the complexity and costs of programming virtual reality environments. Moreover, the interviews surfaced that companies experience challenges when implementing virtual reality in NPD due to a lack of knowledge within the company and that effective use cases for this technology remain scarce. We identified prelaunch sales forecasting as a promising application field for virtual reality. Furthermore, the interviews hinted at additional applications for virtual reality in NPD associated with its superior visualization capability, as a senior manager of a global technology company pointed out: Virtual reality is a great tool to showcase products, objects and entire worlds. We can depict those products, objects and worlds in a realistic manner, show them to other people and especially make our products more easily understandable. This is something very valuable during new product development. To make our innovation process more agile, we recently experimented with virtual prototypes and compared the results to actual prototype testing. Stunningly, we did not find any differences in diagnostic information between the two!
6
Visualization mode selection
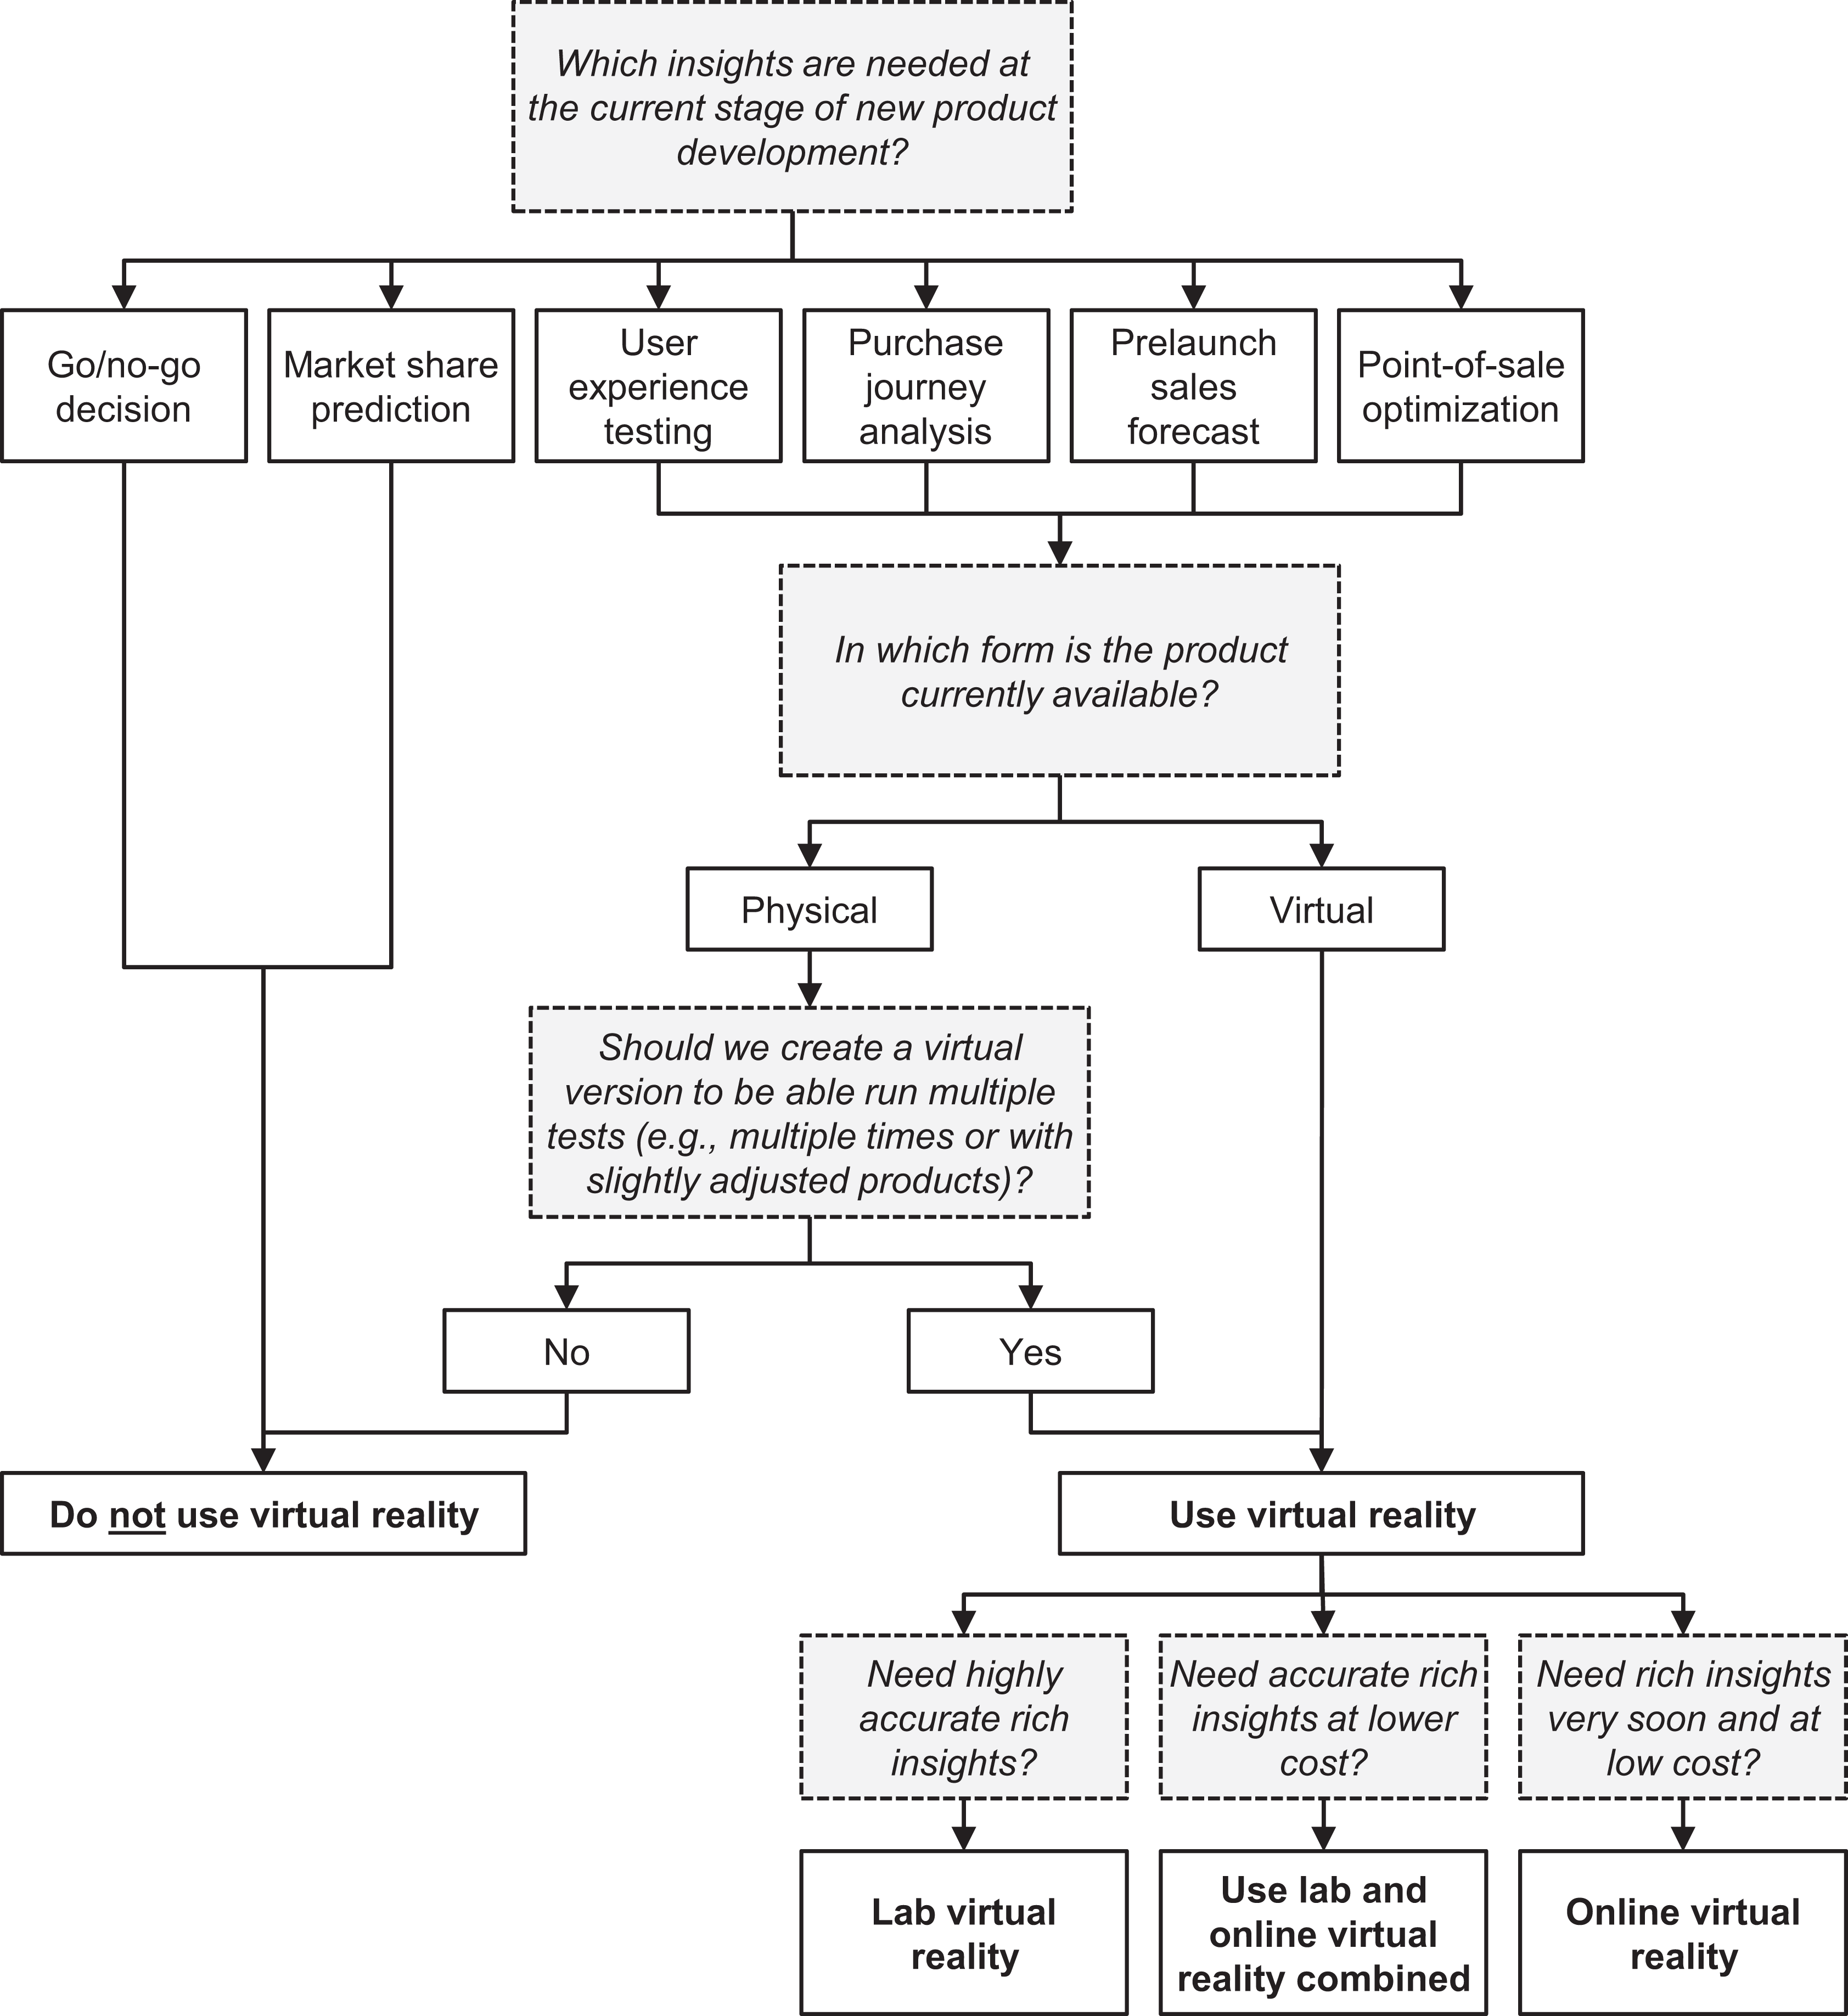
The results show that virtual reality can reap large benefits, such as more flexible use throughout NPD or more accurate prognoses. However, the results also reveal some limitations of virtual reality: it can be expensive and have some use constraints when testing haptics (Cipresso et al. 2018; Munafo, Diedrick, and Stoffregen 2017). We therefore present specific guidelines for managers on how to choose between lab virtual reality and online virtual reality, as well as when to eschew virtual reality (Figure 5).
Guidance for managers on when to utilize virtual reality in NPD.
First, in weighing the costs and benefits of virtual reality, we recommend that managers use virtual reality simulations to improve NPD decisions that require early, detailed, and precise consumer information (i.e., user experience testing, purchase journey analyses, prelaunch sales forecasting, and point-of-sale optimization). Moreover, we suggest that the business case for using virtual reality is especially strong if a new durable is expensive, is highly innovative, or requires considerable explanation. We make this recommendation because findings reveal that using virtual reality results in realistic consumer behavior even for these products, whereas prior work has shown that accurately predicting sales for such products is hardly possible with traditional methods (Hoeffler 2003).
Second, we suggest that managers carefully choose between lab and online virtual reality as the visualization mode. Managers should choose lab virtual reality if highly accurate consumer insights are required, because our findings reveal that lab virtual reality generates significantly higher presence, which manifests in more consistent behavior. In contrast, managers should use online virtual realities when cost constraints are high, data gathering needs to be conducted promptly, and large samples are required. If companies require scalability and very detailed and realistic insights, they can combine online and lab virtual realities (Figure 5). Finally, managers should refrain from using virtual reality when they only need high-level insights. For example, if they need to make general go/no-go decisions or long-term market share predictions, virtual reality simulations may be too expensive and traditional market research methods, such as purchase intention surveys or conjoint analysis, are likely to have a superior cost–benefit ratio. In addition, when testing haptics, traditional studio tests with physical prototypes may lead to better diagnostic information as simulating haptics in virtual reality is difficult (Cipresso et al. 2018).
Guidance for implementing virtual reality for NPD
We have two recommendations for managers interested in implementing virtual reality in their firms’ NPD. We recommend clearly defining the aims of using virtual reality and specifying a clear and comprehensive implementation plan to ensure focus throughout the project (Web Appendix W8). Our experience from working with and interviewing durable producers on new virtual reality use cases reveals that many companies get very excited about this technology, sometimes resulting in unrealistic expectations regarding simulation scope and length. To avoid overburdening of the virtual reality simulations, we recommend refraining from “all-in-one-solutions” and aim for one tool for one purpose (e.g., forecasting, prototype testing). Using virtual reality several times during NPD creates synergies because programming of virtual prototypes or environments can be slightly adjusted to different tests and contexts.
Supplemental Material
Supplemental Material, sj-pdf-1-jmx-10.1177_00222429211014902 - Virtual Reality in New Product Development: Insights from Pre-launch Sales Forecasting for Durables
Supplemental Material, sj-pdf-1-jmx-10.1177_00222429211014902 for Virtual Reality in New Product Development: Insights from Pre-launch Sales Forecasting for Durables by Nathalie Harz, Sebastian Hohenberg and Christian Homburg in Journal of Marketing
Footnotes
Acknowledgments
The authors thank the JM review team for their insightful suggestions during the review process, which improved this article considerably. They would also like to thank Andrew Gershoff, Vijay Mahajan, Leigh McAlister, Robin Ruhnau, Marcus Theel, Arnd Vomberg, and Adrian Ward for their valuable feedback on previous versions of the manuscript. The paper further benefited from thoughtful comments made by attendees at the presentation of this work at the 2019 EMAC Conference (Hamburg) and the 2019 AMA Winter Academic Conference (Austin, TX). Finally, the authors would like to thank GfK and the two anonymous firms for cooperating in this paper’s studies.
Associate Editor
Jacob Goldenberg
Declaration of Conflicting Interests
The author(s) declared no potential conflicts of interest with respect to the research, authorship, and/or publication of this article.
Funding
The author(s) received no financial support for the research, authorship, and/or publication of this article.
Notes
References
Supplementary Material
Please find the following supplemental material available below.
For Open Access articles published under a Creative Commons License, all supplemental material carries the same license as the article it is associated with.
For non-Open Access articles published, all supplemental material carries a non-exclusive license, and permission requests for re-use of supplemental material or any part of supplemental material shall be sent directly to the copyright owner as specified in the copyright notice associated with the article.