
Abstract
In most general education classrooms in Germany, students with and without special educational needs are taught together. To support teachers in adapting instruction to these heterogeneous classrooms, we have developed learning progress assessment (LPA) and reading instructional materials, the Reading Sportsman (RS), in line with the theoretical framework of data-based decision-making, which has led to beneficial effects in several studies. However, data from these studies have not been analyzed to examine effects for low-performing readers. Data within and across six quasi-experimental studies conducted by our team in Grades 2 to 4 were reanalyzed to examine the effects of LPA on students whose reading fluency scores were at or below the 25th percentile (n = 1,346 students from 264 classes). In each study, students had been assigned to a control group (with business-as-usual instruction), an LPA group only, or an LPA-RS group (i.e., with teachers provided with LPA and the RS). Separate multilevel regression results were integrated by means of meta-analytical methods to investigate the consistency of results. Overall, findings from the single studies indicated no positive effects of LPA with or without the RS compared with the control group. The integrated analyses showed small positive effect trends on reading fluency and intrinsic reading motivation.
Keywords
For teachers, adapting instruction to students’ needs is a daily challenge, and this challenge increases when students in the same class show large interindividual differences, necessitating differentiated instruction (Mullis et al., 2017). Such situations are common in Germany because ratification of the Convention on the Rights of Persons with Disabilities by the UN has resulted in many students who were previously taught in special education classes now attending general education classes. Results from the latest Progress in International Reading Literacy Study (PIRLS) indicate that the large achievement gap between high- and low-performing students in Germany has widened further (Mullis et al., 2017). Moreover, the number of fourth graders in Germany with only basic reading skills has nearly doubled since 2001 and is exceeded by only four European countries. In light of the undeniable importance of reading skills for participating in the information society of the 21st century, and the increasing number of students for whom learning to read is challenging, teachers in general education must pay special attention to low-performing students who may suffer from a reading or learning disability (LD). This is especially true in countries such as Germany, where students with or at-risk for LDs are not routinely identified or provided specialized instruction within schools. The responsibility for meeting the needs of these students lies primarily with the classroom teacher, with support from specialists occurring only rarely and on an unsystematic basis (Tarelli et al., 2012).
Over the past several years, our research team has examined the extent to which data-based decision-making (DBDM; Ikemoto & Marsh, 2007; Mandinach, 2012) can help classroom teachers manage the large within-class heterogeneity of students in general education classrooms. As a reliable basis for DBDM, we equipped teachers of Grades 2 to 4 with a tool for learning progress assessment (LPA) in reading (Souvignier et al., 2021), either alone or with Reading Sportsman (RS) reading instructional materials, that were peer-mediated and designed to enhance differentiation of instruction. Results revealed that implementation of LPA both with and without teachers’ additional use of the RS resulted in improvements in the reading performance of students as a whole (Förster et al., 2018; Förster & Souvignier, 2014a, 2015). Unfortunately, these studies did not isolate effects for the most vulnerable students, that is, students who were struggling to acquire adequate reading skills. Examination of effects for this group of students is essential because research has revealed mixed results on the effects of differentiated instruction on low-performing students. For instance, Gersten et al. (2009) found little evidence for the effectiveness of providing differentiated instruction for struggling readers. Furthermore, D. Fuchs et al. (2010) observed that systematic differentiation was only rarely fully realized in general education classrooms, and that low-performing students often were not adequately supported (c.f., Pressley et al., 2001). However, Coyne et al. (2018) found that students who experienced reading difficulties benefited more from an intervention that enabled differentiating instruction compared with general classroom instruction. In their comprehensive literature review, Gersten et al. (2017) found that small group-differentiated reading interventions have a positive impact on reading fluency and reading comprehension. Given these mixed findings, we deemed it worthwhile to reexamine data from our previous studies to determine effects for low-performing readers. Before describing these studies in more detail, we discuss the theoretical framework underlying the use of DBDM as an approach for differentiating instruction in general education classrooms.
DBDM
Data-based decision making provides a general theoretical framework for providing teachers with an approach to successfully manage the large heterogeneity of student reading ability and to adapt instruction to students’ needs. This process is defined as repeated systematic collection and analysis of data (also to monitor and evaluate instruction effects) that are used to guide a range of (instructional) decisions to help improve the success of students and schools (L. S. Fuchs, 2004; Ikemoto & Marsh, 2007).
Highlighting the potential of this framework, Keuning et al. (2019) found that primary school teachers who were trained in DBDM effected higher mathematics and spelling skills for their students than teachers who were not trained in DBDM. Similarly, Carlson et al. (2011) found that extensive teacher training on the interpretation and use of data led to higher student achievement in mathematics and showed a positive effect trend on reading. At the same time, research also has highlighted that DBDM can be challenging for teachers, as it requires them to repeatedly assess and document student data (Mandinach, 2012), to correctly interpret (graphed) data (Espin et al., 2017), and to make instructional adjustments based on data (Förster et al., 2018; D. Fuchs et al., 2010; Stecker et al., 2005). Therefore, providing support for teachers at the different steps of DBDM is necessary (Espin et al., 2017; Kippers et al., 2018). For example, L. S. Fuchs and Vaughn (2012) proposed equipping teachers with both computer-based assessments and support for differentiating instruction. Providing teachers with such supports has been shown across several studies to yield positive effects on student learning (e.g., Förster et al., 2018; Förster & Souvignier, 2015; L. S. Fuchs et al., 1990; Keuning et al., 2019; Staman et al., 2017).
Data Collection for DBDM With LPA
To make timely instructional decisions within DBDM, teachers need assessments of students’ learning progress that are highly feasible and easy to implement with limited resources. Thus, for general education, computer-based approaches have been recommended (Mandinach, 2012). In Germany, the digital platform quop (Souvignier et al., 2021) was developed to provide LPA for general education. In LPA, students complete a series of equivalent tests during the school year at intervals of 3 weeks, and teachers receive information about their students’ progress. While LPA shares important aspects with the curriculum-based measurement (CBM) approach (e.g., repeated measurement of student progress using equivalent tests), single tests within LPA are designed to provide differentiated information about component processes of a respective skill (e.g., reading accuracy, reading fluency, and reading comprehension) to inform instructional decisions (Förster & Souvignier, 2011).
In previous research, teachers have judged the computer-based LPA assessments to be feasible and to provide useful information (Förster & Souvignier, 2015). Moreover, studies have shown that teachers who use LPA effect greater reading growth in their students than teachers who assess reading performance only once at the beginning of the school year. For instance, Förster and Souvignier (2014a) found that the use of LPA resulted in significantly higher reading comprehension compared with a control group (CG; d = .24). A similar effect of LPA occurred in another study using a different reading comprehension measure (d = .18; Förster & Souvignier, 2015). Furthermore, Förster et al. (2018) found that students whose teachers had access to a combination of LPA and RS had a significantly higher achievement in reading fluency compared with a CG (d = .30).
The Challenge of Differentiating Reading Instruction
The positive effects that emerge from providing teachers with progress data on student achievement are mainly ascribed to teachers’ use of data to adapt instruction to students’ needs (Förster et al., 2018; Schildkamp et al., 2019; van Geel et al., 2016). This is in line with findings showing that students’ progress in reading depends on how well instruction matches students’ abilities (Connor et al., 2004), and that reading fluency and reading comprehension instruction have specific effects on the targeted competences (Seuring & Spörer, 2010). It is also in line with research that suggests that there are different subtypes of developing readers, and that each group should receive instruction that is guided by assessment data and tailored to their needs. For instance, Buly and Valencia (2002) identified 10 profiles of students who failed state reading assessments, and Pierce et al. (2007) pointed to four clusters of students who did not read fluently. Both claimed that students in the different profiles or groups should receive assessment-based individualized instruction. In short, students with different reading skills need different reading instruction, and the teacher’s task is to decide who needs what and to realize the differentiation.
Developmental models of reading comprehension (e.g., Perfetti et al., 2005) suggest that the ability to read and understand written text unfolds in sequential steps. Readers need to reach a certain level of word-recognition accuracy before becoming more fluent readers (Karageorgos et al., 2020), and they need to read at a sufficient pace to have enough cognitive capacity to understand what they read (Wolf & Katzir-Cohen, 2001). Reading accuracy, reading fluency, and reading comprehension can efficiently be fostered by different instructional approaches.
Reading accuracy can be effectively promoted by syllable-based reading, which can be employed as a bridge between single-letter recoding and automatic word recognition (Müller et al., 2017; Müller & Richter, 2017). Low-performing readers should be supported in decoding words accurately and quickly, freeing resources to focus on meaning. This can be fostered by (repeatedly) reading aloud, such as via instructional approaches like repeated reading (Samuels, 1979; Therrien, 2004). Once students have become fluent readers, they should be instructed to use reading strategies to increase their reading comprehension (National Institute of Child Health and Human Development, 2000). One example of an evidence-based method that includes teaching and learning reading strategies is reciprocal teaching (Palincsar & Brown, 1984).
Certainly, applying the optimal instructional method for each child in a classroom is challenging for teachers, even if assessment data are available. As early as the 1990s, the research team of Lynn and Douglas Fuchs evaluated different approaches for supporting teachers, including skills analysis (L. S. Fuchs et al., 1990), expert system instructional consultation (L. S. Fuchs et al., 1992), and instructional recommendations (L. S. Fuchs et al., 1994). Recent research in general education has shown that differentiation of instruction can be supported by providing teachers with assessment information and with instructional materials that is evidence based, feasible, and ready to use in entire classes (Förster et al., 2018; Hondrich et al., 2015). In addition, the use of instructional approaches that are (mainly) student centered and do not permanently require instruction or supervision by a teacher seems effective.
DBDM and Student Motivation
Although most research on DBDM has focused on achievement outcomes, DBDM has the potential to also influence students’ motivation. From a theoretical perspective, DBDM might be expected to lead to improvement in students’ reading motivation, as it satisfies basic psychological needs (Ryan & Deci, 2000). For example, seeing one’s own improvement when looking at a progress graph might promote the experience of competence; working together with peers might increase feelings of relatedness; and being involved in decisions about next steps of instruction might satisfy the need for autonomy. However, two studies looking at motivational outcomes associated with student progress monitoring have shown mixed results. Förster and Souvignier (2014a) found that CG students and students whose progress was monitored by their teachers did not differ in their reading motivation, and that students’ reading motivation even decreased when they reflected on their progress. In contrast, Calhoon and Fuchs (2003) found that working with graphs that visualized students’ learning progress in mathematics increased student motivation to work hard.
Purpose and Research Questions
In sum, research has supported the use of DBDM as a method for differentiating instruction in general education classrooms, but effects of differentiation on low-performing students have been mixed. In our own research, we have found that LPA can assist general education teachers in differentiating classroom reading instruction. Results of this research have shown that teachers’ use of LPA leads to improved reading performance for students as a whole; however, effects for low-performing readers have not been isolated. Given the doubts raised about the effectiveness of differentiation for low-performing students, examination of the specific effects of LPA for low-performing readers is in order.
This study represents a meta-analytic reanalysis of data across previous studies conducted to examine the effects of LPA on student reading performance. The specific aim of the reanalysis is to isolate effects of LPA with and without material-based support on the performance of students who struggle in reading. To achieve this aim, we analyzed data both within and across six similarly designed LPA intervention studies that our team had conducted to increase our sample size, and to obtain cumulative evidence as well as a reliable estimation of the overall effects for low-performing readers.
Our specific purpose was to examine whether equipping teachers with a computerized LPA tool positively affected the reading fluency, reading comprehension, and reading motivation of low-performing readers (Research Question 1). Further, we examined whether providing the RS to differentiate reading instruction increased the effects of LPA for low-performing readers (Research Question 2).
Our hypothesis was that the findings from our classwide studies would generalize to low-performing students and that the reading fluency, reading comprehension, and intrinsic (but not extrinsic) reading motivation development of students whose teachers had LPA information would exceed that of students whose teachers had less assessment information. This hypothesis was based on previous studies that have shown positive effects of progress monitoring on reading achievement (e.g., Stecker et al., 2005) and reading motivation (Calhoon & Fuchs, 2003). We further hypothesized that a combination of LPA and the RS would have additional positive effects on the outcomes of low-performing students.
Method
Participants and Design
We used data from six intervention studies conducted by our research team between 2011 and 2018 in general primary education, each study lasting the duration of one school year. All studies included a condition in which teachers were equipped with the LPA tool to monitor their students’ reading progress (LPA group). The LPA group was compared with a business-as-usual CG and/or a group in which teachers received a combination of the LPA tool and the RS to differentiate reading instruction based on students’ LPA results (LPA-RS group). One study included students from Grades 3 and 4, which we treated as two separate samples in the analysis, resulting in seven independent samples from six studies with students from second to fourth grade (see Table 1).
Grades, Measures, Conditions, and Sample Sizes of the Single Studies Ordered Per Grade.
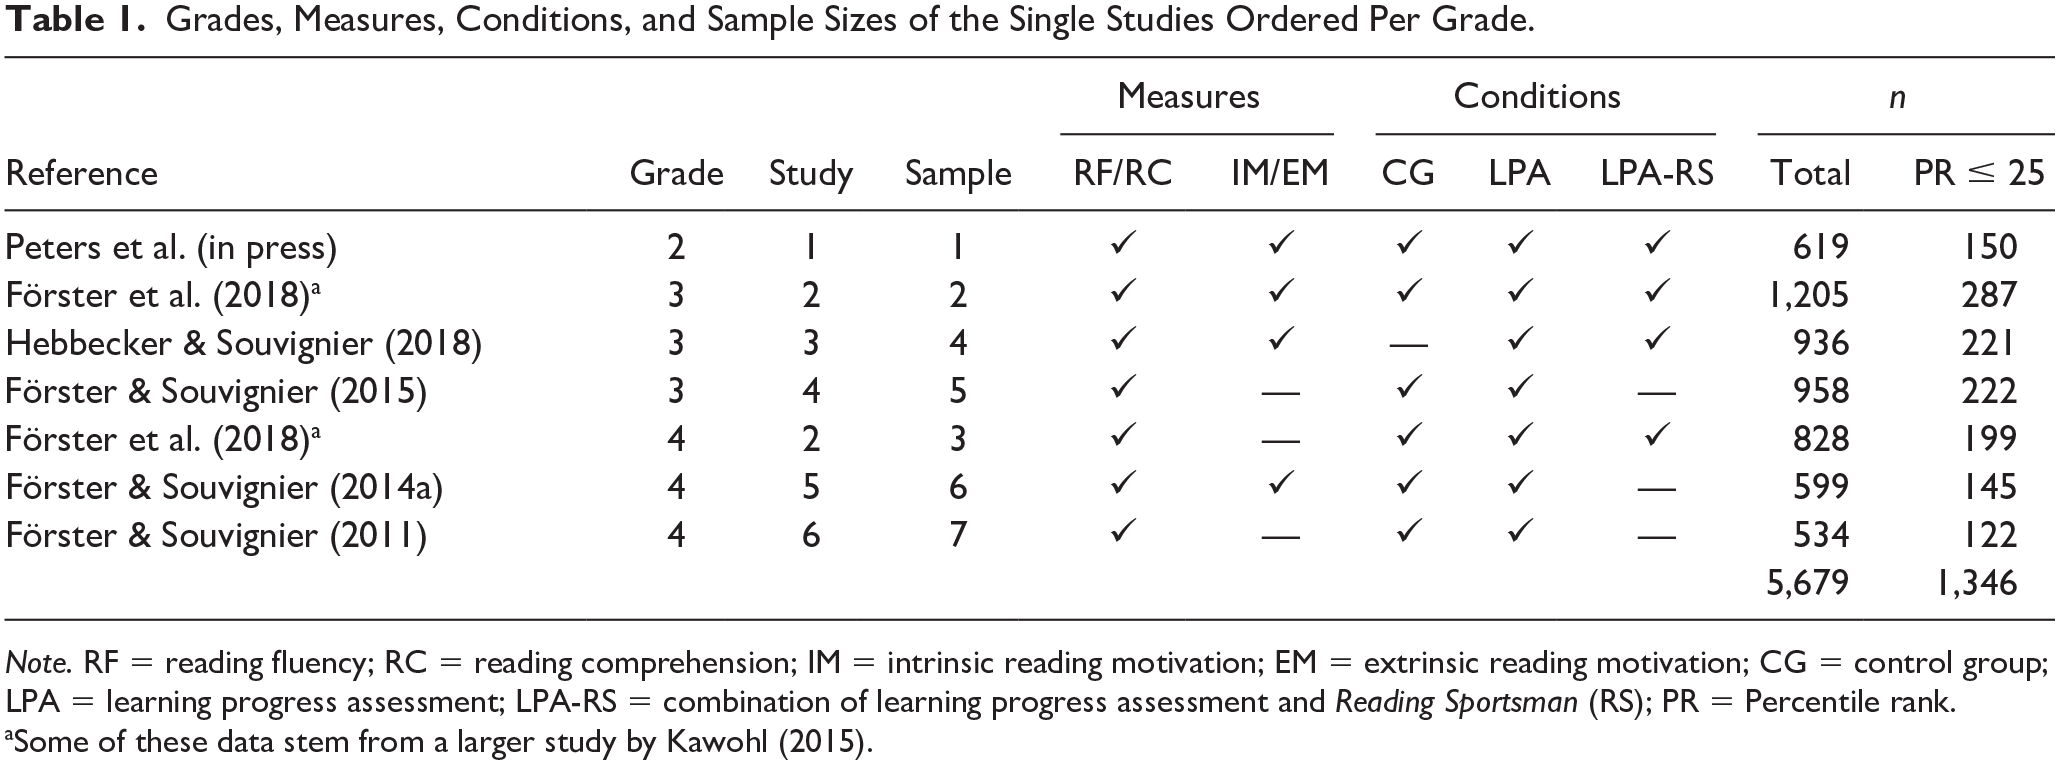
Note. RF = reading fluency; RC = reading comprehension; IM = intrinsic reading motivation; EM = extrinsic reading motivation; CG = control group; LPA = learning progress assessment; LPA-RS = combination of learning progress assessment and Reading Sportsman (RS); PR = Percentile rank.
Some of these data stem from a larger study by Kawohl (2015).
In all studies, a quasi-experimental pretest-posttest design was realized. Assignment to the different conditions was made after informing teachers about the general study design and considering the schools’ technical equipment and consent to use the LPA tool and the RS. LPA and LPA-RS conditions differed slightly across studies, as in some studies, teachers received additional teacher training on how to use the LPA or on how to differentiate instruction with the RS. To increase power, we considered all groups that used the LPA tool but had no access to the RS as the LPA condition, independent of additional trainings, and all groups that used the LPA tool and the RS as the LPA-RS condition. This decision was based on the DBDM process, which differentiates the phases of data assessment and interpretation (supported by the LPA tool) from the instructional decision-making phase (supported by the RS).
Reading fluency and reading comprehension were assessed in all samples, and reading motivation was assessed in four samples at the beginning and end of the school year. In three samples, the LPA condition was compared with a CG but not with the LPA-RS condition (see Table 1). All teachers received the results of the pretests shortly after data collection; thus, all teachers had access to student achievement data at the beginning of the school year.
Participation in the primary studies was voluntary, and informed consent was obtained from parents. Overall, N = 5,679 students from 264 classes participated in the studies (see Table 1). As no formal process of identifying students with LDs exists within the German school system, we could not select formally identified students with or at-risk for LDs for our reanalysis. Thus, given the age of the participants in the studies, we chose to identify low-performing readers based on code-related reading difficulties, more specifically, based on reading fluency scores.
According to a common cutoff, we identified low-performing readers as students below the 25th percentile on a reading fluency test (Suggate, 2016). The resulting sample consisted of N = 1,346 students (M age = 8.82, SD = 0.80; 44.2% female) and N = 264 teachers. Most students spoke German (71.7%) or German and another language (15.9%) at home. Compared with standardized norm scores, the average percentile ranks of the different samples included in our analyses varied approximately between 10 and 16 or below 1.0 to 1.3 standard deviations, respectively (exact percentile ranks could not be determined due to deviating test times of the norming sample). The great majority of teachers was female (89.9%). On average, teachers were 47.97 years old and had 20.24 years of teaching experience (see Table 2).
Demographic Information of Teachers of the Single Studies.
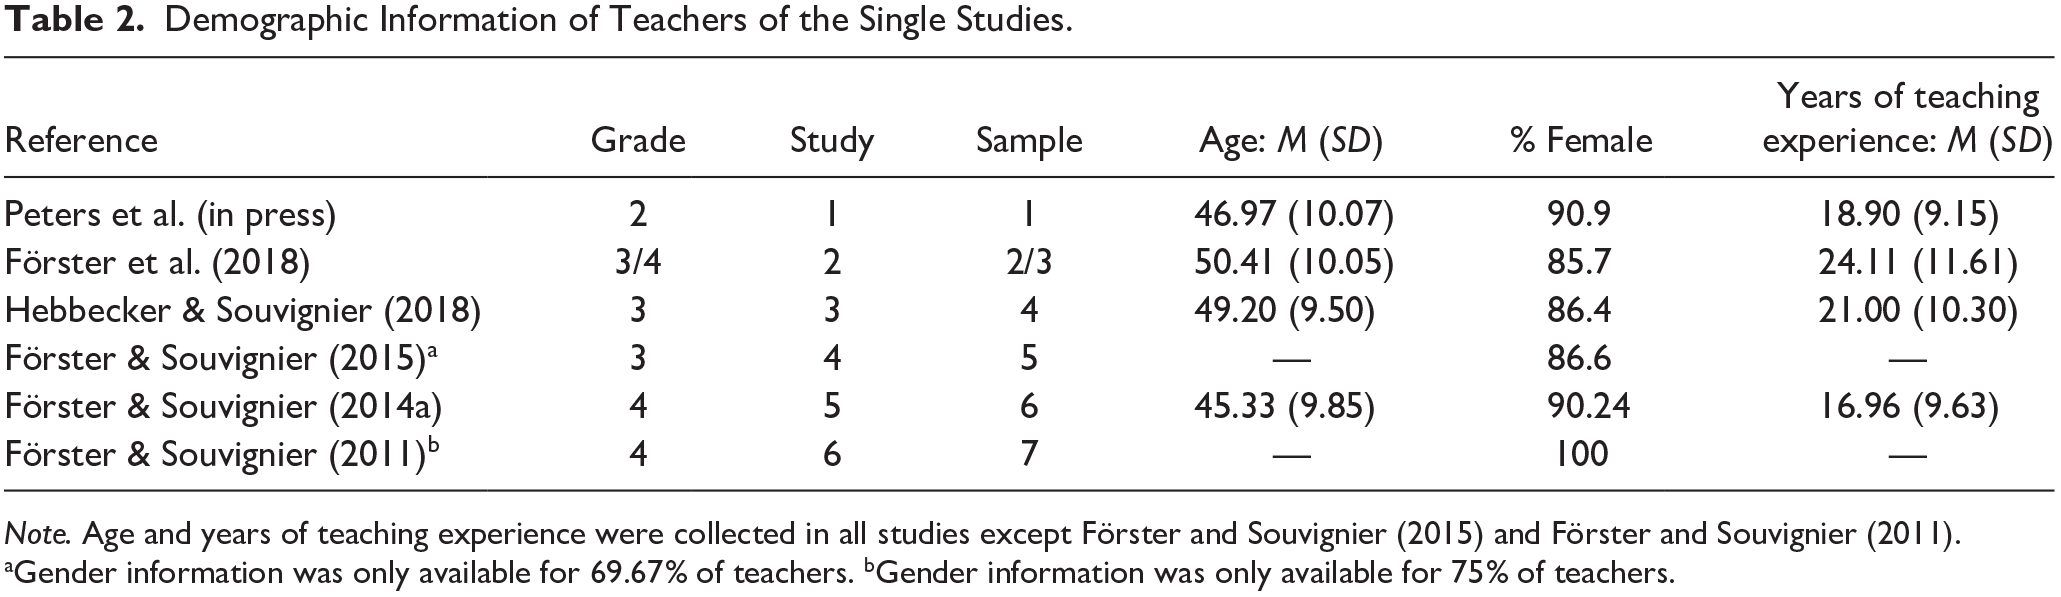
Note. Age and years of teaching experience were collected in all studies except Förster and Souvignier (2015) and Förster and Souvignier (2011).
Gender information was only available for 69.67% of teachers. bGender information was only available for 75% of teachers.
LPA
Students in the LPA and LPA-RS conditions completed eight equivalent computer-based tests (10–15 min) at intervals of 3 weeks. Before the first test, students received instructions on how to use the tool and completed a subsequent tutorial. In the following weeks, teachers assisted students in logging into the system and then students completed the tests on their own. Tests for second graders assessed the efficiency of reading comprehension processes at the word, sentence, and text levels using a word/pseudoword discrimination task, a sentence verification task, and a text completion task, respectively (Förster & Kuhn, 2020). The tests in Grades 3 and 4 consisted of a maze task, in which every seventh word was deleted. After the maze task, students could see the complete text and answered a number of multiple-choice comprehension questions. Half of the questions could be answered using information that was explicitly presented in the text. The other half required students to draw inferences (Förster & Souvignier, 2011).
For all tests, teachers received differentiated assessment information in a teacher menu, including reading accuracy, reading fluency, and reading comprehension information. Individual results could be compared with a norm curve including all students who had completed the respective LPA tests. All words, sentences, texts, questions, and distractors were systematically constructed following the same strict rules for all eight tests in each grade, and the tests have been found to be equivalent (Förster & Kuhn, 2020; Förster & Souvignier, 2014b). For Grade 2, correlations of the tests with standardized achievement tests (word level: r = .64; sentence level: r = .75; text level: r = .62) were higher than correlations with a standardized test on mathematics (r = .43). Furthermore, retest reliability (word level: .61 < α < .72; sentence level: .65 < α < .69; text level .65 < α < .69) and split-half reliability (word level: .82 < α < .89; sentence level: .86 < α < .92; text level: .65 < α < .83) were acceptable to high. For Grades 3 and 4, correlations of the tests with standardized reading achievement tests (r = .71) were higher than correlations with standardized tests on mathematics (r = .37), and internal consistencies were acceptable to high (.77 < α < .90).
Participation in the LPA testing was examined for the different studies. Due to illness or organizational reasons (e.g., class trip), the full LPA information across all eight tests was not available for every student for all teachers. The following percentages indicate how many of the students in the single studies completed all eight LPA tests during the school year: Study 1: 92.6%; Study 2: 86.8%; Study 3: 95.0%; Study 4: 64.7%; Study 5: 63.3%; Study 6: 77.5%. Taken together, fidelity was high across studies, and information about reading progress was available to teachers for most students at most measurement points.
RS reading instructional materials
Teachers in the LPA-RS condition received reading instructional materials called the RS, which has been developed by our team. The RS contained evidence-based reading methods to differentiate reading instruction in terms of reading accuracy, reading fluency, and reading comprehension. Furthermore, it consisted of three methods, each with three levels of difficulty. In all methods, students with similar achievement levels worked in pairs. Teachers were encouraged to use the LPA reading accuracy, reading fluency, and reading comprehension results to differentiate reading instruction (i.e., to match students to the appropriate method and difficulty level and to create pairs) and to check the LPA results every 3 weeks and form new pairs if needed.
Within the RS, to train reading accuracy, a method named “reading slalom” was provided. In this method, students alternately read a series of words aloud after identifying and underlining syllables. While one student underlined the syllables and read the words out loud, the other student read along silently and gave feedback to his or her partner. Syllable-based reading was found to be effective to foster students’ reading accuracy (Müller et al., 2017; Müller & Richter, 2017).
Then, to foster reading fluency, the RS provided the “reading sprinter” method. It was based on the method of repeated reading (Samuels, 1979). In this method, students read aloud a number of words or a text for a predefined time, taking turns as the silent reader (i.e., the trainer) or the oral reader (i.e., the sportsman). The trainer’s task was to monitor the sportsman’s reading and to note reading mistakes. After reading, both students counted the number of words the sportsman read correctly. After taking turns, the initial sportsman read the same text once again, and they again counted the reading mistakes and number of words read correctly. Overall, students took the sportsman and the trainer role twice for the same text. Reading the same text repeatedly can improve word recognition (LaBerge & Samuels, 1974), and help students to realize that they can improve through practice.
Then, RS provided students who could read fluently with the “reading tandem” method rather than the reading sprinter activities. The reading tandem was a paired version of the reciprocal teaching method (Palincsar & Brown, 1984). Before working with the reading tandem, teachers taught two to four reading strategies (e.g., recognizing and clarifying difficult words, summarizing, and making predictions). Then, two students worked together and took turns either reading a text aloud and applying reading strategies to the text (i.e., the student in the back of the tandem) or reading along silently and instructing the other student to use the reading strategies (student in the front of the tandem).
The fidelity with which the RS was implemented could be observed only in Study 2 (i.e., Samples 2 and 3). Trained research assistants rated how many aspects of the RS were implemented correctly in one lesson. The observations showed that all aspects of the reading sprinter were implemented correctly in all observed classrooms except one aspect in one classroom. Thus, especially the reading sprinter was implemented with high fidelity (Förster et al., 2018).
Measures
Across all primary studies and all conditions, students’ reading fluency and reading comprehension were assessed at the beginning and end of the school year by trained student assistants using standardized achievement tests. In four samples, reading motivation was also assessed at both measurement points with a questionnaire (see Table 1).
Reading fluency
In Samples 2, 3, 5, 6, and 7, the Salzburger Lese-Screening to assess basal reading skills for Grades 1 to 4 (SLS 1–4; Mayringer & Wimmer, 2003) was used, and in Samples 1 and 4, a more recent version of the test that can be administered in Grades 2 to 9 was used (SLS 2–9; Wimmer & Mayringer, 2014). In both versions, a list of 70 sentences is presented, and students are asked to indicate within 3 minutes whether the sentence is correct (e.g., “Bananas are blue”). The sentences become increasingly longer and more complex. Both versions are highly reliable (rxx′ ≥ .90) and valid (r ≥ .81 with a reading-aloud measure). To compare contrasts across measures and samples, we used z-standardized sum scores in our analyses.
Reading comprehension
In Sample 1, reading comprehension was assessed using the ELFE II test (Ein Leseverständnistest für Erst- bis Siebtklässler; Lenhard et al., 2017). This test assesses reading comprehension at the word, sentence, and text levels. At the word level, students see 75 pictures and must select the corresponding and correct word for the picture out of four options within 3 minutes. At the sentence level, students read 36 sentences with a missing word in each sentence, and they have to select the missing word out of five choices. At the text level, students read 26 short texts and are asked to choose a sentence (out of four sentences) that best fits the story. Retest reliability was found to be satisfactory (r = .78), and the correlation with reading fluency was found to be high (r = .91). In Samples 5 and 7, a previous version of the same test was used (ELFE; Lenhard & Schneider, 2006). Internal consistencies for word, sentence, and text comprehension subtests of this test ranged from .86 to .96. With respect to decoding speed, criterion validity was high (r = .79).
In Samples 2, 3, 4, and 6, reading comprehension was assessed using a shortened version of the Hamburger reading comprehension test (HAMLET; Lehmann et al., 2006), as administration of the original test would have taken two lessons. This HAMLET-S (Förster & Souvignier, 2014a) consisted of two continuous nonfictional texts and one noncontinuous text (i.e., a table). In addition to the comprehension questions from the initial version of the test, six further questions were developed, considering the construction rules for items of the original version of the test, resulting in a total of 22 items. As for the original version, internal consistencies were high (α = .87), and correlations with teacher judgments of reading comprehension ranged from .58 to .65. Again, reading comprehension was scored and used in all samples as z-standardized sum scores.
Reading motivation
In Samples 2 and 6, the Habitual Reading Motivation Questionnaire (Möller & Bonerad, 2007) was used; it has five items to assess intrinsic reading motivation (e.g., “I enjoy reading books”; α = .71−.76) and four items to measure extrinsic reading motivation (e.g., “I love being the best at reading”; α = .75−.81). In Samples 1 and 4, the Reading Motivation Questionnaire (Stutz, 2014) was used, with four items measuring intrinsic reading motivation (e.g., “I read because I can imagine so much”; α = .70−.81) and three items assessing extrinsic reading motivation (e.g., “I read because it is important to me to always be the best in reading”; α = .78−.80). Items for both questionnaires and all subscales were rated on a 4-point Likert-type scale from 1 (does not apply to me) through 4 (applies to me). Intrinsic and extrinsic motivation scores were calculated as z-standardized averages across the items pertaining to each of the respective scales.
Data Analysis
Multivariate normality for all samples could be rejected according to Mardia’s skewness coefficient (all ps < .002). Mardia’s multivariate kurtosis coefficient was further significant in four out of the seven samples (all ps < .009) but not in Sample 3 (b2,4 = 25.70; B = 1.03; p = .300), Sample 4 (b2,8 = 81.91; B = 0.97; p = .330), and Sample 6 (b2,8 = 82.73; B = 1.26; p = .210). The analysis of the missing data pattern revealed that the overall amount of missing data was below 10% for six samples, with a range from 2.33% (Sample 6) to 9.39% (Sample 1). Only Sample 2 had a considerably larger average percentage of missing data with 27.66%. This amount in Sample 2 was driven by a large amount of missing values on the motivational measures (all percentages > 44.25%). The percentages of missing values for each variable ranged between 0% and 17.33% across the other data sets. Given that multivariate normality was violated for all samples, it was further indicated by Jamshidian and Jalal’s two-step procedure (Jamshidian et al., 2014) that there was not sufficient evidence to reject the assumption of missing completely at random in five samples because of a nonsignificant Hawkin’s test (all ps > .067). For Sample 4, the same conclusion was drawn based on the combination of Hawkin’s test and nonparametric test of homoscedasticity (Sample 4: Hawkin’s test p = .012; nonparametric test of homoscedasticity p = .053). For Sample 6, the amount of missingness was too small (i.e., too few patterns of missing data) to apply Jamshidian and Jalal’s procedure. Based on these missing data patterns, applying multiple imputation as technique for handling missing values was well justified.
Multiple imputation was implemented using the package mice (Van Buuren & Groothuis-Oudshoorn, 2011) for statistical software R (R Core Team, 2020). According to literature recommendations, we used 40 imputed data sets (e.g., Azur et al., 2011). To consider the effects of a multilevel clustering on standard errors (i.e., students were nested in classrooms), we used Arellano’s method (Arellano, 1987) to estimate a robust covariance matrix (i.e., standard errors are on the diagonal) as it is implemented in the plm package (Millo, 2017). In addition, normality violations were addressed by relying on robust HC4 standard errors (Cribari-Neto, 2004). All estimated models used the pretest as a control variable when the posttest was predicted by group contrasts in a linear model framework. Of note, imputation was performed for all relevant variables in a sample, but linear model coefficients of the regression analyses were separately estimated for each dependent variable. The model coefficient b represents the effect size and was based on the same regression model in each of the primary studies. That is, in each sample, the dependent variable (T2) was predicted by its initial level (T1) and a dummy-coded (i.e., binary) independent variable to contrast the respective conditions (e.g., CG vs. LPA). Given that the dependent variable was standardized in each regression model, the regression coefficient for the dummy variable (i.e., the effect size) represents the mean difference in standardized units between the conditions when statistically controlling for the initial level of the dependent variable. Hence, the interpretation of the standardized model coefficient b is analogous to the interpretation of standardized mean differences (e.g., Cohen’s d). According to Acock (2014), b < .20 is considered a weak, .20 < b < .50 a moderate, and b > .50 a strong effect. All regression analyses were also performed without outliers (see Table 4). Finally, estimates of contrasts between CG, LPA, and LPA-RS conditions and the respective standard errors were pooled by meta-analytical methods as implemented in metafor (Viechtbauer, 2010).
Results
In the following, we will first report the results of the comparison of the CG and LPA conditions, before we present the findings for the comparison of the CG and the LPA-RS conditions. In each of the paragraphs, we first report the findings for the single studies and then refer to the meta-analytical summary of the primary studies.
The regression analyses for the single studies revealed no significant differences between the CG and LPA conditions in reading fluency, reading comprehension, or reading motivation (Research Question 1, see Tables 3 and 4). Similarly, the meta-analytical summary of the primary studies revealed no significant differences between the CG and LPA conditions and relatively low effect sizes were found. However, the results showed effect trends in the expected directions. For example, low-performing students of the LPA treatment group showed trends toward a greater learning growth in reading fluency (b = .10, 95% confidence interval [CI] = [−.20, .40]) and reading comprehension (b = .13, 95% CI = [−.18, .45]) than low-performing students in the CG. Likewise, students of the LPA group tended to have a greater growth in intrinsic reading motivation (b = .12, 95% CI = [−.39, .63]) and less growth in extrinsic reading motivation (b = −.15, 95% CI = [−.66, .36]) than students who received regular reading instruction (see Figure 1).
Parameters and Standard Errors of the Regression Analyses of the Single Studies Including Only Low-Performing Students.
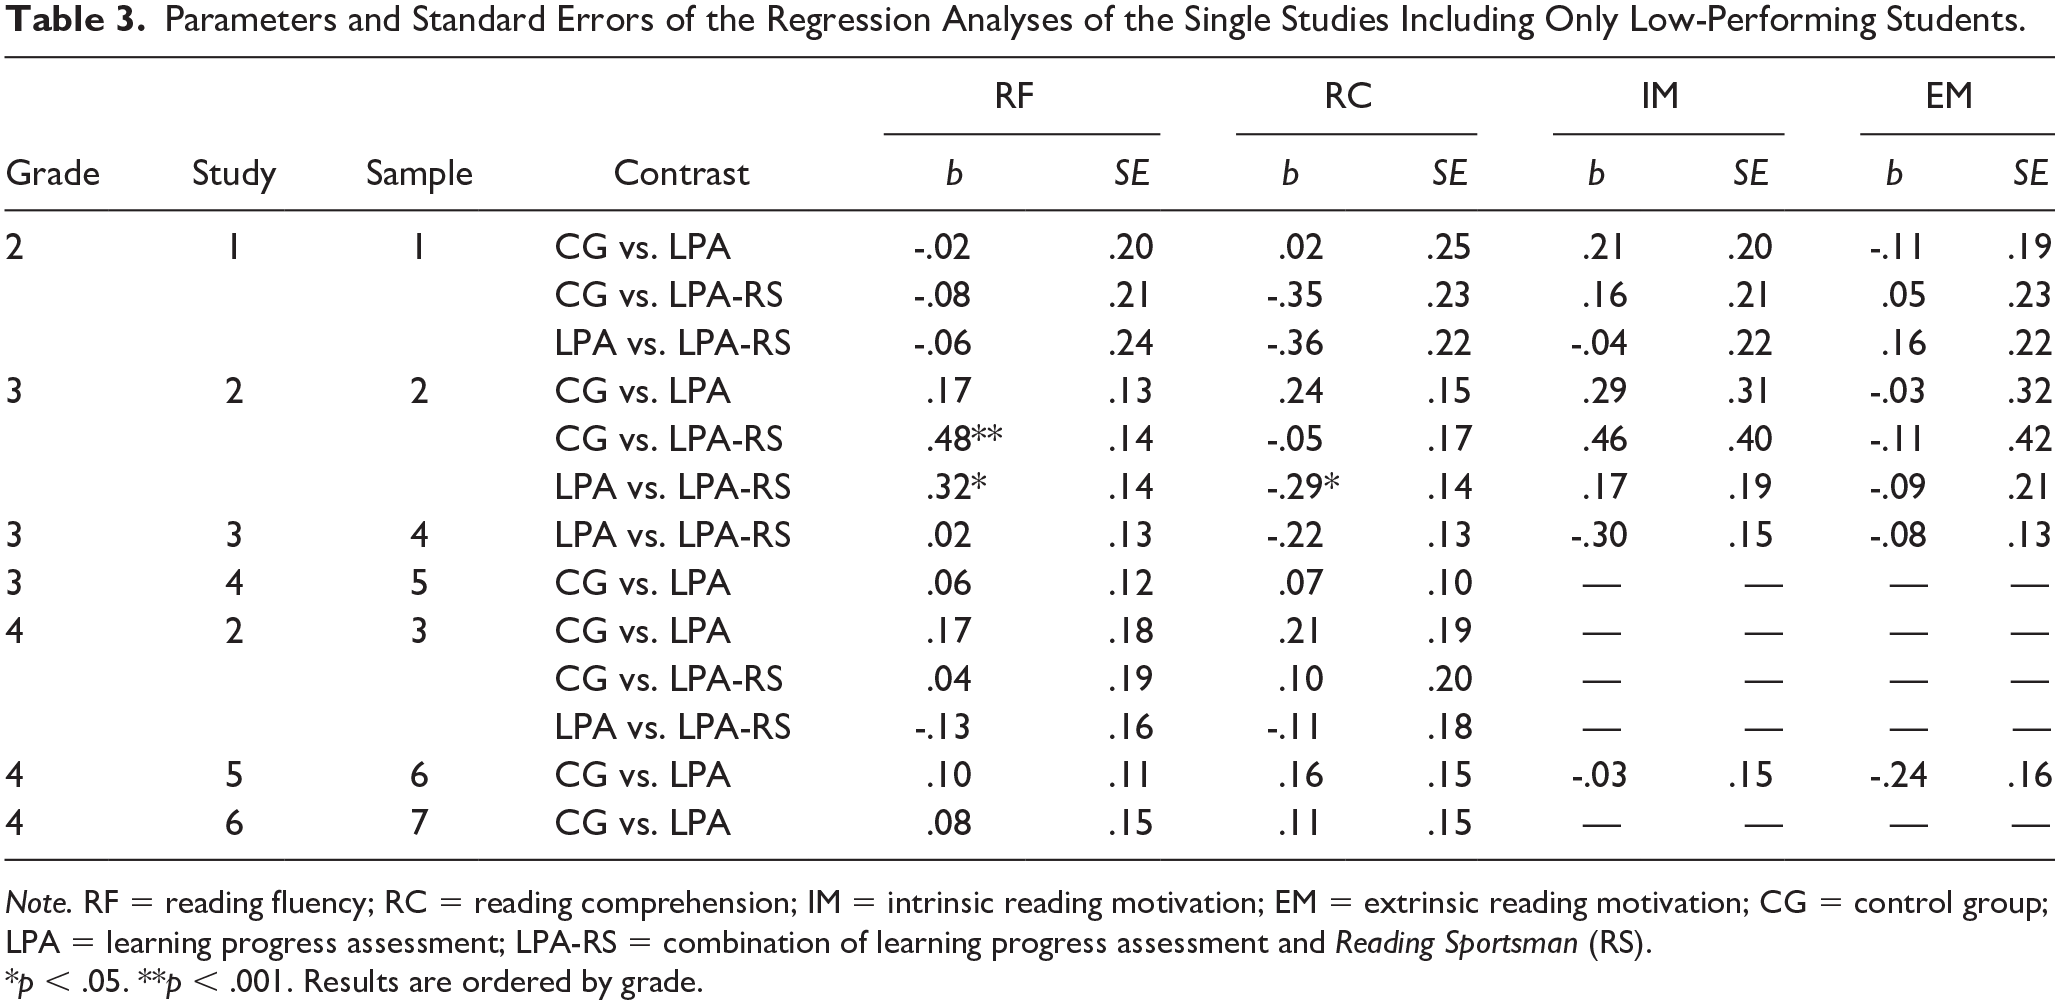
Note. RF = reading fluency; RC = reading comprehension; IM = intrinsic reading motivation; EM = extrinsic reading motivation; CG = control group; LPA = learning progress assessment; LPA-RS = combination of learning progress assessment and Reading Sportsman (RS).
p < .05. **p < .001. Results are ordered by grade.
Parameters and Standard Errors of the Regression Analyses of the Single Studies Without Outliers, Only Including Low-Performing Students.
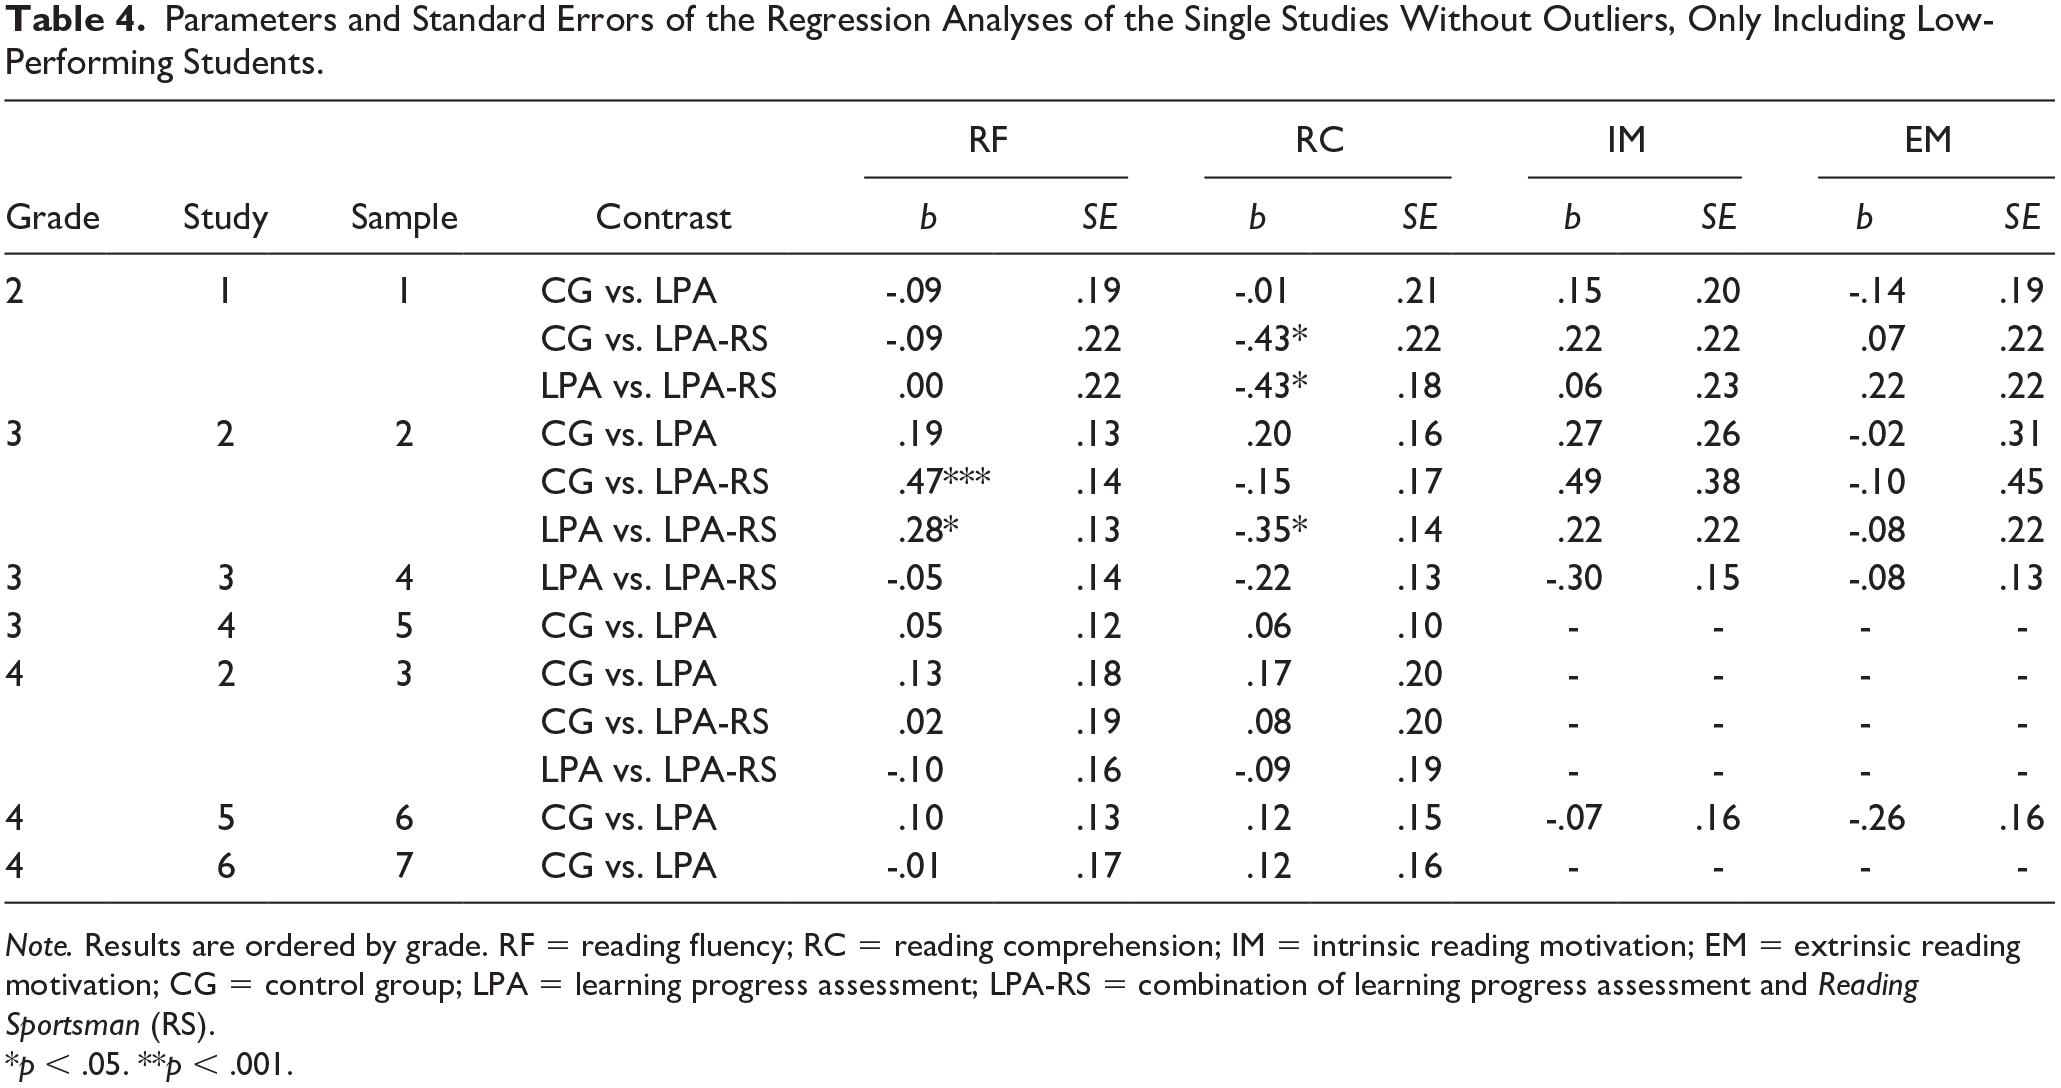
Note. Results are ordered by grade. RF = reading fluency; RC = reading comprehension; IM = intrinsic reading motivation; EM = extrinsic reading motivation; CG = control group; LPA = learning progress assessment; LPA-RS = combination of learning progress assessment and Reading Sportsman (RS).
p < .05. **p < .001.

Forest plots displaying results of the single studies and meta-analyses only including low-performing students.
When investigating whether the combination of LPA and RS had additional effects on the reading achievement and reading motivation of low-performing students (Research Question 2), only findings from Sample 2 revealed significant results (see Tables 3 and 4): In this sample, students in the LPA-RS group showed significantly greater learning growth in reading fluency than the CG (b = .48, SE = .14, p < .001) and the LPA group (b = .32, SE = .14, p = .02). For reading comprehension, however, students in the LPA group showed significantly more growth than those in the LPA-RS group (b = −.29, SE = .14, p = .04).
The meta-analytical approach revealed no significant differences between the LPA-RS and the CG or LPA conditions, respectively. However, some effect trends were found again (see Figure 1). Compared with the CG, low-performing students in the LPA-RS group tended to show more growth in reading fluency (b = .19, 95% CI = [−.28, .66]) and intrinsic reading motivation (b = .26, 95% CI = [−.46, .99]). Surprisingly, low-performing students of the LPA group seemed to benefit more in reading comprehension than low-performing students whose teachers had access to both LPA and the RS (b = −.24, 95% CI = [−.63, .15]).
Discussion
In this study, we reanalyzed data from previous studies to determine whether the positive effects found for the implementation of a DBDM approach in general education can be generalized to low-performing readers. More specifically, we merged and reanalyzed data from seven samples drawn from six previous studies and used a meta-analytic approach to examine effects of low-performing readers. We differentiated effects of LPA with or without the RS, and we examined both achievement and motivation outcomes. Overall, the results of our analyses revealed that the use of LPA tended to be associated with higher reading growth, but effects were nonsignificant and smaller than those found in the larger samples of all students. For instance, the effect sizes for reading fluency and reading comprehension varied between d = .12 and .24 for the whole class, but were found to be b = .10 and .13 for reading fluency and reading comprehension, respectively, for low-performing students. The low-performing students, however, tended to benefit from LPA with respect to their intrinsic reading motivation (b = .12), whereas no such effect was found for the whole class.
When combined with the RS, effects were still nonsignificant for low-performing readers, but effect sizes for reading fluency increased slightly to b = .19, indicating that providing teachers with reading instructional materials might be a promising first step to improve low-performing students’ reading fluency and reading motivation. Surprisingly, the combination of LPA with the RS may not be sufficiently intensive to accelerate the reading comprehension of students initially low-performing. This pattern of findings suggests that the successful implementation of DBDM via the combination of LPA and the RS may lead to differentiation of instruction in general education classrooms and an overall improvement in achievement. However, these results may not apply to low-performing students, including those with or at-risk for LDs in reading.
The positive trends in the data suggest that providing teachers with LPA and the RS to differentiate instruction might be a small step in the desired direction, yet the lack of significant results suggests that effecting performance gains in students with reading difficulties requires much more than classroom-level differentiated instruction. In accordance with the observation by D. Fuchs et al. (2010), our results would suggest that these students are likely in need of more intensive, specific, and structured instruction. For instance, Wanzek and Vaughn (2007) identified at least 100 sessions of reading intervention (i.e., 20 weeks of daily intervention) as a proxy for interventions that have a positive impact on student achievement. In our studies, low-performing students might not have worked enough with the RS to reveal large positive effects on their reading achievement.
Possible Explanations of the Findings
One possible explanation for the nonsignificant differences between conditions and for the relatively low effect sizes may be that the methods used to promote reading accuracy, reading fluency, and reading comprehension were—apart from being evidence based—also selected based on the extent to which they were student centered and could be implemented in pairs in the classroom. This decision was primarily based on the consideration that in almost all classrooms, only one teacher is responsible for all students. Thus, if instruction is not directed to the whole classroom at once and is to be differentiated for students with different abilities, students need to complete the exercises independently. Studies, however, show that student-centered approaches are less effective for subsamples of low-performing students (Connor et al., 2004).
Accordingly, pairs of students that were formed by teachers and who worked together in our studies were supposed to have similar reading levels, which implies that the students with the poorest reading skills worked together. This may have resulted in the low-performing students being overwhelmed with the task of doing the reading exercises and monitoring their partners’ reading progress. Overall, the DBDM approach provides the chance to adapt instruction to students’ needs and is, on average, successful for promoting students’ reading abilities. Moreover, particularly when average- and high-achieving students work together in pairs, the teacher gets the opportunity to focus on the low-performing students and provide teacher-guided instruction. Yet, our findings indicate that it would be useful to make teachers more aware of the special needs of their low-performing students and to include intensive, highly structured, and teacher-guided reading instruction into the RS. Such an approach would help students apply the methods correctly and would thus be beneficial for fidelity.
One method that was likely implemented with high fidelity is the reading sprinter. In one of our studies investigating the effects of LPA and a combination of LPA and the RS, classroom observations showed that this method was implemented as intended (Förster et al., 2018). The reading sprinter employs the method of repeated reading, which has been shown to positively affect students’ reading fluency and self-concept (Lee & Yoon, 2017; Samuels, 1979; Therrien, 2004). Given that the method is intended to foster basal reading skills, it might be more suitable for low-performing readers in primary school than the reading tandem method, which involves monitoring or using reading strategies. Nevertheless, the effects of different instructional approaches should be further studied, as some studies indicate that repeated reading might not be the appropriate method for all low-performing students (e.g., Chard et al., 2009). For instance, it should be investigated whether repeated reading is more effective when a low-performing reader works together with a higher performing fluent model.
Information on students’ reading progress only leads to positive effects if the data are actually used to inform practice (Espin et al., 2017); however, research also indicates that using data for instructional decision-making is the most ambitious step in the DBDM process (Kippers et al., 2018; Stecker et al., 2005). Furthermore, it is especially difficult to realize a systematic differentiation of instruction in heterogeneous classes when general education teachers are not supported by special educators (D. Fuchs et al., 2010; L. S. Fuchs & Vaughn, 2012). In this context, our results resemble past findings showing that DBDM is a challenge for teachers, and they need further support in incorporating it into their daily routines (Spear-Swerling & Cheesman, 2012; Staman et al., 2017). To be more concrete, support for teachers needs to address (a) working with assessment data, which is usually not a central component in teacher education (Darling-Hammond, 2006) and (b) the use of data to adapt instruction, which is not as widespread as it could be (Brunner et al., 2005). Moreover, teacher training should also (c) focus on making teachers more familiar with evidence-based methods for reading instruction, which are only rarely used in everyday instructional practice in Germany (Bremerich-Vos et al., 2017).
Limitations
When interpreting the findings of this study, it is important to consider the distinction between implementing programs as intended versus as conducted (Century & Cassata, 2016). The objective of many studies is to investigate the effects of programs, given the precondition that the core components of the innovative concepts were implemented as intended, that is, when they are implemented with high treatment fidelity (c.f. Stecker et al., 2005). The second perspective, in contrast, is more concerned with evaluating the effects of an implementation as conducted, that is, to evaluate what actually happened in schools and to what extent desired effects of the transferred concept are attained. Our study focuses on the second approach, as teachers were asked to use the provided concepts in realistic practical settings, and no further support was provided (e.g., personnel) apart from the LPA tool and the RS. Clearly, evaluating implementation as conducted increases the ecological validity but is usually associated with a lack of experimental control and a decrease of internal validity.
Given that we could not realize a consistent control of the general instructional processes across all schools for all six studies, we do not know to what extent LPA and the RS were used as intended. Classroom observations were only conducted in Study 2 (i.e., Samples 2 and 3), which should be considered as a limitation of our study. Yet, the available data show that LPA information was available for most of the students at all measurement points, and the classroom observations indicated that teachers were using the RS as intended. To better understand why the effects were found to be quite low, systematic classroom observations would be helpful in future studies. Another limitation is that the LPA tests between Grade 2 and Grades 3 and 4 differed, which could be a reason for different effects between different grades.
In interpreting the results, readers must also keep in mind that all six studies were conducted in Germany. Assumptions about reading instruction in the CG are based on representative data from an international study (Tarelli et al., 2012) and a recent observational study that indicates that teachers of second-grade classrooms in general primary school in Germany only rarely use evidence-based methods in everyday instructional practice (Peters et al., 2021). As previously described, general education in Germany is typically characterized by one teacher being responsible for the entire class with little and unsystematic support from other professionals (e.g., special education teachers, school psychologists). While the average class size in Germany (i.e., 22 students to one teacher) is similar to the average class size in the EU, the percentage of teachers who lack support from additional specialized professionals is much higher in Germany (Tarelli et al., 2012). Therefore, our findings might not be generalizable to education systems in which more professional resources are available.
A limitation of our study concerns the fact that information about how many students of our sample were diagnosed with a reading or learning disability is missing for the primary studies. Yet, the estimated average percentile ranks of the different samples (percentile ranks 10–16) indicate that our samples most likely included a substantial number of students who would be considered reading disabled according to Suggate (2016).
It should be noted that all analyses did not correct for unreliability of the measures (e.g., Schmidt & Hunter, 1996); consequently, the estimated group contrasts may represent slight underestimates of the true effects. While such corrections are possible in common applications of meta-analytical methods, the analyses for this study were already quite complex because we accounted for statistical control of the pretest measures, violations of normality, multilevel clustering, and missing data. Furthermore, we used z-standardized sum scores of the reading comprehension measure. A latent variable approach using several indicators for reading comprehension could have been useful.
Implications and Future Prospects
As mentioned in the introduction, heterogeneity in German general education classrooms is increasing, and this is accompanied by the concern that low-performing students might be left behind because systematically differentiated instruction is only rarely found in general education settings (D. Fuchs et al., 2010; Tarelli et al., 2012). The results of our study are especially important for countries such as Germany, where students with learning difficulties are placed back into general education classrooms, but often with no accompanying systematic instruction from LD specialists. It seems that implementing DBDM with support for teachers (via LPA and LPA plus the RS) in general classroom settings is possible and can help to prevent low-performing students from being left behind. Nevertheless, it becomes apparent that merely implementing classroom-level differentiation is not enough to meet the needs of low-performing students and teachers need support that goes beyond the concepts we provided. Most importantly, future studies should consider factors that affect the success of DBDM implementation. For instance, a closer contact between researchers and teachers (e.g., by continuous professional development or coaching) could facilitate teachers’ knowledge and skills about DBDM. At the same time, researchers could profit from teachers’ practical experience. Moreover, Hoogland et al. (2016) identified three important factors that affect whether the implementation of DBDM is successful: (a) the presence of a DBDM culture in schools (e.g., collective responsibility and respect for teachers’ autonomy and professionalism), (b) the facilitation of resources (e.g., sufficient time), and (c) the development of teachers’ knowledge and skills on DBDM. Thus, the use of LPA and the RS to differentiate instruction might need to be adapted to the needs of each school. Overall, teachers seem to need more resources to implement LPA and to use the RS, which should include evidence-based and student-centered approaches (e.g., time or personnel).
The six primary studies investigated effects of DBDM for one school year. Taking into consideration that transferring innovative concepts into schools requires a substantial and sustainable change (Gottfredson et al., 2015; Humphrey et al., 2016), it would be interesting to study long-term effects over more school years in the future. For instance, teachers could receive continuous training on how to read and interpret graphed data that display information on students’ learning progress (Espin et al., 2017). Another way to further improve DBDM could be to establish data teams, in which teachers collaboratively analyze data and discuss instructional adjustments (Schildkamp et al., 2019). As several studies from Fuchs and Fuchs and colleagues show, providing teachers with clear suggestions on how to utilize data for instructional decision-making is effective (Stecker et al., 2005). Taken together, a combination of reading instructional materials, teacher training, and cooperation among school teams may be a promising approach for implementing DBDM routines; however, more research is needed on how teachers can be best supported in this domain.
Footnotes
Acknowledgements
We thank Christine Espin for her valuable comments on a previous version of this article.
Declaration of Conflicting Interests
The author(s) declared no potential conflicts of interest with respect to the research, authorship, and/or publication of this article.
Funding
The author(s) received no financial support for the research, authorship, and/or publication of this article.