
Abstract
The protein A-gold technique has been widely applied for visual localization and quantification of various antigens by electron microscopy. Observation of specimens stained by the protein A-gold technique with conventional light microscopy is difficult because of insufficient sensitivity of the staining. Light microscopic visualization and quantification of the reaction products were attempted employing a confocal laser scanning microscope (CLSM). Liver tissues of normal and peroxisome proliferator-treated rats were fixed and embedded in Lowicryl K4M resin. Ultrathin and thin sections were stained for catalase and a peroxisome-specific β-oxidation enzyme by the protein A-gold technique. Ultrathin sections were observed by electron microscopy and the labeling density for each enzyme was analyzed with an image analyzer. Thin sections were observed with a CLSM in the reflection mode and the intensity of the light reflection was analyzed under the same conditions for all specimens. A comparison of these two observation procedures was also attempted using liver tissues stained with various concentrations of the antibody for catalase. The intensity of the reflection for each, as observed by CLSM, correlated well with the labeling density observed by electron microscopy. CLSM made it possible to quantify and to directly observe protein A-gold staining at the light microscopic level.
T
Confocal laser scanning microscopy (CLSM) is coming to be commonly used in the observation of various kinds of specimens, most commonly with fluorescence, and quantification of the fluorescent reaction products has also been attempted (Good et al. 1992; Larsen et al. 1994; Verschure et al. 1994; Asaka et al. 1998). Another representative example of the use of CLSM is as a reflectance microscope. Because CLSM provides higher resolution of images and stronger intensity of the reflection light of the laser beam than the usual reflectance microscopes employing ordinary light, a variety of other kinds of application to other kinds of reaction product is possible, e.g., cerium for oxidase reactions, DAB for peroxidase reaction, silver for intensification of immunogold staining, and silver impregnation for neural tissue of Golgi impregnation (Robinson and Batten 1989, 1990; Freire and Boyde 1990; Uriel et al. 1995; Woolf et al. 1996; Ito and Otsuki 1998; Sun et al. 1998). Direct visualization of immunogold staining has also been reported to be possible by CLSM in the reflection mode (Van den Pol 1989).
In this study, hepatic peroxisomes were used as the subject of observation by CLSM in the reflection mode. The peroxisome is a spherical cell organelle with a diameter of about 0.5-1.0 μm (de Duve and Baudhuin 1966; Fahimi 1969) containing specific enzymes, e.g., catalase, D-amino acid oxidase, urate oxidase, and fatty acid β-oxidation enzymes, including enoyl-CoA hydratase/3-hydroxy acyl-CoA dehydrogenase (PH) (Osumi and Hashimoto 1979a; Bendayan et al. 1983; Yokota et al. 1987; Usuda et al. 1991b; Hashimoto 1996). A group of chemicals called peroxisome proliferators, which include clofibrate and dioctyl-phthalate (DOP), cause a marked increase in the number and volume of peroxisomes in hepatocytes and in the amount of their enzymes (Hess et al. 1965; Osumi and Hashimoto 1979b; Usuda et al. 1988). The magnitude differs for each enzyme, for PH the most and for other enzymes less (Reddy et al. 1981; Nemali et al. 1988). In previous studies, administration of peroxisome proliferators made the density of the distribution of catalase decrease and that of PH increase compared with those of normal peroxisomes (Reddy et al. 1981; Nemali et al. 1988; Usuda et al. 1988). In this study we attempted visualization of the reaction products of the protein A-gold technique and quantification of the density of distribution of gold particles, employing specimens of liver tissues of rats fed normal or DOP-containing diets stained for these peroxisomal enzymes.
Materials and Methods
Tissue Preparation
Liver tissues of 14-week-old male Wistar rats, fed normal or 1% DOP-containing diets (Osumi and Hashimoto 1979b), were fixed by perfusion with a fixative of 4% paraformaldehyde/0.1% glutaralde-hyde/100 mM sodium phosphate, pH 7.4, for 15 min and then by immersion for 2 hr. After rinsing in a cold solution consisting of 100 mM lysine/100 mM sodium phosphate, pH 7.4/150 mM sodium chloride and dehydration in a graded series of cold ethanol, they were embedded in Lowicryl K4M at − 20C by UV polimerization (Roth et al. 1981).
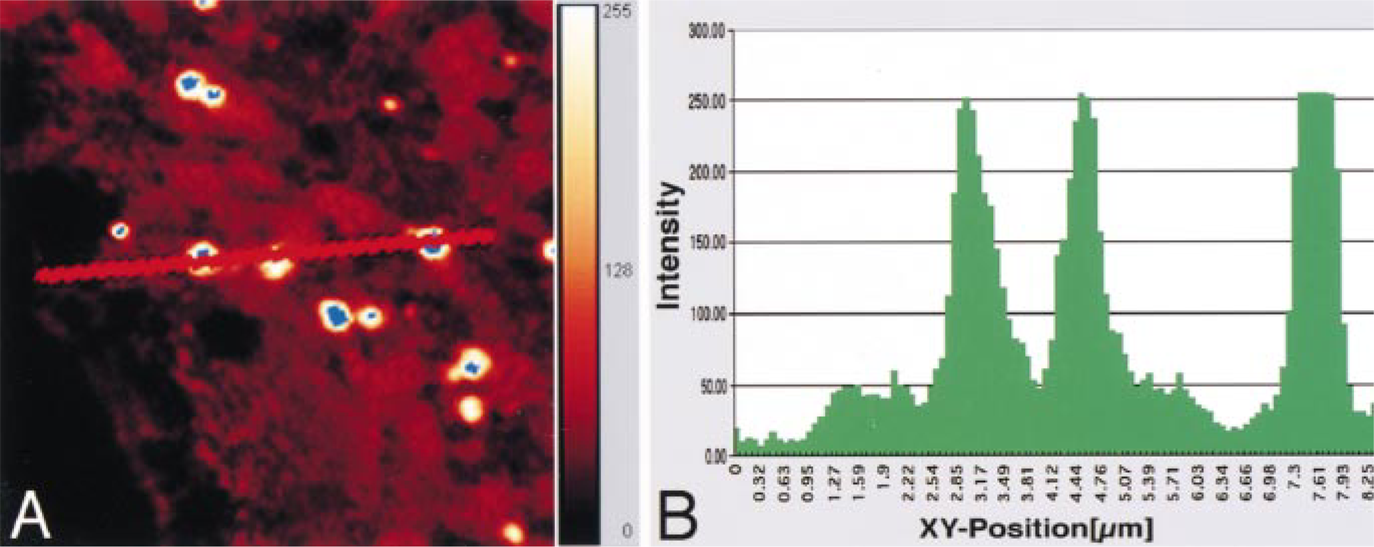
The procedure for measuring the intensity of reflecting light from peroxisomes on the line (line intensity) on a normal liver tissue section stained for catalase by the protein A-gold technique. The intensity was graded at 256 levels, i.e., the highest value was defined as 255 and the lowest as 0. The intensity was imaged with pseudo-color gradation: blue (255); white; orange (128); red and black (0) (A). Original magnification × 6400. The values of the reflection light measured are also shown as a histogram (B).
Immunoelectron Microscopy
Staining was performed as previously described (Usuda et al. 1988). Antibodies for rat liver catalase and PH were employed (Osumi and Hashimoto 1979a; Furuta et al. 1986). Sections of 0.1 μm were cut on a Dupont Sorvall MT2B ultramicrotome and mounted on Formvar membrane-coated nickel grids. The sections were soaked in 5 mg/ml bovine serum albumin in 50 mM Tris-HCl, pH 7.5/150 mM sodium chloride (TBS), containing 0.05% (v/v) Triton X-100 for 1 hr. They were then transferred to antibody solution (40 μg/ml of IgG in TBS containing 0.05 % Triton X-100 and 5 mg/ml of bovine serum albumin) and incubated for 1 hr at room temperature. After washing several times in TBS with 0.05% Triton X-100, the sections were transferred to a diluted solution of protein A-gold complex (15-nm gold particles) (EY Laboratories; San Mateo, CA) for 1 hr at a concentration of A520 = 0.07. The sections washed with the buffer solutions were then examined in a JEOL 1200 EX electron microscope at an accelerating voltage of 90 kV after staining with uranyl acetate and lead citrate.
Quantification of Gold Particles on Electron Micrographs
The labeling density, i.e., the number of gold particles per unit area of peroxisomes, was estimated for each enzyme in hepatocytes in the pericentral area of hepatic lobules. The area of peroxisomes, the cytoplasm, and the number of gold particles on them were measured using the computer software Ultimage (Graftek; Voisins le Bretonneux, France). Fifty peroxisomes photomicrographed at a magnification of × 20,000 were evaluated in each group. The total labeling index was calculated as volume density × labeling density for electron microscopic observation (Beier et al. 1988; Nemali et al. 1988; Usuda et al. 1988), and volume density × the intensity of light reflection for CLSM observation.
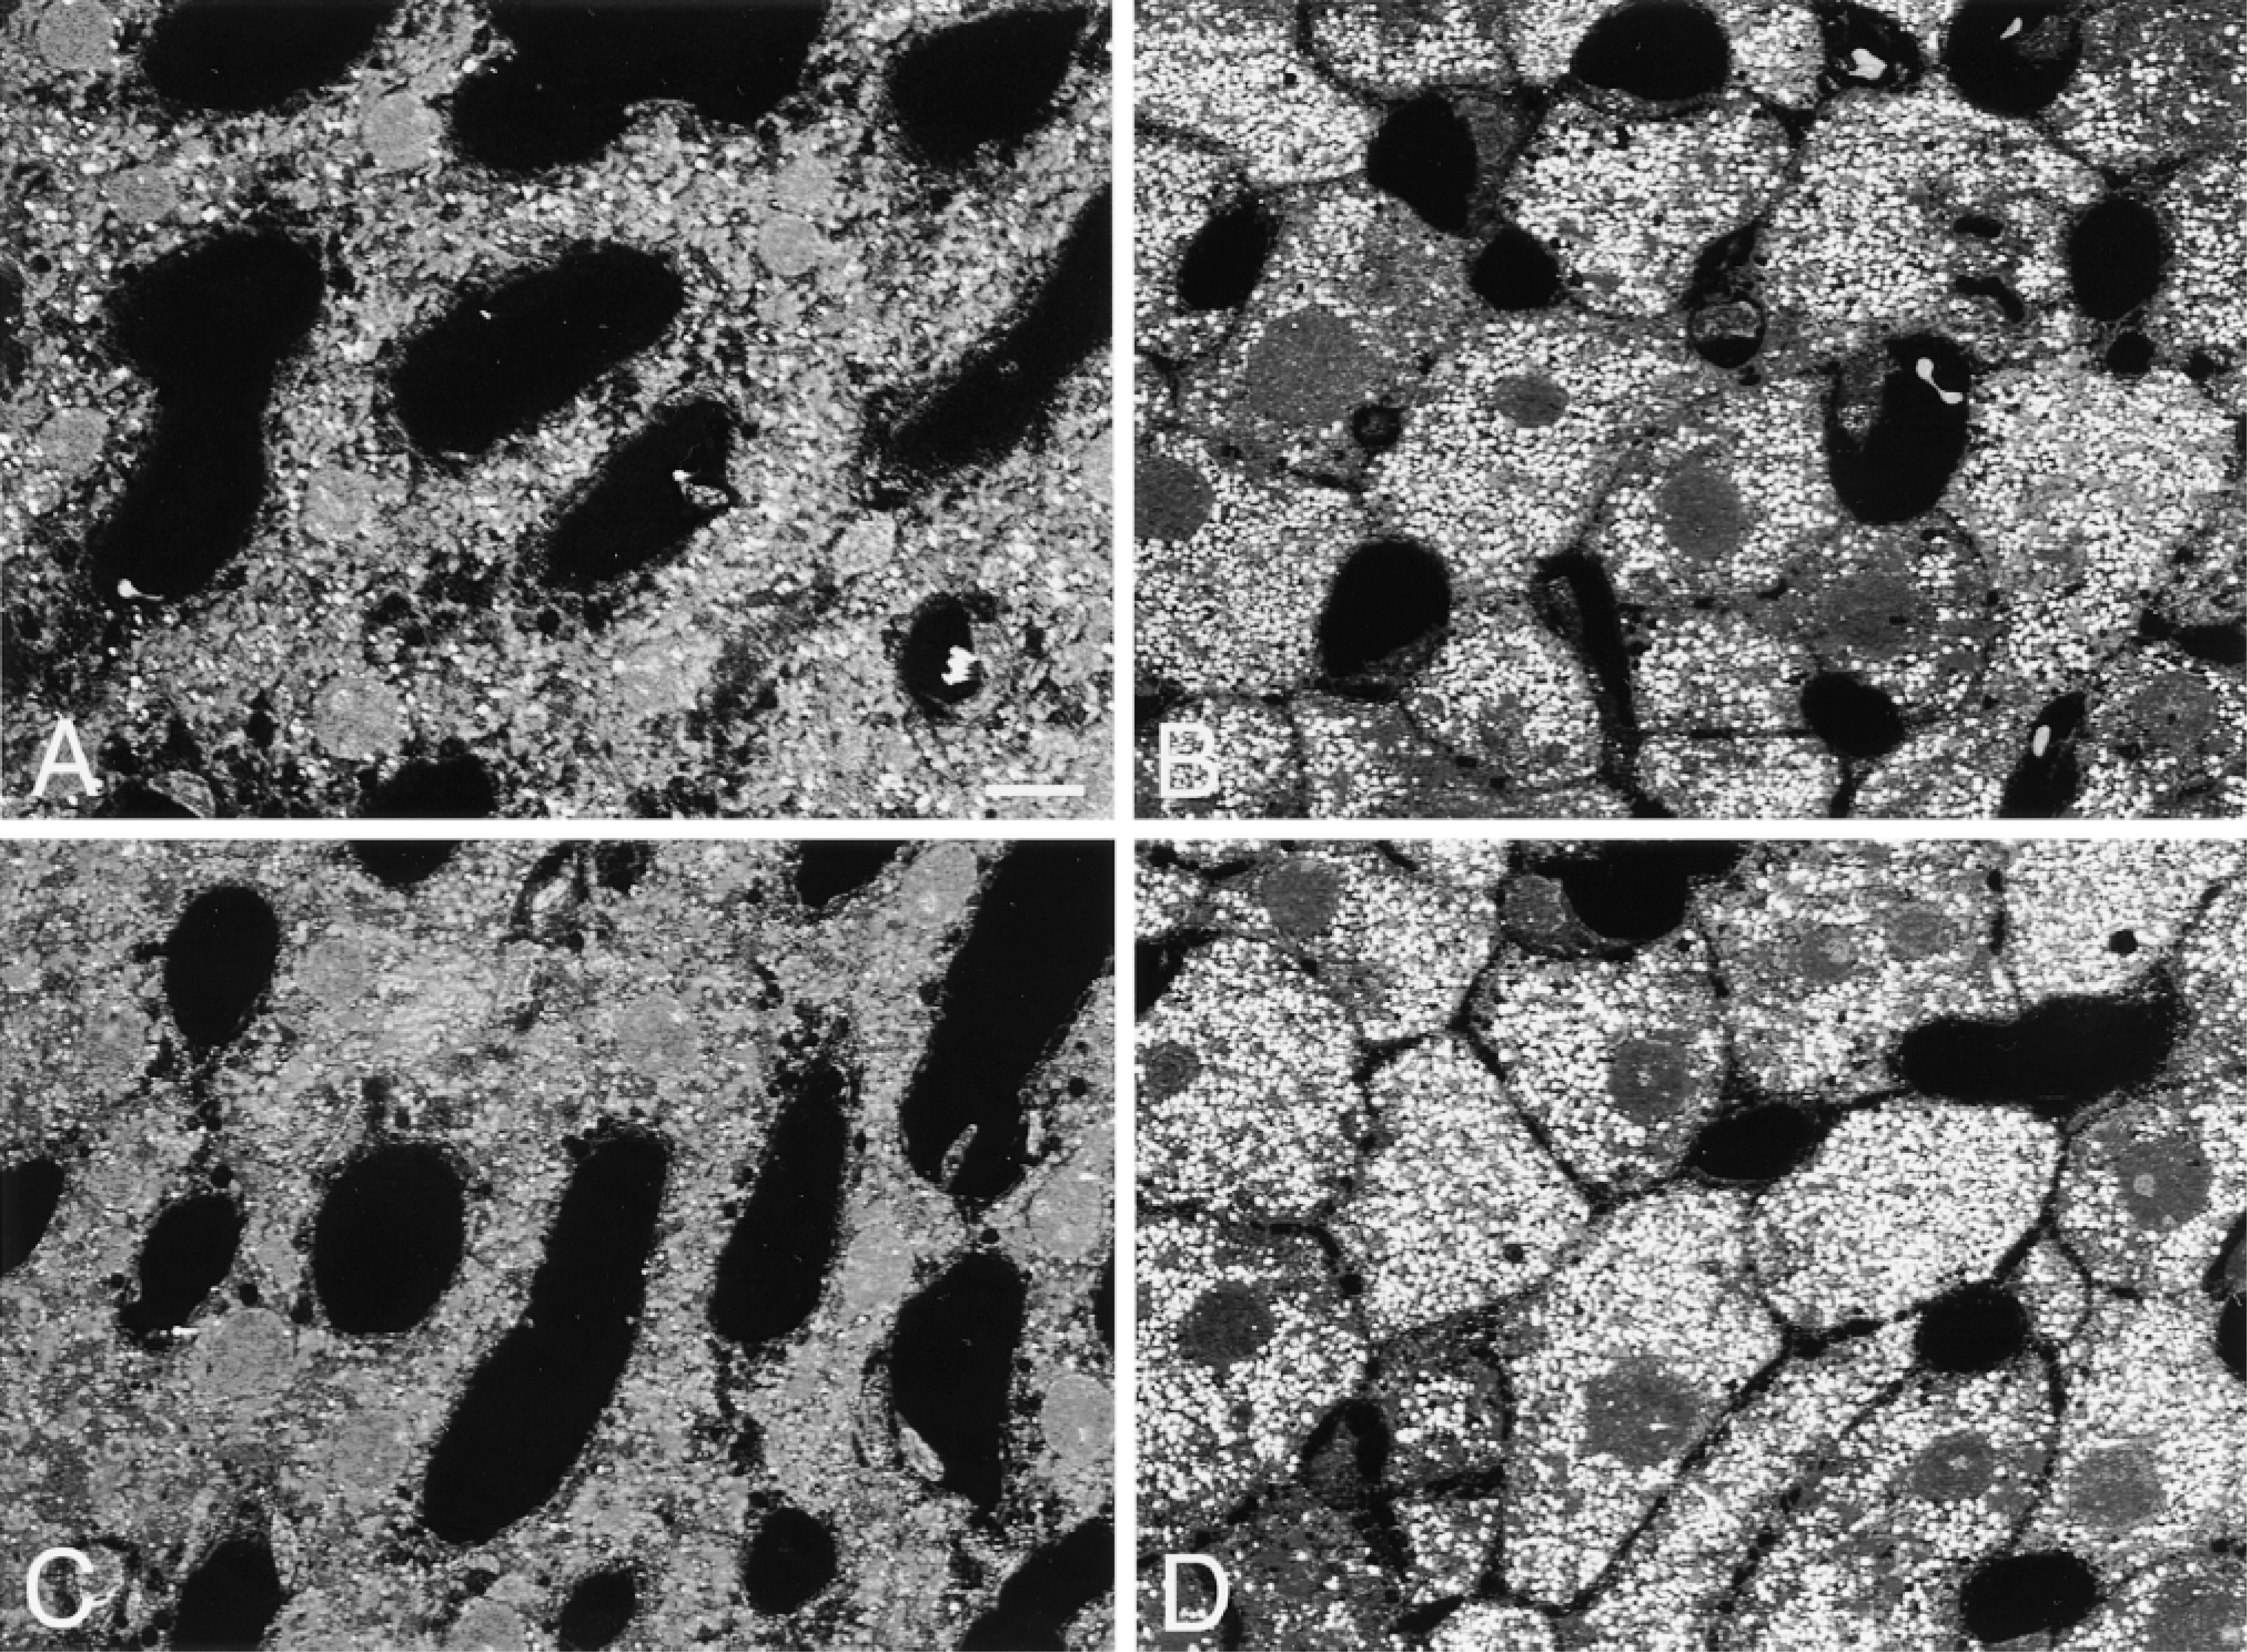
Light micrographs of liver tissues observed by CLSM. Normal (A,C) and DOP-treated tissues (B,D) stained for catalase (A,B) and PH (C,D) by the protein A-gold technique. The intensity of reflection varies among groups. Bar = 10 μm.
Confocal Laser Scanning Microscopy and Quantitative Measurement
One-μm sections were collected on aminopropyl-triethoxysilene-coated glass slides. They were stained in the same solution and with the same incubation time as for immunoelectron microscopy. Specimens were examined with a confocal laser scanning microscope (TCS NT; Leica Lasertechnik, Heidelberg, Germany). The CLSM was equipped with an Ar-Kr laser having three major emission lines at wavelengths of 488 nm, 568 nm, and 647 nm. The 488-nm line was employed because the intensity of this line is the most sustainable. The reflecting light from the specimens at 488 nm was captured by a photomultiplier. The reflection light incidents of the images were digitized in 256 grades (28 grades), i.e., the reflection from the area of sinusoids was set to 0 and that from normal peroxisomes stained for catalase to 255, so that the values of all four groups fitted this range. Fifteen randomly selected lines under which 50 peroxisomes were present were evaluated in each group. The value for each peroxisome was obtained by subtracting the average of the cytoplasmic reflection from the peroxisomal reflection. Figure 1 shows an example of the procedure for measurement of the light reflection from a specimen stained by the protein A-gold technique. Figure 1A is a digitized image of normal liver tissue stained for catalase. The sinusoid, cytoplasm, and three intense signals are located under the line. Figure 1B shows the line intensity of the reflection light measured. The same measurement condition as in normal hepatocytes stained for catalase was applied to the other three kinds of specimens. Control staining was performed using the IgG fraction of nonimmune serum instead of antibodies.
Effect of Antibody Concentration
Another experiment was carried out to determine the effect of the concentration of the antibody on the relationship between the data of the two procedures: measurement with electron microscopy and that with CLSM. Serial sections of DOP-treated liver tissue were stained for both procedures as described above with various concentrations of anti-catalase antibody, 0.32, 1.6, 8, and 40 μg/ml of IgG.
Statistical Analysis
Data obtained by immunoelectron microscopy and by CLSM were statistically analyzed by analysis of variance (ANOVA) and the differences between respective groups were judged to be significant at p<0.05.
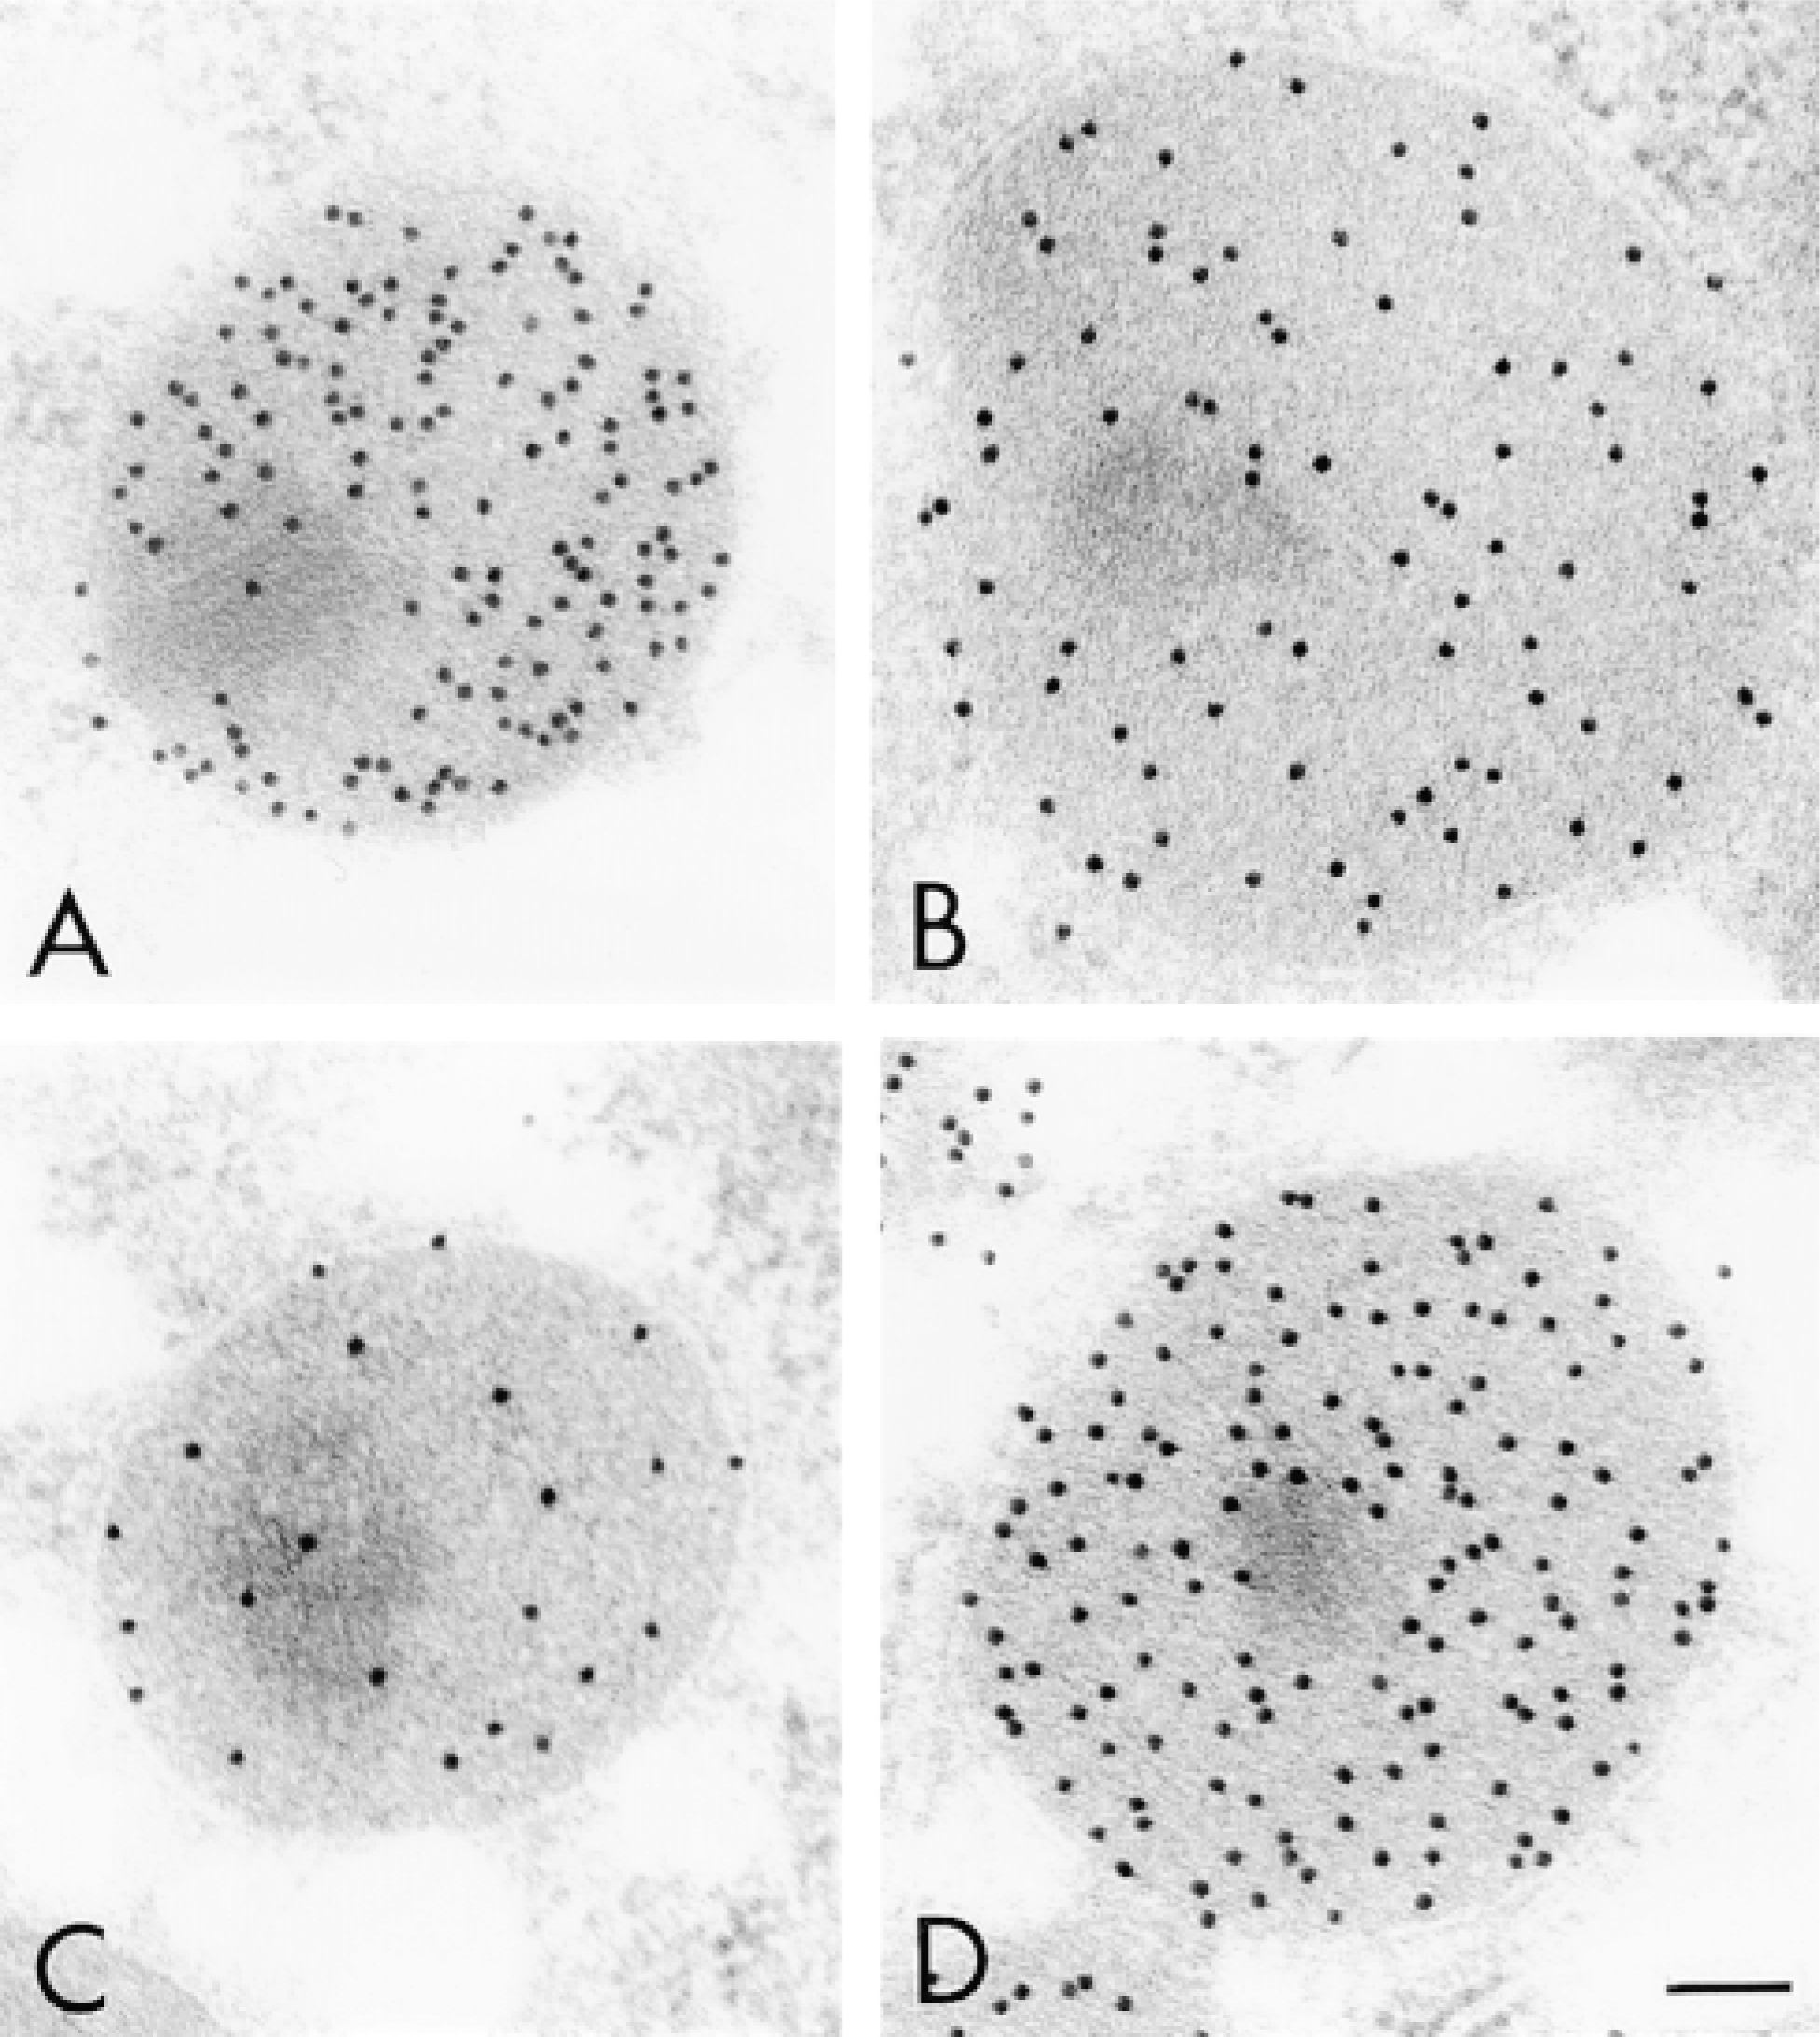
Electron micrographs of hepatic peroxisomes of normal (A,C) and DOP-treated rats (B,D) stained for catalase (A,B) and PH (C,D) by the protein A-gold technique. Bar = 0.1 μm.
Results and Discussion
In the observations using CLSM, an increase in the number of peroxisomes was evident in the DOP-treated hepatocytes compared with normal hepatocytes (Figure 2). In addition, the difference in the intensity of the reflection from peroxisomes could be recognized in the four groups by careful observation. A small number of intense light reflections were observed over normal hepatocytes stained for catalase (Figure 2A), and many but less intense reflections were observed over DOP-treated hepatocytes (Figure 2B). A small number of light reflections were observed over normal hepatocytes stained for PH (Figure 2C). However, the observation was difficult because of the weakness of light reflections. Many intense light reflections were observed over DOP-treated hepatocytes (Figure 2D). On electron microscopic observation, peroxisomes of normal hepatocytes stained for catalase by the protein A-gold technique were densely labeled with gold particles (Figure 3A) but those of DOP-treated hepatocytes were less so (Figure 3B). Staining of peroxisomes of normal hepatocytes for PH was rather weak (Figure 3C) but those of DOP-treated hepatocytes were densely labeled (Figure 3D).
The labeling density for peroxisomes calculated on electron micrographs and the intensity of light reflection from peroxisomes measured by CLSM are summarized in Figure 4. The intensity levels of light reflections measured by CLSM for the four were in the following order: normal peroxisomes stained for catalase; DOP-treated peroxisomes stained for PH; DOP-treated peroxisomes stained for catalase; and normal peroxisomes stained for PH (Figure 4A). The labeling densities for the four groups calculated on electron micrographs were in the same order (Figure 4B). The labeling density on electron microscopic observation and the intensity of light reflection by CLSM were in a good mutual relationship, approximately in a line (Figure 4C). A similar comparison of the data from these two procedures was made on another measurement employing serial sections of DOP-treated hepatocytes stained for catalase with various concentrations of the antibody. The labeling density and the intensity of the light reflection were ordered according to the concentration of the antibody. These two were also well correlated with high concentrations of the antibody, but the value for the lowest (0.32 μg/ml) appeared not to be within the linear range (Figure 5).
As a way of estimating the changes in the total amount of antigens on electron microscopic specimens stained by the protein A-gold technique, the total labeling index or immunolabeled concentration (Nemali et al. 1988), i.e., volume density × labeling density, has been employed. A similar estimate was made with CLSM, defining the total labeling index for CLSM as volume density X the intensity of light reflection. An increase in the amount of peroxisome enzymes, in the form of a moderate increase for catalase and a marked increase for PH, was obtained (Table 1). Similarly to the quantification analysis using electron micrographs, quantification by CLSM also revealed an increase in the volume density of peroxisomes and a change in the labeling indices for peroxisomal enzymes (a decrease for catalase and an increase for PH) induced by administration of a peroxisome proliferator. Just as the total labeling indices obtained by the quantification of electron microscopic pictures for both enzymes increased, the labeling index for CLSM also showed an increase. These changes in volume density, labeling density, and labeling index were similar to the data obtained with other kinds of peroxisome proliferators (Beier et al. 1988; Nemali et al. 1988; Beier and Fahimi 1992).
There are several representative immunoelectron microscopic techniques. The immunogold techniques include the protein A-gold technique, the ferritin technique, and the immunoperoxidase technique. The immunogold technique has various advantages because of the particulate and electron-dense reaction products of colloidal gold particles; the ultrastructure behind the gold particles is clearly visible and a higher resolution of the picture is obtainable than with other techniques. Another advantage is quantification of the particles for estimating the amount of antigen in the fine structure, i.e., the number or density of gold particles correlates with the amount of antigen (Griffiths 1993). It is possible to determine the relative concentration of antigens in each ultrastructure (Bendayan et al. 1980), including those in substructures in cell organelles (Usuda et al. 1990,1991a,b), by counting the number of gold particles and calculating the labeling density. The difference in the relative concentration of antigens in the ultrastructure, particularly among various experimental groups, can be estimated, e.g., the changes due to aging (Desjardins and Bendayan 1991; Johkura et al. 1998) and the change in localization or movement of antigens resulting from experimental conditions and disease (Makino et al. 1993). DOP, a plasticizer employed in the present study, is well known for causing remarkable changes in the amount of various peroxisomal enzymes. The protein A-gold technique has been used to demonstrate changes in the ultrastructure of peroxisomes and in the matrix enzymes and membrane polypeptides (Bendayan and Reddy 1982; Nemali et al. 1988; Usuda et al. 1988,1991b; Baumgart et al. 1989).
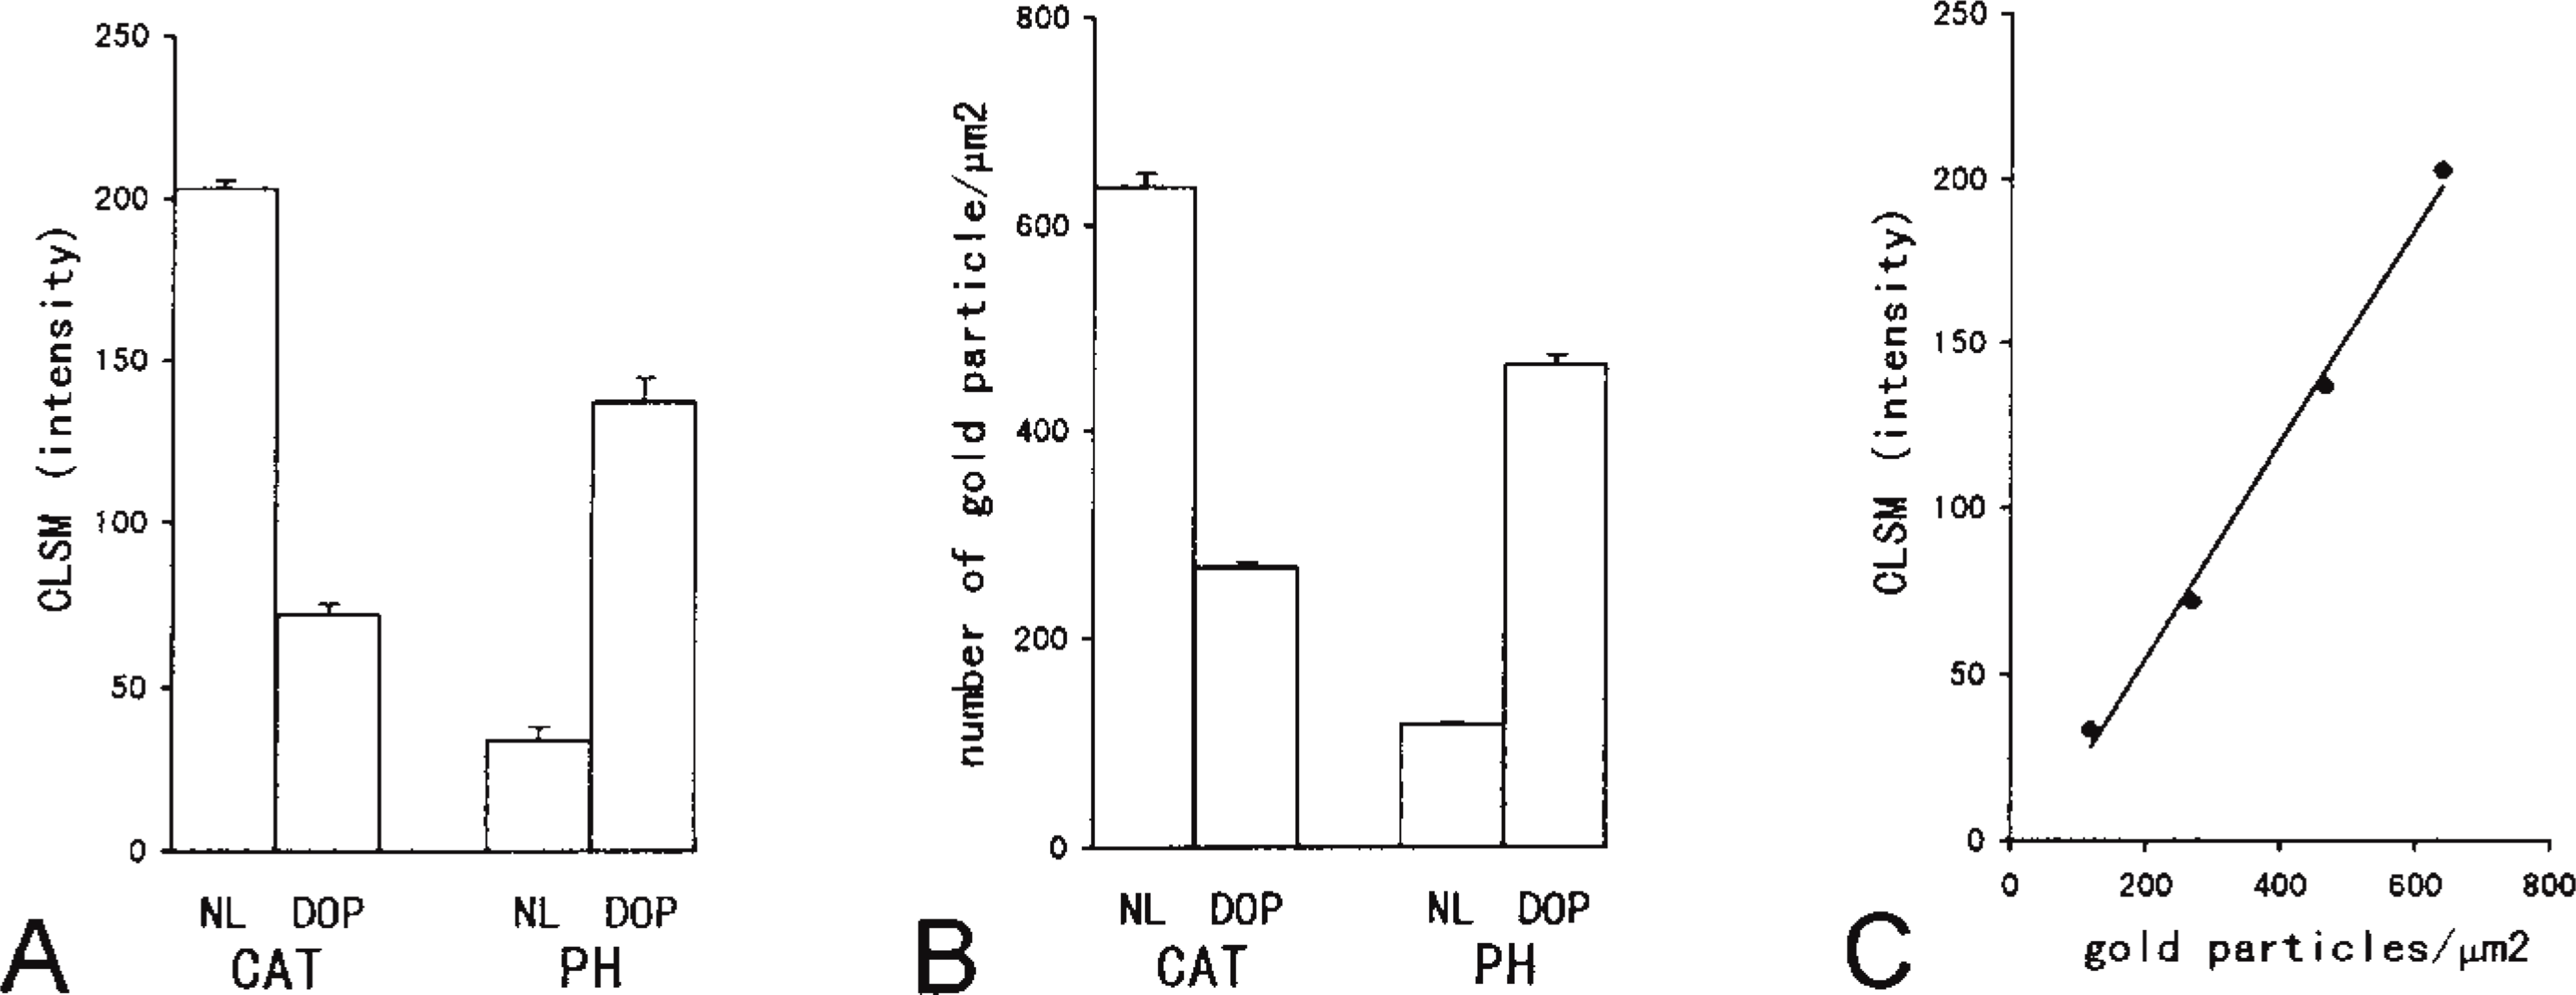
Values measured in peroxisomes by CLSM (A) and the labeling densities of peroxisomes by immunoelectron microscopy (B) and of normal (NL) and DOP-treated (DOP) hepatic peroxisomes stained for catalase (CAT) (40 μg/ml of IgG) and enoyl-CoA hy-dratase/3-hydroxy acyl-CoA dehydrogenase (PH) (40 μg/ml of IgG) by the protein A-gold technique. Values (shown as means ± SE) are significantly different (p < 0.05) among all groups by ANOVA in each procedure. (C) Correlation of the values obtained by the two procedures.
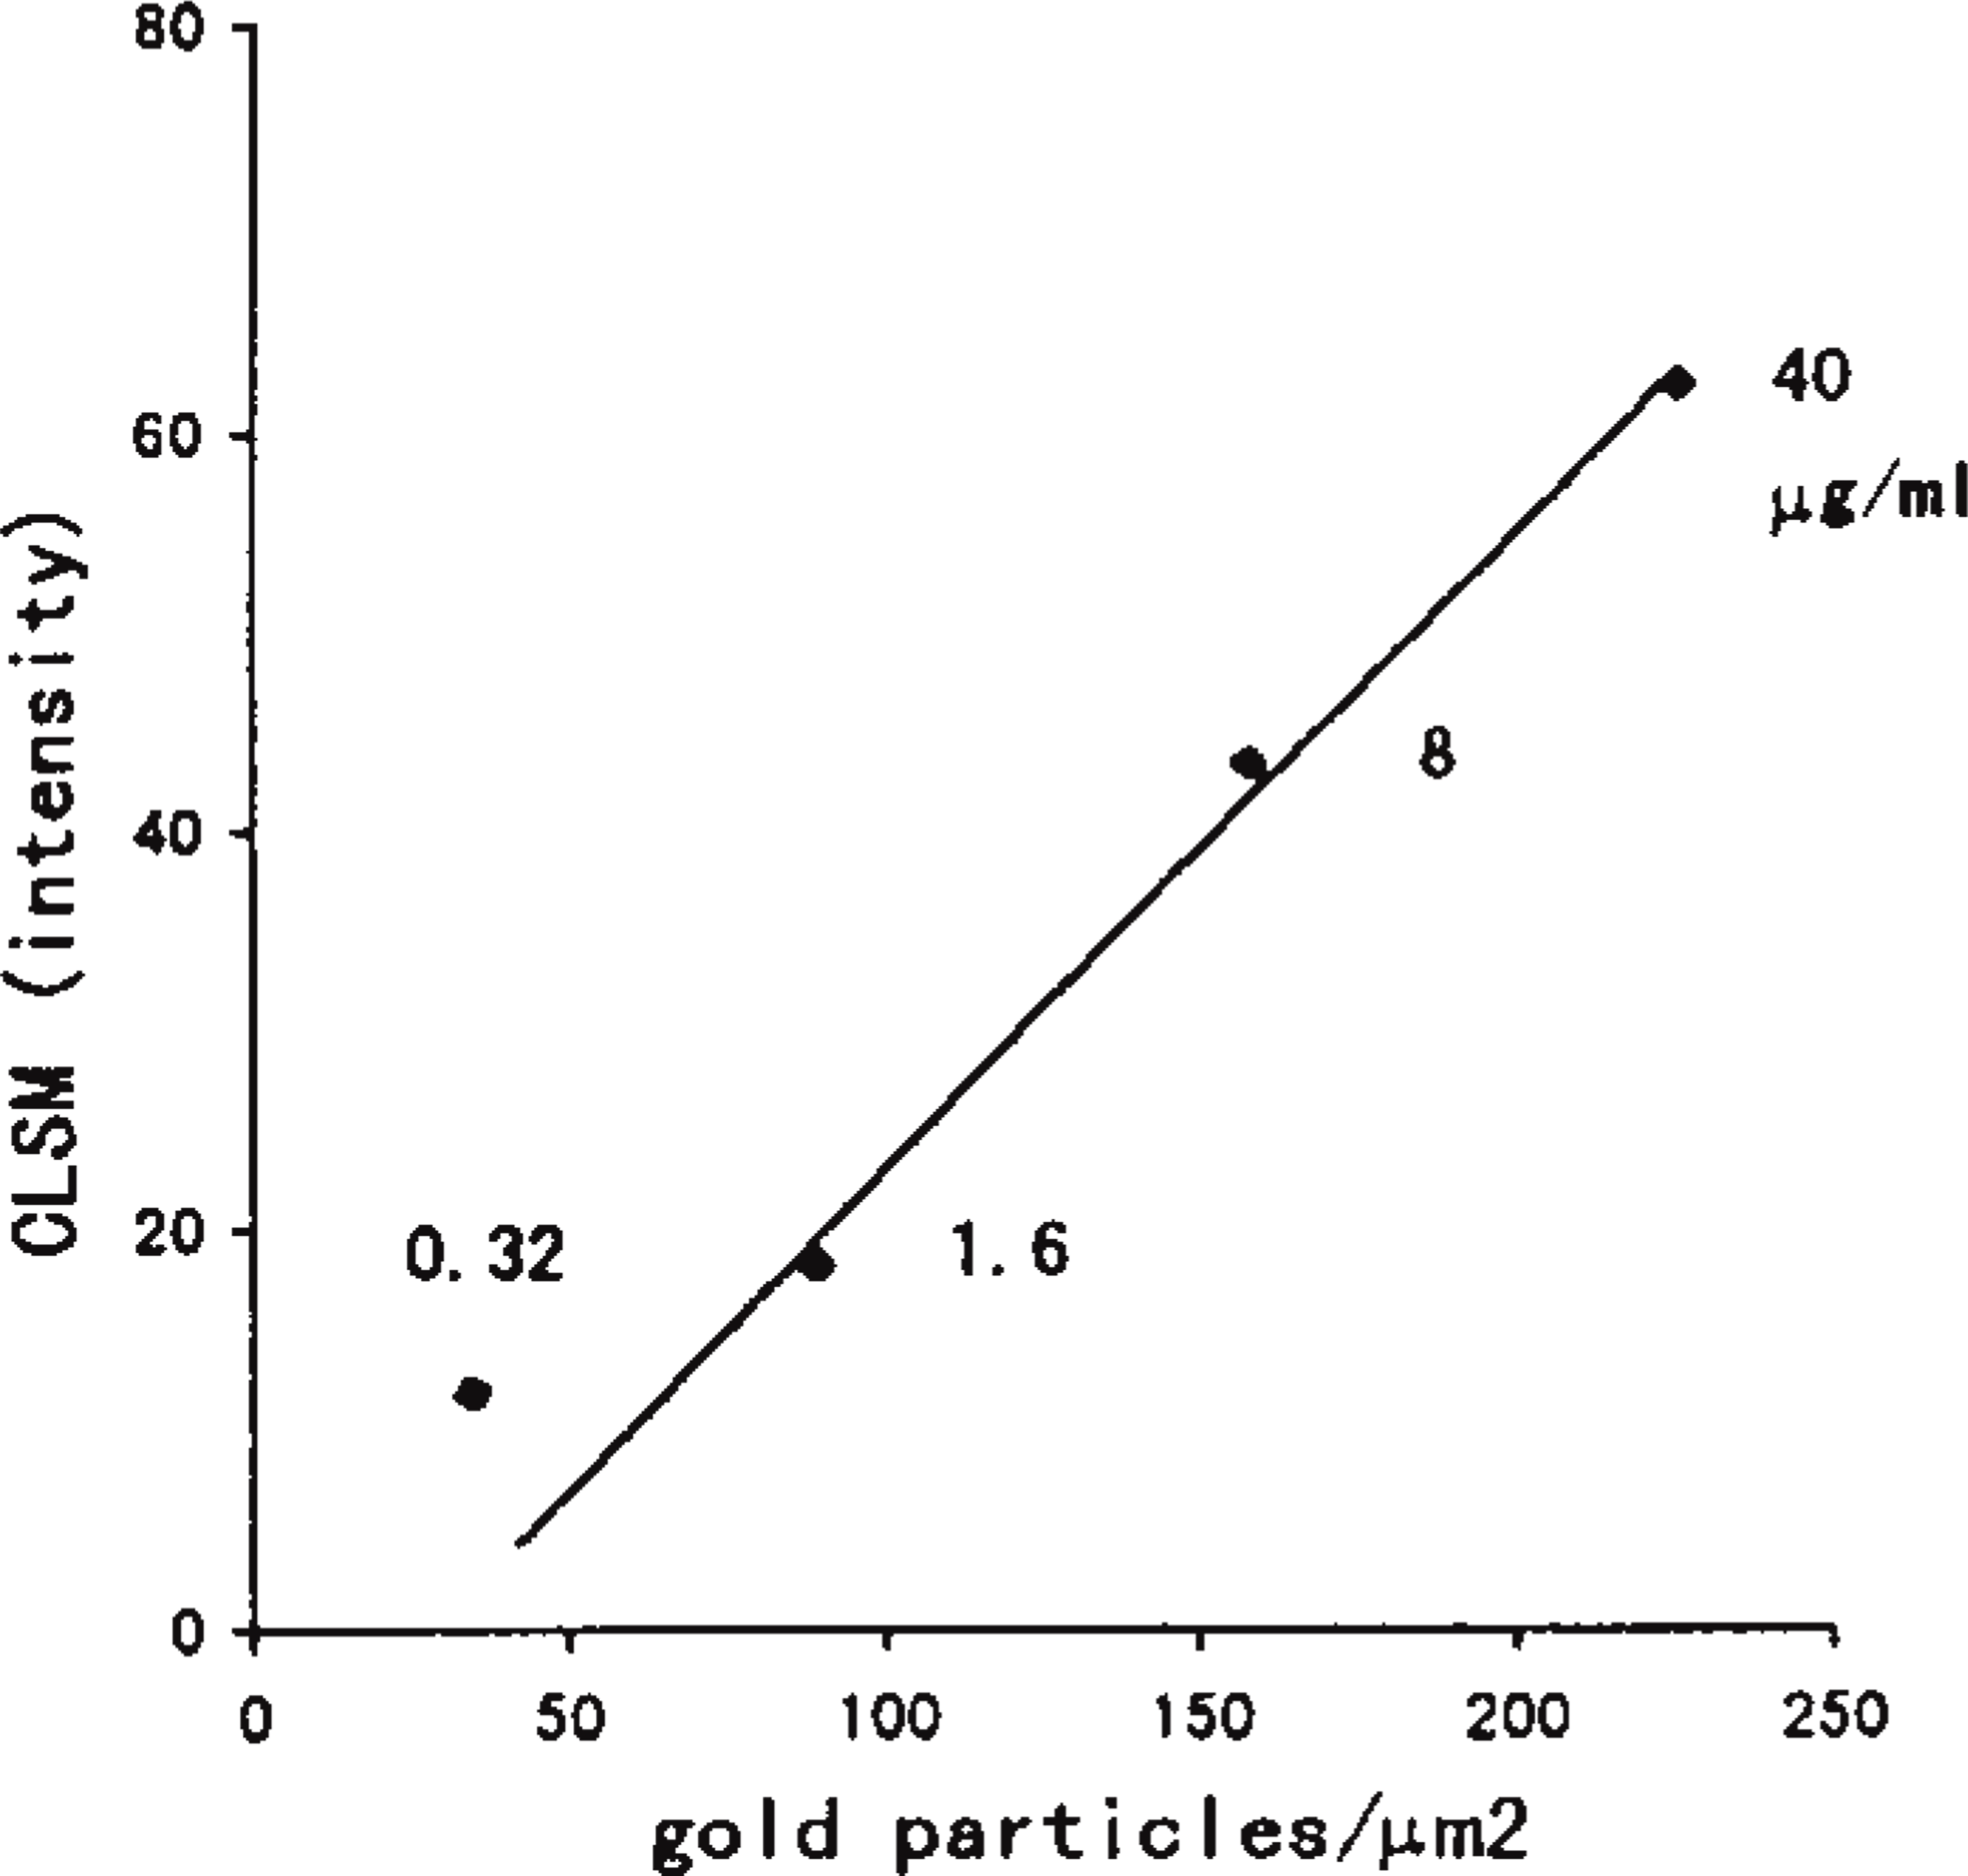
The relationship between the labeling densities on immunoelectron microscopy and the values measured by CLSM on peroxisomes. DOP-treated liver tissues were stained with various concentrations of anti-catalase antibody (0.32, 1.6, 8, and 40 μg/ml of IgG) employing the protein A-gold technique.
Changes (the ratio of DOP to control) in the volume density of peroxisomes, labeling density or intensity of light reflection, and total labeling index of catalase and PH on DOP administration a
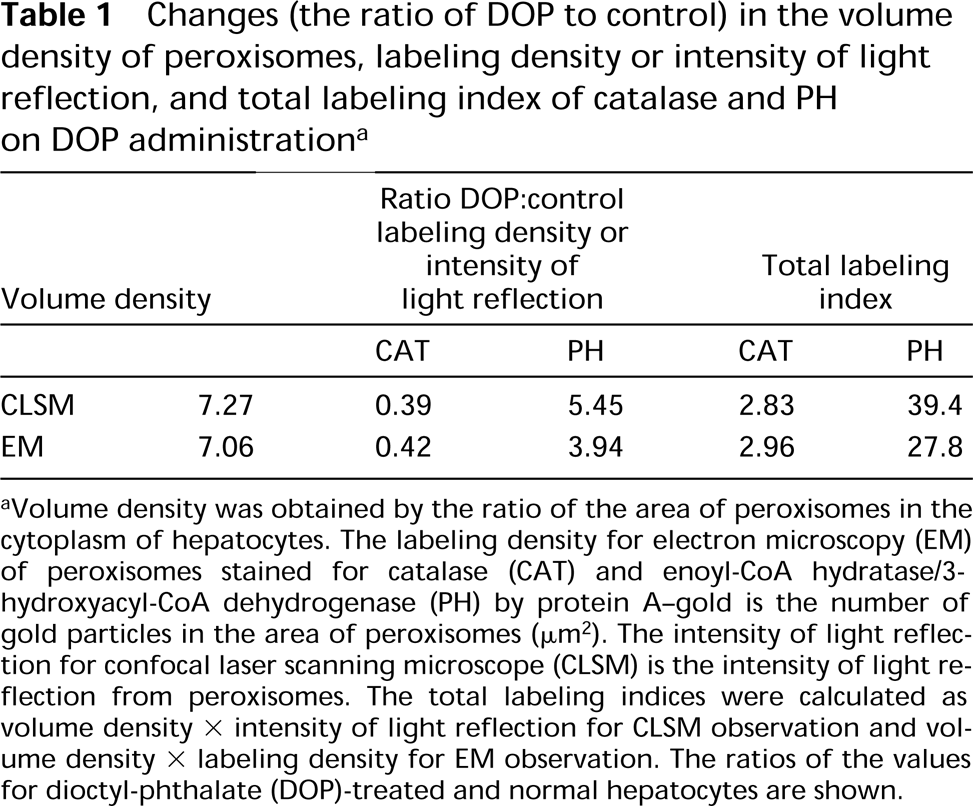
Volume density was obtained by the ratio of the area of peroxisomes in the cytoplasm of hepatocytes. The labeling density for electron microscopy (EM) of peroxisomes stained for catalase (CAT) and enoyl-CoA hydratase/3-hydroxyacyl-CoA dehydrogenase (PH) by protein A-gold is the number of gold particles in the area of peroxisomes (μm2). The intensity of light reflection for confocal laser scanning microscope (CLSM) is the intensity of light reflection from peroxisomes. The total labeling indices were calculated as volume density X intensity of light reflection for CLSM observation and volume density X labeling density for EM observation. The ratios of the values for dioctyl-phthalate (DOP)-treated and normal hepatocytes are shown.
Although the immunogold technique has ordinarily been used for electron microscopy, it can also be used for light microscopic observation without any intensification, thanks to the CLSM (Van den Pol 1989). There are a number of advantages to the observation by CLSM of specimens stained by the protein A-gold technique. Because a wider area can be observed by CLSM than by electron microscopy and the reflection light in CLSM is intense, the distribution of the antigens or immunoreactive cell organellae can be visualized over the whole tissue area. As the labeling density and the total labeling index of gold particles observed by electron microscopy correlated with the light reflection and the total labeling index observed by CLSM as presented in this study, those by CLSM can indicate the relative amount of the antigen. The labeling index reflects the total amount of the antigen. The CLSM has also been employed on specimens stained by the immunofluorescent technique to estimate the amount of antigen (Good et al. 1992; Larsen et al. 1994; Verschure et al. 1994). This may be possible in theory but it appears to be impossible in practice owing to the attenuation of the fluorescence during observation. Accordingly, quantification of the reaction products of immunostaining by CLSM should be done on specimens stained not by the immunofluorescent technique but by the protein A-gold technique, in which attenuation of the reflection light never occurs. Observation by CLSM of cell organelles and quantification of the reaction products on specimens stained by the protein A-gold technique, of course need to be done side by side with electron microscopic observation because CLSM can not recognize the ultrastructure needed to distinguish the kinds of immunoreactive cell organelles.
In the observation of specimens stained by the protein A-gold technique, the change in the labeling density of gold particles shown by electron microscopic observation correlates with the change in the reflection intensity measured by CLSM observation, which is especially suitable for specimens densely labeled by protein A-gold particles. Because a wider area of specimens can be observed by CLSM than by electron microscopy, a highly reliable estimate of the amount of antigens in the tissues stained by the protein A-gold technique is possible by CLSM observation combined with electron microscopy.
Footnotes
Acknowledgements
Supported in part by grants-in-aid for scientific research from the Ministry of Education of Japan.
We gratefully thank Dr T. Hashimoto (Department of Pathology, Northwestern University Medical School) for kind guidance in purifying enzymes and raising antibodies, and Y. Furihata (Kamijo Kikai Co., Ltd.) for technical advice.