
Abstract
The response of T-cells to peptide antigen plus major histocompatibility complex (MHC) consists of a series of cellular events collectively called T-cell activation. An essential component of this pathway is phospholipase C (PLC)γ 1, whose hydrolytic activity increases rapidly after binding of ligands to the T-cell receptor (TCR) and consequent activation of tyrosine kinases. Recent studies also suggest a GTP binding protein-dependent activation of PLCβ during the early steps of T-cell activation. On the basis of these findings, we first checked the expression of PLC isoforms by Western blotting and by confocal and electron microscopy techniques, and then we looked for the phosphoinositide breakdown induced by CD3 engagement in cord and adult T-lymphocytes. Our results indicated that PLCβ1 was almost exclusively expressed in cord T-cells, whereas PLC β2 was more strongly represented in the adult. The amount of PLCγ 1 was found to be larger in the adult than in cord cells. No significant differences were found in PLCγ 2 and $2 expression. PLCγ 1 was scarcely detectable. On CD3 stimulation, adult lymphocytes gave rise, as expected, to a dramatic increase in phosphoinositide breakdown, whereas in cord cells this response was scarcely detected. These results indicate that a shift in PLC expression occurs in the postnatal period and that this change is associated with induction of the capability to respond to CD3 engagement with phosphoinositide hydrolysis.
Keywords
C
Materials and Methods
T-lymphocyte Isolation
Mononuclear fractions were prepared from umbilical cord blood and from peripheral blood of women immediately before delivery. For positive isolation of CD2+ cells, mononuclear cells were incubated with magnetic beads coated with an anti-CD2 MAb (Dynal; Oslo, Norway) for 30 min at 4C with gentle rotation. Isolated CD2+ cells were recovered by means of a magnet and used for immunoprecipitation of PLC isoforms. Alternatively, mononuclear fractions were depleted first from adherent cells by incubating samples in plastic dishes overnight and then from B-lymphocytes using magnetic beads coated with an anti-CD19 MAb (Dynal). The cell suspensions were then used for the immunocytochemical analysis of PLC expression or for the inositol lipid metabolism assay.
PLC Isoform Immunoprecipitation
CD2+ cells (50 million), washed in PBS, were resuspended in lysis buffer [10 mM Tris-HCl buffer, pH 7.4, 1% NP-40, 150 mM NaCl, 1 mg/ml bovine serum albumin (BSA), 1 mM vanadate, 50 mM sodium fluoride] and left on ice for 30 min. After determination of protein concentration, samples were normalized at 400 μg protein. Lysates were incubated at 4C for 60 min with 1 μg of anti-PLC β1, β2, γ 1, γ 2, $1, or $2 polyclonal antibodies (Santa Cruz Biotechnology; Santa Cruz, CA), previously coupled to goat anti-rabbit IgG magnetic beads. Immunocomplexes were collected by a magnet and washed several times with RIPA buffer (PBS, 1% NP-40, 0.5% sodium deoxycholate, 0.1% SDS) in the presence of protease inhibitors.
Immunoblot Analysis
PLC immunoprecipitates were resuspended in SDS sample buffer, electrophoresed in 8% SDS-PAGE, transferred onto nitrocellulose membranes, and incubated for 1 hr at room temperature (RT) with the respective anti-PLC isoform antibody (Santa Cruz Biotechnology; 1 μg/ml) in wash buffer (10 mM Tris, pH 7.5, 100 mM NaCl, 0.1% Tween-20), 5% nonfat milk. Immunoreactive bands were detected by the ECL system (Amersham; Milan, Italy) using a peroxidaseconjugated goat anti-rabbit IgG antibody (Biorad Laboratories; Hercules, CA) 1:3000 in wash buffer, 5% nonfat milk. Internal controls, obtained by incubating membranes only with secondary antibody, always yielded negative results.
Densitometric Analysis
Densitometric analyses were carried out by means of a Quantimet 500 Plus (Leica; Cambridge, UK) to determine the gray intensity levels, using ISO (transmission density standard Kodak 152-3406; Kodak, Rochester NY).
Confocal Analysis of PLC Isoform Expression
Macrophages and B-depleted samples were fixed in formaldehyde 3.7% and permeabilized with PBS 0.1% Triton X-100. Slides were then incubated with anti-PLC β1, β2, γ 1, γ 2, γ 1, and 82 antibodies (1:100; Santa Cruz Biotechnology) and reacted with fluorescein (FITC)-conjugated anti-rabbit IgG an tibody (1:100; Molecular Probes, Eugene, OR). To avoid unspecific binding, all antibody solutions were prepared in PBS, 4 mg/ml NGS, 4 mg/ml human IgG. Samples were then mounted in glycerol containing 1 μg/ml propidium iodide (PI) to counterstain nuclei. To check the experimental procedures, slides were incubated only with the secondary antibody, and did not show any FITC labeling. Confocal analysis was carried out with a TCS 4D (Leica; Heidelberg, Germany). To compare the expression of the isozymes in cord and adult blood samples, the laser beam output energy, the detector voltage, and the pinhole in front of the photomultiplier, differently set for FITC and PI acquisition, were maintained constant during the observation. The serial optical sections obtained by excitation of FITC and PI were finally merged and analyzed by a 3D processing system.
Immunoelectron Microscopy
T-cells were fixed in 4% paraformaldehyde in 0.1 M cacodylate buffer for 1 hr at 4C. Pellets were dehydrated in dimethylformamide and embedded in Lowicryl K4M, followed by UV polymerization. To block nonspecific binding sites, grids were treated with a blocking buffer (PBS, 0.1% Tween, 0.1% BSA, 1% nonfat milk, 3% NGS), pH 7.6 for 30 min at RT. Sections were incubated with the anti-PLC isoforms β1, β2, γ 1, and γ 2 diluted 1:5 in blocking buffer for 2 hr, followed by a secondary antibody conjugated with 20-nm colloidal gold particles (BioCell, Cardiff, UK; 1:5 in blocking buffer, pH 8.2). Grids were stained with uranyl acetate and examined with a Zeiss 109 electron microscope at 80 kV. Grids incubated only with the secondary antibody represented the negative control of the experimental procedure and did not display any reactivity.
Phosphoinositide Hydrolysis
Macrophage- and B-lymphocyte-depleted samples were incubated with [3H]-myoinositol (35 μCi/ml, 10-20 Ci/mmol; Amersham) for 2 hr at 37C in RPMI 1640 50% autologous serum. The cells were rinsed twice with HEPES-buffered RPMI 1640 containing 20 mM LiCl and 1 mg/ml BSA and incubated in the same solution at 37C for 15 min. Samples were then incubated with anti-CD3 antibody (Sigma; Milan, Italy) or with isotype control antibody (10 μg/107 cells). The antibody was allowed to bind for 30 min on ice and stimulation was initiated by incubation in a 37C water bath for 2 min. Immediately after this incubation, 5 ml of ice-cold PBS was added and cells were collected by centrifugation at 4C. After washes in PBS, pellets were treated with 0.6 ml of ice-cold 7.5% perchloric acid. Cell debris was pelletted by centrifugation and supernatants were diluted 1:15 with 30 mM ammonium formate/2 mM Na-tetraborate and applied to an AG1-X8 ion exchange column (Biorad Laboratories). The elution of the inositol phosphate esters from the column was performed by stepwise addition of 60 mM ammonium formate/5 mM sodium tetraborate (for glycerophospho[3H]-inositol); 0.2 M ammonium formate/0.1 M formic acid (for [3H]-InsP); 0.4 M ammonium formate/0.1 M formic acid (for [3H]InsP2); 0.8 M ammonium formate/0.1 M formic acid (for [3H]-InsP3); 1.2 M ammonium formate/0.1 M formic acid (for [3H]InsP4). Eluted fractions were then analyzed by β-scintillation counting.
Results
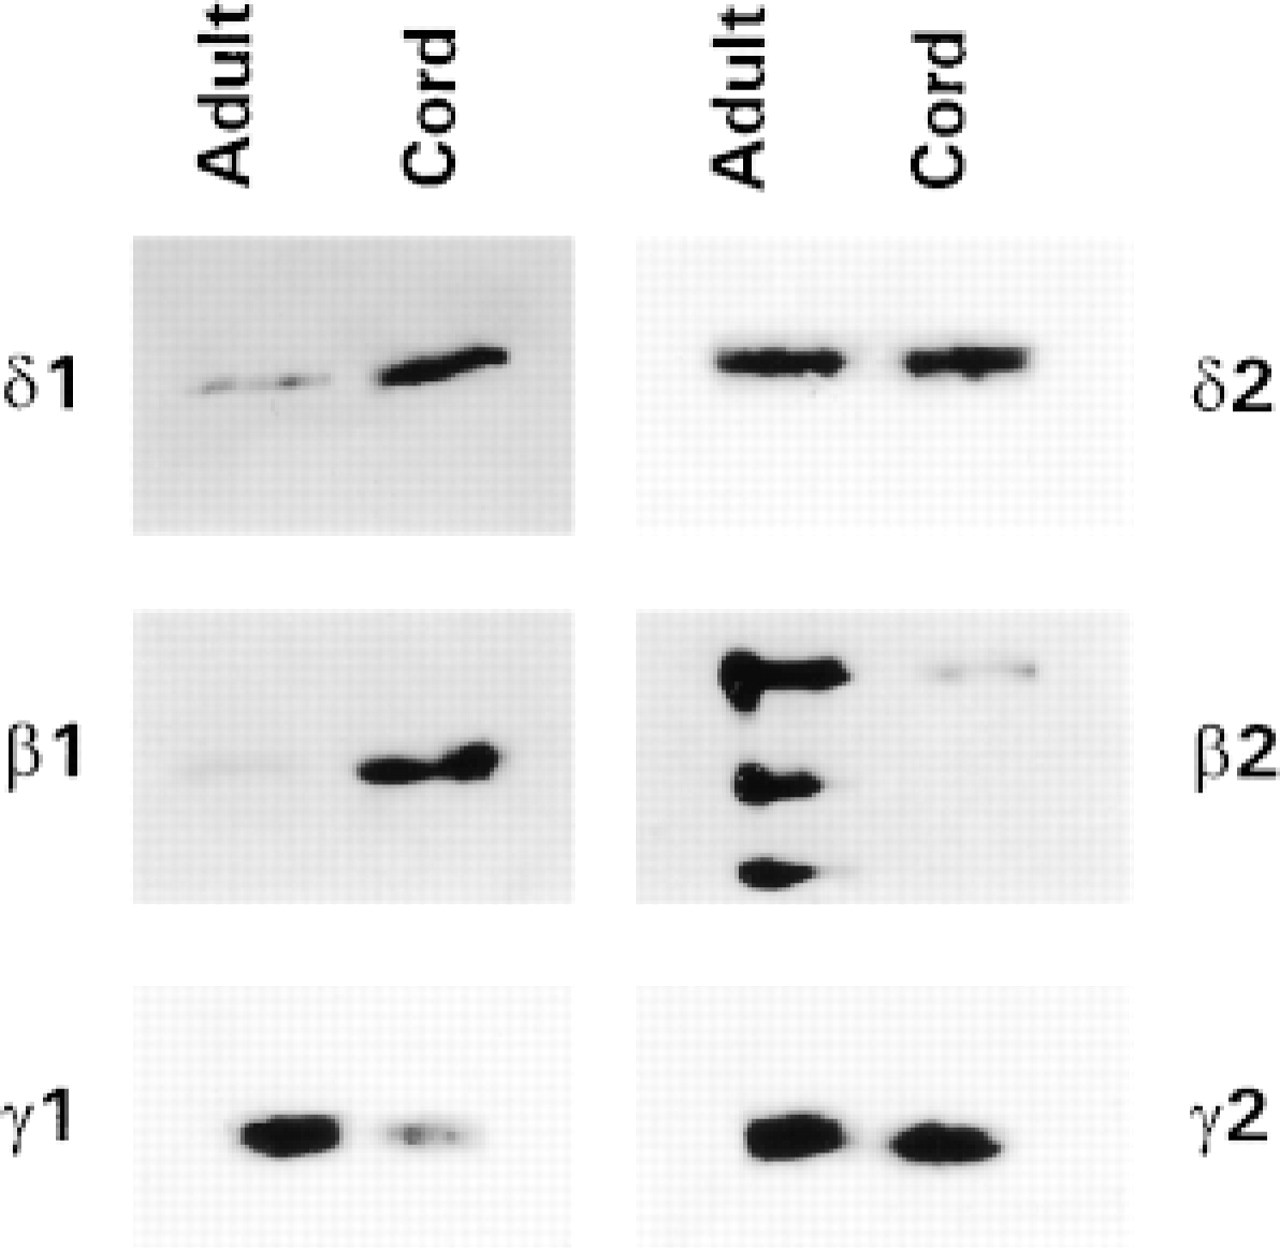
Immunoprecipitation of PLC isoforms from adult and cord blood T-lymphocytes. PLC isoforms were immunoprecipitated from equal amounts (400 μg) of proteins from adult and cord CD2+ cells and were analyzed by Western blotting with the respective anti-PLC isoform antibodies. Relative to the general expression of the other isoforms, low levels of PLC≈1 were detected in both the adult and the cord sample, but to a greater extent in the latter. PLC≈2 appeared equally expressed. PLCβ1 was almost absent in the adult but was strongly detectable in the cord. An opposite pattern of expression was found for PLCβ2. The immunoreaction was intense in the adult sample and weaker in the cord sample. The presence of multiple bands was due to the formation of hydrolytic products in the absence of calpain inhibitors. The expression of PLCγ 1 was higher in adult, whereas PLCγ 2 was strongly expressed in both samples. The blots are representative of five independent experiments.
Immunoprecipitation of the different PLC isoforms from equal amounts of cord and adult T-lymphocyte protein was performed and each immunoprecipitated isoform was detected by Western blotting. As shown in Figure 1, in adult T-lymphocytes PLCβ2 and PLCγ 1 are strongly represented, whereas the reaction in cord cells displayed a lower expression of such isozymes. PLCβ1 immunoreaction was higher in cord T-cells. No critical differences in PLCγ 2 expression were detected between cord and adult T-lymphocytes. PLC≈1 was weakly expressed and slightly higher in the cord. The analysis of PLC≈2 expression did not indicate differences between cord and adult blood T-cells. The densitometric analysis (sum of all gray values obtained from each pixel inside the selected bands) of the Western blots is reported in Table 1 as the mean of five different experiments. Significance of results was determined by Student's t-test. We next sought to determine the intracellular distribution of the PLC isoforms by confocal microscopy. Macrophage- and B-lymphocyte depleted samples were analyzed and the images confirmed the western blot results showing that essentially all the isoforms were located at the cytoplasmic level (green fluorescence), although inside the nucleus (red fluorescence) some light-green granular reaction was also evident to a lower extent (Figure 2). PLCβ1 was mainly represented in cord cells, where green cytoplasmic immunostaining was detected, whereas adult T-lymphocytes were only poorly stained (Figures 2A and 2B). PLCβ2 immunocytochemical analysis, on the other hand, showed a brilliant and homogeneous fluorescence in the cytoplasm of the adult cells, accompanied by distinct evidence of clumped or finely dispersed spots of fluorescence in the nuclear compartment (Figure 2C. A lighter reactivity was detected in cord cells, both at the cytoplasmic and the nuclear level (Figure 2D. Bright PLCγ 1 immunofluorescence was observed in both adult and cord T-lymphocytes, appearing slightly lower in cord (Figures 2E and 2F). No significant differences were detected when lymphocytes were stained for γ 2 (Figures 2G and 2H) and ≈2 (Figures 2I and 2L) expression. The scarce recovery of green fluorescence, together with its rapid fading by the laser beam, did not enable us to acquire the images and to evaluate the cellular distribution of the ≈1-isoform. To assess the specific subcellular distribution of the PLC isoforms, we performed an immunoelectron microscopic analysis on both cord and adult CD2+ cells. Because the expression of PLC≈1 was very weak in both groups and no differential expression of PLC≈2 was observed, we focused our attention on PLCβ and γ. To preserve as well as possible the antigenic properties of these molecules, we embedded the samples in Lowicryl K4M, a resin that is known to minimize reactivity with the antigen (Altman et al. 1984; Dent and Latchmann 1992). In general, the expression and distribution were strongly comparable to those observed by confocal microscopy. Figures 3A and 3B show a stronger expression of PLCβ1 in cord blood than in adult cells. Gold granules appeared scattered throughout the cytoplasm, often distributed close to the nuclear envelope. In the nucleus, on the other hand, the presence of small clusters strongly recalled the dot-like pattern observed by confocal microscopy. With respect to PLCβ2, a regular pattern of distribution was found in the adult cell cytoplasmic compartment and at the plasma membrane level. In the nucleus, the finding of fine and dispersed labeling accounted for the spot-like pattern revealed by the immunofluorescence (Figure 3C. In cord blood cells, the distribution of this isoform was very similar to that found in adult cells, although the dotting of the cord blood cells was less remarkable (Figure 3D. The gold labeling related to PLCγ 1 in adult cells revealed features that differed from those of the other isoforms. Distinct clusters of gold particles scattered throughout fine, dispersed labeling were typically detected (Figure 3E. A clustered organization was also found in cord cells, although the basal diffuse labeling was less evident (Figure 3F. This was in line with the finding of a lower expression in these cells by both Western blot and immunofluorescence analyses. The clustered expression and the topographic arrangement of gold granules related to the PLCγ 2 were similar in the cord and adult blood samples (Figures 3G and 3H). Of interest is that grains of PLCγ 2 strictly associated with mitochondria were frequently observed.
Densitometric analysis of immunoprecipitated PLC isoforms detected by Western blot a
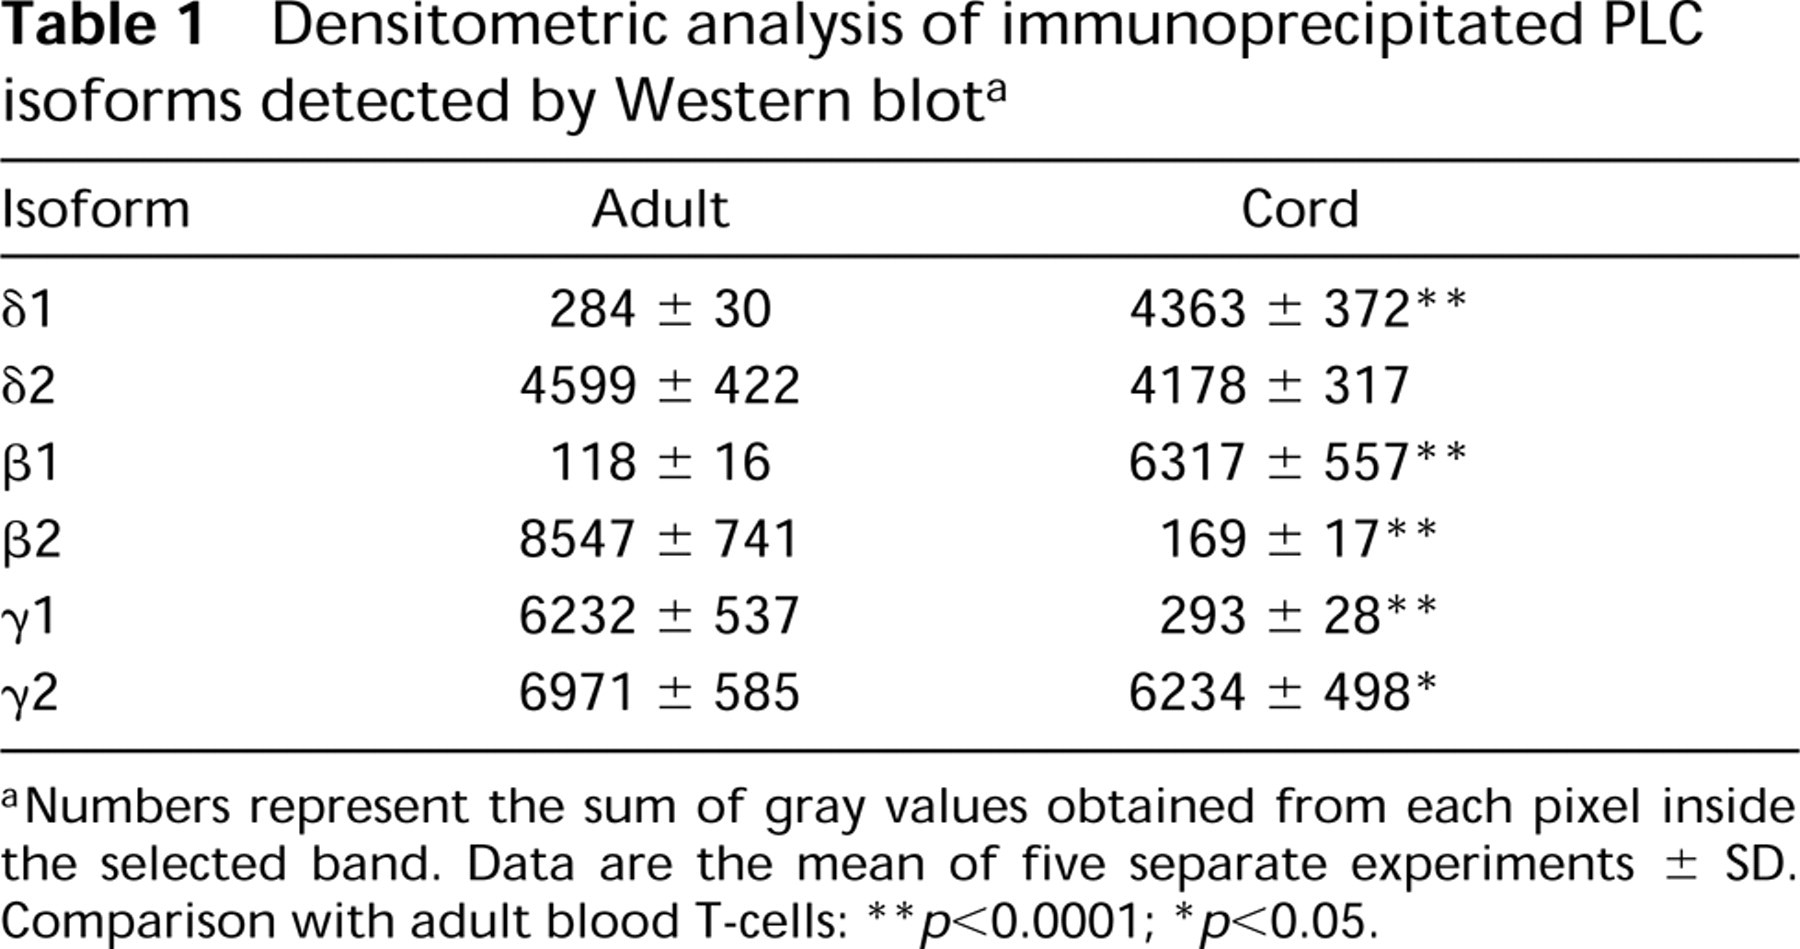
aNumbers represent the sum of gray values obtained from each pixel inside the selected band. Data are the mean of five separate experiments ± SD. Comparison with adult blood T-cells:
∗ p>0.05.
∗∗ p<0.0001;
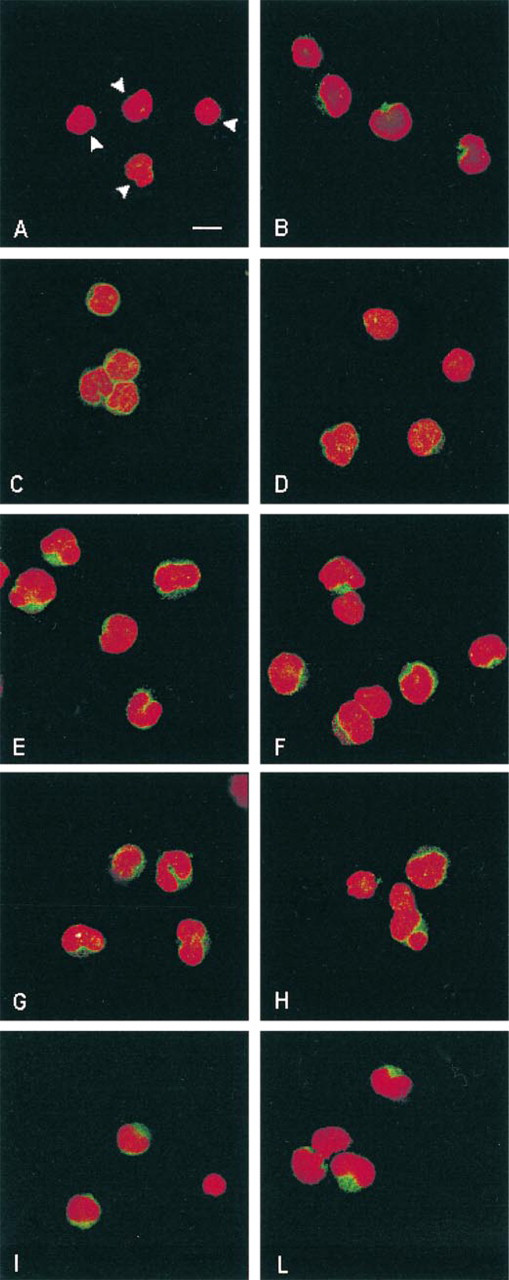
Confocal microscopy analysis of PLC isoform expression and distribution in adult and cord blood T-lymphocytes. The FITC signal (green fluorescence) localizes the different PLCs in the cells, and PI (red fluorescence) counterstains nuclei. PLCβ1 in the adult (
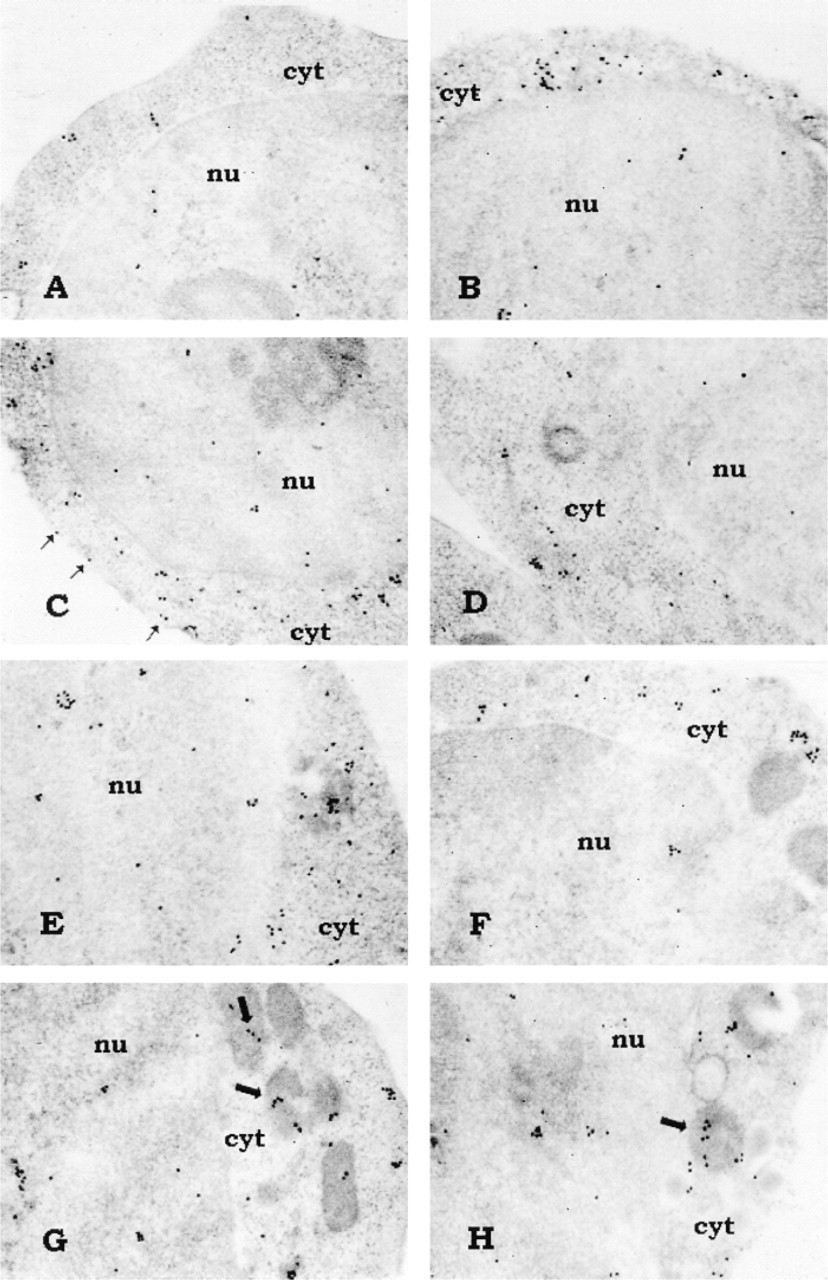
Immunoelectron microscopic analysis of subcellular distribution of PLCβ and γ in adult and cord T-lymphocytes. Relative to adult (
The finding of a differential expression of the PLC isoforms between cord and adult T-cells prompted us to investigate the activity of PLC by measuring phosphoinositide hydrolysis after stimulation of intact cells with anti-CD3. To assess the specificity of the response, adult and cord T-lymphocytes were stimulated with an isotype-matched control antibody. The results (Table 2) clearly indicated that anti-CD3 stimulation of adult T-cells gave rise to high levels of inositol phosphates, whereas in cord T-lymphocytes the production of inositol phosphates was scarcely detectable. Stimulation of both types of T-cells with the isotype-matched control antibody failed to produce any response.
Discussion
Phospholipase C plays a key role in the signal transduction pathway for several hormones and growth factors. It is responsible for the hydrolysis of phosphatidylinositol-bis-phosphate, thus producing two critical intracellular second messenger molecules, diacylglycerol (DAG) and inositol 3,4,5 trisphosphate (IP3). The PLC isozymes can be divided into three types: β, γ, and ≈. Because PLCβ and PLCγ 1 are known to play a pivotal role in the cascade of molecular events generated by T-cell receptor stimulation (Weber et al. 1992; Sieh et al. 1994; Jayaraman et al. 1995), we first addressed our attention to the expression of PLC isoforms in T-lymphocytes from adult and cord blood by different independent techniques. Each cord blood sample was compared to the T-cells derived from the neonate's mother to exclude possible hormone-dependent modulations. By Western blot analysis of immunoprecipitated isoforms, we were able to determine that cord blood cells expressed different relative levels of PI-PLCs compared to adult T-lymphocytes. Such differences were confirmed by confocal microscopy and immunoelectron microscopy. Compared to adult T-cells, cord blood T-lymphocytes showed increased PLCβ1 levels with an interesting inversion of the PLCβ1/β2 ratio, decreased PLCγ 1 levels, and similar expression of PLCγ 2 and ≈2. It should be emphasized that the different distribution of the PLC isoforms is not related to the relative representation of CD4 and CD8 subsets or of natural killer (NK) cells, because the ratio of CD4 and CD8 cells and the proportion of NK cells are invariable in cord and adult blood (Han et al. 1995). Although mainly expressed at the cytoplasmic level, the presence of a certain number of PLC molecules in the nuclear compartment, although to differing extents, was also detected. This observation is of interest because it is consistent with the suggestion of the existence of a pool of nuclear phosphoinositides whose enzymatic apparatus would be autonomous from the well-studied cytoplasmic apparatus (Cocco et al. 1987; Martelli et al. 1992; Payrastre et al. 1992; Garcia-Bustoss et al. 1994; Marmiroli et al. 1994; Miscia et al. 1997). The significance of such a nuclear presence and its possible crosstalk with the cytoplasm remain to be clarified. We next sought to investigate the PLC hydrolytic capability in response to stimulation of adult and cord blood T-cells by analyzing the production of inositol phosphates. The TCR-CD3 coupling in adult cells was able, as expected, to strongly stimulate phosphoinositide hydrolysis, whereas in cord T-cells it gave rise only to sparse hydrolytic activity. On the basis of the findings reported here, a direct correlation of the differential PLC isoform expression between adult and cord T-lymphocytes to the inadequate stimulation of PLC activity can not be obviously stated. Nevertheless, there arise some hypotheses that should be investigated. (a) The different assortment of PLC isoforms in cord T-cells may account for an inefficient coupling of the isozymes to the TCR and, in turn, may determine the failure of PLC stimulation. (b) The impairment of the hydrolytic activity may be due to the low level of PLCγ 1 in cord T-cells or at least might represent a contributing factor. The finding that PLCβ1, although overexpressed in cord T-cells, is unable to rescue the low inositol phosphate production might be explained by the idea that the activation of PLCβ isoforms in T-cells is dependent on a reciprocal regulation between tyrosine kinases and G-proteins (Stanners et al. 1995). Therefore, (c) the occurrence of some as yet to be determined impairment of the tyrosine kinase activation might be responsible for the lack of activation of the enzyme, even when it is highly expressed. (d) Because it has been demonstrated that cord blood contains mainly unprimed virgin or naive T-lymphocytes, defined as a CD45RA subset (Han et al. 1995), that are functionally distinct from the CD45RO subset (memory T-cells), the impaired hydrolytic activity found in cord cells may represent a functional feature of CD45RA cells. This possibility is consistent with the observation that CD4+-naive murine T-cells do not phosphorylate PLCγ 1 in response to antigen stimulation (Ericsson et al. 1996). In this context, further investigations on the specific expression of PLCs in CD45RA and CD45RO subsets will contribute to elucidation of the role of these proteins in T-cell maturation.
CD3-induced inositol phosphate production in adult and cord T-lymphocytes (cpm/106 cells) a
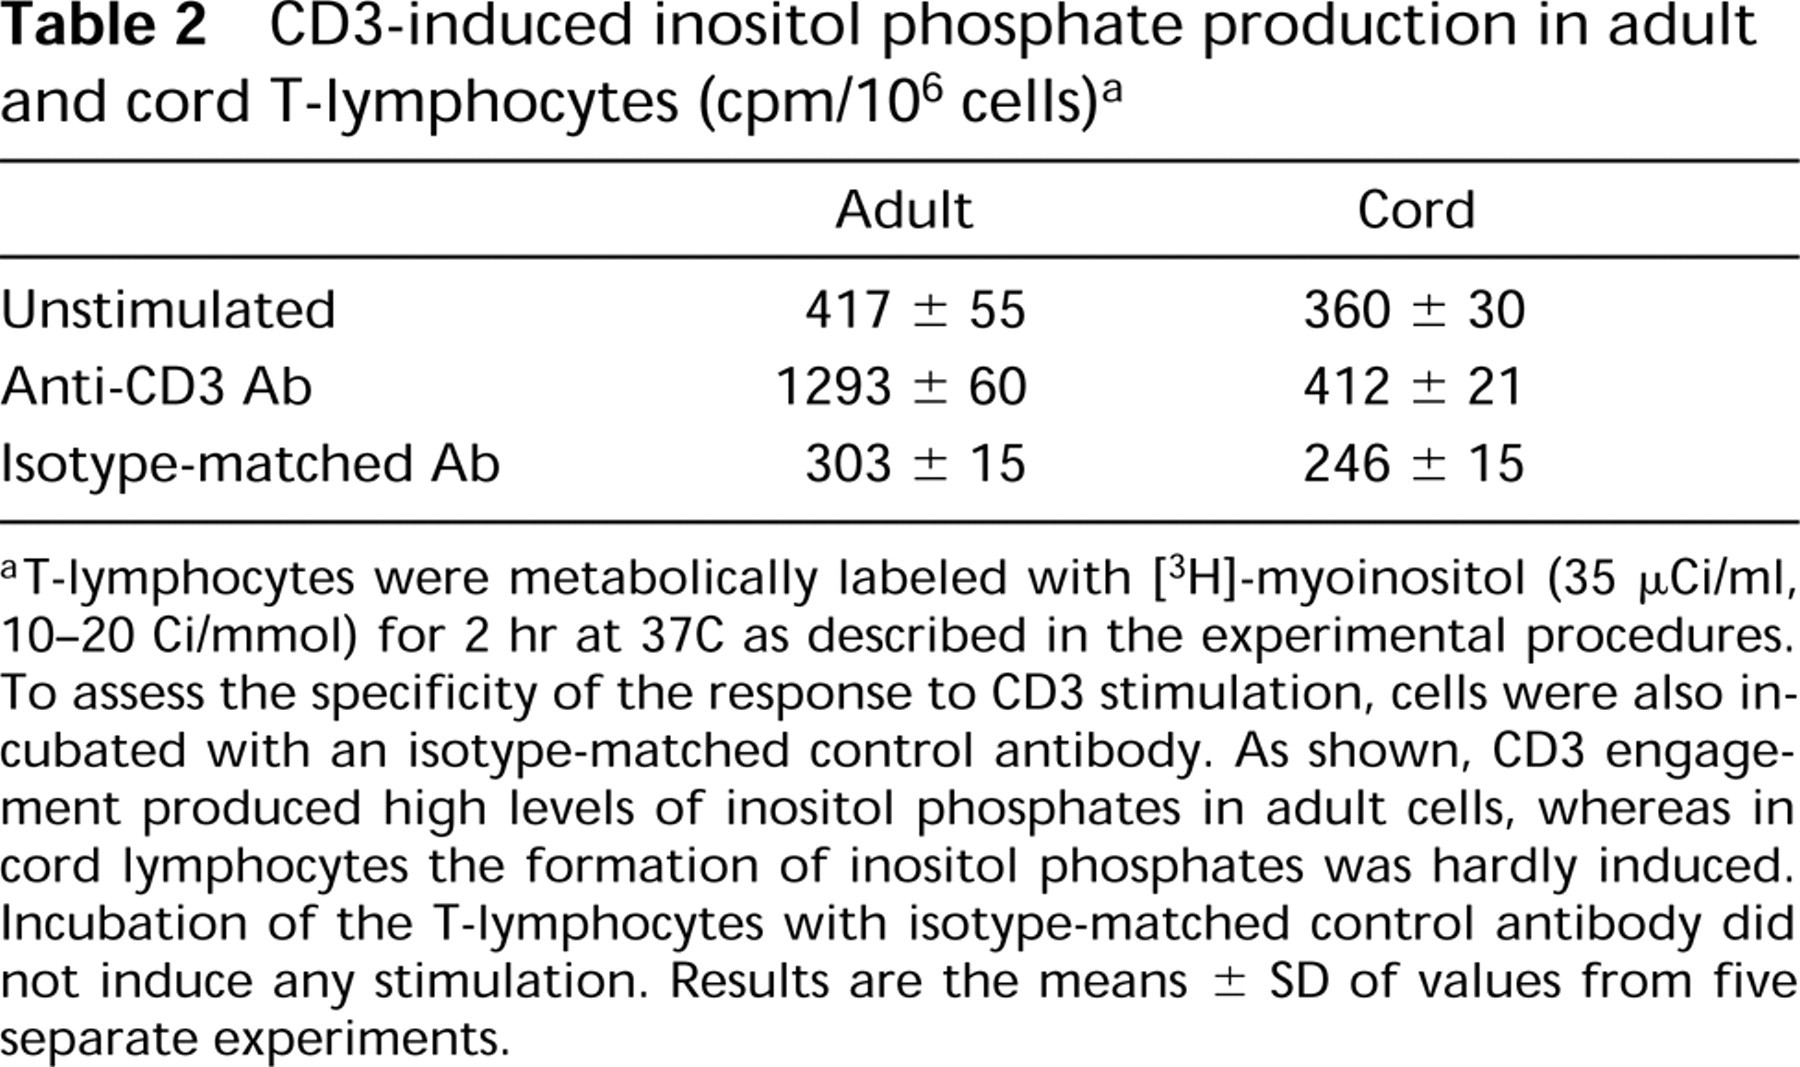
aT-lymphocytes were metabolically labeled with [3H]-myoinositol (35 μCi/ml, 10-20 Ci/mmol) for 2 hr at 37C as described in the experimental procedures. To assess the specificity of the response to CD3 stimulation, cells were also incubated with an isotype-matched control antibody. As shown, CD3 engagement produced high levels of inositol phosphates in adult cells, whereas in cord lymphocytes the formation of inositol phosphates was hardly induced. Incubation of the T-lymphocytes with isotype-matched control antibody did not induce any stimulation. Results are the means ± SD of values from five separate experiments.