
Abstract
The resolution of conventional light microscopy is limited to ∼200 nm in the x- and y-axes and <500 nm in the z-axis. A simple way of improving z-axis resolution is to analyze thin sections of 100–200 nm. The utility of such an approach is illustrated by reference to transcription sites imaged in cryosections of human nuclei. Cells are permeabilized, allowed to extend nascent transcripts in Br-UTP, fixed, cryosectioned, and Br-RNA-immunolabeled with fluorochromes and gold particles. As expected, physical sectioning improves resolution and brings other advantages. First, sections allow improved antibody access and better immunolabeling. Second, more sites (with a more representative range of intensities) can now be resolved against lower backgrounds, facilitating quantitative analysis. Third, problems associated with chromatic aberration when two differently colored images of the same objects are collected can be sidestepped by refocusing between image collection. Fourth, exactly the same sites can be imaged by light and electron microscopy, allowing direct comparison between the two techniques. Immunogold labeling and electron microscopy provided the most accurate counts of site number. The results confirm that nascent transcripts in the nucleoplasm are confined to several thousand sites, or “factories,” with diameters of ∼40 nm.
Keywords
T
Sites of transcription in mammalian nuclei have traditionally been imaged after growing cells for short periods in [3H]-U and then localizing the resulting [3H]-RNA by autoradiography. However, it was difficult to resolve individual extranucleolar sites because pulses giving sufficient incorporation for detection often allowed time for completed transcripts to move away from synthetic sites, and the resolution of auto-radiography is poor (silver grains can lie <100 nm away from the tritium source)(Rogers 1979). Recently, transcription sites have been imaged with higher resolution after allowing intact or permeabilized cells to extend nascent transcripts by a few nucleotides in the presence of Br-U, Br-UTP or biotin-CTP, and then labeling the resulting Br- or biotin-RNA with antibodies tagged with fluorochromes or gold particles. Surprisingly, nascent transcripts are not spread diffusely throughout the nucleoplasm but rather are concentrated in 2000–10,000 sites with diameters of 40–80 nm (Jackson et al. 1993,1998; Wansink et al. 1993; Iborra et al. 1996a; Fay et al. 1997; Iborra and Cook 1998; and Pombo et al. unpublished data). Because a site typically contains 10 or more transcription units and associated transcripts, such sites have been christened transcription “factories” (e.g., Iborra et al. 1996b).
Figure 1 illustrates the problems encountered in imaging and then counting objects like these transcription sites. In a conventional light microscope, an object of ∼50 nm diameter appears wider (i.e., <200 nm) and more elongated (i.e., <500 nm) than it truly is (Figure 1A). This makes it difficult to distinguish faint objects in the optical section from out-of-focus flare from brighter objects lying above or below, and to resolve an object lying immediately above another in the same optical section. In the confocal microscope, objects appear both narrower and less elongated, and optical sectioning reduces but does not eliminate flare (Figure 1A, confocal). The precise appearance depends on the point-spread functions associated with the different microscopes (Shaw 1995; Wilson 1995). However, in a thin physical section, all signal (strong or faint) must come exclusively from objects within the section (Figure 1B, conventional). Moreover, because all objects lie well within the optical section, the intensities seen more directly reflect the intensities of those objects. In theory, therefore, a combination of physical and optical sectioning should improve axial resolution (Figure 1B, confocal) (Shaw 1995; Wilson 1995), and we show that this is so in practice.
Sections of the appropriate thickness (i.e., 100–200 nm) can be prepared from whole cells by infiltration with a medium that hardens sufficiently (e.g., by polymerization or freezing) to permit sectioning. We used an approach borrowed from electron microscopy—freezing, cryosectioning, coupled to “dry knife, wet retrieval” (Tokuyasu 1980)—because ultrastructure is preserved and epitopes can be immunolabeled with high sensitivity (Griffiths et al. 1984; Tooze et al. 1991). This procedure does not require dehydration or detergent treatment until sections are fixed to the glass coverslip or grid. Our basic procedure to label transcription sites is as follows. Cells are permeabilized with saponin in a “physiological” buffer, allowed to extend nascent transcripts in the presence of Br-UTP, fixed in paraformaldehyde, infiltrated with sucrose, frozen in liquid nitrogen, cryosectioned, and the sections placed on coverslips (or grids) before Br-RNA is immunolabeled with fluorochromes (or gold particles). Cryosectioning brings improved resolution as well as other advantages. First, the thin sections allow improved antibody access and therefore better immunolabeling. Second, fewer sites (with a more representative range of intensities) are seen against lower backgrounds, facilitating quantitative analysis. Third, problems associated with chromatic aberration when two differently colored images of the same objects are collected can be solved simply by refocusing between image collection. Fourth, it proves possible to image the same sites by light and electron microscopy, allowing direct comparison between the two techniques. Immunogold labeling and electron microscopy can provide both the highest sensitivity and resolution, and therefore the most accurate counts of site number. The results also confirm that essentially all nascent transcripts within the nucleoplasm are confined to several thousand “factories” that have diameters of ∼40 nm.
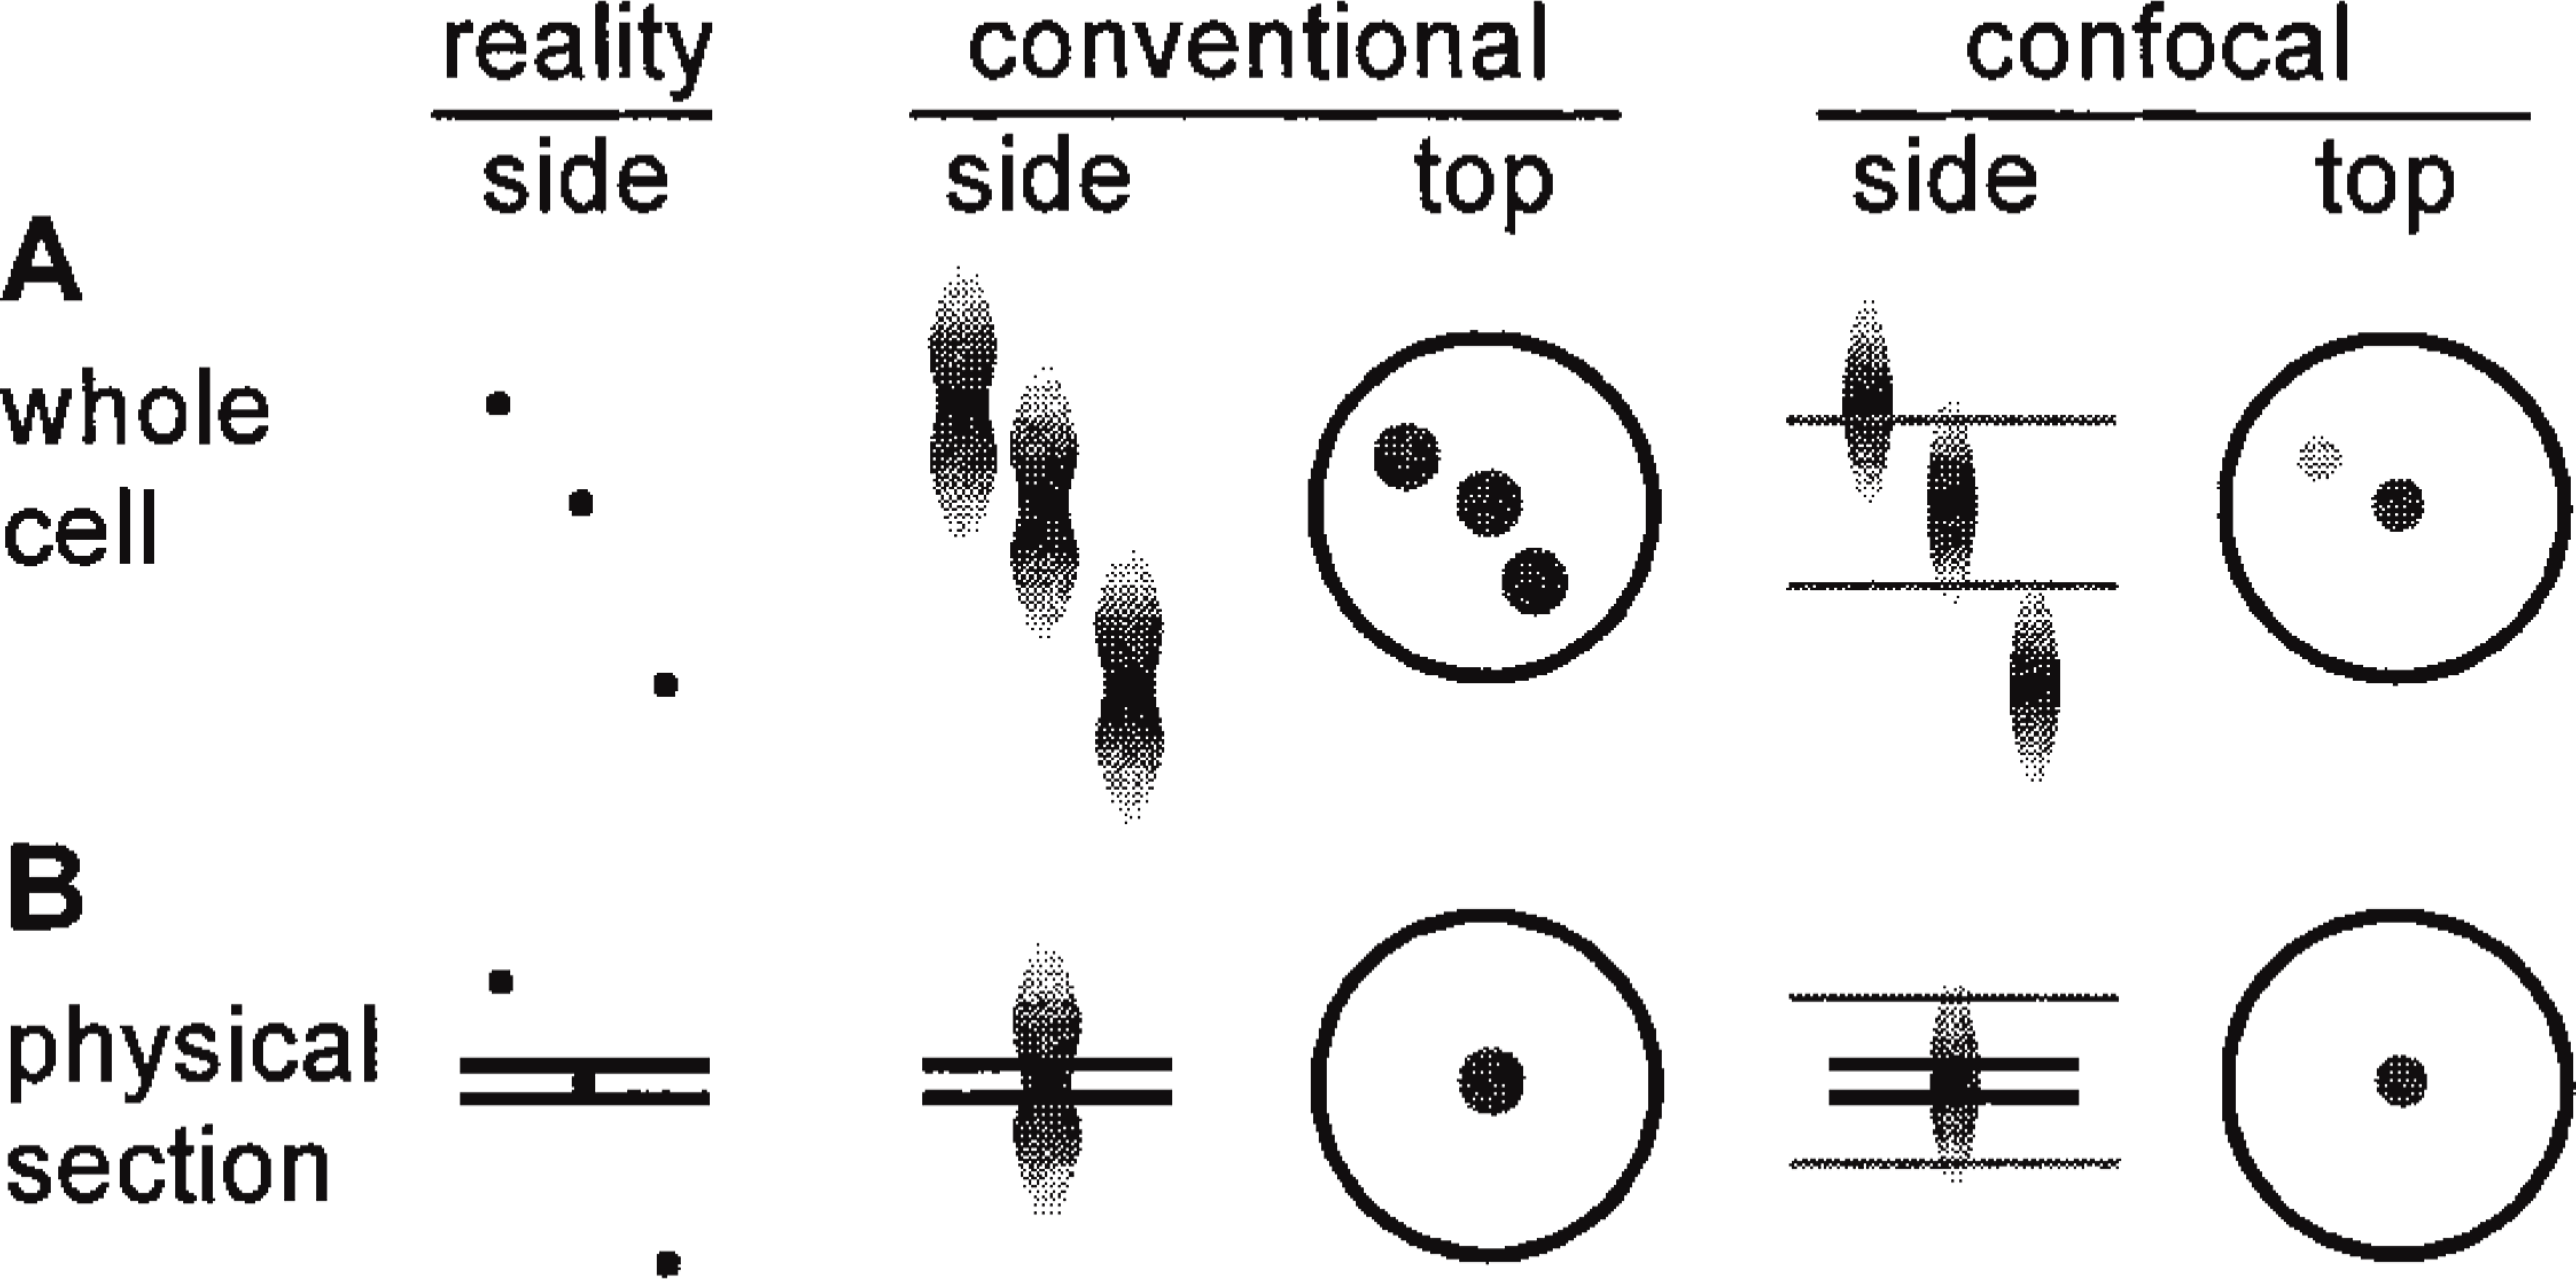
The theoretical basis of the improved resolution obtained in viewing small objects (diameter ∼50 nm) within cells. The three spheres illustrated appear more elongated (side views of z-axis) and wider (top views of x-y-axes) than they really are when imaged using a conventional (i.e., wide field) or a confocal microscope. Their precise appearance depends on the point-spread function (typical ones are shown) associated with the particular microscope. Gray horizontal lines represent the limits of an optical section (<500 nm) and black lines the limits of a physical section (100–200 nm). (A) When the whole cell is imaged using a conventional microscope, all three objects are seen as large circles; only two are seen in the confocal, as the optical section contains no light from the third. (B) After physically sectioning the sample, only one sphere remains. As before, it appears smaller in the confocal.
Materials and Methods
Transcription Reactions
HeLa cells were generally grown as suspension cultures (Jackson et al. 1988). Monolayer cultures grown in MEM plus 10% fetal calf serum were used for Figures 2A and 2B to provide the best conditions for imaging whole cells. Cells in suspension were washed successively in PBS, ice-cold physiological buffer (PB; Iborra et al. 1996a) containing ribonuclease inhibitor (5 U/ml; Amersham-Pharmacia, Uppsala, Sweden), pelleted (200 x g, 5 min), lysed with saponin in PB (100 μg/ml, 5 min, 4C; Sigma, Poole, UK), and washed three times in PB. Lysed cells were preincubated (2 min, 33C), and a 10x concentrated solution of ribonucleotide triphosphates (33C) added to give final concentrations of 1.1 mM ATP, 0.1 mM Br-UTP, CTP, GTP, 1.4 mM MgCl2, and 25 U/ml ribonuclease inhibitor. After 15 min at 33C, reactions were stopped with 2 volumes ice-cold PB and cells were fixed and cryosectioned as described below. Cells on coverslips were washed and lysed as above, but overlaid with a 1 x concentrated solution of ribonucleotide triphosphates. Then reactions were stopped by addition of ice-cold PB. Cells were fixed in 4% paraformaldehyde in 250 mM HEPES (pH 7.4, 10 min, 4C) and refixed in 8% paraformaldehyde in 250 mM HEPES (pH 7.4, 2 hr, 4C).
Cryosections
Cryosections were prepared using a modification of existing methods (Tokuyasu 1980; Griffiths et al. 1984; Tooze et al. 1991). After stopping the reactions, cells were pelleted as above, fixed with 4% paraformaldehyde in 250 mM HEPES (pH 7.4, 10 min, 4C), pelleted, refixed in 8% paraformaldehyde in 250 mM HEPES (pH 7.4, 20 min, 4C), repelleted (8000 x g, 5 min), and fixation allowed to continue in the pellet for 20 min before the pellet was dislodged and left for 80 min. Next, the pellet was washed in PBS, transferred through 3 drops of 2.1 M sucrose in PBS over 2 hr and then onto a copper block, and excess sucrose removed with a filter paper. After shaping into a cone with forceps, pellets were frozen by immersion in liquid nitrogen and stored in liquid nitrogen until use. Cryosections (100–200 nm, deduced from interference color) were cut (Reichert Ultracut S with FCS attachment cryomicrotome; Leica UK, Milton Keynes, UK), captured on drops of 2.1 M sucrose in PBS, and transferred to coverslips (0.17 mm thick for best resolution; Chance Propper coverslips supplied through Agar Scientific, Stanstead, Essex, UK) coated with poly-L-lysine (0.1 mg/ml, 5 min; Sigma) or, for Figure 5, to grids (formvar, carbon-coated).
Immunolabeling and Imaging
Before addition of antibodies, free aldehyde groups were quenched (20 min) with 25 mM glycine in PBS. Then whole cells on coverslips were treated with 0.5% Triton X-100 in PBS for 20 min and cryosections with 0.1% Triton X-100 in PBS for 2 min. After washing in PBS and incubation (30 min) in PBS + 1% BSA + 0.2% fish gelatin (PBS+), Br-RNA was indirectly immunolabeled (1–2 hr) using a mouse monoclonal anti-Br-dU (Boehringer Mannheim; Lewes, East Sussex, UK) as a primary antibody diluted in PBS+ (pH 8.0) to 1 μg/ml (whole cells) or 5 μg/ml (cryosections), and washed in PBS+ (1 hr). (Antibodies were titrated and the maximal concentration that did not give significant background was used.)
For Figure 2, samples were incubated (1–2 hr) with a donkey anti-mouse IgG conjugated with FITC (fluorescein isothiocyanate, 10 μg/ml; multiple-labeling grade from Jackson ImmunoResearch Laboratories, West Grove, PA), washed (1 hr) in PBS+ and then in PBS supplemented with 0.1% Tween 20, incubated in TOTO-3 (20 μM in PBS/Tween for 20 min; Molecular Probes, Eugene, OR), washed successively in PBS/Tween and PBS, and mounted in Vectashield (Vector Laboratories; Peterborough, UK) on an England finder (BDH; Poole, Dorset, UK). Images shown in Figures 2A and 2C were collected using a CCD camera (Hamamatsu Photonics C4742; Hamamatsu City, Japan; 1000 × 1018 pixels, 10-bit images, pixel size 12 μm), run under Image v1.41 (NIH, Bethesda, MD), and a x 63 Plan-Neofluar objective (NA 1.4) on a Zeiss Axioplan microscope (Carl Zeiss-Oberkochen; Welwyn Garden City, Herts, UK). Images shown in Figures 2B and 2D were collected using a confocal microscope (hybrid BioRad MRC-1000/1024; Hemel Hempstead, Herts, UK) running under Comos software (v. 7.0a), and fitted with an argon/krypton laser, a x 60 PlanApo objective (NA 1.4), and a Nikon Diaphot 200 inverted microscope. Images were collected with a closed iris (to obtain best resolution), Kalman filtering (n = 6–10), and the minimal laser power that filled the whole gray scale in the low scan/low signal mode.
For Figure 3, immunolabeling was as above, except that two secondary antibodies were used together—the IgG-FITC described above and a donkey anti-mouse IgG conjugated with Cy3 (iodocarbocyanine, 1 μg/ml; multiple-labeling grade from Jackson ImmunoResearch)—and images were collected sequentially on the confocal microscope (as above).
For Figure 4, Br-RNA was indirectly immunolabeled using the mouse anti-Br-dU antibody, followed by rabbit anti-mouse IgG (1 hr, 1 μg/ml; Cappel Laboratories, supplied through Organon Teknika, Turnhout, Belgium) and then FITC-protein A adsorbed to 6-nm gold particles (3 hr, 1:100 dilution); the conjugate was made as described by Griffiths (1993) but using FITC-protein A (Amersham-Pharmacia; Little Chalfont, UK). (The sensitivity, stability, and storage properties of the conjugate were similar to those of protein A-gold.) After washing in PBS +, cryosections were stained with TOTO-3 and imaged on the confocal microscope (as above). Then coverslips were floated off the slide, washed in PBS, treated (10 min) with 0.5% glutaraldehyde in PBS, stained (1 hr) in 1% OsO4 and 1.5% potassium ferrocyanide, washed in water, incubated (4C, 10 hr) in 0.5% magnesium uranyl acetate, washed in water, stained (30 sec) with Reynolds' lead citrate, and washed in water. The cryosection on a coverslip in a Petri dish was dehydrated through ethanol, flat-embedded in Epon (Tooze and Hollinshead 1992), and the first 150-nm Epon section (which contained the original cryosection) imaged in a Zeiss EM 912 Omega transmission electron microscope equipped with a cooled slow-scan CCD camera (1024 × 1024 pixels; Proscan, Proscan Elektronische Systeme, Penzing, Germany) running under analySIS 2.11 software supplied with the microscope. The FITC-gold conjugate described above penetrates as efficiently into cryosections as a donkey anti-rabbit IgG conjugated with LRSC (lissamine rhodamine sulfonyl chloride, 1 μg/ml; multiple-labeling grade from Jackson ImmunoResearch). After labeling of Br-RNA with the primary mouse monoclonal antibody, simultaneous incubation with both reagents led to 82% foci being doubly labeled with both fluorochromes, 13% only with LRSC, and 5% only with FITC (not shown). Rough estimates showed that conjugates typically contained FITC, protein A, and gold particles in the ratio 60:10:1. These ratios were calculated using (a) the FITC: protein A ratio (6:1, manufacturer's information), (b) particle numbers (from particle counts of known volumes dried on grids), and (c) the protein A: particle ratio (i.e., 10:1) (from the minimal protein concentration required for stabilization; Griffiths 1993). We found that the FITC-protein A-gold conjugate gave better resolution and sensitivity than commercial reagents (i.e., FluoroNanogold-Fab' from Nanoprobes).
For Figure 5, Br-RNA on grids was immunolabeled and treated with glutaraldehyde as for Figure 4. Then grids were washed eight times in water, incubated (4C, 10 min) with 0.3% uranyl acetate in 2% methylcellulose, captured on a wire loop, excess methylcellulose blotted onto a filter paper, recovered, and imaged in the electron microscope.
Quantitative Analysis
For light microscopy, images were transferred to Adobe Photoshop (Adobe Systems; Edinburgh, UK), contrast-stretched without processing in any other way, nucleoplasmic regions identified by reference to TOTO-3 staining, and foci within them counted as described by Iborra et al. (1996a).
For electron microscopy, a cluster of gold particles was defined as one containing <1 particle lying within 40 nm of another (center-to-center distance; Iborra et al. 1996a). The radius, r, of such clusters was determined after measurement (using SIS EsiVision software supplied with the electron microscope) of the major, 2x, and minor, 2y, (orthogonal) axes of each cluster, from r = √ (xy). The average diameter, D, of the underlying sites marked by these clusters was determined using the sequential-subtraction method (Weibel 1979, 1980). This allows the radius, R, of spheres to be deduced from the radii (r) of circular profiles seen in 2-dimensional (2-D) images of 3-dimensional (3-D) sections cut through the sample. Spheres lying completely within the section appear as circles with radius R; any cut nonequatorially may give “polar caps” that either appear smaller or are missed because they are too small to be detected. The radii of the various circles seen are counted and grouped together into bins (e.g., 0–5 nm, 5–10 nm, 10–15 nm in Figure 5) of size Δr (i.e., 5 nm) with a maximal radius, ri (i.e., 5 nm, 10 nm, 15 nm). The frequency (f) with which circles with different radii are seen depends on section thickness (T), sphere radius, and bin size. For a population of single-sized spheres, the frequency of complete spheres and caps in each bin is determined from the following expressions. When ri = R,
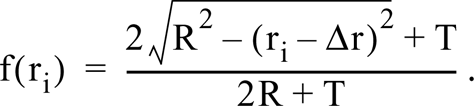
When ri > R,
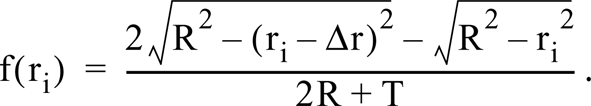
The mean diameter of a population of spheres with differing radii is deduced by sequential subtraction. Starting with the largest bin, the contribution of polar caps arising from spheres with this diameter is calculated and subtracted from the smaller categories; then the next largest bin is treated in the same way, and so on.
Numbers of sites in 3-D space in a nucleus were calculated as follows (Weibel 1979): (a) the density (ns) of clusters in 2-D images of 3-D sections was measured, (b) the volume density (nv) was calculated using Abercrombie's formula
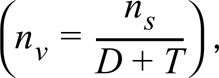
where T is the section thickness, and (c) the number of sites per nucleus calculated with knowledge of nucleoplasmic volume. The volume of nucleoplasm (i.e., 554 ± 163 μm3; range 420–921; n = 11) in permeabilized HeLa cells was determined using Adobe Photoshop from serial optical sections collected at nominal 0.4-μm intervals through whole cells stained with TOTO-3. Each voxel had x and y dimensions of 45 nm (calibrated according to BioRad's instructions), and a z dimension of 0.39 μm and not 0.4 μm (determined by reference to 10-μm latex Nile Red FluoroSpheres from Molecular Probes, as described by Visser et al. 1991). A lower value for nucleoplasmic volume (i.e., 380 μm3) was obtained by stereological analysis of cryosections, assuming that nuclei and nucleoli are round (Iborra et al. 1996a). Note that the calculated value for the number of sites in 3-D space is sensitive both to values of site radius and to nucleoplasmic volume.
Results
Improving Z-axis Resolution of the Light Microscope
The improved resolution given by sections is illustrated in Figure 2. HeLa cells were permeabilized in a physiological buffer, allowed to extend nascent transcripts by ∼1100 nucleotides in the presence of Br-UTP, fixed, and Br-RNA indirectly immunolabeled with FITC. All four cellular RNA polymerases incorporate the analogue (unpublished data), so Br-RNA is found in nucleoli (made by polymerase I), the nucleoplasm (made by polymerases II and III), and the cytoplasm (made by the mitochondrial polymerase). When a whole cell is viewed with a conventional microscope, fluorescence (marking Br-RNA) appears distributed throughout the cell in a complex pattern. Bright foci in the nucleolus and nucleoplasm are seen against a diffuse nucleoplasmic signal, and these are surrounded by a few mitochondrial foci (Figure 2A). Here (and in all other fluorescence images shown), the primary image has been stretched to fill the gray scale but not treated in any other way. As a result, foci appear more blurred than those presented after subtracting “background” (e.g., Jackson et al. 1993). A confocal view of the same cell gives a simpler pattern. Because the optical section is thinner, some individual nucleoplasmic foci can now be resolved, although many still appear to fuse one into another (Figure 2B). Views of a cryosection (∼150 nm thick) yield still simpler images; even in the conventional microscope, foci are well resolved (Figure 2C), and in the confocal microscope they appear even sharper (Figure 2D). In Figure 2D, no signal other than noise could be detected between foci (not shown; see also Iborra et al. 1996a). (Noise is defined as the average intensity seen over noncellular regions.) As a result, nucleoplasmic foci can easily be counted, and the poorer resolution given by the conventional microscope is reflected by an underestimate of the number of foci by 27% (average of counts made on 12 images of six cells like those in Figures 2C and 2D; not shown). These results confirm the theoretical expectations that foci should appear sharper and better resolved when thin cryosections are imaged using a confocal microscope.
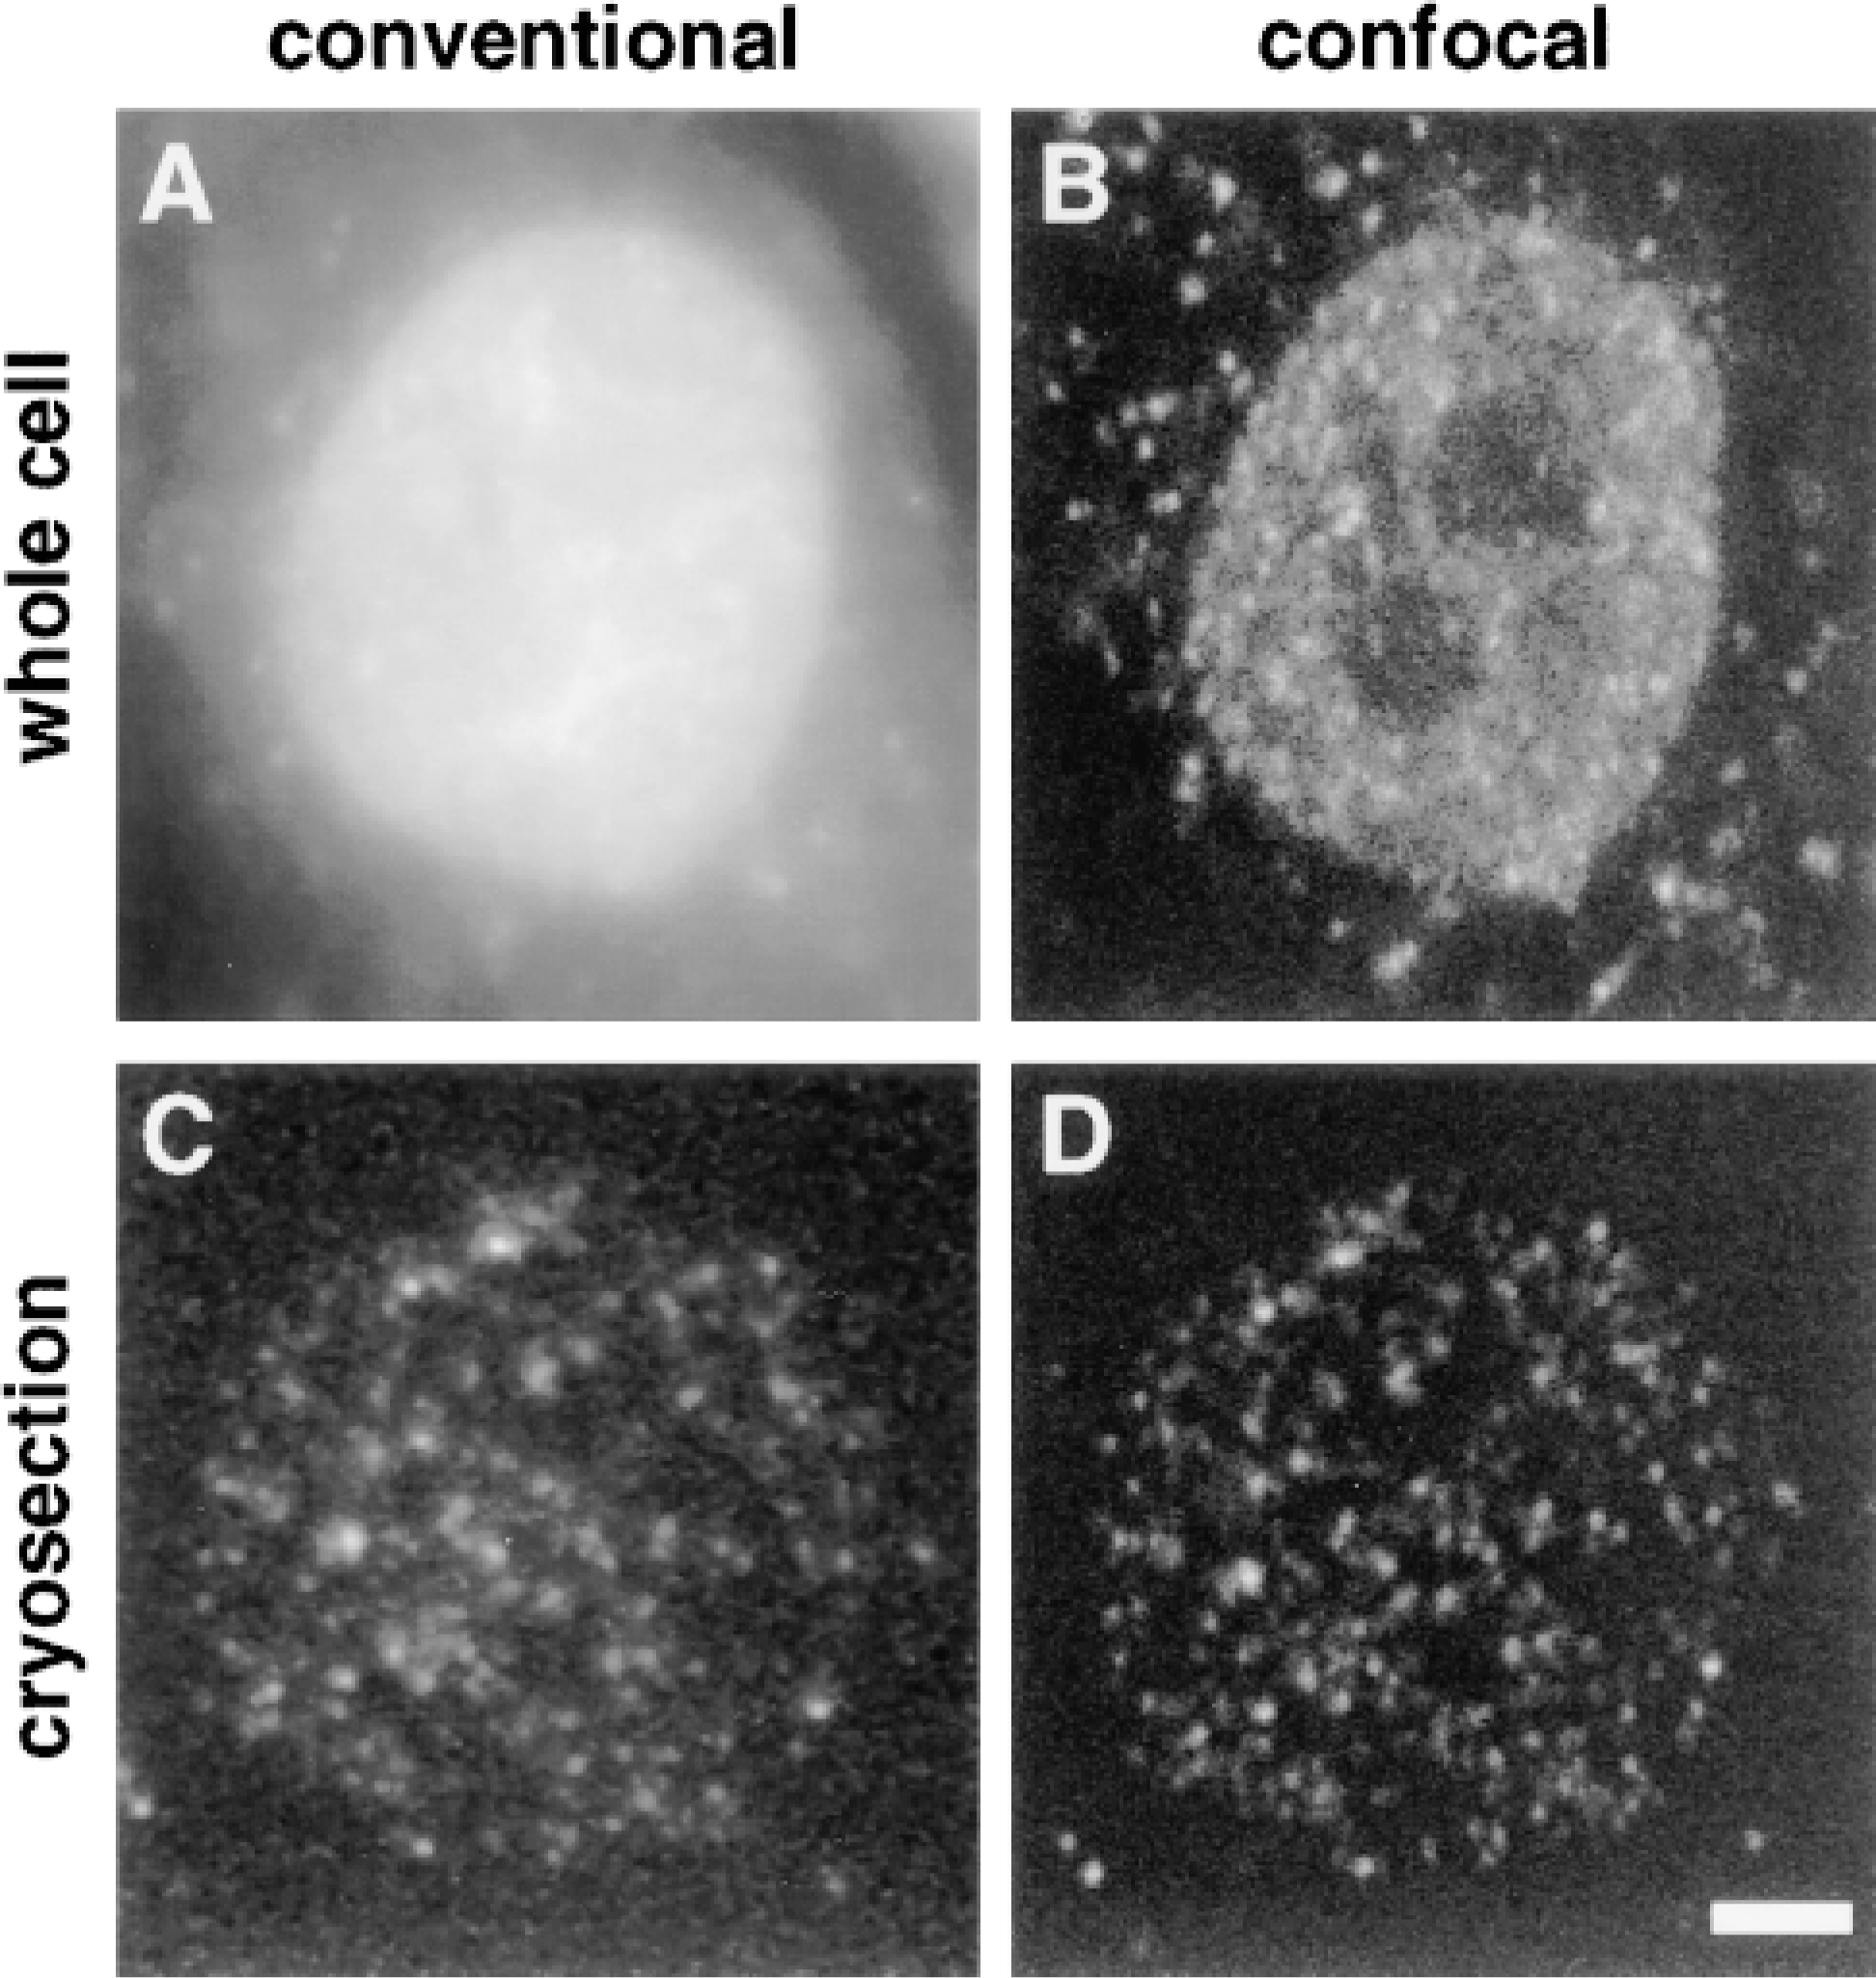
Transcription sites in HeLa cells imaged using conventional or confocal microscopy. Cells were permeabilized in a physiological buffer, allowed to extend nascent transcripts in Br-UTP for 15 min, and fixed. Br-RNA was indirectly immunolabeled with fluorescein, in whole cells or in cryosections. “Raw” images are shown. (A,B) Two views of Br-RNA in a whole cell. (C,D) Two views of Br-RNA in a cryosection (∼150 nm) of a different cell. Bar = 2.5 μm.
Minimizing Chromatic Aberrations when Doubly-labeled sites Are Imaged
Multiple fluorochromes are often used to localize different objects within cells. The approach requires that there is little misregistration or difference in magnification between the two resulting images. This is difficult to achieve in practice because fluorochromes emit light of different wavelengths, which is diffracted to different degrees (Keller 1995). As a result of such chromatic aberration, objects in the same plane are never exactly in focus in both images. This problem becomes even more acute when objects lying further within cells (or confocal sections) are imaged; microscope objectives are designed to image with maximal quality objects immediately below glass coverslips ∼0.17 mm thick (Keller 1995). Such problems can be minimized by refocusing, as follows.
Br-RNA in cryosections was labeled with both red and green fluorochromes. After focusing on sites through a red filter, an image was collected (Figure 3A). If the same sites are then imaged using the green filter, they appear more blurred (Figure 3B). They become sharper after refocusing (Figure 3C), and changing back to the red filter then defocuses them again (not shown). We compared foci in Figures 3A-3C to gauge how great the differences in misregistration, magnification, and brightness were in these thin sections. Such comparison is complicated by the fact that antibodies bind to different sites in differing ratios; some in-focus foci appear slightly brighter when viewed through the green filter (e.g., focus 1), others through the red filter (e.g., focus 2). (This also indicates that sites are detected with similar sensitivities using the two fluorochromes.) Switching filters leads to some increase in the size of sites, with adjacent sites apparently fusing (e.g., adjacent foci 3); some faint sites may even be lost (e.g., focus 4). A combination of both effects leads to a ∼20% reduction in the number of sites counted after switching filters without refocusing. Roughly equal numbers are seen with refocusing.
It remained formally possible that starting and stopping scans, and/or the z-axis movements required for refocusing, might alter x-y positions, so we tested whether this was so. First, we established how x-y position varied after collecting a series of images like those in Figure 3A without any refocusing. After contrast-stretching to fill the gray scale and subtraction of background noise (the average intensity outside cells), the center of gravity of the remaining foci (defined as ≤2 touching pixels that contained any intensity) was determined (not shown). The centers of gravity of only 8% foci moved by <1 pixel from scan to scan, and this movement was not in any one direction. After re-focusing between scans (as in Figures 3A and 3C), no further movement was seen (i.e., the center of gravity of only 6% foci moved by <1 pixel). These results show that refocusing has no detectable effect on x-y registration in our system and that this approach minimizes the chromatic aberrations associated with imaging multiply-labeled sites.
Imaging the Same Sites by Light and Electron Microscopy
Because the cryosectioning technique was borrowed from electron microscopy, we investigated whether it was possible to image exactly the same sites by both light and electron microscopy. For this purpose, we prepared a probe labeled with both a fluorochrome and gold particle (see Materials and Methods). This reagent allows direct correlation without the need for amplification. Because large gold probes apparently do not penetrate efficiently into cryosections (Stierhof et al. 1986; Slot et al. 1989; Stierhof and Schwarz 1989), we improved an existing procedure in two ways: (a) by adding a mild detergent treatment after cryosections are stably attached to the glass coverslip, and (b) by incubating sections with probes for longer. As a result, conjugates containing colloidal gold of ≥10 nm penetrate as efficiently as immunoglobulin-fluorochrome conjugates (see Materials and Methods). Sections containing Br-RNA were prepared as before, incubated with FITC-protein A adsorbed onto 6-nm gold particles, and fluorescence images collected on a confocal microscope (Figures 4A-4C). Next, the embedding resin used for electron microscopy was poured onto the section, allowed to set, and the resulting block re-sectioned so that the first section (∼150 nm) contained the original cryosection. Finally, the same area was identified and an image was collected using the electron microscope (Figures 4D and 4E). Transcription sites were seen either as fluorescent foci or as clusters of gold particles. These clusters appear in stereo views to be spread throughout the thickness of the cryosection (not shown). Foci and clusters co-localize almost perfectly (e.g., Figure 4F). Moreover, lone gold particles did not always give foci visible by light microscopy, and two gold particles gave visible foci if they lay within 100 nm of each other (not shown). (Note that even if gold particles quench fluorescence, there remains sufficient to enable all clusters of gold particles to be detected by light microscopy.)
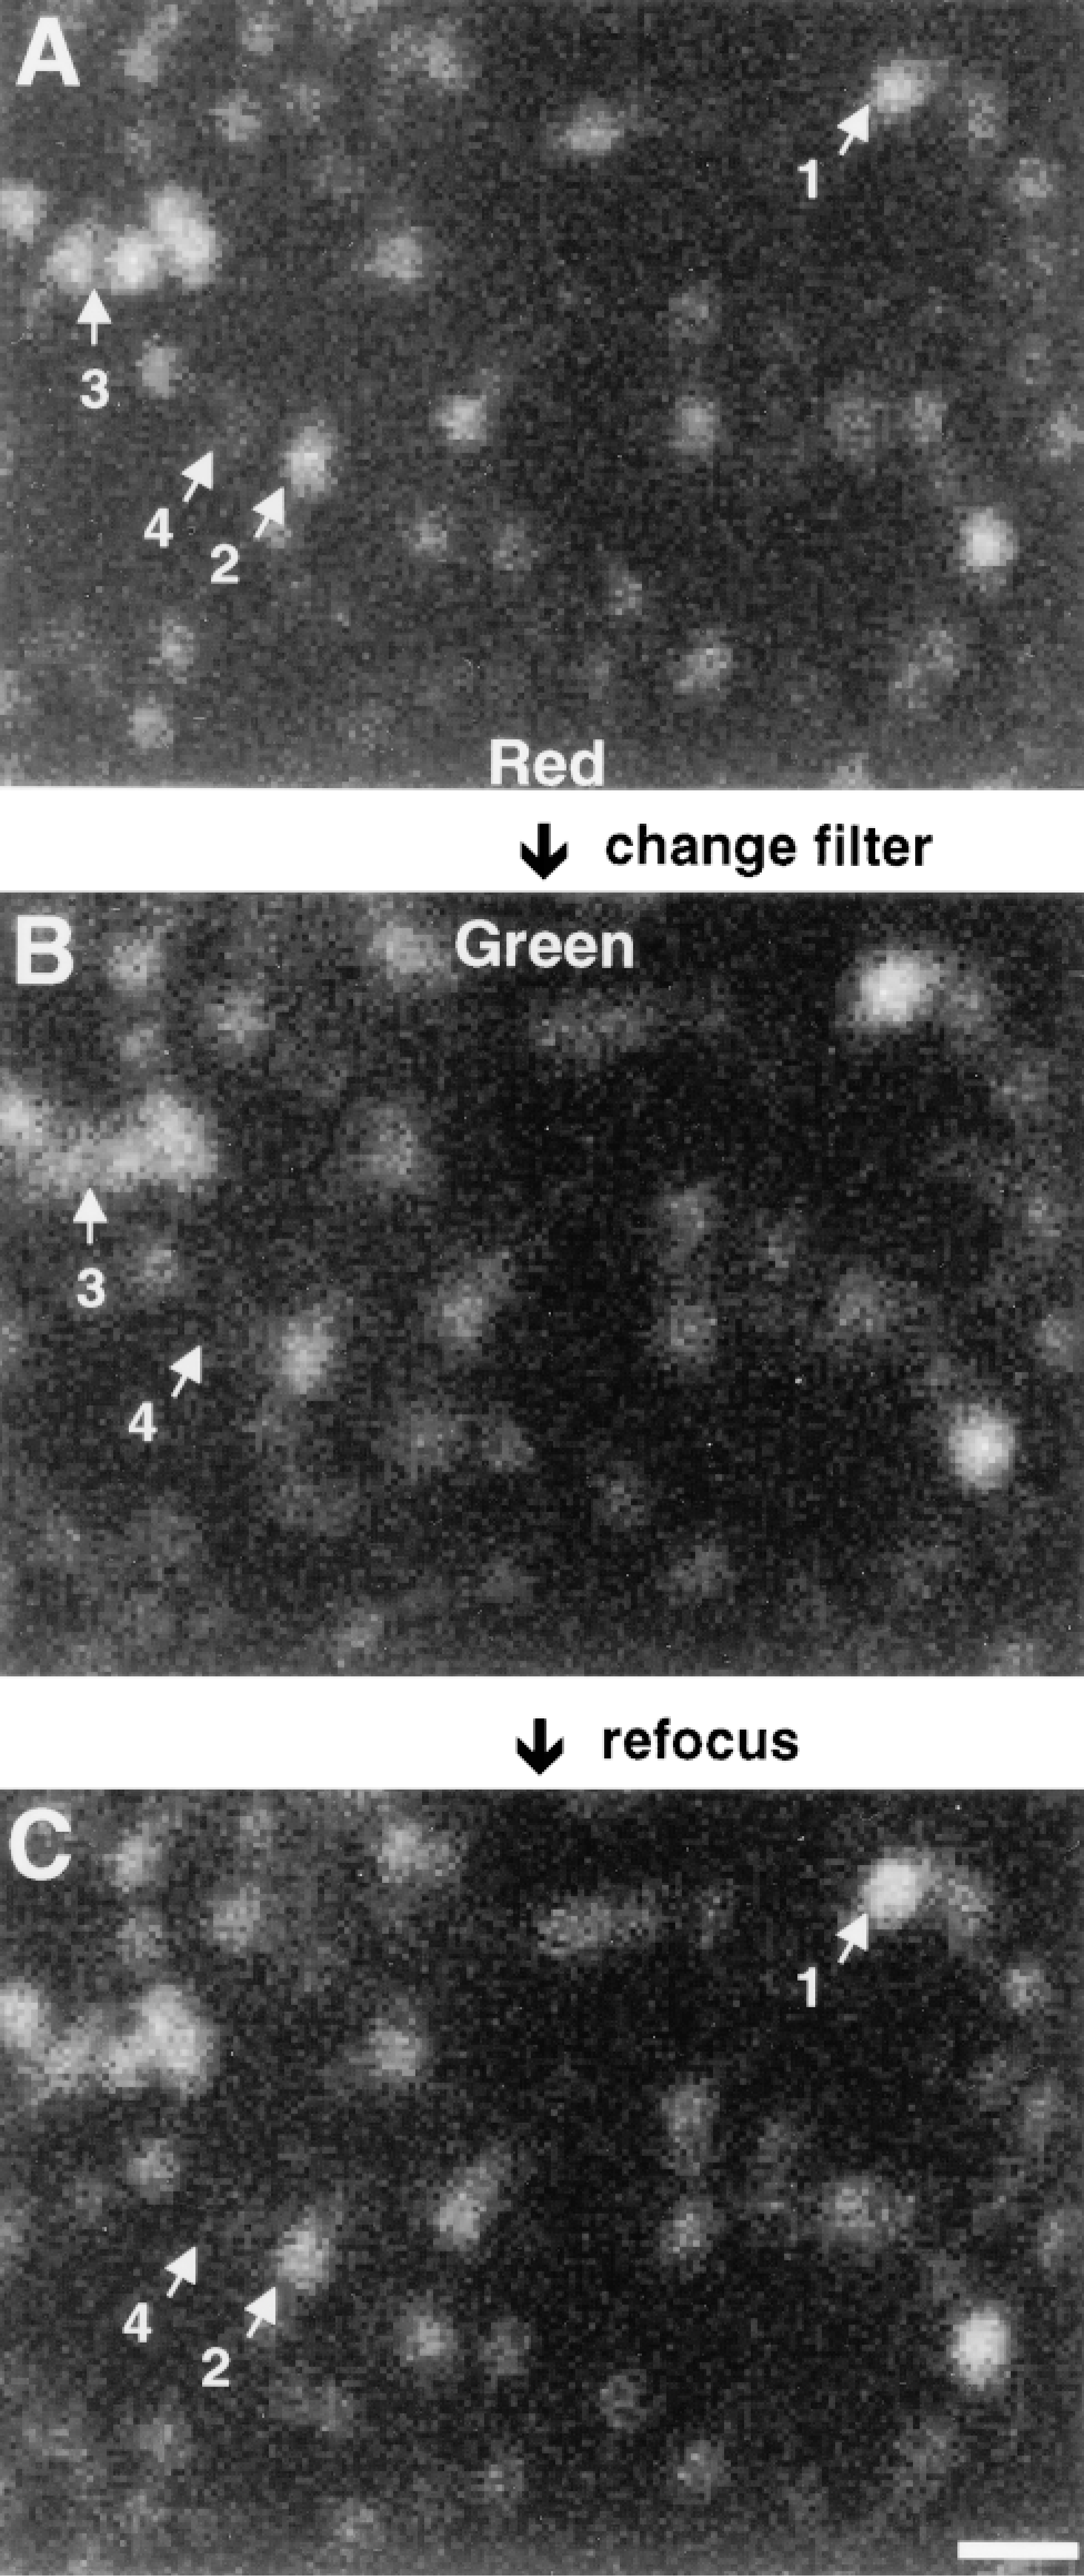
Reducing chromatic aberration by refocusing. Permeabilized cells were allowed to extend nascent transcripts in Br-UTP for 15 min, fixed, cryosections prepared, Br-RNA indirectly immunolabeled with both Cy3 and fluorescein, and a series of “raw” images of the same foci collected using the confocal microscope. Selected foci are numbered. (A) One optical section taken through a red filter. (B) View of same section taken after changing to the green filter (but without refocusing). (C) View of same foci taken after refocusing (but without changing the filter). Bar = 500 nm.
We next compared the strengths and weaknesses of the different approaches used to analyze light and electron micrographs. Consider, for example, how the number of transcription sites in a nucleus would be determined. In analyzing fluorescence images like that in Figure 4C, we are confronted with the problem of how to define a focus. We must make (often arbitrary) decisions on how many contiguous pixels are needed to constitute a focus, where to draw the threshold between signal and noise, and whether two peaks of intensity are part of one extended focus. In practice, most observers agree that the image contains the five foci shown by the ovals in Figure 4F, largely because their eyes and brains are so well adapted to analyze complex images (Russ 1990; see also Iborra et al. 1996a). (Part of one focus lying on the right edge of the field is excluded in this discussion.) Perhaps surprisingly, it turns out that transcription sites can be counted more rigorously in the corresponding electron micrograph (Figure 4E). We have previously shown that clusters (defined as two or more particles lying within 40 nm of another) mark transcription sites and that lone particles represent background (Iborra et al. 1996a). These criteria are justified because (a) ∼40 nm is the maximal separation possible between two particles marking adjacent bromine residues in a transcript (i.e., roughly the length of two fully extended immunolabeling probes, each containing two immunoglobulins and a protein A molecule), and (b) the same density of lone particles (i.e., ≥1 particle/μm2, representing ≥6% total number of particles) is found in controls incubated without Br-UTP and outside of cells (not shown). Using this simple but rigorous definition of what constitutes a cluster, Figure 4E is found to contain six clusters, which can be seen more clearly in Figure 4F. Not surprisingly, the electron microscope resolves some foci into more than one cluster (e.g., two clusters are contained within the large focus at the top center in Figure 4C). Further analysis of 48 foci showed that 39 contained one cluster of particles, eight contained two, and one contained three (not shown). As a result, the number of sites in such samples is only underestimated by ∼17% in the light microscope (not shown). The density of sites seen by electron microscopy (i.e., 1.6 cluster/μm2) corresponds to 6500 extranucleolar sites/nucleus, taking into account the average size of clusters (see below) and nucleoplasmic volume (see Materials and Methods).
These results demonstrate that the same objects can be imaged by both light and electron microscopy without amplification. They also show that electron microscopy can yield the most accurate counts.
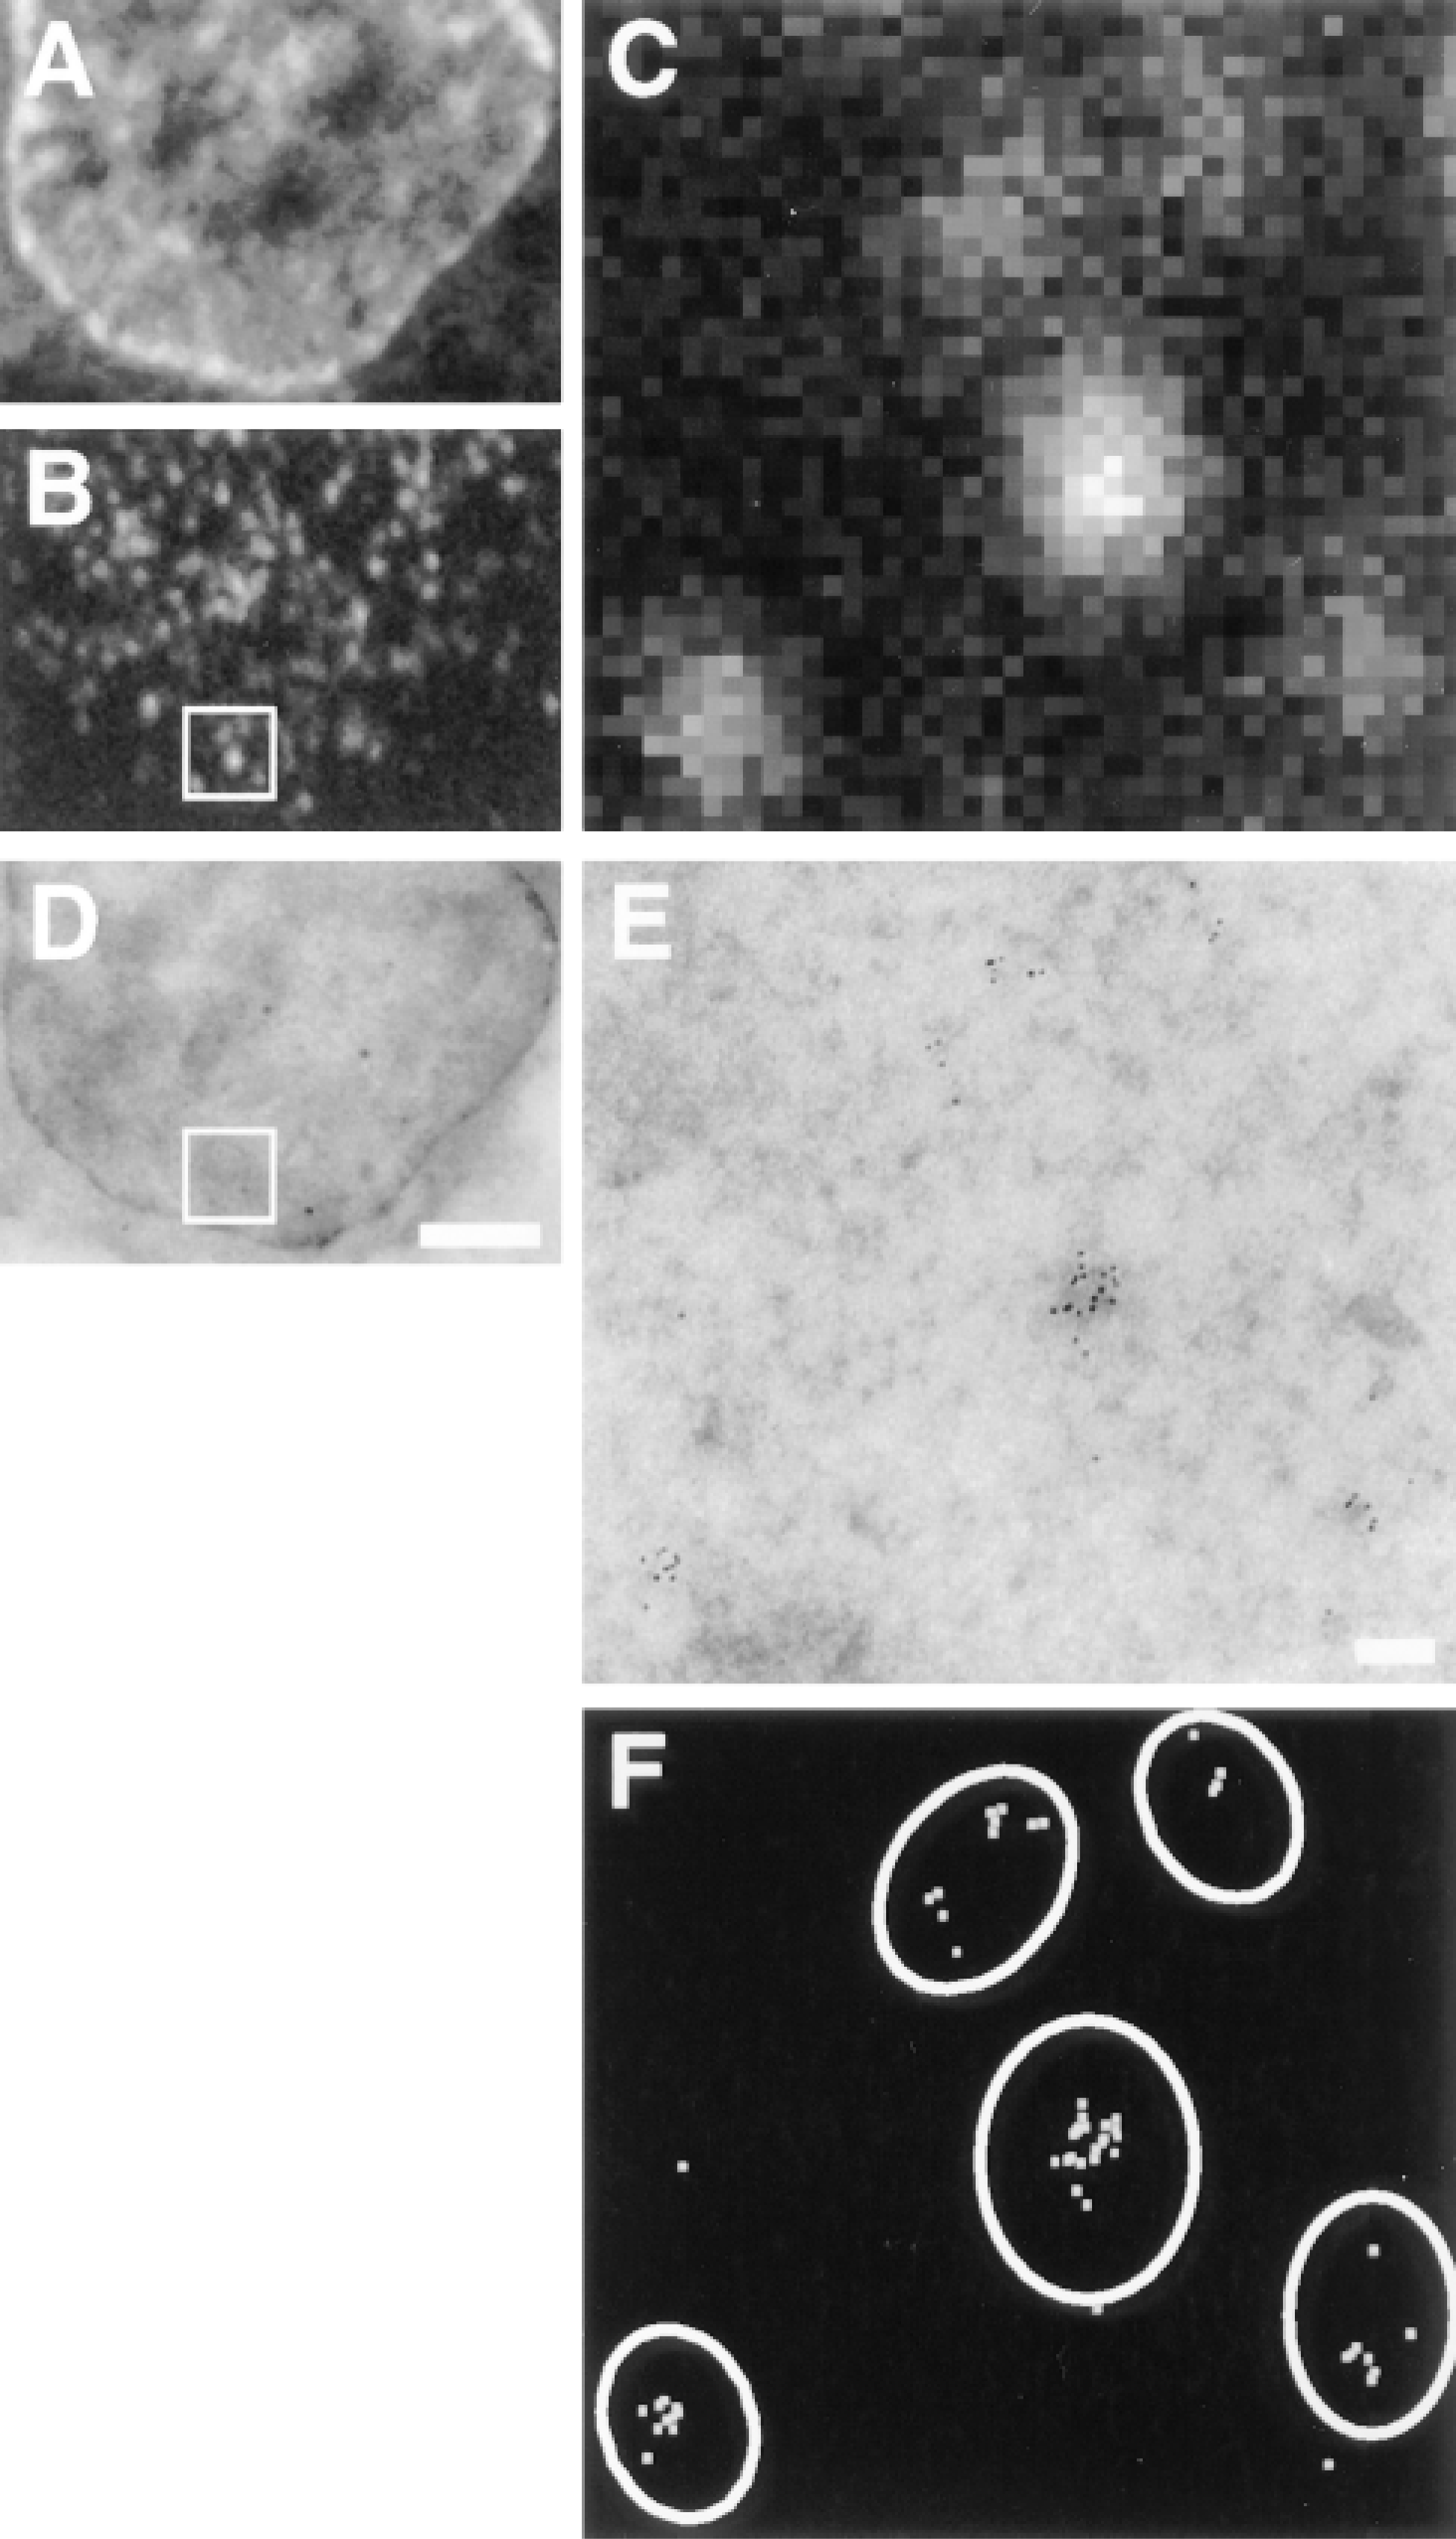
Imaging the same transcription sites by confocal and electron microscopy. A suspension culture of HeLa cells was permeabilized, allowed to extend nascent transcripts in Br-UTP for 15 min, fixed, and cryosections (∼150 nm) prepared. One cryosection was transferred onto a glass coverslip, Br-RNA indirectly immunolabeled with FITC-protein A adsorbed to 6-nm gold particles, and nucleic acids counterstained with TOTO-3. Green (FITC; Br-RNA) and far-red (TOTO; nucleic acids) images were collected on the confocal microscope. Then the section was flat-embedded in a block of Epon and the block resectioned. Finally, the end section (∼150 nm) was imaged in the electron microscope. (A-C) Confocal microscopy. The low-power views illustrate the distribution of nucleic acids (A) and Br-RNA (B) in one nucleus; (C) shows an enlargement of the area in the box in B. (D,E) Electron microscopy. The low-power view (D) confirms that the same cell is imaged. (E) Enlargement of the boxed area in D; Br-RNA is marked by clusters of gold particles. (F) Co-localization. The boundaries of the foci seen in C are overlain over the gold particles (shown in white) seen in D. Bars: A,B,D = 2 μm; C,E,F = 100 nm.
Diameter of Transcription Sites Determined by Electron Microscopy
The diameter of transcription sites, seen as clusters of gold particles in cryosections, was determined using the sequential-subtraction method (Weibel 1979,1980). This allows the radius, R, of spheres to be deduced from the radii (r) of circular profiles seen in 2-D images of 3-D sections cut through the sample. Spheres lying completely within the section appear as circles with radius R; any cut nonequatorially may give polar “caps” that either appear smaller or are missed because they are too small to be detected. Clusters of particles marking nucleoplasmic transcription sites had a mean (corrected) radius of 18 nm (Figure 5). Because the length of the immunolabeling probe used during this analysis represents a significant fraction of the diameter of the underlying structure, these are likely to be overestimates. [See Iborra and Cook (1998) for an investigation of possible errors.]
The sequential-subtraction method also provides information on sensitivity of detection; undetected sites and caps would give negative frequencies in Figure 5. Because none are seen here, the method must be very sensitive. Moreover, detected sites range in volume from 1/373 to 9 times the average, so Br-RNA can be detected over a ∼3000-fold range. However, sites soon become saturated with gold particles (i.e., 35 at most with the immunolabeling procedure described here; not shown), so the number of gold particles per site is a poor measure of Br-RNA content.
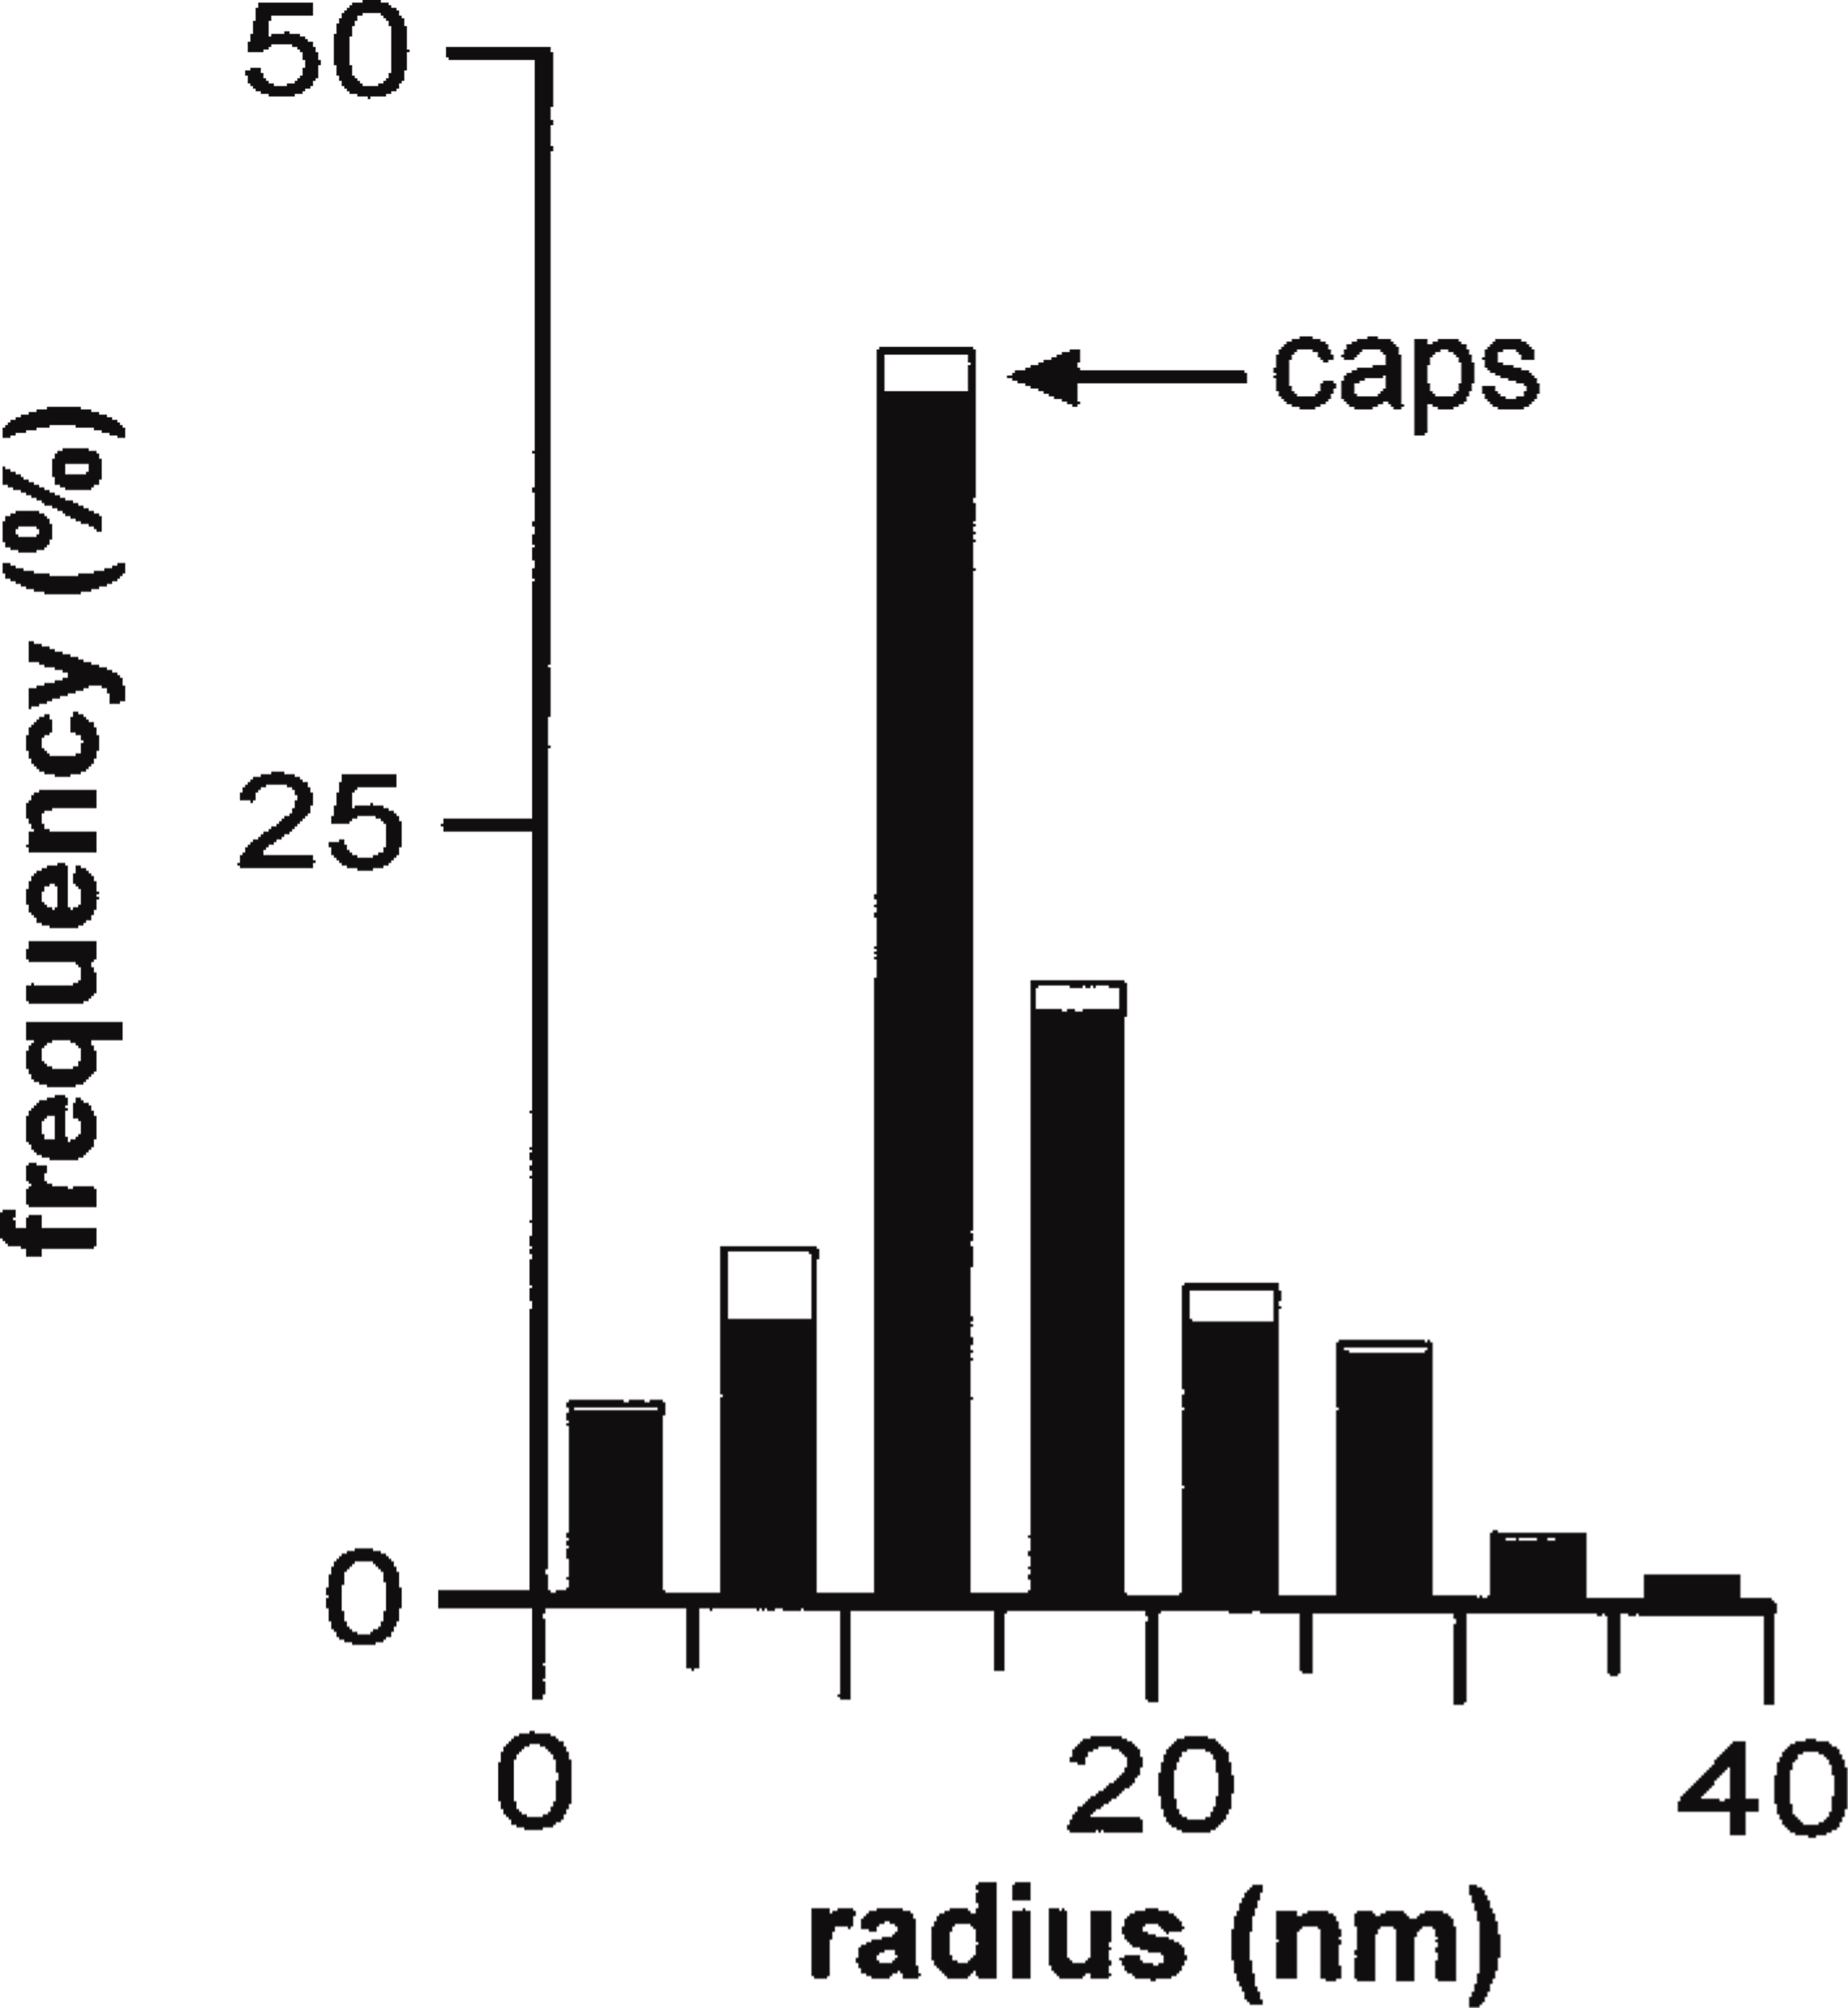
The sizes of transcription sites. The radii of 85 clusters of gold particles marking Br-RNA was measured using cryosections (150 nm) labeled as in Figures 4D and 4E (see Materials and Methods), the contributions of polar caps arising from sectioning calculated, and the numbers in different size ranges expressed as percentages of the total. White areas reflect the contribution of caps and black areas the corrected frequencies. Clusters had a weighted mean radius of 18 ± 7 nm.
Discussion
The Use of Cryosections Improves Resolution of Light Microscopy
The resolution of the conventional light microscope is limited to ∼200 nm in the x- and y-axes, and at least 500 nm in the z-axis (Pawley 1995). We now describe a simple way of sidestepping problems associated with the poor z-axis resolution. Thin cryosections of 100–200 nm were prepared, using a technique borrowed from electron microscopy, and then viewed in light microscopes equipped with conventional or confocal optics. We demonstrate the utility of the approach by examining the thousands of transcription sites found in the nuclei of human cells. These sites can be imaged after allowing permeabilized cells to extend nascent transcripts by ∼1100 nucleotides in the presence of Br-UTP, before the resulting nascent Br-RNA is marked with antibodies tagged with fluorochromes (Jackson et al. 1993; Wansink et al. 1993; Iborra et al. 1996a). When whole cells are viewed in the conventional light microscope, the nucleoplasmic sites are so small and numerous that they appear as a diffuse blur (Figure 2A). The optical sectioning provided by the confocal microscope enables some discrete sites to be resolved, although it remains difficult to count them accurately because so many still merge into each other (Figure 2B). Cryosectioning provides a striking simplification of the pattern in both conventional and confocal microscopes, with the latter giving the sharpest images (Figure 2C and 2D). This is in accord with theory (Shaw 1995; Wilson 1995), and results mainly because sites originally lying above and below the section cannot contribute to the image, so that fewer foci with a more representative range of intensities are seen against a lower background.
The use of thin cryosections confers several other advantages. For example, two different fluorochromes are often used to mark two different antigens (e.g., a nascent transcript and a polymerase or transcription factor) to see if they co-localize (e.g., Grande et al. 1997; Zeng et al. 1997). This approach requires that there is little misregistration or difference in magnification between the two resulting images. However, the two fluorochromes cannot be exactly in focus in both images because they necessarily emit light of different wavelengths that is diffracted to different degrees (Keller 1995). This chromatic aberration becomes more acute when objects lying at different depths in cells or confocal sections are imaged. Although such distortions can be partially corrected using the appropriate algorithms (e.g., Scalettar et al. 1996), the problem can be minimized using cryosections: an in-focus image of one fluorochrome is collected, filters are switched, the microscope refocused, and an image of the second fluorochrome collected (Figure 3). Then, both images are in focus, easing comparison. Therefore, this approach reduces the chromatic aberration inevitably associated with the simultaneous collection of multicolor images.
Cryosections also facilitate imaging of the same objects by light and electron microscopy (Figure 4). This was demonstrated by indirectly immunolabeling sites containing Br-RNA with FITC-protein A adsorbed on to 6-nm gold particles. After collecting a fluorescent image on the confocal microscope, the same section was transferred to the electron microscope so that the gold particles could be seen. This enables comparison of the sensitivities of the two methods and assessment of the strengths and weaknesses of the different approaches used for analysis. The two methods had similar sensitivities, but electron microscopy gave the highest resolution. For example, the number of sites was underestimated by ∼17% by light microscopy, largely because several small sites that some contained could not be resolved. Of course, electron microscopy is required to determine precisely the diameters of small objects.
The use of cryosections to analyze spherical structures, not much smaller than the thickness of the section, has one major disadvantage: some spheres are cut nonequatorially to give polar caps, which may be missed because they are too small to be detected. [For example, with spheres of 40-nm diameter, ∼7% of the profiles seen in sections 150 nm thick will be nonequatorial.] However, the sequential-subtraction method of Weibel (1979,1980) can be used to estimate how many such caps go undetected in practice. Because large sites with ∼3000 times the volume of the smallest are seen (Figure 5), this means that Br-RNA can be detected over a ∼3000 range. This extraordinary sensitivity probably stems from the ease with which antibodies can access their targets within the thin section and the presence of so many targets (i.e., bromine residues) within each site. For example, under the labeling conditions used, a typical nucleoplasmic site contains ∼14 nascent transcripts, each with ∼250 bromine residues (Iborra et al. 1996a; Jackson et al. 1998). Unfortunately, it is unlikely that proteins within such sites will be detected as efficiently, especially when only one epitope on the protein is detected. Note also that sites containing Br-RNA soon become saturated with gold particles, so the number of particles in a site does not directly reflect Br-RNA content. Moreover, the method has little dynamic range, despite its sensitivity.
Nascent Transcripts are Concentrated in Discrete Factories
The total number of nucleoplasmic transcription sites in 3-D space can be calculated (using standard stereo-logical procedures) from the numbers and diameters of clusters seen in 2-D sections, with knowledge of nucleoplasmic volume. The density of sites seen here (i.e., 1.6 cluster/μm2) corresponds to 6500 extranucleolar sites/nucleus (see also Iborra et al. 1996a; Iborra and Cook 1998; Jackson et al. 1998). This value should be compared with the 75,000 RNA polymerases that are believed to be active within the nucleoplasm (Jackson et al. 1998). Why is the number of sites seen so much smaller than the number of nascent transcripts?
Until recently, it had been assumed that active polymerases were spread randomly throughout euchromatin, so that only a few would appear to form local clusters. Then, using an insensitive detection method for detecting nascent RNA, we might observe only the few clustered transcripts, while missing the majority. However, the results described above make this possibility unlikely. First, the two detection methods (involving light and electron microscopy), which would be expected to have different thresholds of detection, image roughly the same number of sites (Figure 4). Second, no signal above background is detected between sites by either method (Figure 4). This is so, despite one method proving sufficiently sensitive to detect Br-RNA over a 3000-fold range (see above). Moreover, similar results are obtained with intact and permeabilized cells (Jackson et al. 1998), different analogues incorporated in different amounts (e.g., Br-U in vivo, biotin-CTP in vitro (Iborra et al. 1996a; Jackson et al. 1998), and after nuclease digestion or extraction to improve immunolabeling (Iborra et al. 1996a; Jackson et al. 1998). If most sites are being detected, this means that each site contains ∼14 polymerizing complexes and nascent transcripts. Therefore, we must reevaluate both how polymerases are organized within nuclei and the mechanics of transcription (Iborra et al. 1996b).
Footnotes
Acknowledgements
Supported by the Junta Nacional de Investigação Científica e Tecnológica of Portugal and the Wellcome Trust.
We thank Drs D. Vaux, T. Wilson, and N. White for their help.