
Abstract
We describe a colloidal gold immunolabeling technique for electron microscopy which allows one to differentially visualize portions of DNA replicated during different periods of S-phase. This was performed by incorporating two halogenated deoxyuridines (IdUrd and CldUrd) into Chinese hamster cells and, after cell processing, by detecting them with selected antibodies. This technique, using in particular appropriate blocking solutions and also Tris buffer with a high salt concentration and 1% Tween-20, prevents nonspecific background and crossreaction of both antibodies. Controls such as digestion with DNase and specific staining of DNA with osmium ammine show that labeling corresponds well to replicated DNA. Different patterns of labeling distribution, reflecting different periods of DNA replication during S-phase, were characterized. Cells in early S-phase display a diffuse pattern of labeling with many spots, whereas cells in late S-phase show labeling confined to larger domains, often at the periphery of the nucleus or associated with the nucleolus. The good correlation between our observations and previous double labeling results in immunofluorescence also proved the technique to be reliable.
Keywords
Investigations of the localization of the replication sites at the ultrastuctural level have been carried out using various techniques. High-resolution autoradiography of [3H]-thymidine-labeled DNA was frequently employed in the past (e. g., Blondel 1968; Fakan and Hancock 1974; for review see Fakan 1978). This method often requires relatively long periods of exposure time and resolution power is limited to the diameter of the silver halide crystal and to the processing technique of development (Fakan and Hancock 1974). To minimize these problems, dUTP containing a biotin molecule was used in conjunction with immunological detector systems such as anti-biotin antibodies (Langer et al. 1981) coupled with gold probes. However, only permeabilized cells incorporate biotin dUTP (Hozák et al. 1994; Ferreira and Carmo-Fonseca 1997), which can give rise to an alteration of the fine structure of the cells. For this reason, bromodeoxyuridine (BrdU), a thymidine analogue that does not need cell permeabilization for its incorporation, is more commonly used (Thiry and Dombrowicz 1988; Raska et al. 1991; Sobczak-Thepot et al. 1993; Tsuyama et al. 1994; Tamatani et al. 1995).
However, the analysis of the dynamic features of DNA synthesis involves the use of two or more independent DNA replication labels in the same experiment. Although this can be done by combining BrdU with tritiated thymidine, this requires the use of the autoradiographic technique (for review see Dolbeare 1995). Another approach would be the application of two nonradioactive DNA precursors that are incorporated by cells in vivo (Shibui et al. 1989). DNA double labeling was performed using two halogenated deoxyuridines, IdUrd and CldUrd, which were detected with selected antibodies and immunofluorescent probes (Aten et al. 1992,1994).
In the present work we adapted the DNA double labeling technique described by Aten et al. (1992) at the electron microscopic level, with satisfactory preservation of the nuclear fine structure. This method enables one to differentially visualize portions of DNA replicated during different periods of S-phase.
Materials and Methods
Cell Labeling with Halogenated Deoxyuridines
Cultures of V79 Chinese hamster cells (fibroblast-like) were grown as monolayers in tissue culture flasks as already described (Manders et al. 1996). The cells were grown in Eagle's minimum essential medium with Hanks' balanced salt solution, supplemented with 10% fetal calf serum, glutamine and penicillin. The duration of the S-phase for these cells was 5-6 hr.
In the single labeling experiments, cells in culture were incubated for 30 min with iododeoxyuridine (IdUrd) or chlorodeoxyuridine (CldUrd) (final concentration 10 μM; Sigma, St Louis, MO). In the double labeling experiments, cells were first incubated with IdUrd for 25 min, after which the medium was removed and cells were washed several times with the prewarmed medium. The medium was supplemented with thymidine (100 μM) for the first washing step. Then the cells were cultured for 2 hr and finally labeled with CldUrd for 30 min (Aten et al. 1994). As a control, cultures were labeled with a mixture of IdUrd and CldUrd (10 μM) for 30 min. At the end of the labeling experiments, cells were washed with PBS before fixation.
Antibodies
Monoclonal antibodies against BrdU, selected for their specificity for IdUrd (mouse antibody from Becton-Dickinson, Mountain View, CA, 7580) and for CldUrd (rat antibody from Sera-Lab, Crawley Down, Sussex, UK, Mas 250c clone Bu/75) (Aten et al. 1992) were both diluted 1:50. The second set of antibodies, coupled with colloidal gold particles (6 nm GAM IgG and 15 nm GARa, respectively; Aurion, Wageningen, The Netherlands), were diluted 1:8.
Immunoelectron Microscopy
Cell monolayers were fixed in situ with 4% paraformaldehyde in 0.1 M Sörensen phosphate buffer, pH 7.3, for 1 hr at 4C. After rinsing with Sörensen buffer and PBS, cells were scraped off the flask bottom, centrifuged (2000 rpm for 5 min at room temperature), and embedded in 2% low-viscosity agarose. Free aldehydes were blocked in 0.5 M NH4Cl in PBS for 15 min at 4C. The specimens were dehydrated with ethanol, embedded in LR White resin, and polymerized for 24 hr at 60C.
Ultrathin sections on formvar-carbon-coated nickel grids were treated for DNA denaturation with 0.7 M NaOH (Fluka Chemie; Buchs, Switzerland, no. 71690) for 2 min 10 sec or 5 min at 20C; the former was chosen as standard procedure. After NaOH, sections were rinsed in H2O and PBS and then incubated on a drop of 10% BSA (bovine serum albumin; Fluka, no. 05480) and 10% NGS (normal goat serum; Nordic Immunology Laboratories, Tilburg, The Netherlands) in PBS for 15 min. Sections were then incubated for 30 min at 20C on rat-anti-CldUrd and mouse anti-IdUrd, diluted together 1:50 in PBS containing 1% BSA and 0.1% Tween-20. After rinsing and incubating with Tris high-salt buffer (29.2 g NaCl + 3.39 g Tris HCl/liter, 1% Tween-20, pH 8.0) four times for 5 min, grids were rinsed quickly with PBS/Tween and then incubated with PBS for 15 min. Finally, grids were treated for 10 min with 20% NGS diluted in PBS. The secondary antibodies, goat anti-rat (GARa, 6-nm gold grain) and goat anti-mouse (GAM, 15-nm gold grain), coupled with colloidal gold particles, were diluted together at the concentration of 1:8 in PBS containing 1% BSA and incubation was carried out for 30 min. The grids were finally rinsed with PBS and distilled water and then air-dried. The preparations were stained with the EDTA technique (Bernhard 1969) in such a way that it slightly decreased chromatin contrast to better visualize the small gold particles.
Controls consisted of omitting the primary antibodies and of immunolabeling unlabeled cells. In addition, labeled cells were preincubated at 37C for 3 hr with 1 mg/ml DNase I (Sigma) in Sörensen buffer containing 3 mM MgCl2 (pH 7.4) to remove DNA and then immunolabeled. Moreover, some sections mounted on gold grids were first immunolabeled and finally stained with an osmium-ammine mixture at 0.2% for 1 hr after HCl hydrolysis (HCl 5 N, 20 min, 20C) to specifically visualize DNA (Cogliati and Gautier 1973). Observations were carried out with a Philips CM12 electron microscope at 80 kV, using a 40-μm objective aperture.
Quantitative Evaluation
To evaluate background and the degree of crossreactivity of both antibodies, labeling densities were determined for two experimental conditions. Sections of cells that had incorporated either CldUrd or IdUrd for 30 min were double immunolabeled with both primary antibodies and revealed with secondary antibodies conjugated with 6- or 15-nm colloidal gold.
The immunogold labeling density was determined by counting, with a binocular microscope (X 7), particles in the nuclei in electron micrographs printed at a final magnification of X 16,000. The nuclear area was determined morphometrically and the labeling density was expressed as number of gold particles per μm2 of nuclear surface. Each value represents the mean of 15 individual nuclei ± SEM.
Results
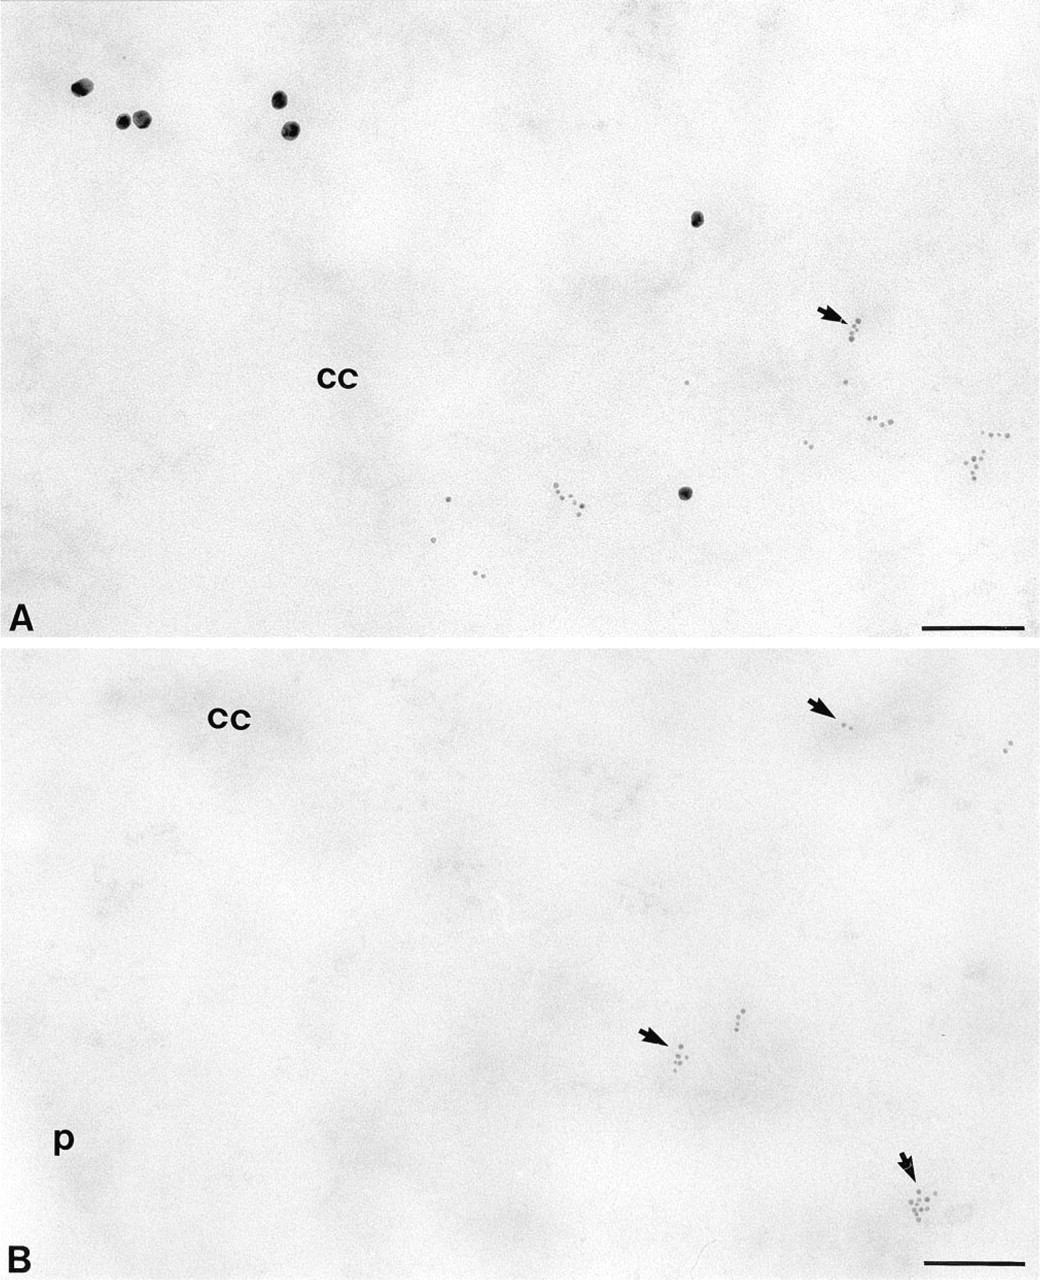
IdUrd/CldUrd double immunolabeling on an ultrathin section of V 79 Chinese hamster cells fixed in paraformaldehyde and embedded in LR White resin is shown in Figure 1A. It shows DNA that is replicated during two different periods of S-phase (IdUrd 25 min, chase 2 hr, CldUrd 30 min). Labeling is essentially localized in the nucleus, over the condensed chromatin areas as well as at their periphery, where individual dispersed chromatin fibrils can be observed (Figure 1A). Chromosomes in mitotic cells are devoid of labeling (data not shown).
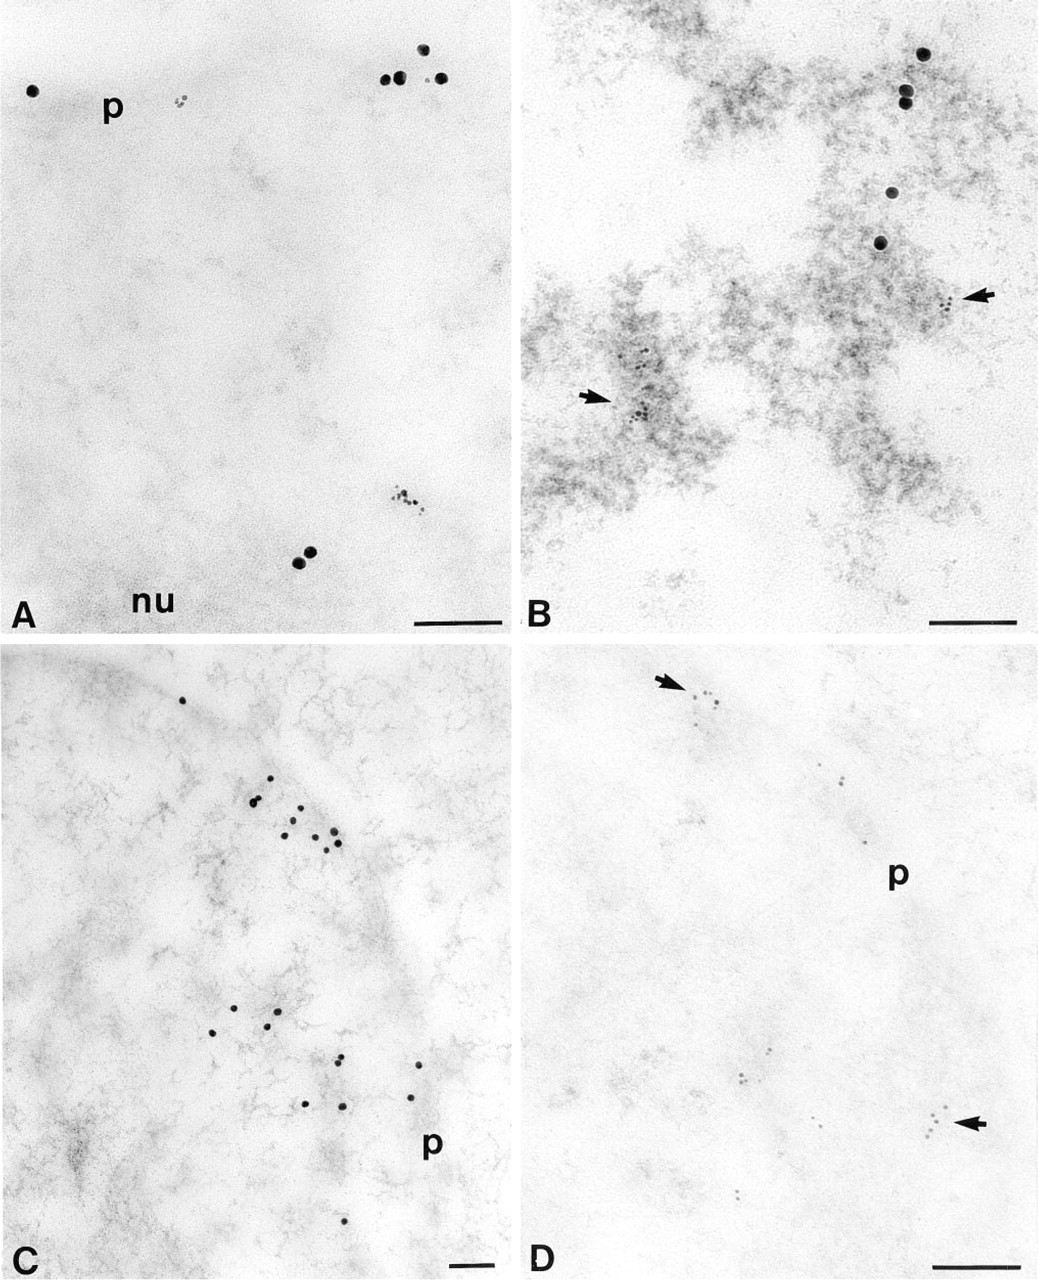
In cells displaying both 15- and 6-nm gold particles (this corresponds to mid- or late S-phase nuclei at the moment of fixation) and in cells showing only 15-nm gold particles (this corresponds to cells that incorporated only IdUrd during mid- or late S-phase and were fixed in G2), label was often observed at the proximity of the nuclear membrane and at the periphery of the nucleolus (Figures 1A and 2A). In cells displaying only 6-nm particles (this corresponds to cells that incorporated only CldUrd in early or mid-S-phase), the localization pattern consisted of many small areas scattered throughout the nucleoplasm (Figure 1B). This localization was also occasionally observed in cells displaying both CldUrd and IdUrd signal (data not shown).
After a prior DNA denaturation with NaOH (2 min 10 sec), labeling was observed in about 50% of the cells. Omission of NaOH denaturation results in a weak signal. Moreover, longer denaturation times decrease labeling intensity. The denaturation of 2 min and 10 sec allows sufficiently good preservation of the fine structure of nuclear components (Figures 1A, 1B, and 2A) and gives rise to an optimal immunocytochemical signal. Fixation with glutaraldehyde provides better structural preservation than paraformaldehyde fixation. However, the use of glutaraldehyde, even in a mixture with paraformaldehyde, results in lack of specificity of the immunolabeling with the selected anti-CldUrd and anti-IdUrd antibodies (data not shown).
The specificity of the DNA double labeling was tested in several ways. First, unlabeled cells after immunolabeling were devoid of gold particles (data not shown). The same results were obtained for labeled cells when the primary antibodies were omitted and when the DNA was removed by treatment with DNase I (data not shown). Moreover, as revealed with the osmium ammine staining, which is specific for DNA at the ultrastructural level (Cogliati and Gautier 1973), labeling corresponds well to DNA (Figure 2B) and therefore represents DNA replication patterns. Finally, in cells labeled with both CldUrd and IdUrd over the same period of 30 min, the two signals occur mostly in the same nuclear regions (data not shown).
To test the specificity of the rat anti-BrdUrd and the mouse anti-BrdUrd for incorporated CldUrd and IdUrd, respectively, double immunostaining was performed on sections of cells that had incorporated either CldUrd or IdUrd. Some crossreactivity occurs in both probes, and especially with the mouse anti-BrdUrd. However, this problem could be largely minimized (Figures 2C and 2D) by applying the following protocol: (a) blocking with NGS for the mouse anti-BrdUrd and with BSA for the rat anti-BrdUrd, (b) incubating only for 30 min in a mixture of rat anti-BrdUrd and mouse anti-BrdUrd diluted at 1:50; and (c) washing with Tris high-salt buffer containing 1% Tween-20. These steps appear to be essential for differential visualization of the two signals. Moreover, they are also important factors in reducing the background labeling (data not shown).
Quantitative estimation of the extent of crossreactivity between the primary antibodies was carried out under the same conditions for both antibodies. Our results show that after IdUrd incorporation, anti-IdUrd had a density of 16.38 ± 1.03 and anti-CldUrd of 0.53 ± 0.11. After incorporation of CldUrd, the anti-CldUrd density was 16.61 ± 1.44 and the anti-IdUrd density was 0.58 ± 0.08. The background determined on resin outside cells was 0.13 ± 0.03 and 0.08 ± 0.04, repectively, for 6-nm gold grains and 0.02 ± 0.01 and 0.01 ± 0.01, respectively, for 15-nm gold particles. These results show that the degree of crossreactivity is about 25 to 30 times below the labeling level of the incorporated nucleotide. Moreover, the background level is negligible for the two antibodies used.
Discussion
An immunoelectron microscopic double labeling method has been developed for studying DNA replication at two different periods of S-phase on cells that were pulse-labeled with two different halogenated nucleotides (IdUrd 25 min, chase 2 hr, CldUrd 30 min).
Ultrathin sections of V79 Chinese hamster cells incubated with IdUrd for 25 min before a chase period of 2 hr and subsequent labeling with CldUrd for 30 min. Sections were immunolabeled with mouse anti-IdUrd (15-nm gold grains) and rat anti-CldUrd (6-nm gold grains).
Ultrathin sections of V79 Chinese hamster cells incubated with IdUrd for 25 min before a chase period of 2 hr and subsequent labeling with CldUrd for 30 min
Under the conditions used, the regions differently labeled do not overlap (Figures 1A and 2B). This correlates with previous immunofluorescence results (Gratzner 1982; Fox et al. 1991; Manders et al. 1992, 1996). These reports indicate that the average replication time of a chromatin region, from initiation to the termination, was about 1 hr and that these regions or domains did not overlap if the time between the addition of the two labels was at least 1 hr. Our results confirm that DNA replication takes place in distinct domains and that early and late replicated domains are separated.
With immunofluorescence, it was shown that replication patterns of the early S-phase consisted of many small domains scattered throughout the nucleoplasm, whereas in late S-phase replication sites were larger and in much smaller numbers (Manders et al. 1996). Our electron microscopic observations pointed out different patterns of DNA replication. Indeed, many small sites of DNA replication were observed for the cells displaying only anti-CldUrd antibodies (Figure 1B) and therefore fixed during the first 2.5 hr of the S-phase. This pattern was sometimes also observed in cells displaying the two antibodies and therefore fixed 2.5-3 hr after onset of S-phase. Cells fixed in the last third of S-phase show the label confined especially to peripheral and intranuclear dense chromatin and to chromatin located at the periphery of the nucleolus (Figure 2A). The diffuse labeling pattern (many spots) was reported as indicating early or mid-S-phase (Manders et al. 1992; Sato et al. 1995), whereas the peripheral pattern was considered to be characteristic of late S-phase, even though it was previously observed during mid-S-phase by some authors (for review see Spector 1993). In our conditions, the S-phase lasts 5-6 hr and the diffuse pattern was reported for the first 4 hr using the immunofluorescence technique (Manders et al. 1992).
Ultrastructural localization of label was found in two patterns, as previously shown by autoradiography of tritiated thymidine or by immunocytochemical detection of BrdU (Fakan and Hancock 1974; Sobczak-Thepot et al. 1993; Tamatani et al. 1995). In one pattern, label occurred in condensed chromatin areas, and in the other label was found with dispersed chromatin fibrils (Figure 1A). These two patterns may reflect different replication sites during progression through S-phase.
Considering the good correlation between our electron microscopic observations and the previous results obtained by immunofluorescence microscopy, notably the low background (data not shown) and very low crossreactivity at the ultrastructural level (Figures 2C and 2D), we can conclude that the double immunolabeling technique for electron microscopic analysis of DNA replication is reliable. The incorporation of CldUrd and IdUrd does not require cell permeabilization, thus improving the preservation of nuclear structure. Moreover, the two halogenated deoxyuridines, used under similar conditions, did not change the growth kinetics of Chinese hamster cells (Aten et al. 1992). Therefore, this technique is useful for studying the in situ dynamics of DNA replication and, in particular, of nascent DNA at the ultrastructural level.
Studies aiming at the detailed analysis of ultrastructural distribution of differentially labeled DNA fractions synthesized during various periods of S-phase are in progress. This should enable us to further approach the question of chromatin movement at the electron microscopic level after DNA replication and of the structural relationships among different chromatin domains.
Footnotes
Acknowledgements
Supported by the Swiss National Science Foundation (grant no. 31-43333.95) and the Swiss Federal Office of Education and Science (OFES 95.0823) in the frame of the EU Biomed II Program (project no. BMH4-CT95-1139).
We would like to thank Ms J. Fakan and Ms F. Voinesco for excellent technical assistance, and Dr S. Tapia for help with statistical analyses.