
Abstract
Cell death is roughly categorized as either apoptosis or necrosis. For better understanding of the differences in DNA cleavage between them, we performed quantitative analysis of both the 3′-OH and the 5′-OH ends of DNA strand breaks via in situ nick-end labeling (ISEL) combined with transmission electron microscopy (TEM) of both heat-induced apoptosis and necrosis in mouse B-cells derived from a lymphoma cell line. To detect the 5′-OH ends, the 3′-P ends located on the opposite side holding the 5′-OH ends were dephosphorylated into 3′-OH ends with alkaline phosphatase. As assessed by statistical analysis of both the 3′-OH and the 5′-OH ends, their labeling densities were significantly higher in both the apoptotic and the necrotic cells in the early stage than in control cells. The labeling densities increased during the apoptotic and necrotic processes, except for a decrease in the density of the 3′-OH ends in necrotic cells in the late stages. Therefore, DNA degradation in both necrosis and apoptosis provides early evidence for these processes, and both apoptosis and necrosis may share at least the first steps of DNA degradation pathways.
Keywords
M
It is generally accepted that the ultrastructural changes of apoptosis are characterized by nuclear chromatin condensation, surface protuberances, cytoplasmic shrinkage, and apoptotic bodies (Kerr et al. 1972). As the apoptotic process proceeds, the nucleus with condensed chromatin splits into several fragments within the cytoplasm, in contrast to the other morphologically well-preserved intracellular organelles. The fragmented nuclei that are covered with a cell membrane are called apoptotic bodies, and the intracellular organelles are no longer discernible. Agarose gel electrophoresis of DNA extracted from apoptotic cells revealed nucleosomal DNA fragmentation, i.e., the DNA ladder (Arends et al. 1990). It is believed that, during the apoptotic process, fragmented DNA is cleaved by specific endonucleases such as DNase I and II (Barry and Eastman 1993; Peitsch et al. 1993) to yield free 3′-OH ends.
In necrosis, the characteristic ultrastructural alteration is cell swelling and the degeneration of intracellular organelles, especially mitochondria. Part of the disintegrated cytoplasm passes out through the disrupted cell membrane into the surrounding connective tissue, inducing local inflammation of this tissue. The nucleus of the necrotic cells, in contrast to the cytoplasmic degeneration, remains intact (Zheng et al. 1991). Electrophoresis using DNA extracted from necrotic cells demonstrates the nonspecific decomposition of DNA as a smear on gels (Kerr and Harmon 1991).
In addition to TEM and agarose gel electrophoresis using extracted DNA, the ISEL technique, which labels free 3′-OH ends, was developed and is widely used for discrimination between apoptotic cells and necrotic cells.
Recently, much interest has been focused on problems related to the specificity of both the agarose gel electrophoresis of extracted DNA and the ISEL technique in detection of cell death, although both are far more convenient methods than TEM. It is well known that in agarose gel electrophoresis, when the sample contains only a few apoptotic cells, there is no demonstration of the DNA ladder (Herrmann et al. 1994) and the ISEL technique is positive not only for apoptotic cells but also for necrotic cells (Ansari et al. 1993; Wijsman et al. 1993). It is now generally accepted that apoptosis and necrosis are not completely distinct. Several authors have reported that both apoptosis and necrosis can occur simultaneously in tissues or cell cultures exposed to the same stimulus, and often the intensity of the stimulus determines the prevalence of either apoptosis or necrosis (Shimizu et al. 1996; Leist et al. 1997).
To date, little is known of the mode of DNA cleavage and the ultrastructural changes of nuclear chromatin involved in necrosis, compared with those involved in apoptosis. This study was designed to detect the 3′-OH and 5′-OH ends together with ultrastructural changes, using examples of both apoptosis and necrosis induced by various intensities of heat. Moreover, the image analysis for quantitative changes of both the 3′-OH and the 5′-OH ends in each apoptotic or necrotic cell was performed on a computer using the NIH Image program.
Materials and Methods
Cell Culture and Heating Procedures
Mouse B-cells derived from a lymphoma cell line (NP3 cells) were cultured in RPMI 1640 medium supplemented with 5% fetal calf serum. Heating was carried out by adding 0.2 ml of the medium containing approximately 1 × 10⁷ logphase cells into 20 ml of the medium preheated to the desired temperature in flasks within a water bath. The flasks containing the cells remained immersed in the water bath at the required temperature for 30 min. The culture medium in the flasks was then cooled to 37C by gentle agitation at room temperature (RT) for 3–4 min, after which the flasks were returned to a standard tissue culture incubator at 37C. Control cultures were sham-heated at 37C.
Cells were heated at 42–48C for 30 min and samples were recovered 8 and 24 hr after completion of the heating process. Control cells cultured at 37C were recovered at the same time as heated cells.
DNA Extraction and Agarose Gel Electrophoresis
DNA was extracted from both control and heated cells. The cells were lysed overnight at 37C in 100 μl of solution containing 10 mM Tris-HCl buffer (pH 7.4), 10 mM EDTA (pH 8.0), 0.5% Triton X-100, and 1 mg/ml proteinase K. The lysed cells were treated with 40 μg ribonuclease at 37C for 1 hr. DNA was precipitated with 0.5 M NaCl and 50% isopropanol alcohol and was resuspended in 20 μl TE buffer (1 mM EDTA, 10 mM Tris-HCl, pH 8.0). DNA (10 μg) was electrophoresed for 12 hr at 14 V on a 1.5% agarose gel. The gel was then stained with ethidium bromide and photographed under UV light.
ISEL via TEM (ISEL-TEM)
Cells were given a quick rinse in 0.01 M PBS before being fixed in a solution containing 2.5% glutaraldehyde and 2% paraformaldehyde in 0.1 M phosphate buffer (PB), pH 7.2, for 1 hr at 4C. After an overnight wash in PBS, the cells were postfixed in 1% OsO4 for 45 min at RT and dehydrated in a series of graded ethanol solutions, cleared in propylene oxide, and embedded in epoxy resin. Semithin sections (1 μm thick) were stained with toluidine blue for light microscopy. Ultrathin sections (70–80 nm thick) obtained from the same block were mounted on nickel grids and an etching step was performed with saturated sodium metaperiodate for 2 min, followed by a rinse in distilled water for 10 min. A nonradioactive detection kit (Apop Tag; Oncor, Gaithersburg, MD) was used for detection of free 3′-OH DNA ends. The ultrathin sections on the grids were incubated with the working buffer containing terminal deoxynucleotidyl transferase (TdT), digoxigenin-dideoxyuridine triphosphate (digddUTP) and dideoxyadenosine triphosphate (ddATP) at 37C for 1 hr, and then incubated with the blocking buffer at 37C for 30 min. After three washes with 0.01 M Tris buffer (pH 7.4) containing 0.01% bovine serum albumin, the ultrathin sections were incubated with sheep anti-digoxigenin antibody conjugated to 10-nm colloidal gold (British BioCell; Cardiff, UK) at RT for 1 hr. After three washes with distilled water, the ultrathin sections were stained briefly with uranyl acetate and lead citrate and were examined in a transmission electron microscope.
ISEL Combined with Alkaline Phosphatase Treatment via TEM (ISEL/ALP-TEM)
To detect the 5′-OH ends of DNA fragments, the 3′-P ends located on the opposite side, holding the 5′-OH ends that had been generated by cleavage, were dephosphorylated into 3′-OH using alkaline phosphatase. Ultrathin sections mounted on the nickel grid were subjected to the etching step with the above-mentioned solution. After rinsing in drops of distilled water, the sections were incubated with CIP buffer (Nippon Gene; Toyama, Japan) [50 mM NaCl, 10 mM Tris-HCl (pH 7.9), 10 mM MgCl2, 1 mM DTT] containing 1.0 U/pmole alkaline phosphatase (Nippon Gene) (originated from calf intestine) at 50C for 1 hr. To terminate the reaction, the sections were further incubated with a solution containing 5 mM EDTA, 0.5% SDS, and 100 μg/ml proteinase K at 56C for 30 min. After three washes with distilled water, the sections were further treated using the above-mentioned ISELTEM techniques. As a result, immunogold particles demonApoptosis and Necrosis Induced by Heating strated by ISEL/ALP-TEM indicated the sites of both the primary 3′-OH ends and the 3′-P ends.
Image Analysis for Free 3′-OH DNA Ends
Image analysis of the free 3′-OH ends was performed on a Macintosh computer (Apple Computer; Cupertino, CA) using the public domain NIH Image program (written by Wayne Rasband at the US National Institutes of Health and available from the Internet by anonymous ftp from zippy.nimh.nih.gov or on floppy disk from NTIS (5285 Port Royal Rd., Springfield, VA 22161; part number PB 93-504868). The electron microscopic images of the NP3 cell nuclei that had been subjected to ISEL or ISEL/ALP were scanned by the computer and then the labeling density, as a measure of free 3′-OH DNA end density, was determined using both the NIH Image program for the nuclear area (μm2) and the numbers of immunogold particles in the nuclei of more than 10 NP3 cells at each sample. The true number of free 5′-OH ends in an individual cell was evaluated via the difference between the numbers of immunogold particles labeled by ISEL/ALP and ISEL using serial ultrathin sections. The differences in the labeling density of 3′-OH and 5′-OH ends among the control, apoptotic, and necrotic cells were analyzed statistically with Welch's t-test.
Results
According to agarose gel electrophoresis of extracted DNA, the control cells cultured at 37C for 8 hr demonstrated neither a DNA ladder nor a smear on gels. Specific DNA ladder appearance in apoptosis was demonstrated with heating from 43 to 46C. A typical DNA ladder was obtained with the culture that was heated at 43C for 30 min and was recovered 8 hr after heating (Figure 1A). The culture demonstrating the typical DNA ladder contained apoptotic cells in various stages: cells with morphologically well-preserved nuclei, others with increased heterochromatin, and some cells with nuclear fragments in the cytoplasm (Figure 2A).
A specific DNA smear in necrosis was shown in the samples heated at 47C and 48C and recovered 24 hr after heating (Figure 1B). The cells heated at 47C were characterized by swelling of the cell body, ruptured cell membranes, many vacuoles in the cytoplasm, and lack of nuclei in most cells, showing a ghost-like appearance. When the nuclei remained in the cells, they contained increased peripheral chromatin but did not fragment into the cytoplasm (Figure 2B).
Ultrastructurally, the NP3 cells possessed oval nuclei with abundant, evenly distributed and slightly increased peripheral chromatin, many ribosomes, and moderate numbers of mitochondria in the cytoplasm. The ISEL-TEM and ISEL/ALP-TEM techniques demonstrated only a few free 3′-OH ends (Figure 3A) and 5′-OH ends labeled with immunogold particles on the chromatin of the control cells. Cells heated at 43C for 30 min were roughly divided into the following three types of apoptotic cells via TEM, as the apoptotic process advanced. The morphological features of apoptotic cells in the early stage were similar to those of control cells, except for the more intense labeling of 3′-OH ends on the peripheral chromatin (Figure 3B). The nuclei of apoptotic cells in the middle stage were highly lobulated, and parts of nuclei were fragmented into the cytoplasm. The labeling of the 3′-OH ends present on the peripheral chromatin in the middle stage was more increased than that in apoptotic cells in the early stage (Figure 3C). Apoptotic cells in the late stage were characterized by round nuclear fragments filled with condensed chromatin in the cytoplasm, showing the most intense labeling of 3′-OH ends. All intracellular organelles, especially mitochondria, were well preserved morphologically, even in the late stage of apoptosis (Figure 3D). Labeling of the 5′-OH ends in apoptotic cells was weaker than that of the 3′-OH ends at all stages of apoptosis, although it increased in accordance with the nuclear changes.
DNA gel electrophoresis.
The TEM study, using cells heated at 47C or 48C, demonstrated necrotic cells at various stages, although most of the cells had lost their nuclei. Intracellular organelles were still morphologically preserved in necrotic cells in the early stage, except for loss of the microvilli and increased electron density of the mitochondrial matrix. Labeling of the 3′-OH (Figure 4A) and the 5′-OH ends (Figure 4B) on the chromatin of necrotic cells in the early stage was increased compared to that of control cells. Ultrastructural characteristics of necrotic cells in the late stage included an outpouring of the intracellular matrix through the ruptured membrane and degeneration of intracellular organelles, such as vacuolated mitochondria. Interestingly, the nuclear chromatin in necrotic cells in the late stage agglutinated into a fine granular pattern (Figure 4C). This chromatin agglutination was clearly different from the chromatin condensation in apoptotic cells, which exhibited a homogeneous staining pattern (Figure 3D). The labeling of the 3′-OH ends of the agglutinated chromatin of necrotic cells in the late stage prominently decreased (Figure 4D) compared with that in the early stage (Figure 4A). The labeling of the 5′-OH ends increased in necrotic cells in the late stage, in contrast to the decreased labeling of the 3′-OH ends in the same stage. (Figure 4D).
Light micrographs of NP3 cells heated at 43C and recovered 8 hr after heating
Statistical analysis of the labeling density of the DNA strand breaks in the nuclei of both the control cells and the cells treated by heat shock is shown in Figure 5. The mean labeling densities of the 3′-OH ends and the 5′-OH ends in control cells were 39 ± 4.3/μm2 and 11 ± 1.6/μm2, respectively. The mean labeling densities of the 3′-OH and the 5′-OH ends were significantly higher in apoptotic cells in all stages than in the control cells (p>0.01) and were highest in the late stage. In necrotic cells, the mean labeling density of the 3′-OH ends decreased as the necrotic process advanced. Conversely, the mean labeling density of the 5′-OH ends in necrotic cells was more increased in the late stage than in the early stage (p>0.01) and was significantly higher than in the control cells (p>0.01). The mean labeling densities of both the 3′-OH and the 5′-OH ends were consistently lower in necrotic cells compared with apoptotic cells.
Electron micrographs of apoptotic
Discussion
Most previous reports of morphological studies of cell death induced in tumors by hyperthermia have referred to all cell death present as “necrosis” (Fajardo et al. 1980; Overgaard 1983), the term being used in a nonspecific sense. With widespread use of the concept of “apoptosis” proposed by Kerr et al. (1972), it has been well noted that tumor cells undergo apoptosis or necrosis after various heat loads (Lambert 1912; Dewey et al. 1977; Leith et al. 1977), although the pathogenesis of heat-induced cell death remains uncertain. Apoptosis was enhanced by mild hyperthermia (a heat load on the order of 42 and 43C for 30 min) both in some normal tissues (Wanner et al. 1976; Schrek et al. 1980; Allan et al. 1987) and in tumor cells (Harmon et al. 1989). Therefore, mild hyperthermia has recently been investigated as a treatment for tumors (Streffer and Van Beuningen 1987) in addition to surgical resection, systemic chemotherapy, radiotherapy, and immunotherapy. In this study with NP3 cells, apoptosis was enhanced by mild heating in contrast to necrosis, which was induced by higher temperatures. In another experiment using the same cell line (NP3 cells) treated with anticancer drugs, we obtained the same results. Apoptosis was induced by the stimulus of a low concentration of anticancer drugs, such as cisplatin, and necrosis was induced by high concentrations (data not shown). Therefore, the fact that “the intensity of the same initial stimulus decides the prevalence of either apoptosis or necrosis” has been already reported by Bonfoco et al. (1995) and Leist et al. (1997). Moreover, Leist et al. (1997) confirmed that the two types of cell death were determined by the intracellular adenosine triphosphate (ATP) concentration; death human T-cells that were depleted of ATP and treated with apoptotic inducers changed from apoptosis to necrosis, whereas selective and graded repletion of the extramitochondrial ATP pool with glucose prevented necrosis and restored the ability of cells to undergo apoptosis. Therefore, ATP generation, either by glycolysis or by mitochondria, was required for active execution of the final phase of apoptosis (Nicotera and Leist 1997). Interestingly, this study clearly shows ultrastructural differences in mitochondria between apoptosis and necrosis. Mitochondria in apoptotic cells were morphologically well preserved even in the late stage, in contrast to vacuolated mitochondria in the necrotic cells.
More than 10 endonucleases have already been reported and have been classified into the following two DNA cleavage types: 3′-OH/5′-P type and 3′-P/5′-OH type (Shiokawa et al. 1994). According to several studies using both radiation- and dexamethasone-induced rat apoptotic thymocytes (Shiokawa et al. 1994; Tanuma and Shiokawa 1994), and actinomycin D-induced human apoptotic promyelocytes (Verhaegen et al. 1996), the terminal of fragmented DNA revealed 3′-OH/5′-P.
Therefore, DNase I (Park 1995) and DNase g (Tanuma and Shiokawa 1994) characterized by the DNA cleavage of 3′-OH/5′-P are suggested as candidates for the endonucleases involved in apoptosis. In this study, using apoptotic cells induced by mild heating, the labeling density of both the 5′-OH ends and the 3′-OH ends increased during apoptosis. This indicates the presence of several endonucleases cleaving not only the 3′-OH ends but also the 5′-OH ends in apoptotic cells and is in agreement with the finding by Mundle et al. (1995) that specific fragmentation patterns seen in various conditions of apoptosis might be a result of activation of different tissue- and cell-specific endonucleases.
The main mode of DNA cleavage differs between apoptosis and necrosis: nicks in single strands of a double-stranded DNA molecule in necrosis and double-stranded DNA breaks in apoptosis (Gold et al. 1994). In this study, the ISEL/ALP technique labeled 3′-P ends instead of 5′-OH ends located on the opposite side of DNA fragments using TdT and alkaline phosphatase, which can dephospharylate both 3′ and 5′ ends of DNA, depending on the position of the PO4 group, based on the study reported by Shiokawa et al. (1994). They have already stated that TdT can label only 3′-OH ends, in contrast to T4 polynucleotide kinase labeling only 5′-OH ends, although it is hard to exclude the possibility in this study that TdT might label the same 3′-OH/5′-P fragments at 5′ ends after removal of PO4 from the 5′ end leaving behind the OH group. Thus far, there have been some studies reporting differentiation between apoptosis and necrosis, using the ISEL technique for detection of doublestranded DNA breaks and the in situ nick-translation (ISNT) technique, which is able to label blunt ends in single strands of a double-stranded DNA molecule independent of a template (Ansari et al. 1993; Gold et al. 1993,1994). According to the study reported by Gold et al. (1994), cells undergoing apoptosis in the early stage were preferentially labeled by the ISEL technique, whereas early necrotic cells were identified by the ISNT technique. Our quantitative study of both 3′- and 5′-OH ends was in good accordance with their results. It demonstrated that the labeling density of 3′-OH ends in the early apoptotic cells was slightly higher than in the early necrotic cells and that the total labeling density of DNA ends in apoptotic cells was considerably higher than that in necrotic cells during these processes. These findings support the results of a light microscopic study using TdT and DNA polymerase I (Mundle et al. 1995), in which the authors reported that both end-labeling techniques could label apoptotic and necrotic cells, although necrotic cells were labeled with much lighter intensity. Interestingly, whereas at early stages necrotic cells demonstrated higher levels of 3′-OH/5′-P than 5′-OH/3′-P, at late stages this ratio reversed. This indicates that some different endonucleases are activated during the necrotic process, in addition to lysosomal deoxyribonucleases, which cause random DNA degradation (Harmon et al. 1990), and that their activities differ depending on the particular stage of necrosis.
Electron micrographs of necrotic NP3 cells heated at 47C and recovered 24 hr after heating, stained with ISEL-TEM
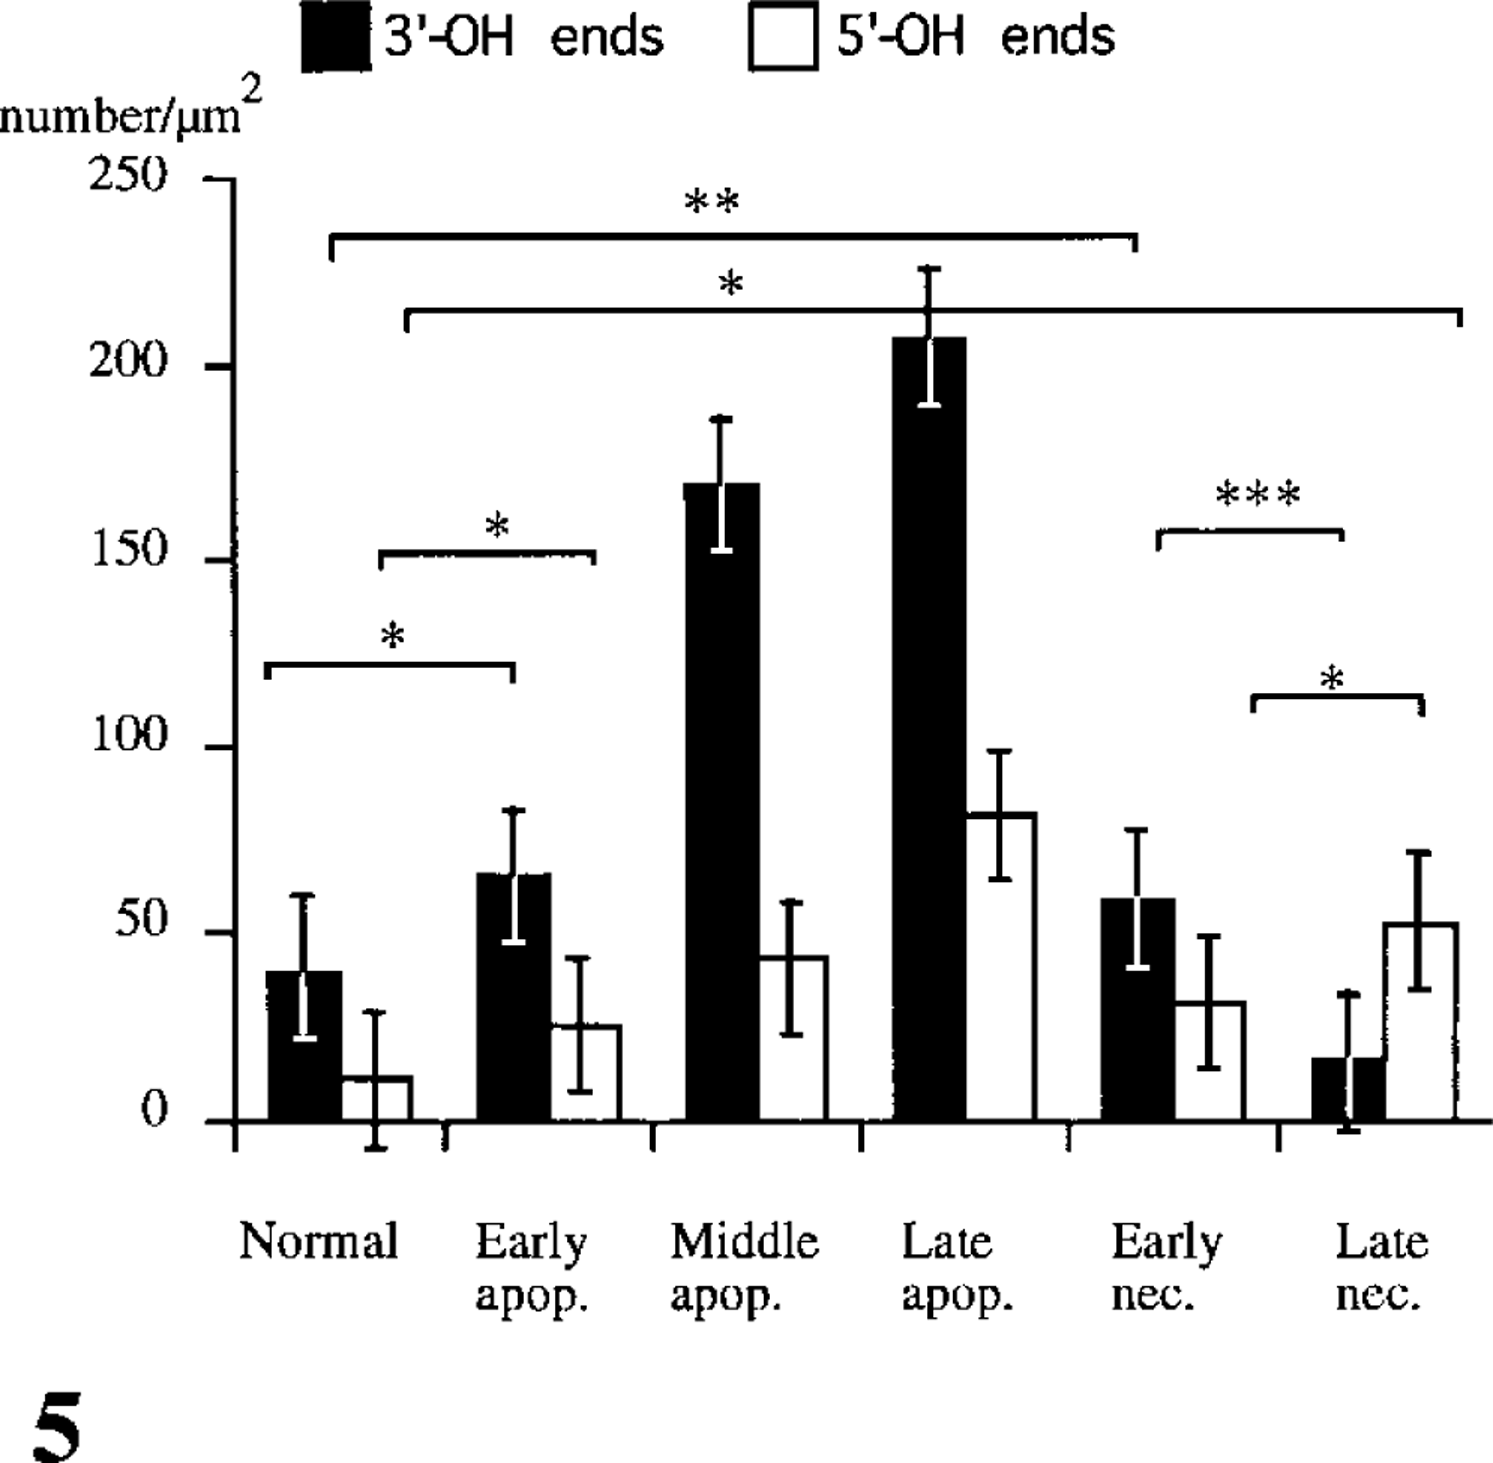
Statistical analysis of the labeling density of free 3′-OH and 5′-OH ends in the nuclei of control NP3 cells and cells heated at various temperatures, as follows: nuclei in control cells (3′ ± 9.68/ μm2 for 3′-OH ends and 11 ± 3.28/μm2 for 5′-OH ends; nuclei in the apoptotic cells (in the early stage 65 ± 5.51/μm2 and 26 ± 2.77/ μm2; in the middle stage 169 ± 23.34/μm2 and 41 ± 25.78/μm2; in the late stage 208 ± 50.5/μm2 and 81 ± 3.197/μm2, respectively); and nuclei in the necrotic cells (in the early stage 58 ± 18.88/μm2 and 32 ± 4.14/μm2; in the late stage 16 ± 2.16 /μm2 and 53 ± 1.37/ μm2, respectively). Means 6 SD. Asterisks (∗, ∗∗, ∗∗∗) indicate p>0.01, p>0.05, and p>0.001, respectively.
The other ISEL-TEM studies using cultured cells and tissues have already reported that DNA fragmentation precedes the morphological changes in apoptosis (Thiry 1991; Migheli et al. 1995; Inoki et al. 1997). On the other hand, it is generally accepted that necrotic cells are characterized by the extent of membrane changes rather than by nuclear changes, and therefore random DNA degradation in necrosis is likely to be a consequence of severe membrane disruption (Harmon et al. 1990). Recently, some studies have questioned the significance of membrane changes in necrosis and have suggested that the ultimate lethal effect of heat may take place at the DNA level (Dewey 1988; Jung and Okumura 1989; Ansari et al. 1993; Gold et al. 1993,1994). In this study using NP3 cells treated at higher temperatures, necrotic cells clearly demonstrated an increase in DNA strand breaks preceding the morphological changes. Therefore, DNA degradation in both necrosis and apoptosis provides early evidence for these processes, although the morphological changes of chromatin and both the mode and extent of DNA cleavage are considerably different between apoptosis and necrosis. Moreover, the early DNA degradation detected in both apoptotic and necrotic cells may support the hypothesis that “both apoptosis and necrosis share at least first steps of signal transduction pathways,” as proposed by Shimizu et al. (1996).