
Abstract
Intravital lectin perfusion was combined with computer-guided scanning digital microscopy to map the perfused elements of the vasculature in tumor-bearing mice. High-precision composite images (spatial precision 1.3 μm and optical resolution 1.5 μm) were generated to permit exact positioning, reconstruction, analysis, and mapping of entire tumor cross-sections (c. 1 cm in diameter). Collation of these mosaics with nuclear magnetic resonance maps in the same tumor plane identified sites of rapid contrast medium uptake as tumor blood vessels. Digitized imaging after intravital double labeling allowed polychromatic visualization of two different types of mismatched staining. First, simultaneous application of two lectins, each bearing a different fluorochrome, revealed organ-specific differential processing in the microvascular wall. Second, sequential application of two boluses of one lectin, bearing different fluorochromes successively, distinguished between double-labeled microvessels, representing efficiently perfused vascular segments, and single-labeled microvessels, with inefficient or intermittent perfusion. Intravital lectin perfusion images of blood vessels in the vital functional state thus highlighted biologically significant differences in vessel function and served as high-resolution adjuncts to MR imaging.
B
Materials and Methods
Tumor Model
C3H mice from the breeding colony of the GSF Research Centre were used. They carried subcutaneous axillary transplants of the mouse mammary adenocarcinoma AT17 (Kummermehr 1985), passage nos. 10–50. Institutional guidelines for care of these animals conformed to the German law regulating animal research. At the time of lectin perfusion, the tumors weighed 300–800 mg in mice weighing 20 g. Unless MR data had just been acquired (see below), mice were narcotized by
Lectins
The lectins HPA (Helix pomatia agglutinin), SNA (Sambucus nigra agglutinin), RCA (Ricinus communis agglutinin of 120 kD molecular weight), and MAA (Maackia amurensis agglutinin) were applied in histochemical procedures and in intravital perfusion studies as conjugates with biotin, with fluorescein isothiocyanate (FITC), or with tetramethyl rhodamine isothiocyanate (TRITC). The lectins HPA, WGA (wheat germ agglutinin from Triticum vulgaris), and RCA coupled to colloidal gold particles of 10-, 15-, or 20-nm diameter were used to visualize selected oligosaccharides by electron microscopy. Lectins were obtained from Sigma (Deisenhofen, Germany), from EY Laboratories (Medac; Hamburg, Germany), or Vector (via Camon Labor-Service; Wiesbaden, Germany). HPA binds specifically to α-galactosides, RCA to β-galactosides, SNA to α2,6-linked sialic acids, and MAA to α2,3-linked sialic acids; for further details of binding specificity refer to Debbage (1996).
Lectin Histochemistry of Fixed and Embedded Tissues
For light microscopy, tumors were fixed in formalin, dehydrated in ascending alcohols, cleared in xylol as intermedium, and embedded in Paraplast (Merck; Darmstadt, Germany). Dewaxed and rehydrated sections were treated for 30 min with 0.1% H2O2 in 30% ethanol to block endogenous peroxidases. Some sections were next incubated for 1–3 hr with 0.02–0.2 IU/ml sialidase (Type V from Clostridium perfringens; Sigma) in PBS, pH 6.0, at 37C. Buffer controls for this desialylation step were carried out as recommended by Plendl et al. (1989). All sections were then incubated in 0.5% horse serum albumin. After rinses in PBS, sections were incubated for 1–2 hr in biotinylated lectins 1–5 μg/ml in PBS at room temperature (RT) or at 37C, rinsed again, then incubated for 1 hr in an avidin-peroxidase conjugate (Sigma) 1 μg/ml in PBS at RT. After thorough rinsing, lectin binding sites were localized by development for 5 min in PBS containing 0.5% diaminobenzidine plus 0.01% H2O2. The sections were counterstained in acid hematoxylin, dehydrated in ethanols, cleared in xylol as intermedium, and mounted in DPX (BDH; Poole, UK). In control studies, the biotinylated lectins were omitted from the staining sequence. In double inhibition studies, biotinylated lectins (1–10 μg/ ml) were preabsorbed for 1 hr at RT with one of two test saccharides (0.1 M), one of these being appropriate and the other inappropriate to the lectin's binding specificity. These mixtures were then applied in place of the lectin solution in the histochemical staining protocol described above. The appropriate test saccharide blocked staining, the inappropriate one did not, and (rare) results not conforming to these expectations were excluded from the study.
For electron microscopy, mice bearing AT17 tumors were perfused transcardially with 4% paraformaldehyde plus 2.5% glutaraldehyde and the tumors were left overnight in one change of the same fixative at 4C. Slices 0.5 mm thick were cut by hand and rinsed at least four times in 1-hr changes of ammonium chloride 0.5% in PBS (pH 7.35). After dehydration in an ascending alcohol series at progressively lower temperatures, as described by Roth et al. (1981), they were embedded in LR Gold (Sigma) or Lowicryl KM4 (Biorad; Munich, Germany) as described by Herken et al. (1988). Ultrathin sections mounted on nickel grids were incubated for 1 hr with lectin-gold complexes (0.2 μg/ml protein) in PBS (30 mM, pH 7.35, containing 0.5 mM Ca++ and 0.2 mM Mg++), sometimes in the presence of 0.2 U/ml sialidase, then rinsed and allowed to dry. The preparations were contrasted with uranyl acetate and lead citrate and viewed in a Zeiss EM900 transmission electron microscope, the results being documented on Agfa Scientia Film Type 23D56. Inhibition controls were carried out in an analogous fashion to that described above for light microscopy.
Intravital Lectin Histochemistry
Fluorochrome-conjugated lectins were applied at 0.5 mg in 0.25 ml buffered saline, corresponding to 20 mg/kg body weight, by injection into the tail vein of the narcotized mouse, injection requiring 10–15 sec. In double-labeling experiments, each lectin was dissolved 0.5 mg in 0.25 ml, the two solutions mixed (total volume 0.5 ml), and the mixture injected into the tail vein. Some mice received injections of a mixture of 0.5 mg HPA-TRITC and 10 U of sialidase in a total volume of 0.5 ml saline. Circulation of the lectin-containing solution was terminated after a period of 60 sec–15 min by removal of the organs for study. Tissues were dissected rapidly from the the mouse and snap-frozen in isopentane cooled in liquid nitrogen. When prolonged storage was required, they were held in darkness at −70C or in liquid nitrogen. Frozen sections were cut at 10–30 μm and stored dry (unfixed) at −70C, or after fixation either in 4% formaldehyde in buffer or in acid alcohol. For viewing, sections were cover-slipped with Moviol 4–88 (Hoechst; Frankfurt, Germany).
Spectrofluorometric Quantitation of Lectins in Blood
Samples of blood were obtained by cardiac puncture (first series) or by exsanguination (second series) 75 sec-16 min after intravital application of 20 mg/kg body weight of fluorescein-labeled HPA. The relative intensity of fluorescein fluorescence (485 nm excitation, 512–520 nm emission) in sample volumes of 0.5 ml blood serum diluted fivefold in isotonic saline was measured by absorptive spectrofluorometry with an LS50B Luminescence Spectrometer (Perkin Elmer; Neuried, Germany) and the results calibrated against lectin-fluorescein conjugates diluted in isotonic saline to known concentrations in the range of 40–250 μg/ml.
MR Methods
Before MRI, the animals were anesthetized by inhalation with isoflurane (Forene; Abbott, Wiesbaden, Germany) and a 24-G catheter (Introcan; B. Braun, Melsungen, Germany) was inserted into the tail vein. During the MR measurements, inhalation with isoflurane was continued and the temperature in the animal holder was kept constant at about 28C. MRI was performed on a 400-MHz MR system (DMX 400; Bruker, Karlsruhe, Germany). For calculation of the T1 maps, a Snapshot FLASH pulse sequence was implemented on the MR system. After one inversion pulse, 20 different T1-weighted Snapshot FLASH images were acquired within 2.5 sec. A field of view of 25–30 mm provided an in-plane resolution of about 0.25 × 0.25 mm2; the slice thickness was 0.75 mm. From the Snapshot FLASH images, T1 relaxation time maps were calculated pixel by pixel using a method described by Nekolla et al. (1992). Immediately after acquisition of four transaxial precontrast T1 maps, which were positioned to intersect both heart and tumor, polylysine-(Gd-DTPA) (Schering; Berlin, Germany) was infused at a constant rate over 60 min via the tail vein with a dose of 0.375 mmol Gd-DTPA/kg body weight. Polylysine-(Gd-DTPA) is a macro-molecular contrast medium (CM) with a molecular weight of about 70 kD, which is approved for experimental use only. After IV injection, it distributes in the intravascular space and, later, extravasates steadily into the interstitial space of the tumor tissue. During the 60-min infusion of CM, 47 further T1 parameter maps were acquired at regular intervals. Isoflurane narcosis of the mouse was maintained after acquisition of MR data was complete; within 15 min, lectin solutions were injected into the tail vein as described above through the 24-G catheter previously used for injection of CM. Lectin circulation times, removal of organs, and preparation of sections for fluorescence microscopy were as described above.
Light Microscopic Mapping of Intravital Fluorescent Markers
Fluorescent labeling was detected with an Axiovert 100 microscope (Carl Zeiss; Jena, Germany) with X 10/0.30 and X 40/ 0.75 objectives, providing optical resolution close to 1.5 μm and 0.7 μm, respectively. FITC epifluorescence excited at 480 ± 20 nm from a mercury arc source was detected at 535 ± 25 nm (Chroma filters; Brattleboro, VT) with a Photometrics CH250A camera operating at −24C. TRITC epifluorescence excited at 535 ± 25 nm from a mercury source was detected at 610 ± 40 nm (Chroma filters). Alternatively, red and green channels for laser scan double epifluorescence were obtained by use of a helium-neon laser (HeNe 543 nm) filtered through BP488 or LP543 filters, respectively, with detection through BP515/565 or LP590 barrier filters, respectively. Images in each channel were digitized with Carl Zeiss LSM software (Version 3.85 Beta), fields of view 686 μm wide being scanned into 512 pixels, yielding a pixel size of 1.34 μm, and were stored as 8-bit TIFF files. Images of double-stained preparations were recorded in separate channels dedicated to red and green images and were viewed as monochromatic images or superimposed with a precision of 1 pixel to generate overlay images that coded double staining as yellow. Automated exposure at the CCD camera used in conjunction with lateral and vertical scanning displacements of the specimen by use of a Zeiss motor-driven stage steered by software modules custom-written in the current Zeiss language enabled automatic sequential recording of adjacent fields, generating mosaics that mapped specimen areas measured in cm2. After exposure of each microscopic field of view (X 10 objective), the stage was moved a precalculated distance for exposure of the next field, the stage displacement and CCD camera field of view being adjusted relative to one another to record adjacent fields of view with an overlap error not exceeding 2 pixels (2.7 μm). Each image was stored in computer memory, requiring approximately 0.25 MB in noncompressed form, for later analysis by morphometric techniques. The depth of detail available in such a reconstruction could not be presented on a monitor screen but was available for analysis and could be rendered visible by zooming into the required region of the field of view. After data reduction to generate mosaics imaging the entire tumour, e.g., from 18 × 18 contiguous microscopic fields, the smallest caliber microvessels (sinusoids of capillary caliber) were visualized as single pixels or clusters of two or three pixels.
Collation of MR Maps and Light Micrograph Mosaics
MR maps for collation were selected from the 51 T1 parameter maps acquired before and during IV injection of CM. Comparison of the 51 maps in the sequence revealed the CM flow patterns within the tumor and identified the earliest detectable sites of enhanced CM concentration in the tumour (in images 14–18), representing sites at which CM entered the tumor. One of these early maps (14) was selected for collation with light microscopic mosaics.
To collate mosaic reconstructions of micrographic images with MR T1 parameter maps, it was necessary to stack and align several micrographic mosaics with one another and with the MR map, because the MR map visualized a slice 750 μm deep whereas the cryostat sections used to prepare the micrographic mosaics were only 10–15 μm thick. To aid alignment, a plastic cannula was positioned in the rostrocaudal axis of each tumor before MRI and was left in position during MRI acquisition. The cannula, imaged with high contrast as a cross-sectioned profile in each MR map, was removed before cryostat sectioning of the tumor, leaving a clearly identifiable hole in the tissue to serve as an alignment guide in the micrographic mosaic. Internal landmarks (such as large vascular structures) guided the final exact collation (compare Figure 7 with Figure 9). The MR maps were collated in raw data form without application of filtering techniques. Micrographic mosaics were filtered by application of threshold values to eliminate weak signals resulting from noise, then collated as single reconstructed images without further processing.
Results
AT17 tumors serially passaged
Before intravital perfusion studies were performed, the one-pass circulation time of the mouse bloodstream was determined by
Targeting of lectins introduced into the bloodstream was examined by intravital perfusion with a lectin mixture consisting of equal parts of an FITC-labeled lectin and a TRITC-labeled lectin. This rapidly double labeled the microvessels in organs throughout the body, including microvessels in the tumor. The narrow-caliber microvessels in the tumor showed almost complete identity of staining for pairs of lectins (Figure 4A), whereas in wider-caliber microvessels some separation of the two lectins could be observed even within 60 sec after
The perfusion dynamics of lectins introduced into the bloodstream were investigated in correlative studies with MR. Tumors exhibiting rapid uptake of CM required only brief intravital exposure to lectins (60 sec) to label their microvessels. Tumors with slow uptake of CM required longer intravital exposure to lectins (15 min) to label their microvessels. Intratumor regional heterogeneity in CM uptake was a prominent feature in most AT17 tumors, indicating that the tumors contain regions with efficient perfusion close to others with inefficient perfusion. To enable dynamic analysis of tumor microvasculature with regionally heterogenous rates of perfusion, intravital lectin perfusions were carried out to determine lectin clearance rate from the blood and from the microvessel wall and to check lectin receptor turnover rate at the endothelial surface. The concentrations of TRITC- or FITC-labeled HPA in the blood reached values close to the theoretical maximum of 250 μg/ml (0.5 mg HPA-FITC distributed into approximately 2 ml blood in each mouse) during the first 2 postbolus min and fell to approximately half this concentration after 5 min and to approximately 30% after 15 min (Figure 5). A single measurement of FITC levels in the urine at 10 min postbolus revealed a high concentration (<900 μg/ml, volume not measured). Further trials showed that the lectin-fluorochrome concentration in the blood after 15 min (40–80 μg/ml after a bolus of 20 mg/kg) generated only faint labeling of the microvessel walls. In contrast to the efficient renal clearance from the blood, clearance of lectins from the microvessel wall in AT17 tumors was slow. Most microvessels remained strongly fluorescent 4 hr after injection of a bolus of fluorochrome-conjugated HPA. This long-lasting microvessel labeling resulting from injection of a single bolus of labeled lectin preserved a snapshot view of those microvessels accessible to blood-borne tracers around the moment of injection. To check whether this persistent labeling might be due to a low receptor turnover rate at the endothelial surface, a bolus of unlabeled HPA was injected, followed 5 min later by a bolus of TRITC-labeled HPA. In these experiments, the resulting fluorescence in microvessels in both the tumor and the liver, spleen, and kidney was not consistent with a low receptor turnover rate, providing evidence that fresh HPA binding sites were again available at the endothelial surface within 5 min.
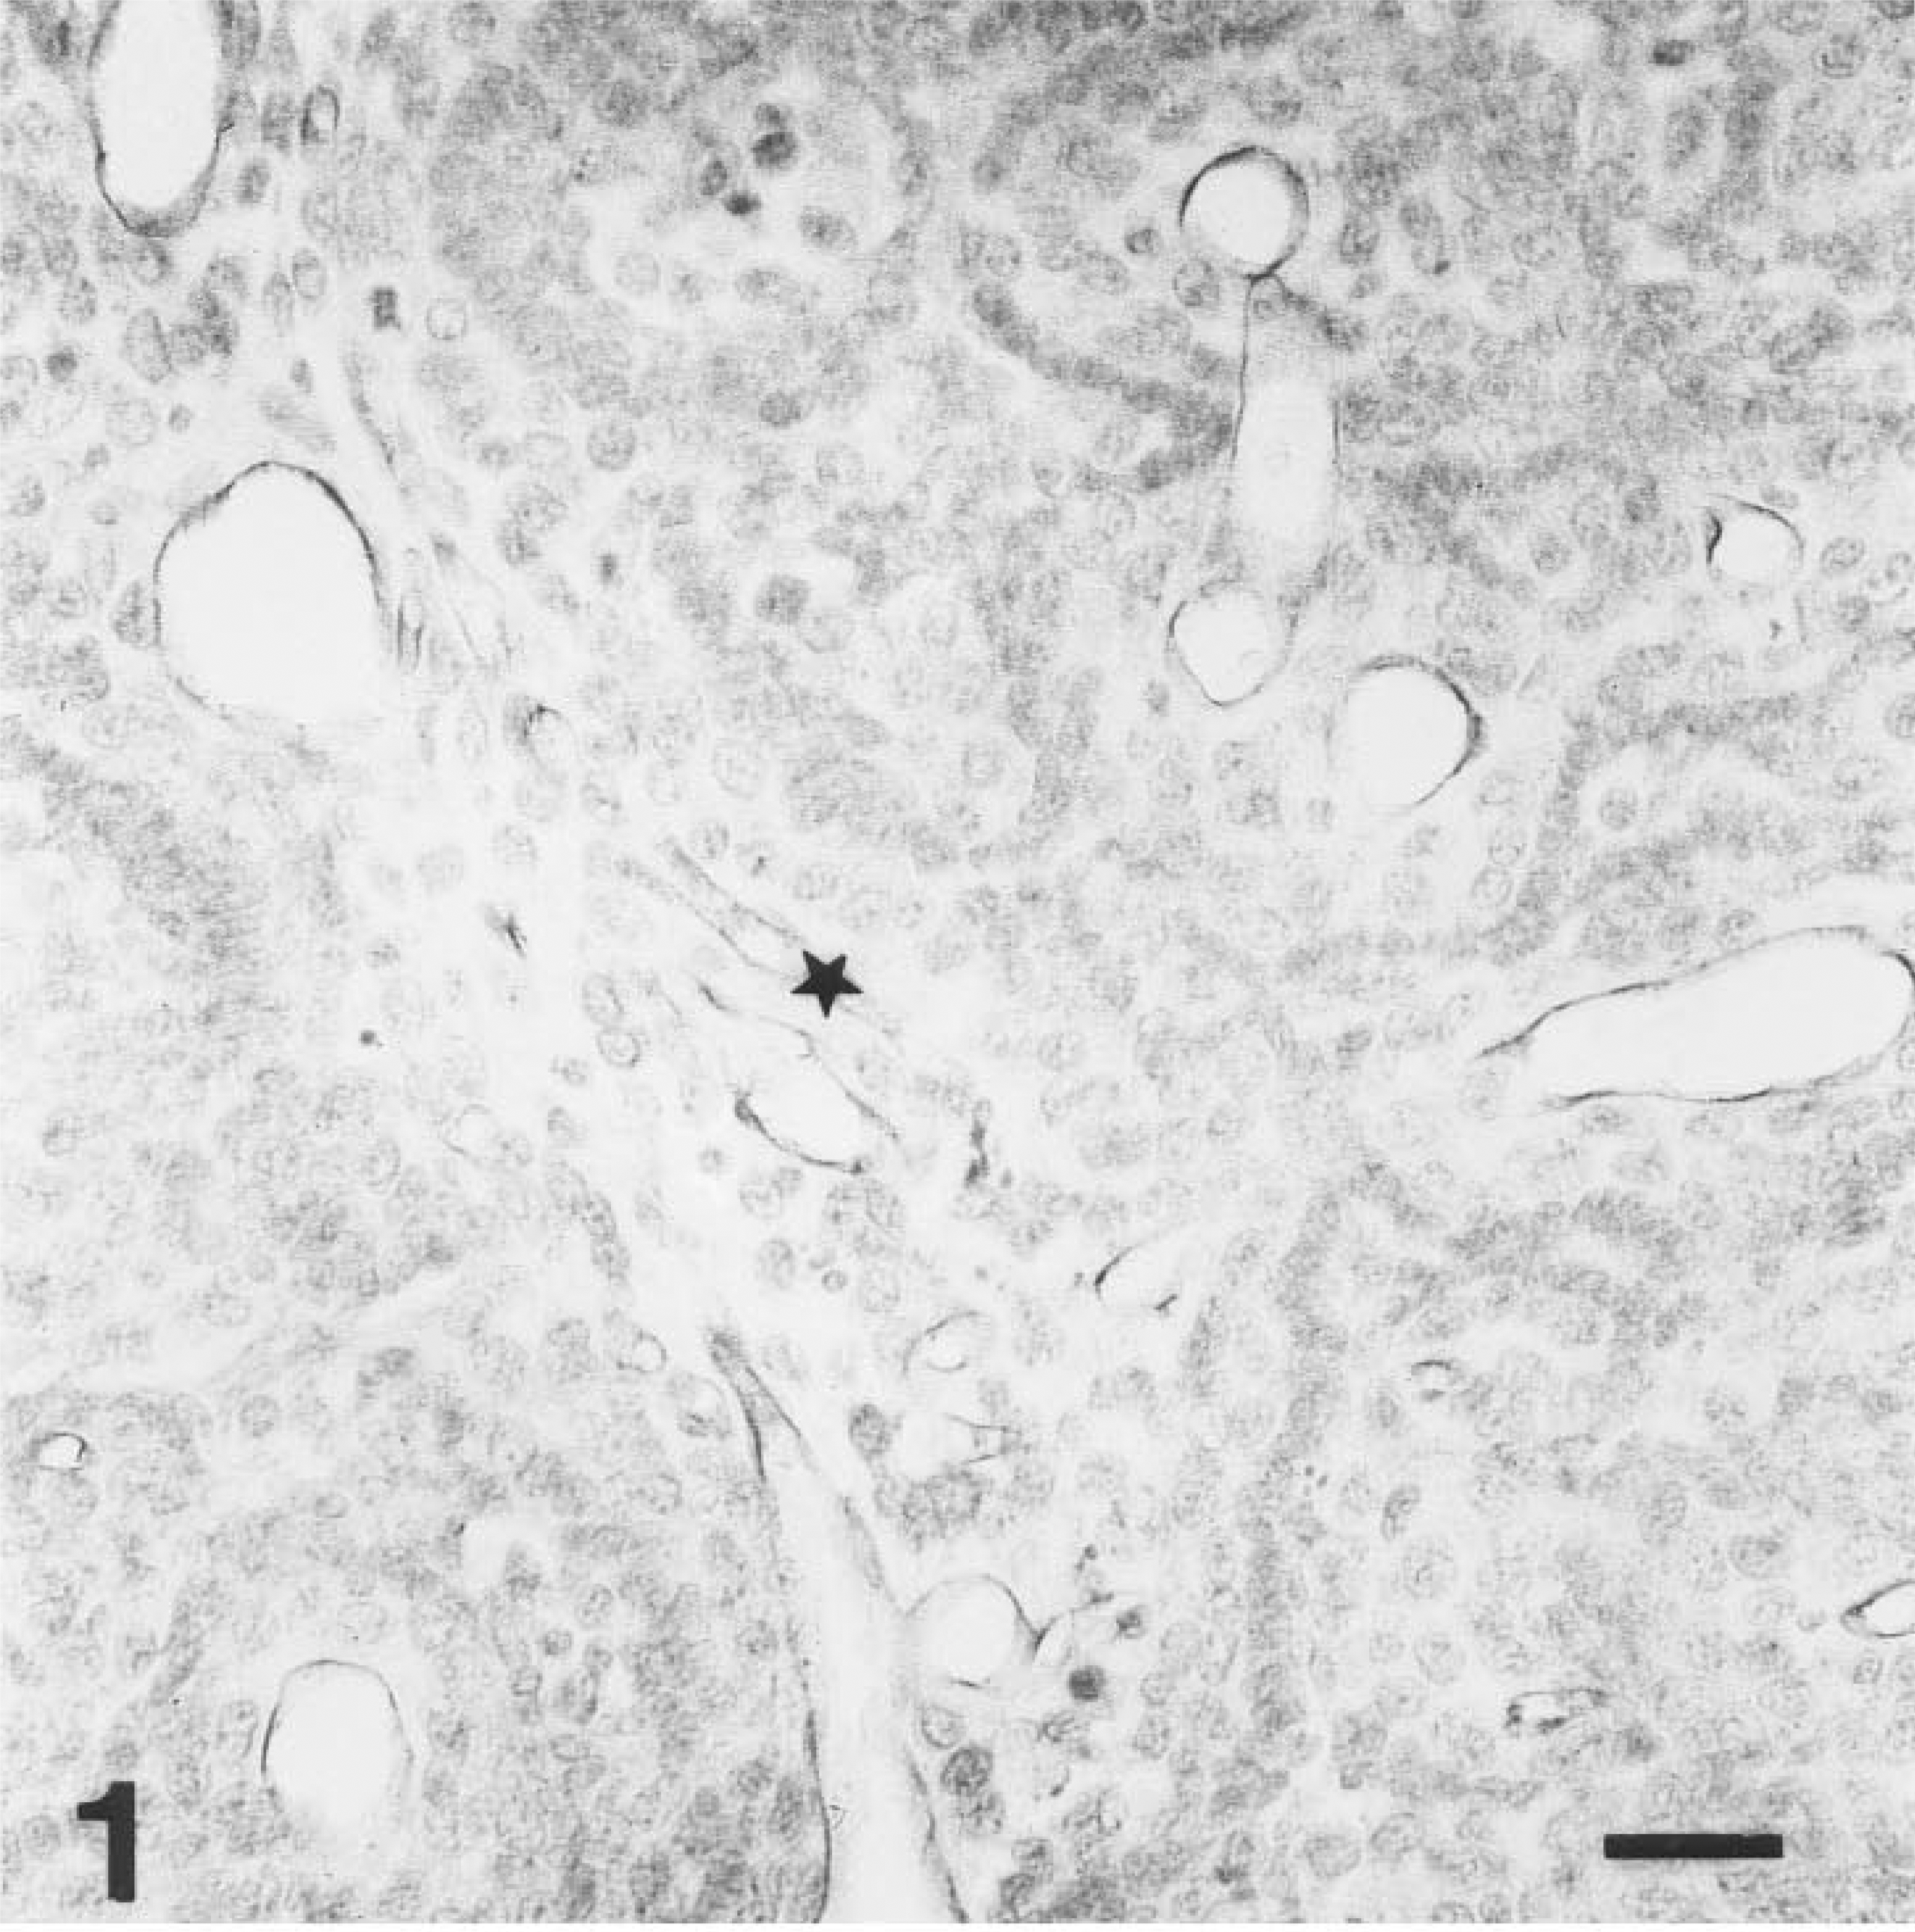
HPA binding to microvesssels in a paraffin-embedded AT17 tumor. Immunoperoxidase reaction product lines the luminal surface of each microvessel as a dark rim. The microvessel denoted ∗ is of comparable size to the one shown in Figure 2, and microvessels of this caliber are denoted by arrowheads in Figure 9. Tumor cell nuclei are lightly counterstained. Bar = 50 μm
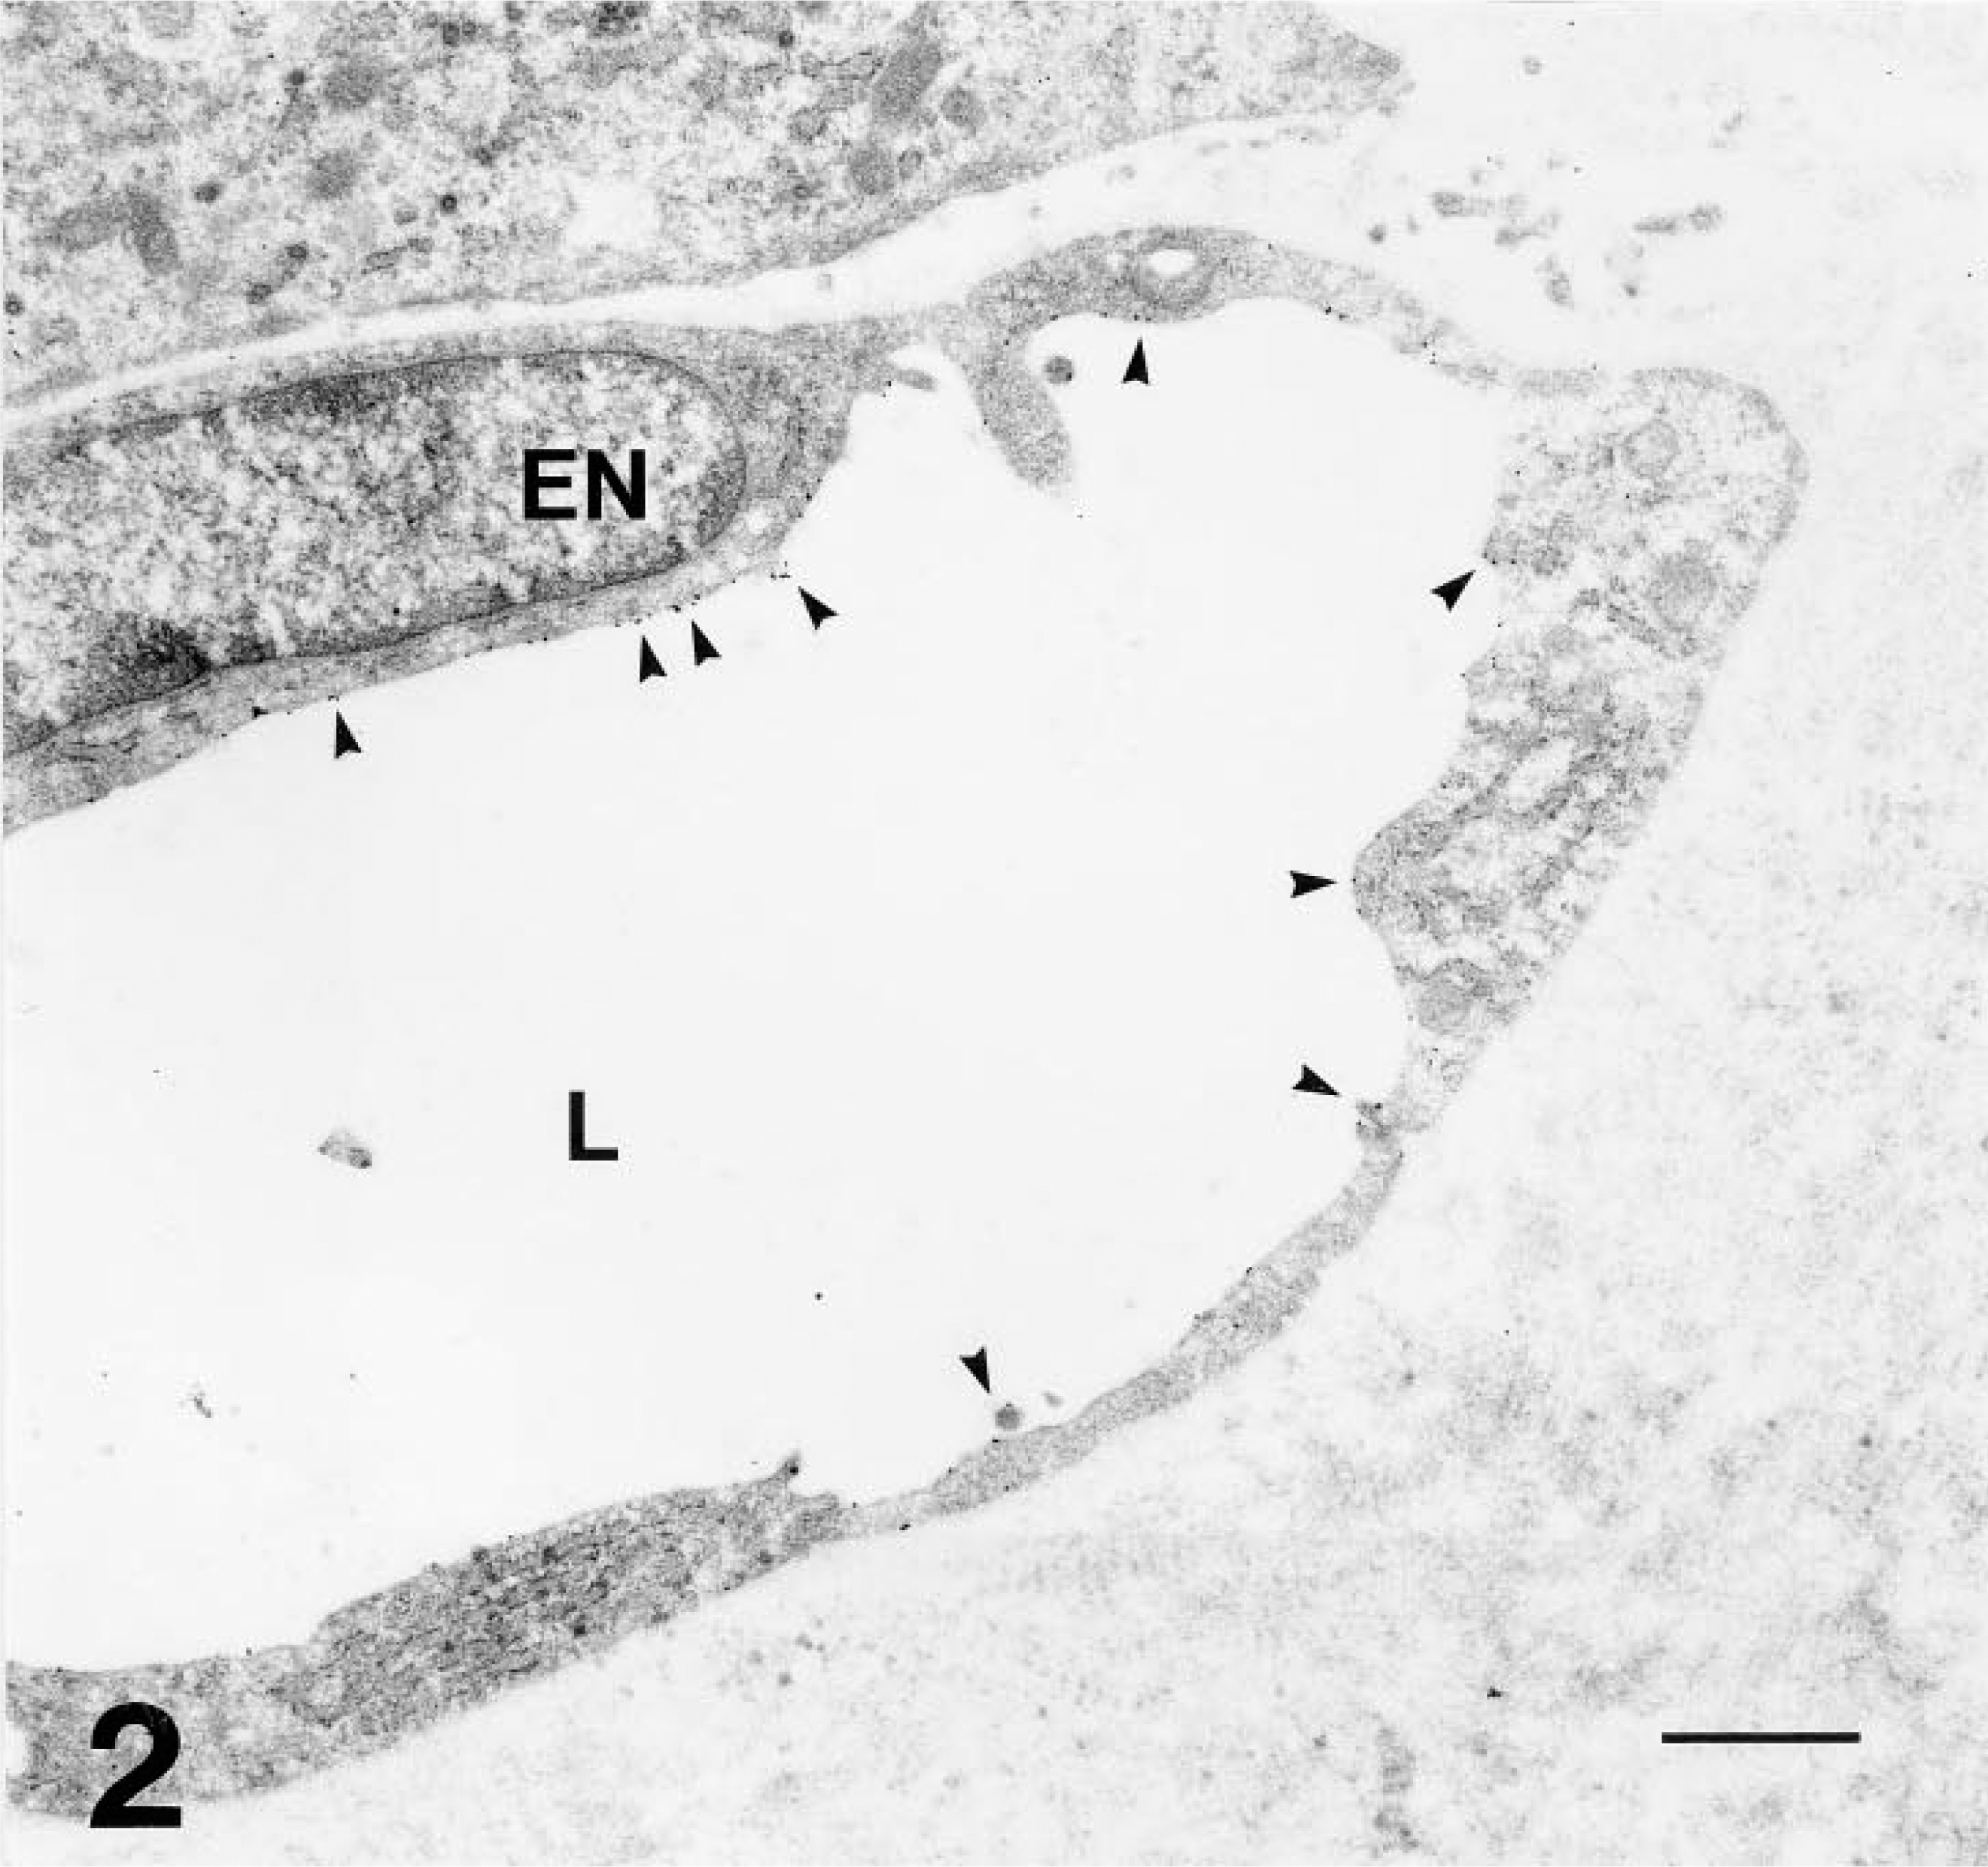
Electron micrograph of the AT17 tumor, showing a microvessel (L, lumen; EN, endothelial cell nucleus) embedded in the fibrous interstitium. This microvessel is of comparable diameter to the one marked ∗ in Figure 1 and to those indicated by arrowheads in Figure 9. WGA-gold decorates its apical surface sparsely (arrowheads). Bar = 1 μm.
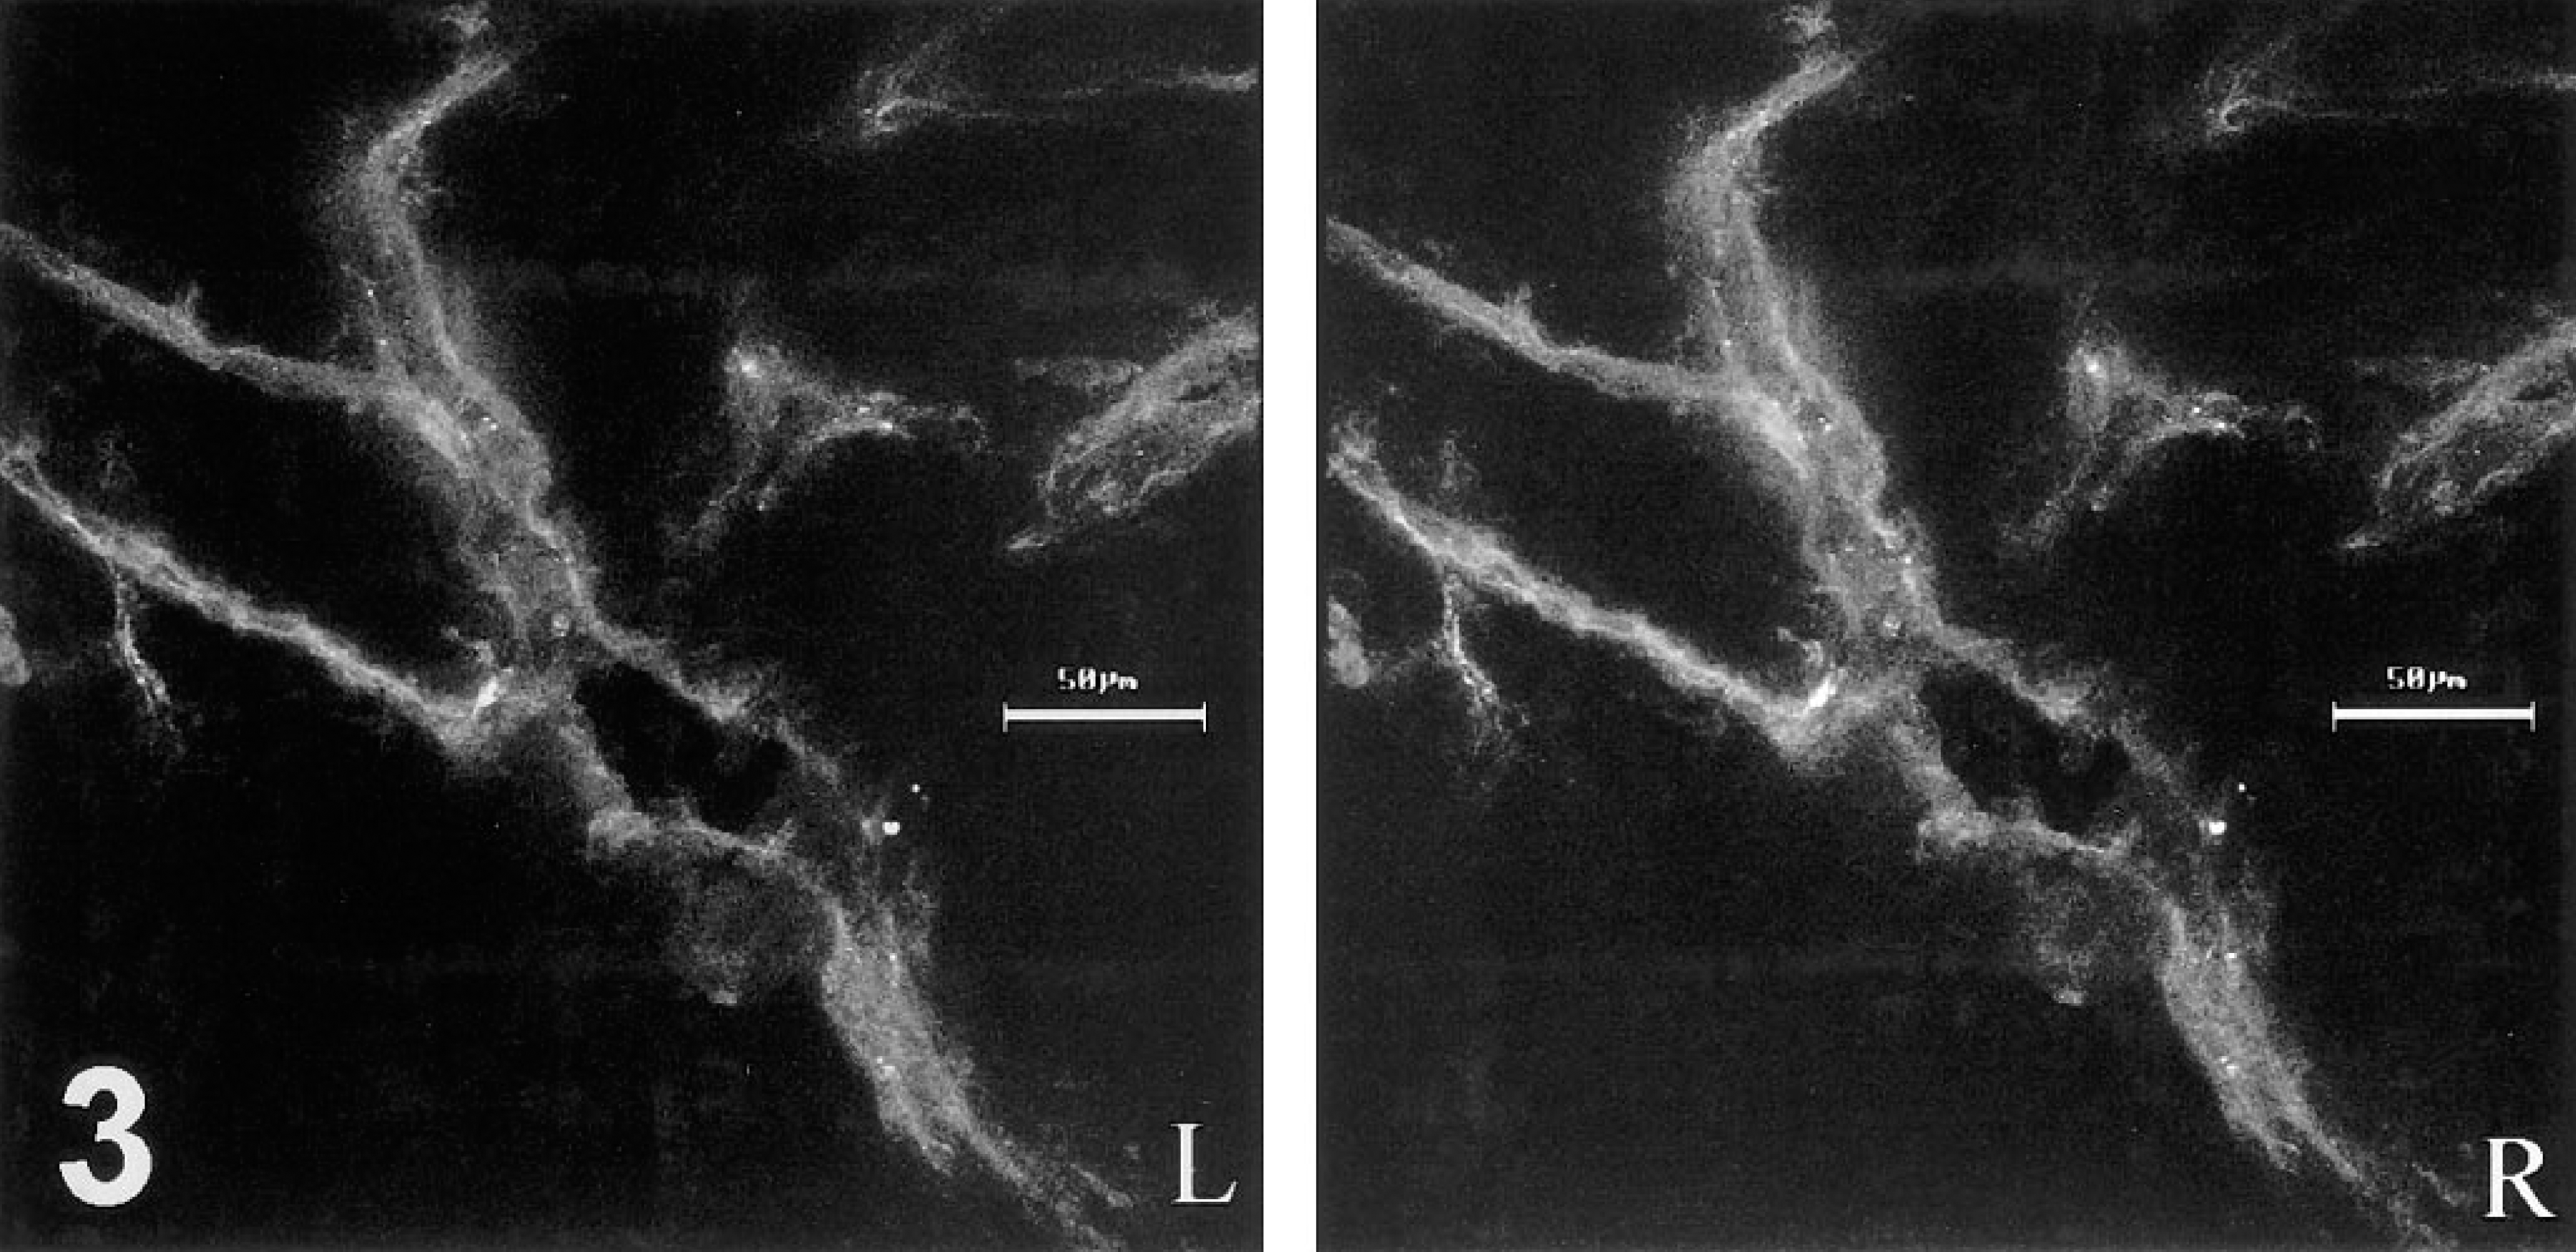
Stereo-pair reconstructed from 1-μm optical sections imaged at the confocal laser scanning microscope, showing intravital binding of HPA-TRITC to the walls of microvessels in a 30-μm cryosection through an AT17 tumor. The tumor cells, unmarked by TRITC, are not visible.
Knowledge of these parameters made it possible to design intravital perfusion protocols capable of distinguishing efficiently from inefficiently perfused microvessels in the tumors. A typical protocol stipulated sequential perfusions, with IV injection of a bolus of HPA-TRITC followed by 15-min circulation and clearance time (in which the lectin was cleared from the blood but not from the microvessel walls), then injection of a bolus of HPA-FITC and, 60 sec later, removal and snap-freezing of the tumor and several organs, including liver, kidney, spleen, lung, and intestine. Varying the protocol parameters established that in AT17 tumors wide-caliber microvessels and also many narrow microvessels were commonly accessible to the blood-borne HPA introduced in both boluses of the sequence (identity of staining in Figure 6), but that some regions of the tumors contained many narrow-caliber microvessels not accessible to blood-borne lectin introduced in one or other of the boluses (mismatch staining in Figure 6). This considerable regional microheterogeneity in perfusion dynamics was occasionally observed to involve one of the larger microvessels and the fine-caliber microvessels arising from it, with the consequence that an entire island of tumor cells was temporarily deprived of perfusion.
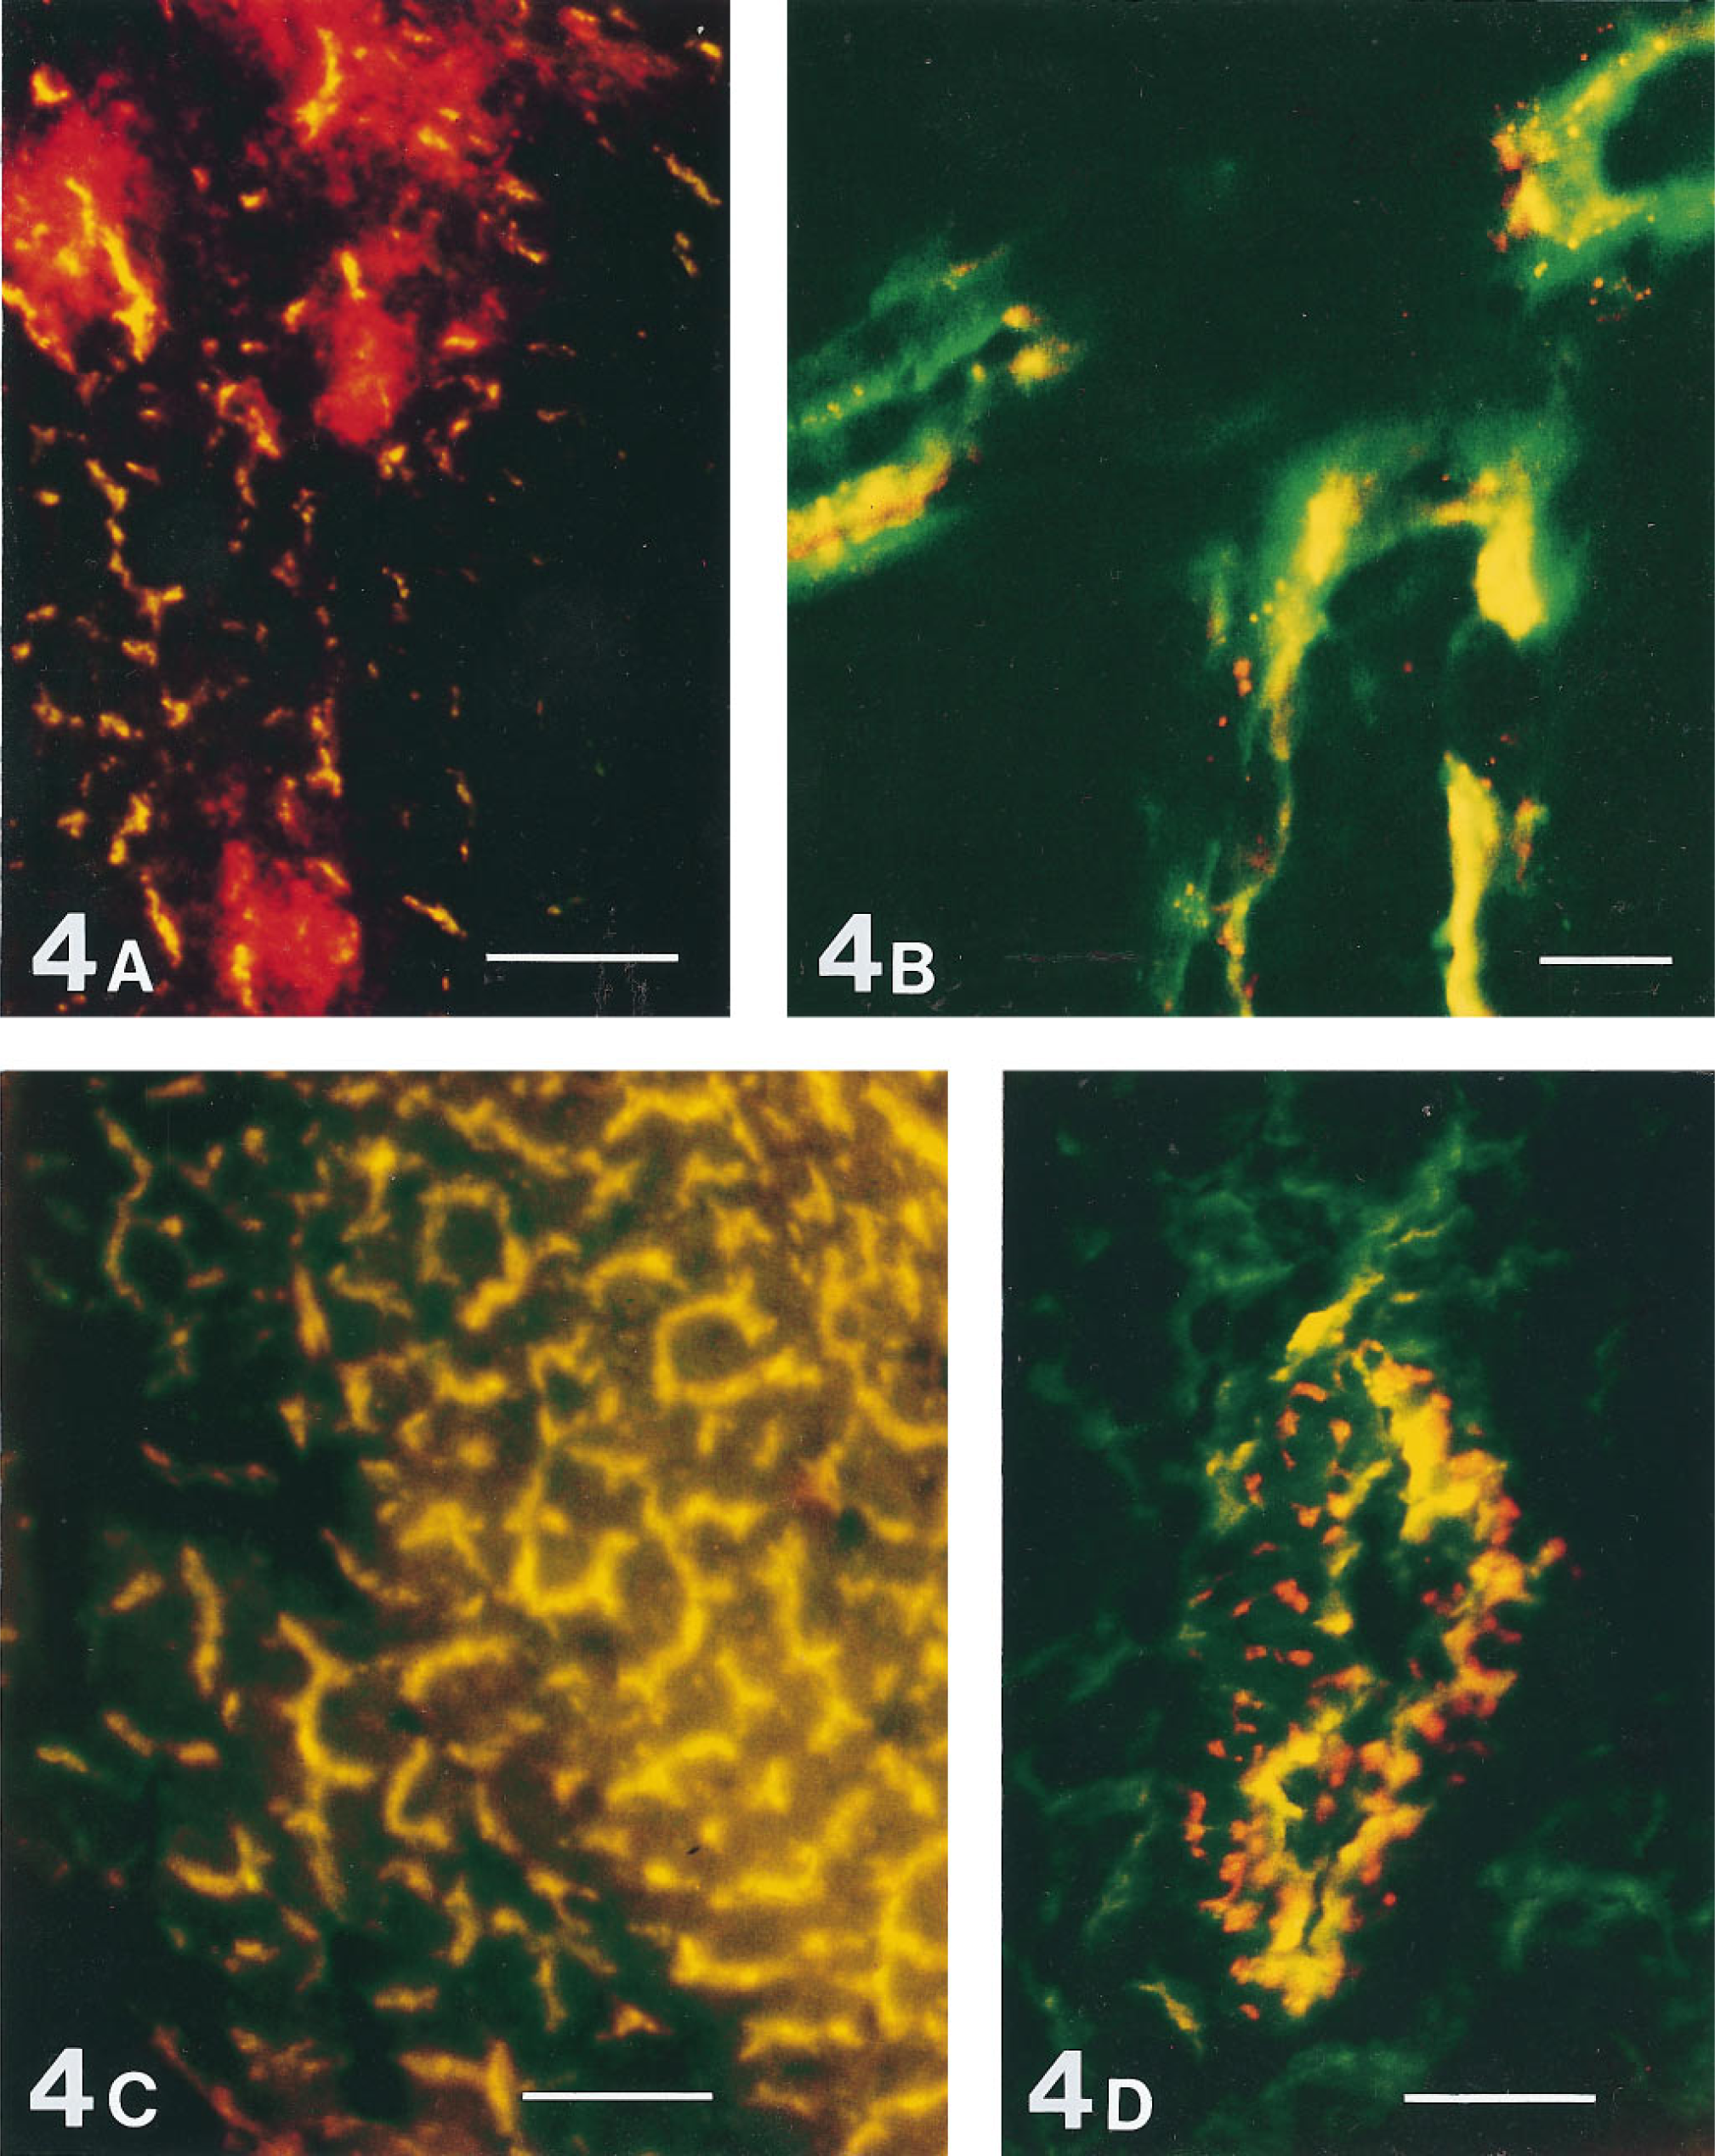
Microvessels labeled by simultaneous intravital perfusion of two lectins, each lectin conjugated to a different fluorochrome (FITC, TRITC), with circulation time of 1 min. Fluorescence from each lectin was recorded monochromatically in a separate dedicated channel, using the x 10 objective (
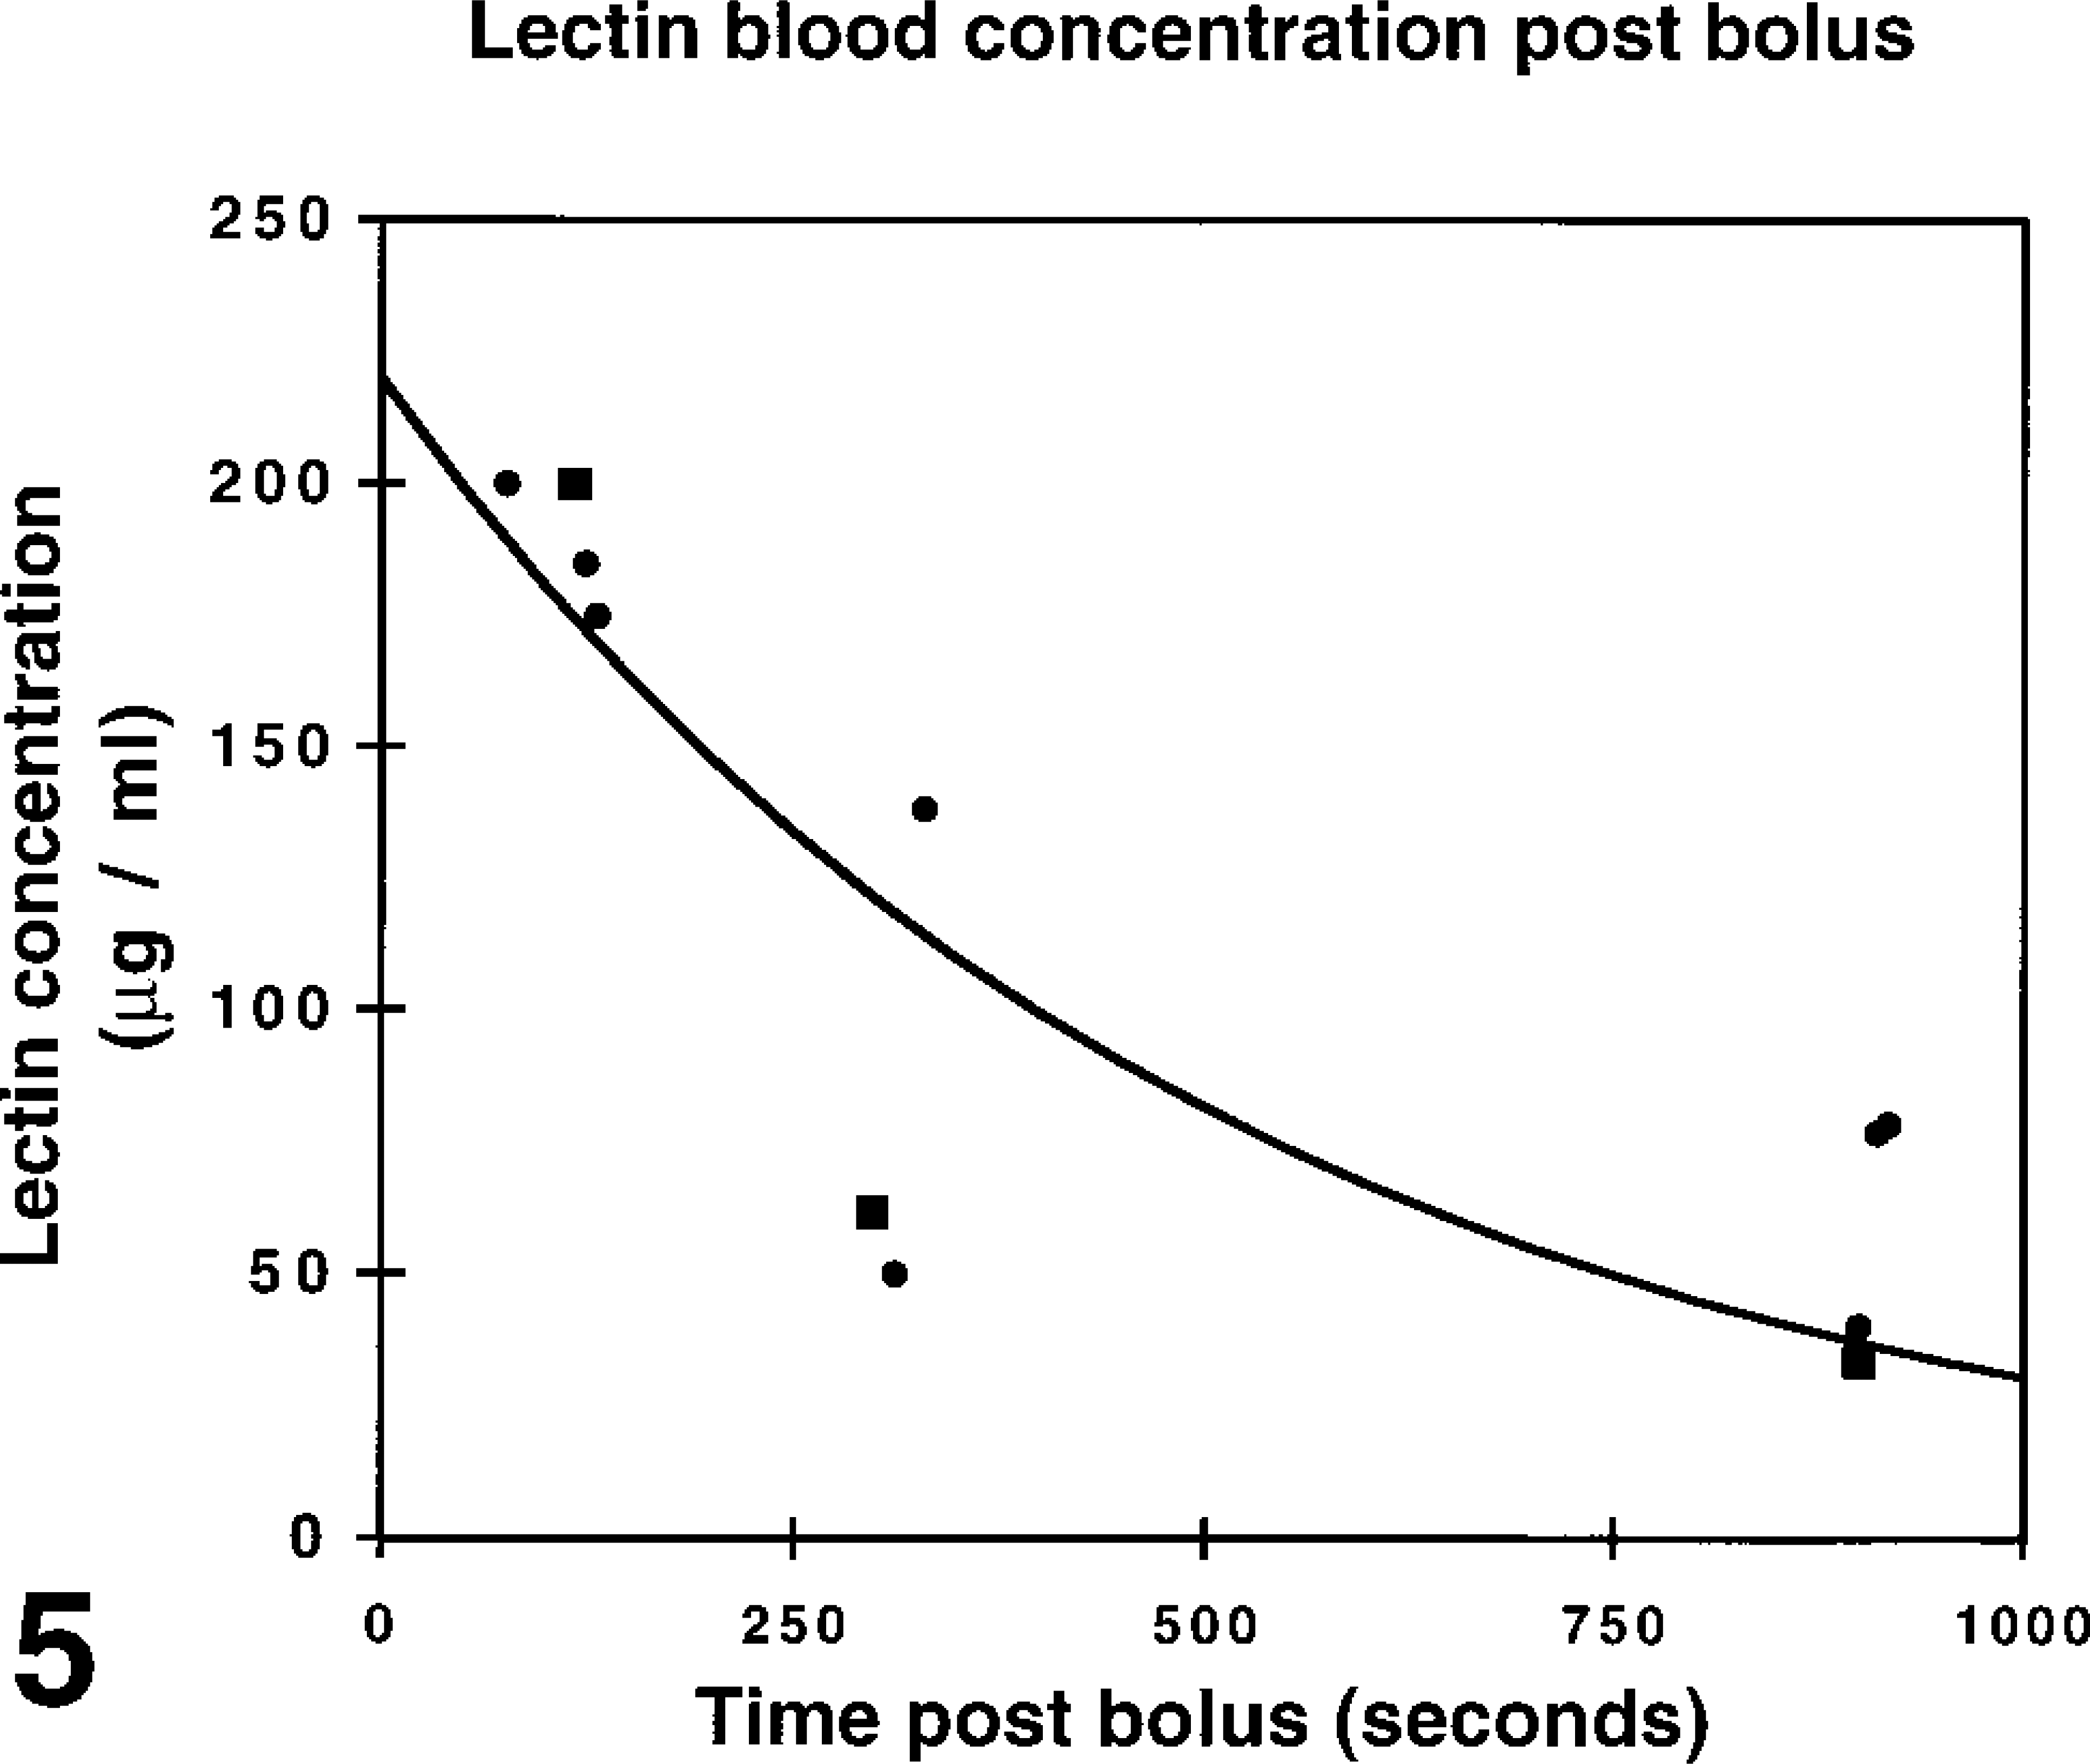
Postbolus blood concentrations of HPA-FITC measured spectrofluorometrically after IV administration of an 0.5-mg bolus (20 mg/kg bodyweight). Each measurement derives from 0.7 ml blood obtained from one mouse. The first series of measurements (squares) quantifies fluorescence in blood obtained by cardiac puncture; the second series (diamonds) quantifies fluorescence in blood obtained by rapid exsanguination. The curve was fitted to the function y = y0.exp(-mt). The half-life of lectin in the blood was calculated as 349 sec (5.82 min) from t1/2 = -In 0.5/m.
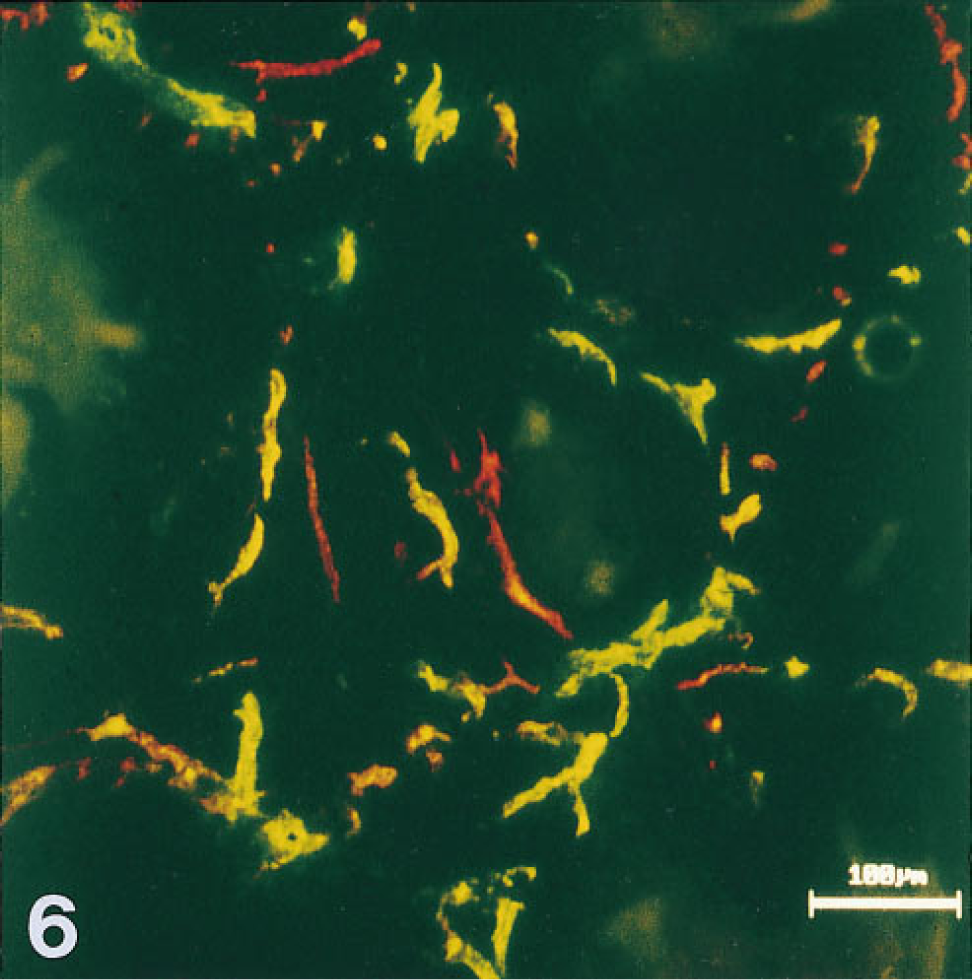
AT17 microvessels sequentially perfused first with a bolus of HPA-TRITC followed 15 min later by a second bolus of HPA-FITC, and 90 seconds later snap-frozen. As in Figure 4, mismatch staining (red, green) identifies noncongruence of lectin binding. Some microvessels show noncongruent labeling, evidence of intermittent perfusion.
Intravital lectin histochemistry visualized perfused regions of the AT17 tumor microvasculature with high intensity and high contrast, allowing images of the microvessels to be recorded through low-power objective lenses, which were nonoptimal for epifluorescence microscopy because of the low intensity of fluorescence obtained by their use, but maximizing the area of tissue recorded in a single image. Comparison of results obtained with a range of objectives showed that use of the X 10 lens resulted in images that could be recorded by the CCD camera with adequate contrast and resolution (Figures 4 and Figures 6), and which could also be recorded with high mechanical positioning accuracy to allow subsequent reconstruction representing the tissue in the form of mosaics. Figures 7–9 collate an MR map of an AT17 tumor with micrograph mosaics in the same plane, using a common numbering system to denote the same site in each Figure. In Figure 7, which shows number 14 of a sequence of 51 T1 parameter maps, the sites of initial CM uptake into a 750-μm-thick slice of the tumor appear dark gray against the paler regions free of CM. Inspection of the sequence revealed the presence of flow patterns in the tumor slice (Figure 8). For two of these regional flows, a major source of the flow can be identified (numbered 1 and 8 in the figures), visible as sites of initial CM uptake in Figure 7 and explicable in terms of large-caliber blood vessels visible in Figure 9. Therefore, the site of CM enhancement 0.6 mm wide and labeled 1 in Figure 7 collates with a blood vessel 0.5 mm wide and labeled 1 in each of the images shown in Figures 9B and 9C. This vessel was the earliest to show CM enhancement in the MR map sequence, with signal intensities reaching levels comparable to those seen in the blood in the heart ventricles (compare Figure 7). As shown in Figure 8, CM flowed from this source at 1, along the tumor periphery to the sites denoted 2 and 3, then centripetally to the site denoted 4, where the flow split into two branches, with apparent termination at the sites denoted 5a and 5b. These sites 1–5 are clearly evident in Figure 7, (although in later maps in the sequence the sites denoted 4 and 5 appear much more pronounced), and they correspond one to one with the vascular structures ranging between 0.05 mm and 0.5 mm in diameter and denoted 1–5 in the mosaics shown in Figures 9A–9C. The blood vessel shown at site 1 can be considered one of the major vessels supplying the entire tumor, because anatomic dissections of a number of AT17 tumors showed only two vessels of this caliber entering most AT17 tumors. Its flow supplying this slice of the tumor collates entirely with vascular structures in the micrograph mosaics, even though these mosaics comprise only three of the approximately 75 that would be required to fully reconstruct the complete depth of the MR map shown in Figure 7. Their spacing (120 μm) is close enough to reconstruct this particular flow, although together they sample only about one third of the depth of the MR map. A second major, complex regional flow originated at site 8, with peripheral flows towards sites 7/6 and 9, together with centripetal flows with apparent terminations at sites 10a and 10b (Figure 8). This flow system, clearly visible in the MR map (Figure 7), could be collated with large-caliber blood vessels denoted 7,8,9 in Figures 9A−9C, and with smaller-caliber vessels denoted 6 and 10 a and b in Figures 9A-C. Other flows seen in the MR map sequence and denoted by non-numbered arrows in Figure 8 lay partially or totally outside the volume reconstructed by the three mosaics shown in Figure 9.
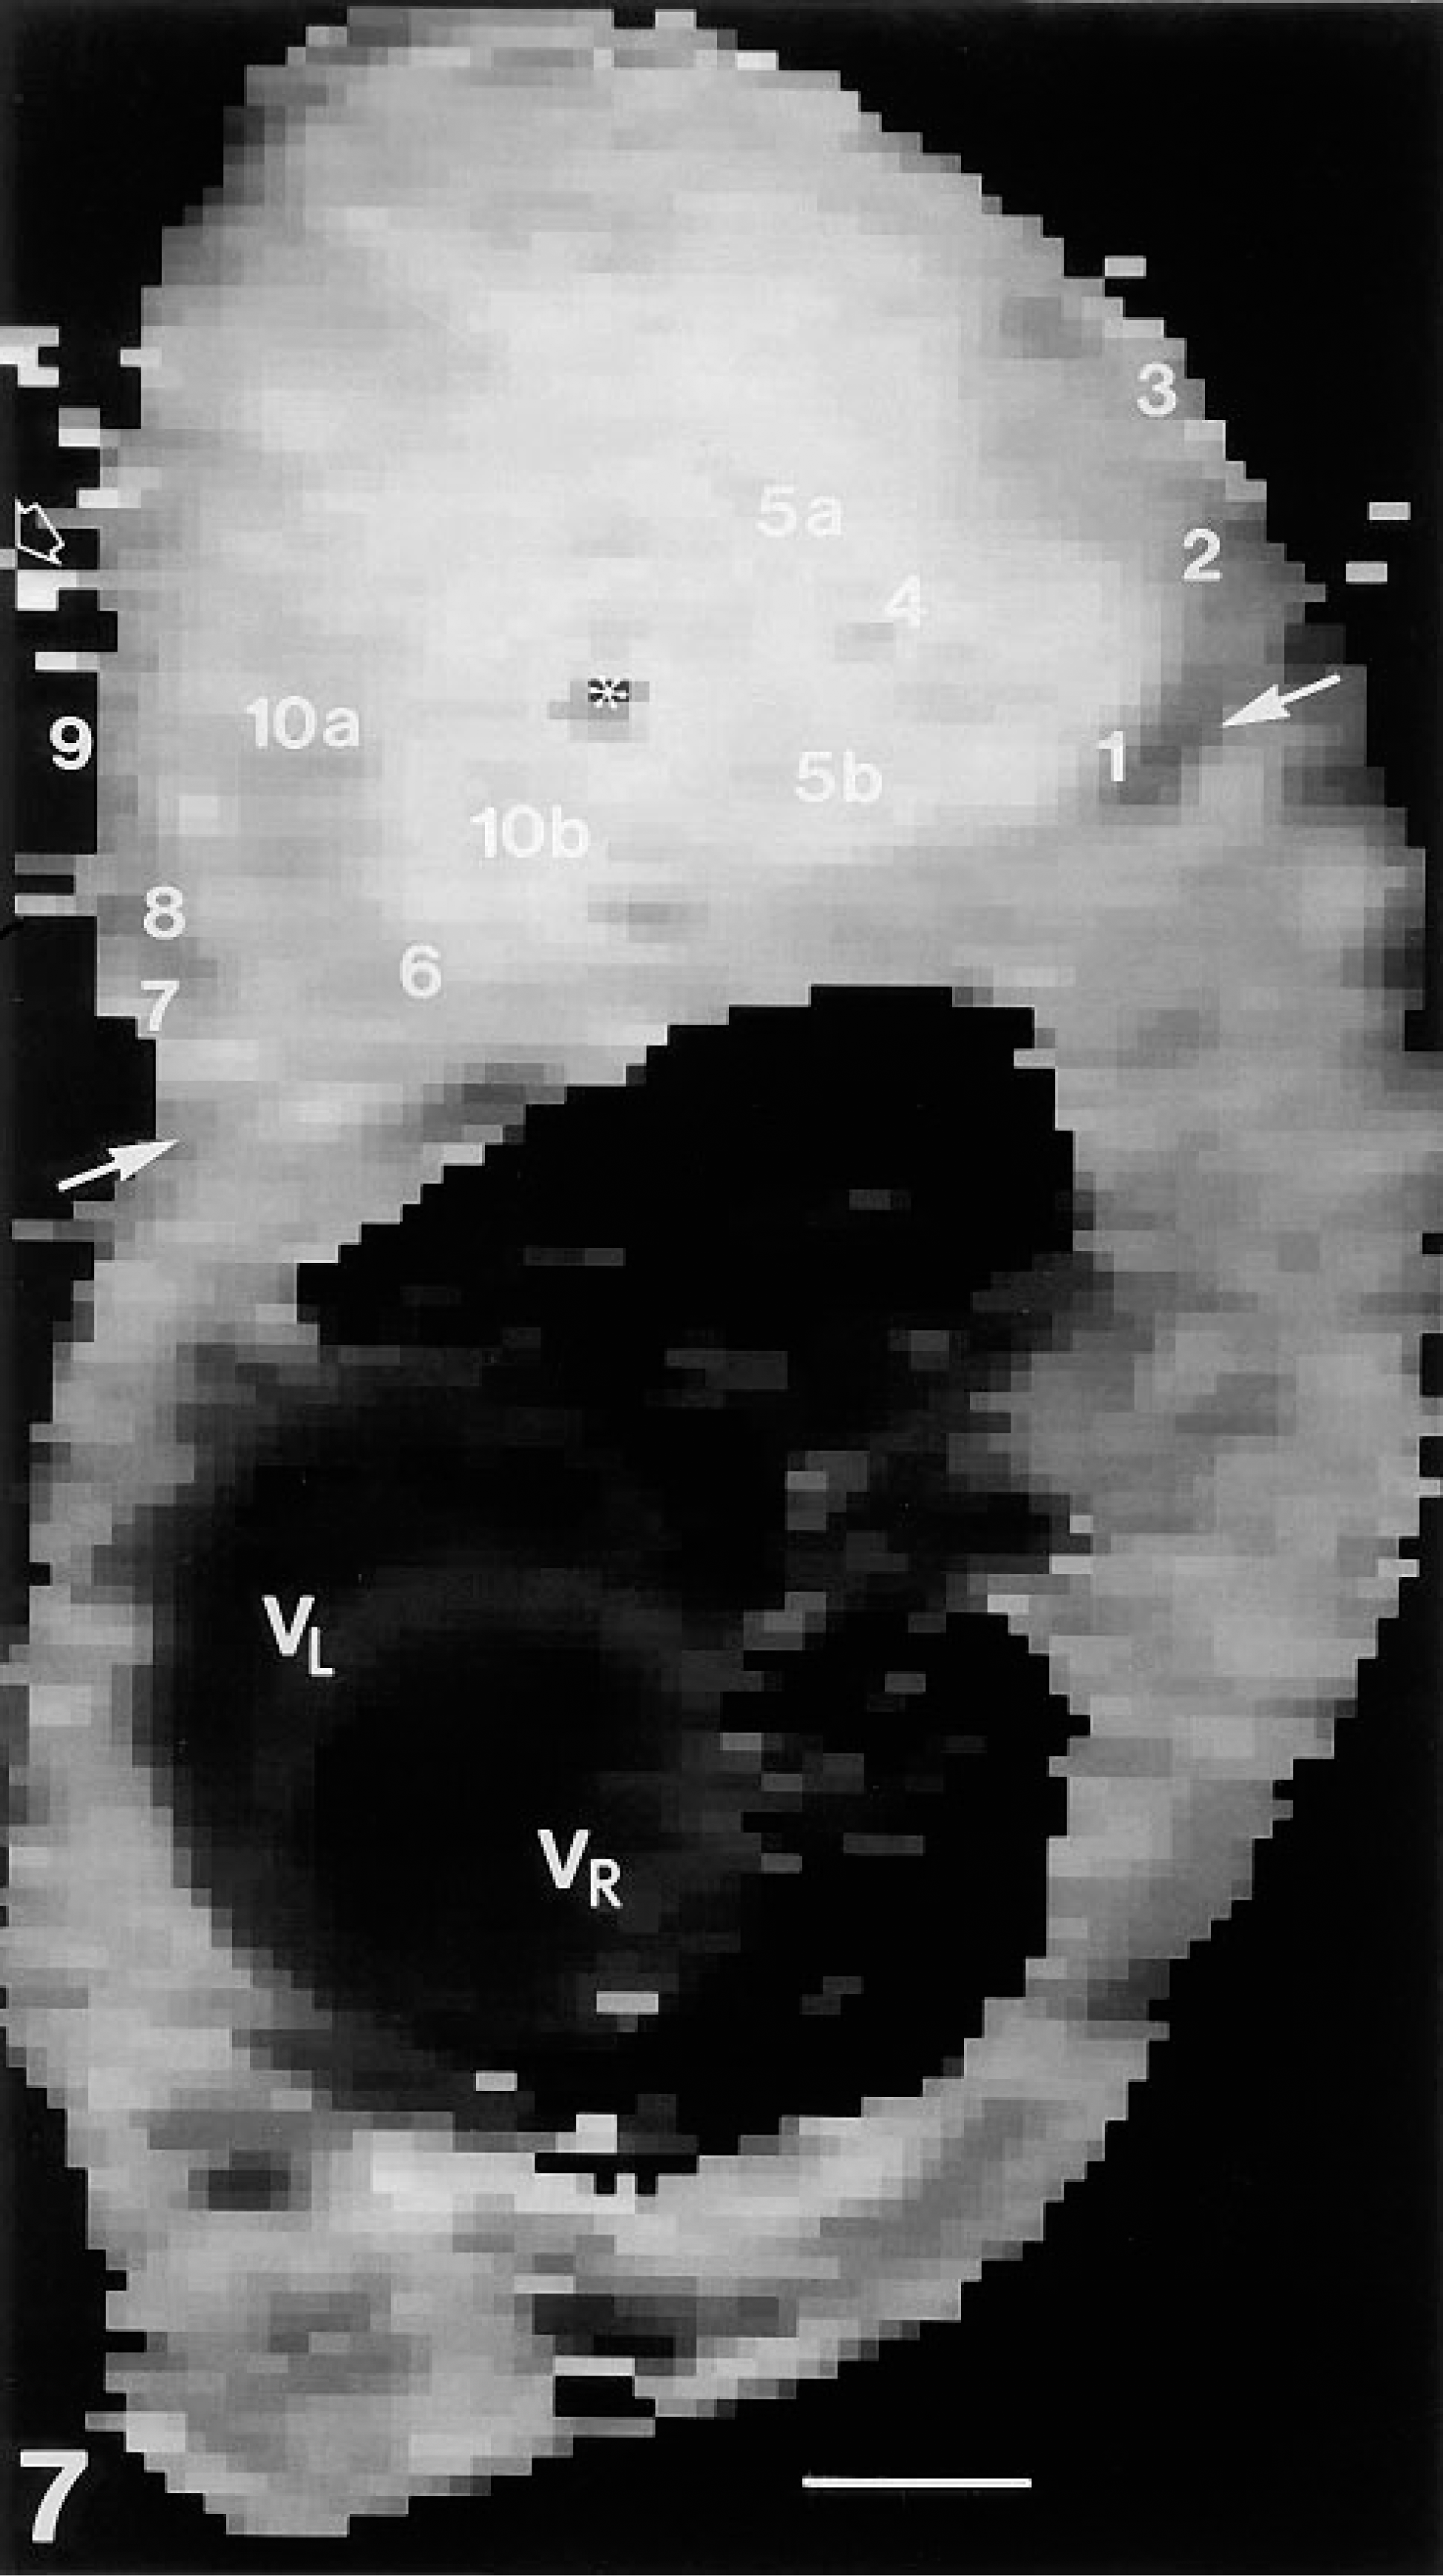
MR T1 parameter map 14 selected from a series of 51 T1 parameter maps acquired over a period of 60 min before and during injection of CM. Map 14 shows the initial entry of CM into an AT17 tumor. The intensity of the signal, proportional to CM concentration, is coded on a grayscale: darker voxels contain higher concentrations. (To aid in identification, a single gray voxel is indicated by a small unfilled block arrow at three-quarters height at the left side of the image). The tumor, located on the flank of the mouse at the level of the heart (VR, right ventricle; VL, left ventricle) is seen in this map above the oblique transverse line marked by heavy arrows, and approximately at its widest diameter. An asterisk marks the site of a plastic cannula inserted into the tumor before injection of CM. The sites of enhanced CM concentration, denoted by numbers 1–10, can be collated with the regional flow patterns in this tumor as shown in Figure 8 and with vascular structures as shown in Figures 9A-9C. Bar = 0.3 cm.
Discussion
Lectins are suitable tools for intravital labeling of the vascular system, because dense concentrations of O-linked and N-linked glycans are available for binding at the apical surface of endothelial cells in most organs of all mammals (Simionescu et al. 1982; Nag 1985; Debbage 1996; Vorbrodt et al. 1986; Alroy et al. 1987). In the vascular system of tumors, some segments of the vascular tree fail to bind certain lectins (Debbage et al. 1994) but other lectins bind reliably. This study used electron microscopy to establish that HPA and other lectins bind strongly to the luminal surfaces of the endothelial cells that form the microvessel wall of the AT17 tumor, both in fixed and in intravital labeling systems. Fluorescence microscopy showed that within 1–5 min of
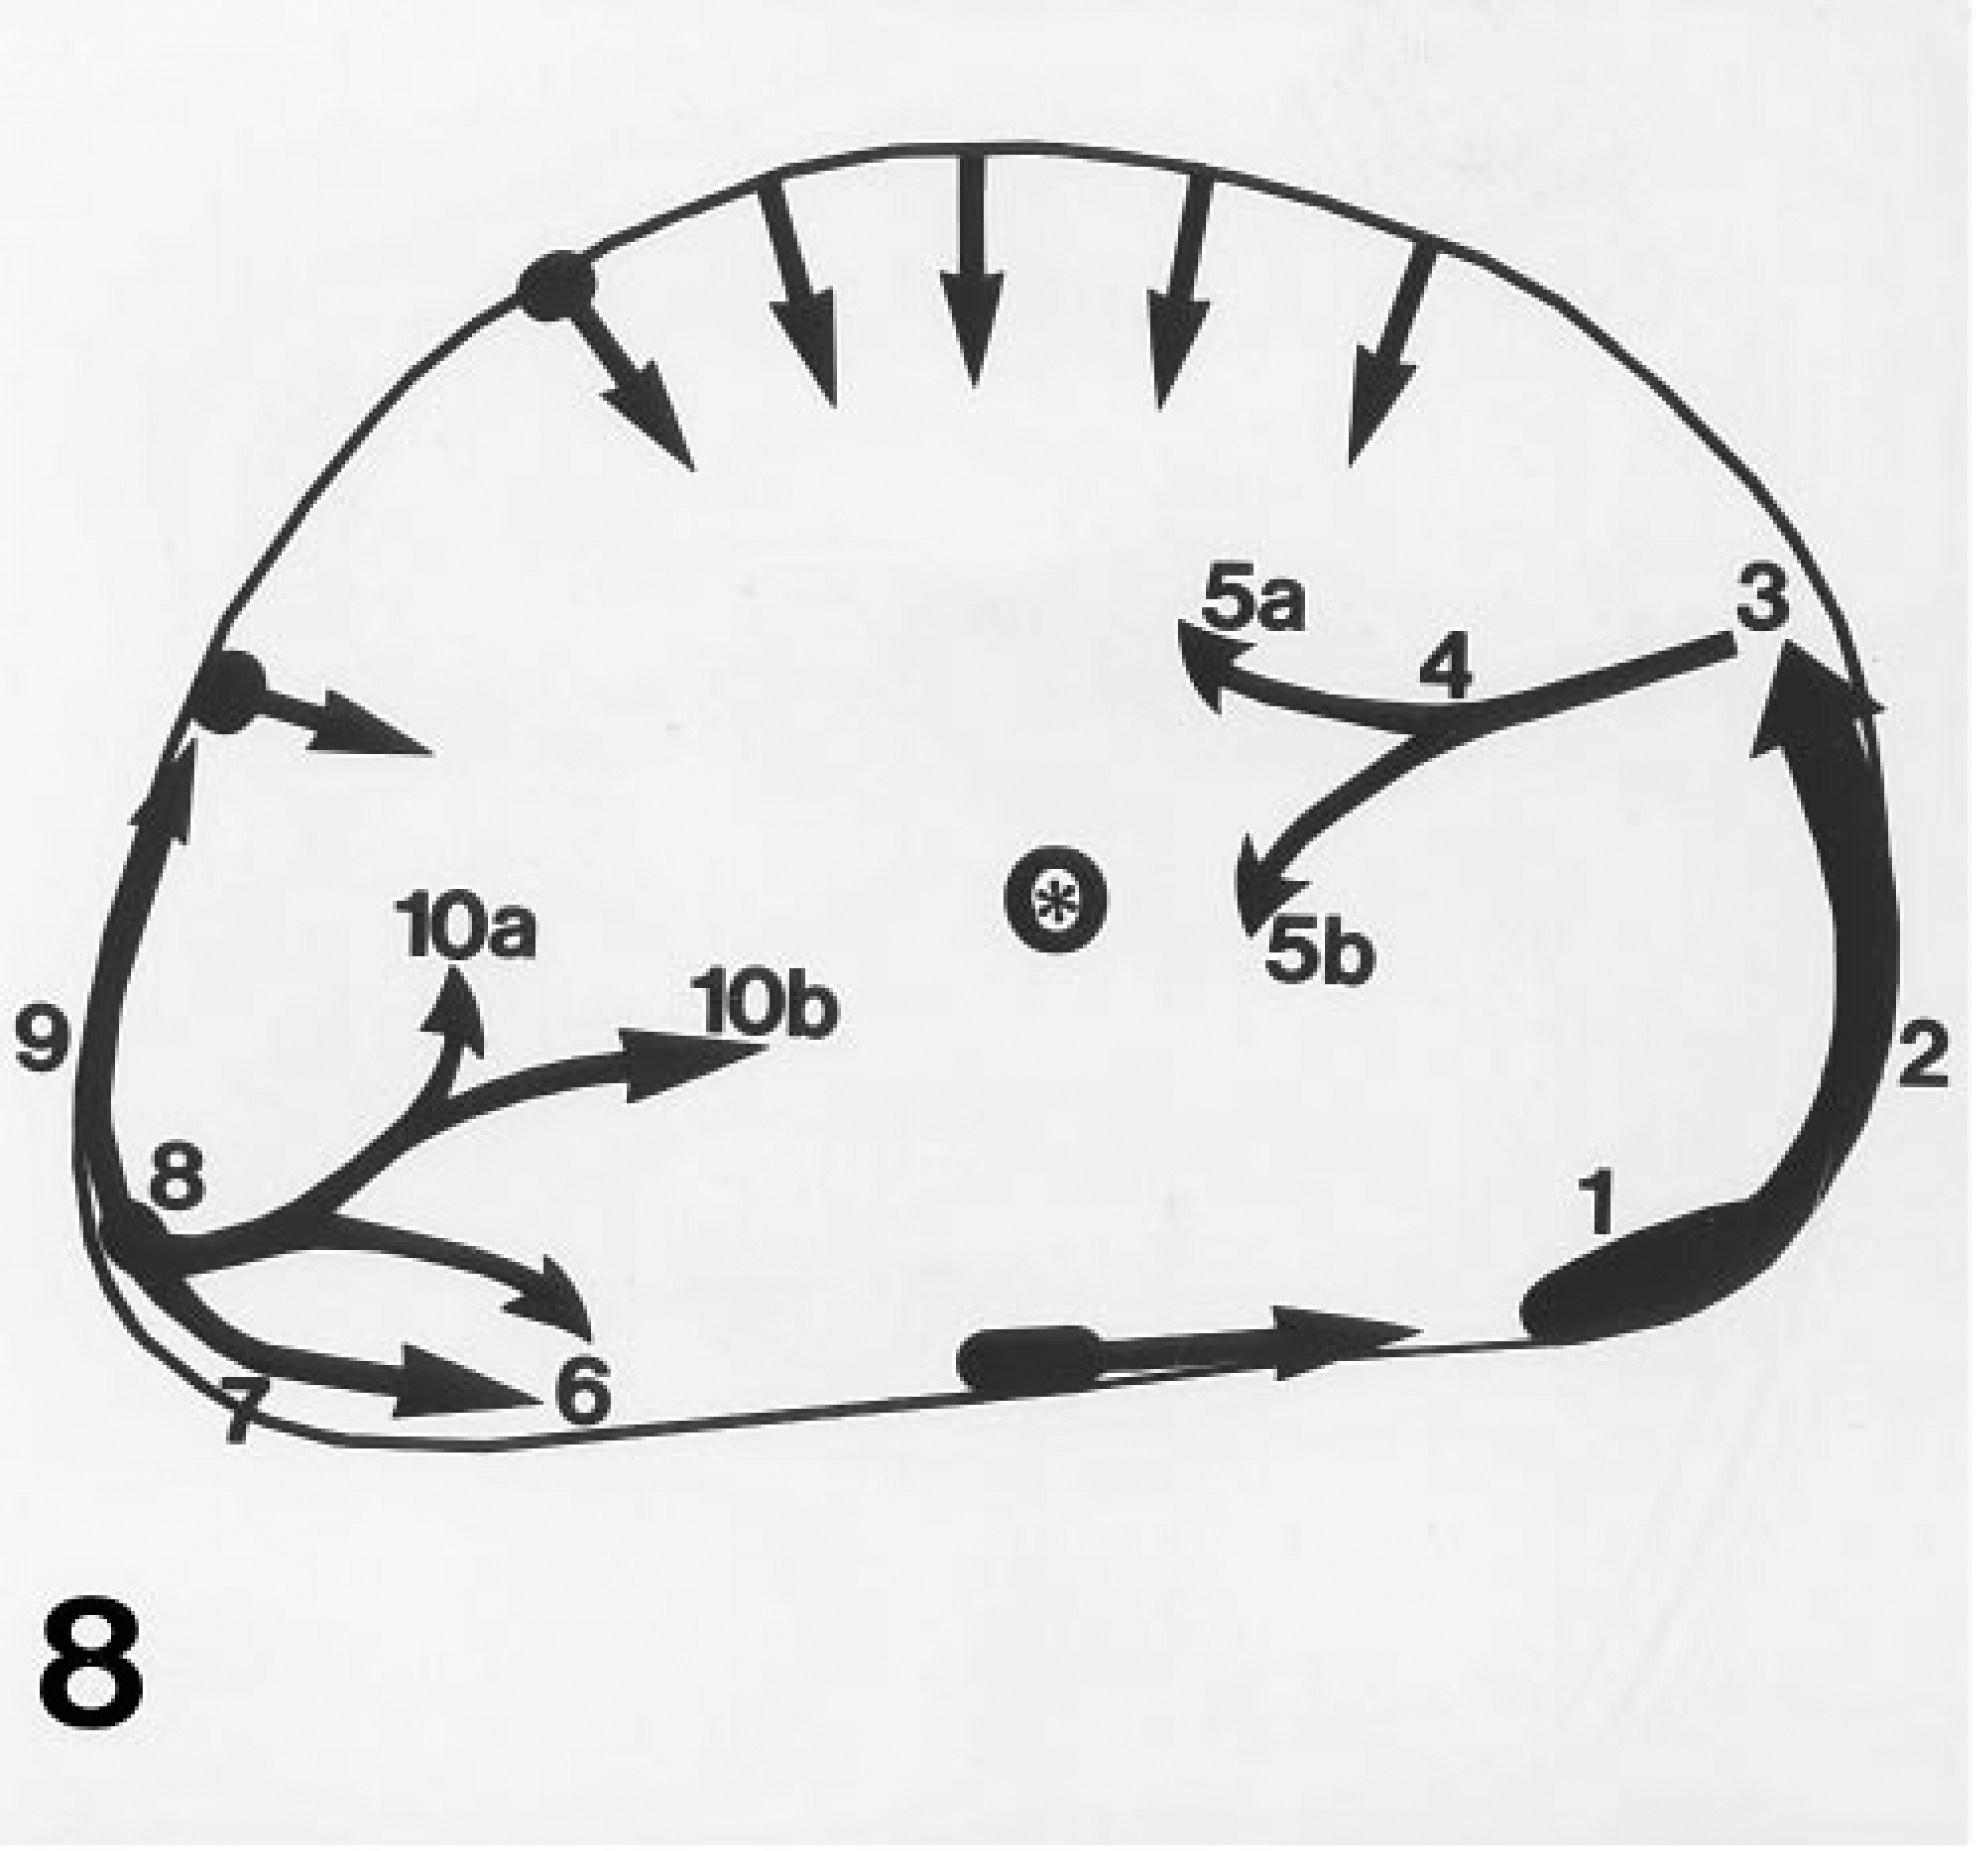
Sketch reconstruction derived by study of the full sequence of 51 T1 parameter maps of the tumor shown in Figure 7, tracing regional CM flows in the tumor. The two major flows denoted by the number series 1–5a/b and 8–10a/b collate with blood vessels patterning these flows and are denoted individually in Figures 9A-9C. The asterisk denotes the site of the plastic cannula.
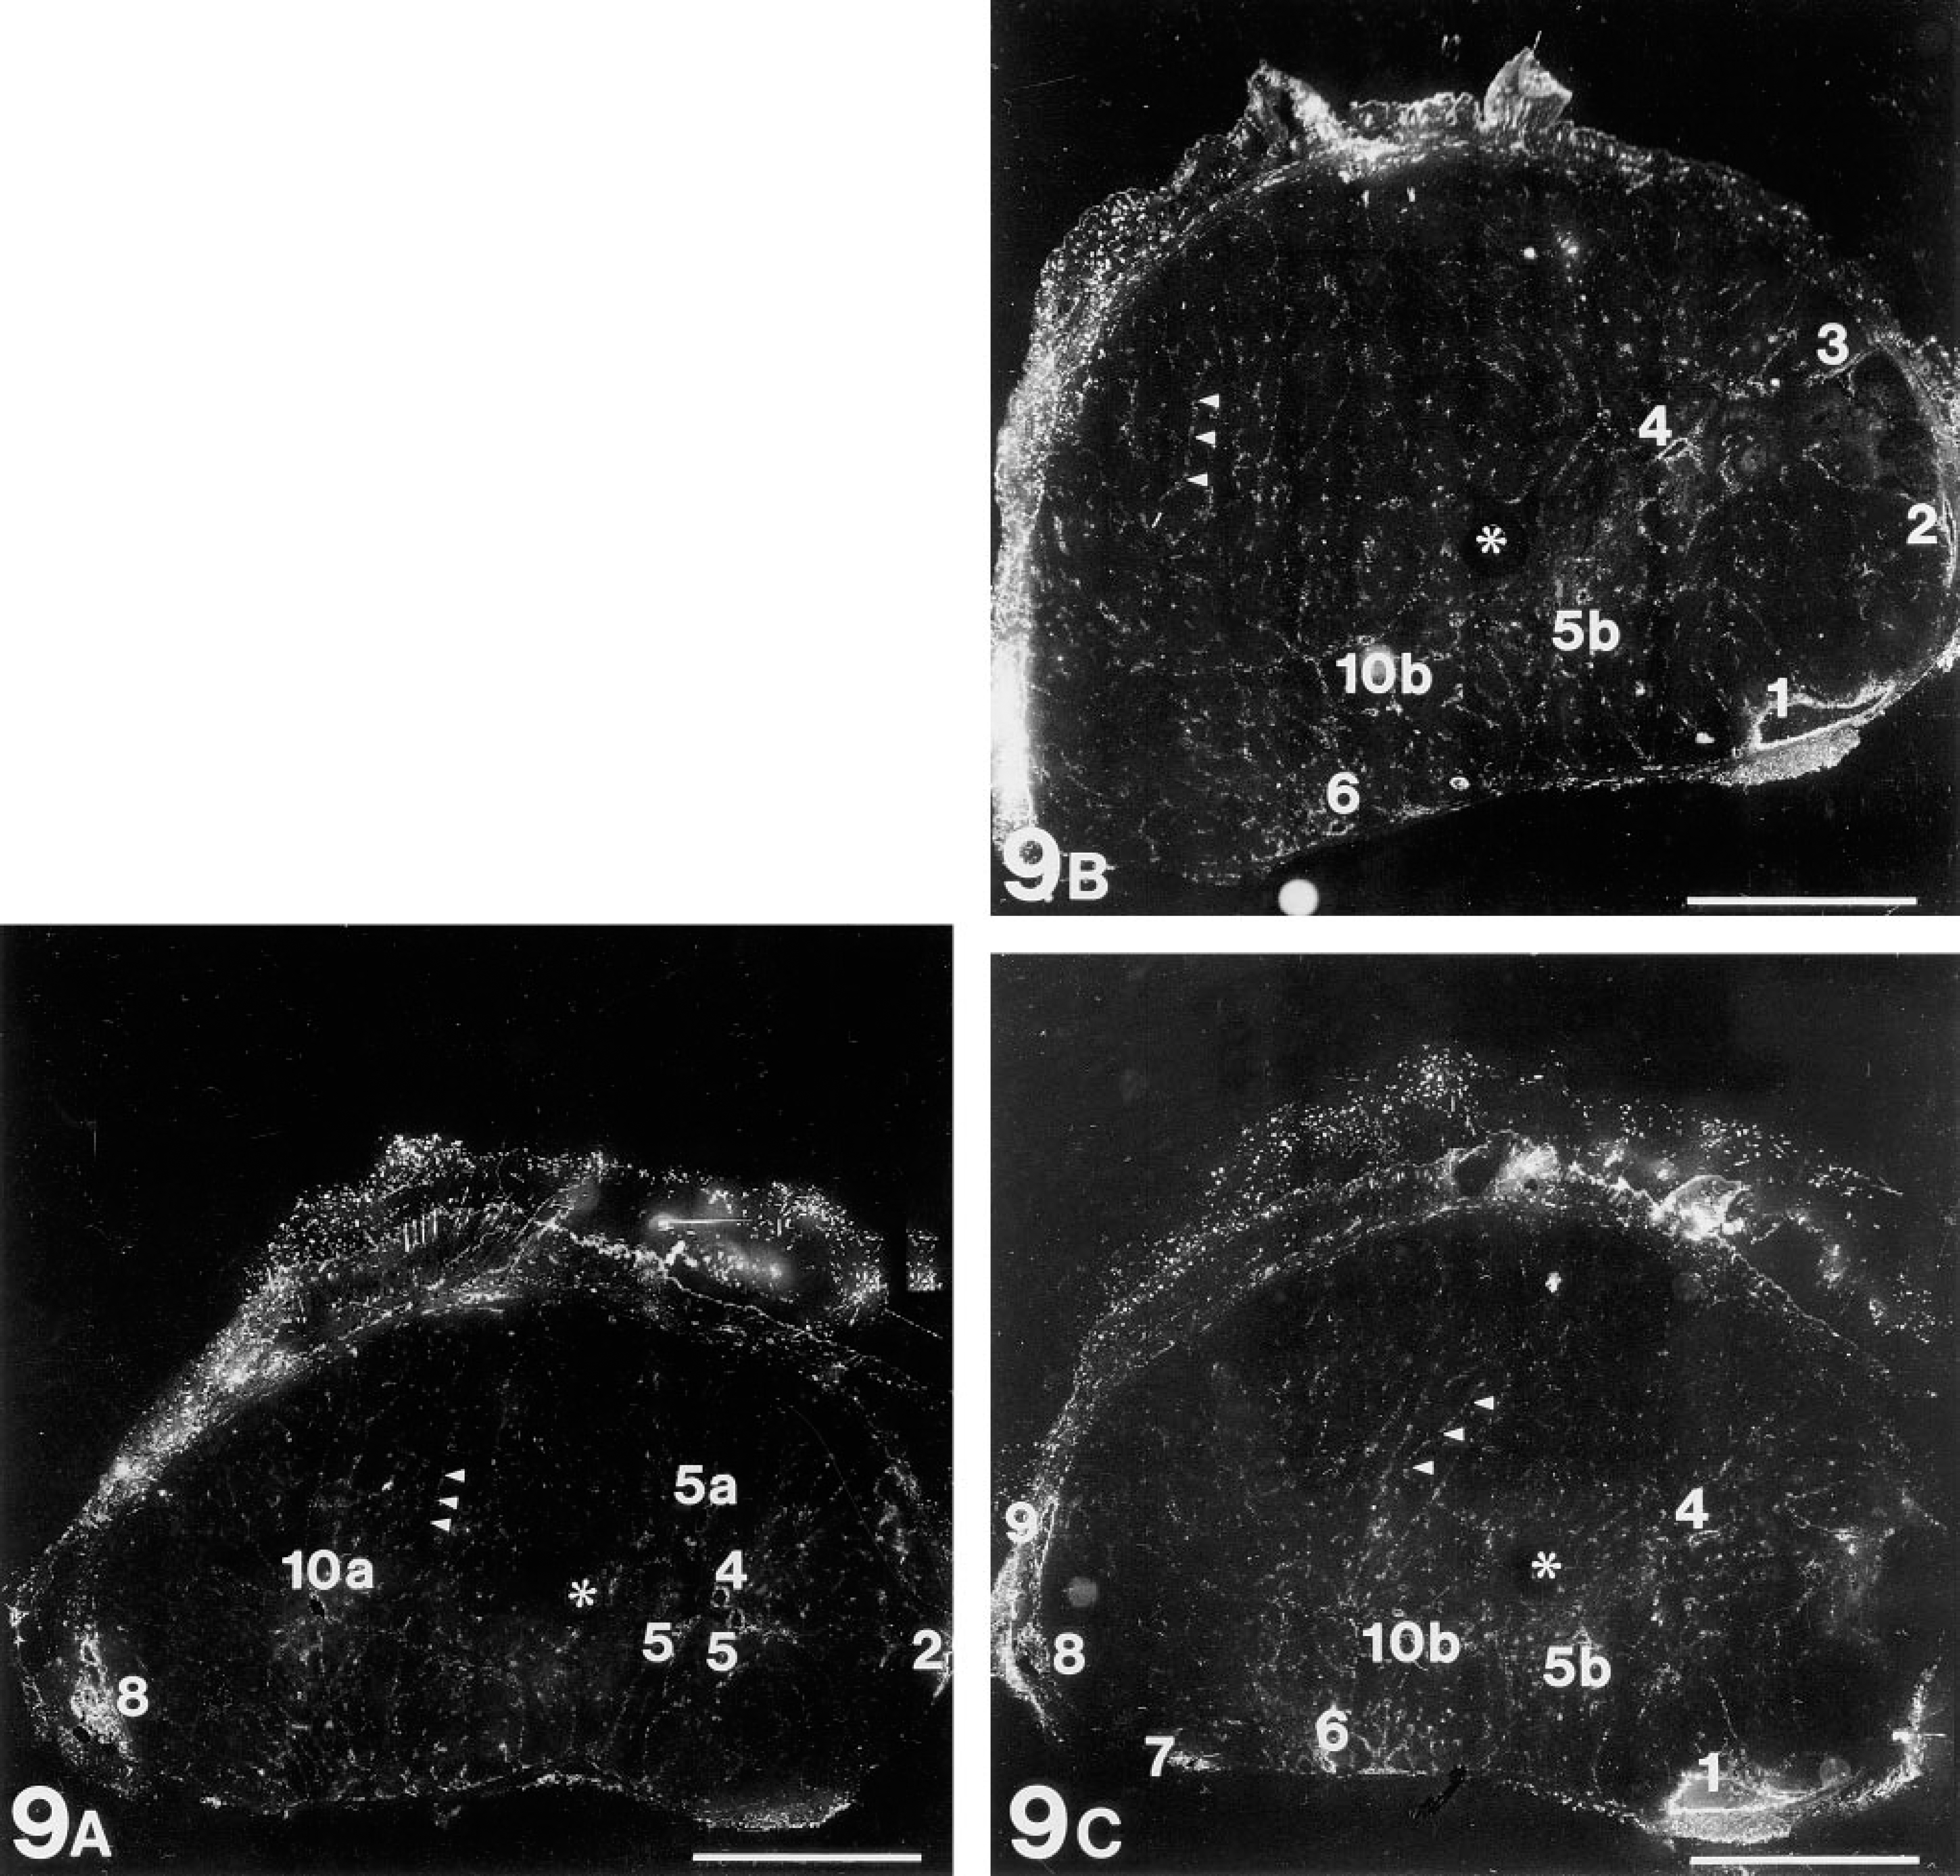
Three micrograph mosaics visualizing the perfused vasculature in the tumor shown in Figures 7 and Figures 8. This tumor was perfused intravitally with HPA-TRITC. These three 10-μm sections, separated by 120-μm intervals, all lie within the 750-μm deep MR slice shown in Figure 7. Each mosaic reconstructs the tumor cross-section as an array of 18 × 18 fields acquired using a x 10 objective, each single field being comparable in resolution with that shown in Figure 6. In these mosaics, the perfused vascular elements appear white. The keratin of hairs generates a sizeable autofluorescent signal at the wavelengths used for this work, so that the fur left in place on the tumor surface is visible. An asterisk in each of the three mosaics marks the site at which the plastic cannula was inserted (compare Figure 7). Blood vessels of various calibers, denoted 1–10, collate with sites of enhanced CM concentration in Figure 7 and with singular points in the regional CM flow pattern (Figure 8). Note that capillary caliber sinusoids are still just visible at this resolution (arrowheads in each mosaic), each similar in caliber to that shown in the light micrograph in Figure 1 and at ultrastructural resolution in the electron micrograph in Figure 2. Bars = 0.3 cm.
High levels of intravital endothelial labeling were obtained in many organs, including liver, lung, kidney, spleen, and gut. Microvessels in brain and in the AT17 tumor were much less intensely labeled. One finding was unique to the AT17 tumor, however. This was the only structure in the mouse in which 60-sec intravital circulation of the lectin did not suffice to label all the microvessels. Because these microvessels were demonstrably competent to bind the lectins, it follows that they were not accessible to the lectins during the 60 sec allowed for circulation. Using these data in combination with the values we obtained for perfusion parameters as discussed above, we designed sequential lectin perfusion studies which confirmed the occurrence in the AT17 tumor of intermittent perfusion, as described in other tumors by Chaplin et al. (1987), Thomas et al. (1996), Trotter et al. (1989a,b), and Pigott et al. (1996). Sequential use of a single lectin, each bolus labeled with a different fluorochrome, visualizes only a single type of binding site in the vessel wall but reveals intermittent perfusion by color coding the microvessels. This avoids the specificity mismatches that can occur when perfusible dyes are employed (Trotter et al. 1989a,1991; Chaplin et al. 1990a,b; Horsman et al. 1990,1994; Tufto and Rofstad 1995). In our results, red-labeled microvessels were accessible to perfusion at the moment when the first lectin bolus was applied but were either inefficiently perfused or closed at the moment when the second bolus was applied. Green-labeled microvessels were not accessible at the time when the first bolus was applied but were perfused at the time when the second bolus was applied. Microvessels labeled in both channels were accessible to perfusion at both times. Microregions in the AT17 tumor were thus confirmed to experience both inefficient and intermittent perfusion over a 15-min time frame. We determined that the method is applicable not only to the AT17 adenocarcinoma of the mouse. Preliminary experiments (data not shown here) also demonstrated the perfused microvasculature in a malignant melanoma of human origin transplanted into C3H mice.
The same parameters noted above, determining lectin staining of microvessels in tumors, will also figure among those governing uptake and washout of iv applied paramagnetic CM imaged by MRI in dynamic studies (Gowland et al. 1992; Griebel et al. 1992, 1994a,b; Kennedy et al. 1994; Su et al. 1994,1995; Kremser et al. 1995). To provide a morphological foundation for evaluating data acquired by MR dynamic studies, micrograph mosaics of tumor sections were collated with MR T1 parameter maps in this study. The method depends on the dense concentrations of lectin binding sites in the microvessel wall and on the strong signals emitted by fluorescently labeled lectins, permitting high-contrast images to be obtained of micrometer-sized structures by use of a low-power objective. The construction of metrically accurate wide-area micrograph mosaic images of tumor sections was necessary because a microscopic field of view through a low-power (X 10) objective corresponded to only two MR voxels in an image acquired in a high-field MR device operating in rapid mode with acquisition time less than 1 sec (microscopic field of view 600 μm X 600 μm; MR voxel 250 μm X 250 μm in the image plane). This resolution gap between microscope and MR was bridged in the present study. Micrographic mosaic maps were generated with optical resolution and metrical precision each approximately 1.5 μm, yet of large enough area to overlay an MR map showing the cross-section of an entire AT17 tumor. One further gap in relative spatial resolution must also be bridged, the resolution in the third dimension, i.e., depth. MR voxels are much thicker (750 μm) than cryostat sections (10 μm), and therefore collation involving only two or three micrograph mosaics, as demonstrated here, samples no more than a subset of the vascular structures containing CM and contributing to the MR image. The results shown here illustrate this, the three images in Figure 9 sampling approximately one third of the depth of the tumor slice imaged by MR in Figure 7. This resulted in essentially complete visualization of the blood vessels underlying two regional flow fields in the tumor slice. Exhaustive analysis of all the blood flows that could be traced out by study of the MR sequence data would require regular microscopic sampling at sufficiently narrow intervals of the entire voxel depth of the MR map. The data shown here indicate that an interval of 120 μm between sample planes is narrow enough to retrieve essentially all the major vascular elements patterning a single regional flow field. It follows that, in our experimental system, to fully demonstrate the vasculature underlying the flow pattern revealed in a tumor slice by MR mapping would necessitate microscopic sampling of the tumor cross-section at 8–10 levels separated by regular intervals of approximately 100 μm.
The intravital lectin perfusion technique permits more extensive analysis than has been thus far noted. After the completion of fluorescence microscopy, the unfixed cryostat sections are available for further analysis. They can, for example, be further processed for immunohistochemical demonstration of antigens characteristic of tumors, of stages in the cell cycle, or of cytokines. Sites in the micrographic mosaic images of the vasculature can therefore be related to specific details of the underlying pathology, such as nests of raised mitotic index, or apoptosis or necrosis, or to cytokines mediating any local inflammatory response. As a result, intravital lectin perfusion renders it possible to correlate details seen in MR quantitative analysis with parameters of considerable tumor biological significance. It should be noted that in any such correlative analysis the size of the ROI invoked in the MR evaluation shrinks to a single voxel. The application of intravital lectin perfusion is not restricted to complementing MR analysis, however. This method is applicable to aiding in evaluation of data obtained by any of the imaging procedures used to study the living organism, e.g., positron emission tomography. It allows, in principle, the correlation of such data with local parameters that regulate blood flow.
Footnotes
Acknowledgements
We thank Prof Dr M. Pavelka for her generous support and encouragement of this work and Dr J. Kummermehr for helpful discussion of the biology of the AT17 tumor. We thank Dr R. Seneckowicz for access to her mouse model of human amelanotic melanoma. We are grateful to Mr E. Mannweiler for developing the software modules, to Mr A. Voss for help with the spectrofluorometry, and to Ms S. Möllenstädt for care of the mice and transplanting the tumors and for assistance with the histochemistry. We thank Mr R. Haring and Ms J. Forgo for assistance with the electron microscopic histochemistry and with photography, and Dr C. Kremser for valuable help with preparation of the computer images. We are grateful to Schering (Berlin, Germany) for kindly providing gadolinum compounds.