
Abstract
Osteocalcin (OC), a bone-specific protein, is a marker of late osteoblastic differentiation. Its expression is influenced by various growth factors and hormones. We investigated the effect of 1,25-dihydroxy vitamin D3 (D3) and tri-iodothyronine (T3) on OC expression in osteoblast-like MC3T3-E1 cells. A heterologous OC green fluorescence protein (GFP) fusion vector was established and expressed to study possible effects on protein transport. Immunostaining of endogenous OC revealed a significant increase in the percentage of positive cells after D3 and T3 treatment. This was consistent for MC3T3-E1 cells as well as nonosteogenic NIH-3T3 and mammary carcinoma cells, but not for neuroblastoma cells. The perinuclear immunostaining corresponded to the NBD C6 ceramide Golgi staining. Conversely, we found a strong induction of OC in MC3T3-E1 cells at the mRNA and protein levels only with T3 and not with D3. OC mRNA and protein expression was not detected in NIH fibroblasts. OC GFP transfection experiments indicate rapid transport and secretion of OC, because OC GFP was not found to be accumulated at intracellular compartments after hormone treatment. We conclude that the strong perinuclear immunostaining does not represent OC but a protein immunologically related to OC, as indicated by preabsorption experiments. The expression of this OC epitope-sharing protein is regulated by both D3 and T3 in the osteoblastic MC3T3-E1 and in nonosteogenic cells.
1,25-D
Osteocalcin (OC) is a small (5.2–5.9 kD) protein that comprises 10–20% of the noncollagenous organic material of the extracellular bone matrix (Hauschka et al. 1975). To date, OC protein synthesis has been identified only in osteoblasts and odontoblasts (Price et al. 1976; Weinreb et al. 1990). However, low basal expression of OC mRNA was described in tissues other than bone (Fleet and Hock, 1994) and even in blood platelets (Thiede et al. 1994). More recently, ectopic secretion of osteocalcin by a myeloma cell line was reported and was found to be regulated by D3 (Barille et al. 1996). The majority of OC secreted by osteoblasts is deposited into the bone matrix. Its most obvious property is the capacity for specific Gla (γ-car-boxyglutamic acid)-dependent binding of Ca2+. OC-deficient mice develop a phenotype characterized by higher bone mass without impaired bone resorption (Ducy et al. 1996). The level of OC in the blood circulation is considered to reflect primarily a spillover of osteoblast synthetic activity, and its concentration in serum has been increasingly used as an index of bone formation. However, the exact physiological functions of OC in bone metabolism are still not fully understood.
The effects of D3 and T3 on OC mRNA and protein expression have been studied in various chicken, mouse, rat, and human osteo-derived cell lines, indicating that the hormonal regulation is species- and differentiation-dependent (Pirskanen et al. 1991; Ohishi et al. 1994; Broess et al. 1995; Zhang et al. 1997; Varga et al. 1997). In this study we investigated the regulatory effects of D3 and T3 on OC synthesis and secretion in MC3T3-E1 cells. The intracellular transport processes were studied by use of a heterologous OC green fluorescence protein (GFP) fusion vector. Immunohistochemical localization and distribution of OC-positive cells were investigated using an antiserum against mouse OC.
Materials and Methods
Cell Culture
MC3T3-E1 mouse calvaria-derived osteoblast-like cells (Dr. Kumegawa; Sakado, Japan), NIH-3T3 mouse fibroblasts (ATCC; Rockville, MD), I34 mouse mammary carcinoma cells, and NB1 mouse neuroblastoma cells (Institute of Cancer Research and Tumor Biology; University of Vienna, Vienna, Austria) were cultured in αMEM supplemented with 4.5 g/liter glucose, 5% fetal calf serum (FCS), and 30 μg/ml gentamicin (regular medium). The cells were kept in humidified air under 5% CO2 at 37C. They were subcultured twice a week using 0.001% pronase E and 0.02% EDTA in PBS. For the experiments, the cells were seeded at a density of 50,000/cm2. Continuous treatment with T3 (10−7 M; Sigma, Diesenhofen, Germany) or D3 (10−8 M; Hoffmann LaRoche, Vienna, Austria) was started 24 hr after seeding. Medium was changed every third day.
Immunostaining of Endogenous OC
Cells were cultured on sterile glass coverslips placed in the culture dishes. At the respective time points (24 hr, and 3 and 8 days of culture) cells were rinsed with PBS, fixed with 4% paraformaldehyde (15 min), and permeabilized with methanol (5 min, -20C). After several rinses with PBS, cells were incubated with goat anti-mouse osteocalcin antiserum (RIA grade; BTI, Stoughton, MA; 1:100 in 3% BSA, 1 hr), followed by rabbit anti-goat IgG (Nordic Immunology; Til-burg, The Netherlands; 1:100 in 3% BSA, 45 min) and donkey anti-rabbit IgG conjugated with Cy3 (Accurate, West-bury, NY; 1:500 in 3% BSA, 45 min). According to the supplier, this OC antiserum is specific for the intact molecule, with the recognition site at the carboxyl terminal. The epitope is further along the molecule than the common Gla domain. In addition, for some experiments cell nuclei were counterstained with PicoGreen (Molecular Probes, Leiden, Netherlands; 1:1000 in A. dest., 45 min) after treatment with RNase A (Boehringer, Mannheim, Germany; 0.1 mg/ml in A. dest., 37C, 20 min). Coverslips were mounted on glass slides in Vectashield (Vector Laboratories; San Diego, CA) and examined using a confocal laser scanning microscope (Leica TCS4D).
Percentages of immunopositive cells were determined by evaluating at least 300 cells for each time point and treatment. The specificity of the immune reaction was assessed by staining with nonimmune goat serum (BTI; 1:100) or by omitting the OC antiserum. Preabsorption of the OC antiserum with purified mouse OC (BTI) was performed with 5 μg, 500 ng, 50 ng, and 5 ng OC per ml of 1:100 diluted antiserum, overnight at 4C.
Golgi Staining with NBD C6 Ceramide
MC3T3-E1 and NIH-3T3 cells grown on glass coverslips were incubated with NBD C6 ceramide (Molecular Probes, Leiden, The Netherlands; 5 nM in 1% DF-BSA, 6C, 30 min), a vital stain for the Golgi apparatus. The cells were treated as described in Pagano et al. (1989), fixed, and examined as described above.
Western Immunoblotting
Denaturing SDS-PAGE of 20 μg protein extract/lane or 100 ng mouse OC standard (BTI) was performed on 12% or 15% gels, respectively, according to the method of Laemmli (1970), followed by semidry transfer to PVDF membranes (Immobilon-P; Millipore Intertech, Bedford, MA). The blots were probed with the goat anti-mouse OC antiserum (BTI) and were detected by a secondary antibody against goat IgG coupled to alkaline phosphatase (Sigma). For estimation of the molecular weight, a color marker (Amersham; Poole, UK) was used.
For determining the binding capacity of the OC antiserum to denatured OC, we applied 50 ng OC (BTI; diluted in 0.1% BSA) as well as 50 ng SDS- and/or heat-denatured OC on a nitrocellulose and/or PVDF membrane using a slot-blot filtration apparatus.
Radioimmunoassay
MC3T3-E1 and NIH-3T3 cells were seeded in 96-well culture plates and cultured as described above. At Days 3 and 4, respectively, the cell culture media were removed and kept at -20C until assayed by a competitive liquid-phase RIA (BTI). According to the supplier's description of the RIA, there is no crossreaction with bovine OC.
Northern Blotting
RNA electrophoresis, transfer, and hybridization were performed as described previously (Varga et al. 1997). As hybridization probes we used the mouse OC cDNA (Celeste et al. 1986) and the complete rat GAPDH. All probes were kindly provided by Dr. Busslinger (IMP; Vienna, Austria).
Construction of OC GFP Fusion Plasmid
The recombinant mouse OC-enhanced green fluorescence protein (GFP) fusion construct was obtained by fusing the mouse OC cDNA (Celeste et al. 1986) in a frame N-terminal to the GFP. For this a mouse OC cDNA restriction fragment (PstI/XmaI) of 210
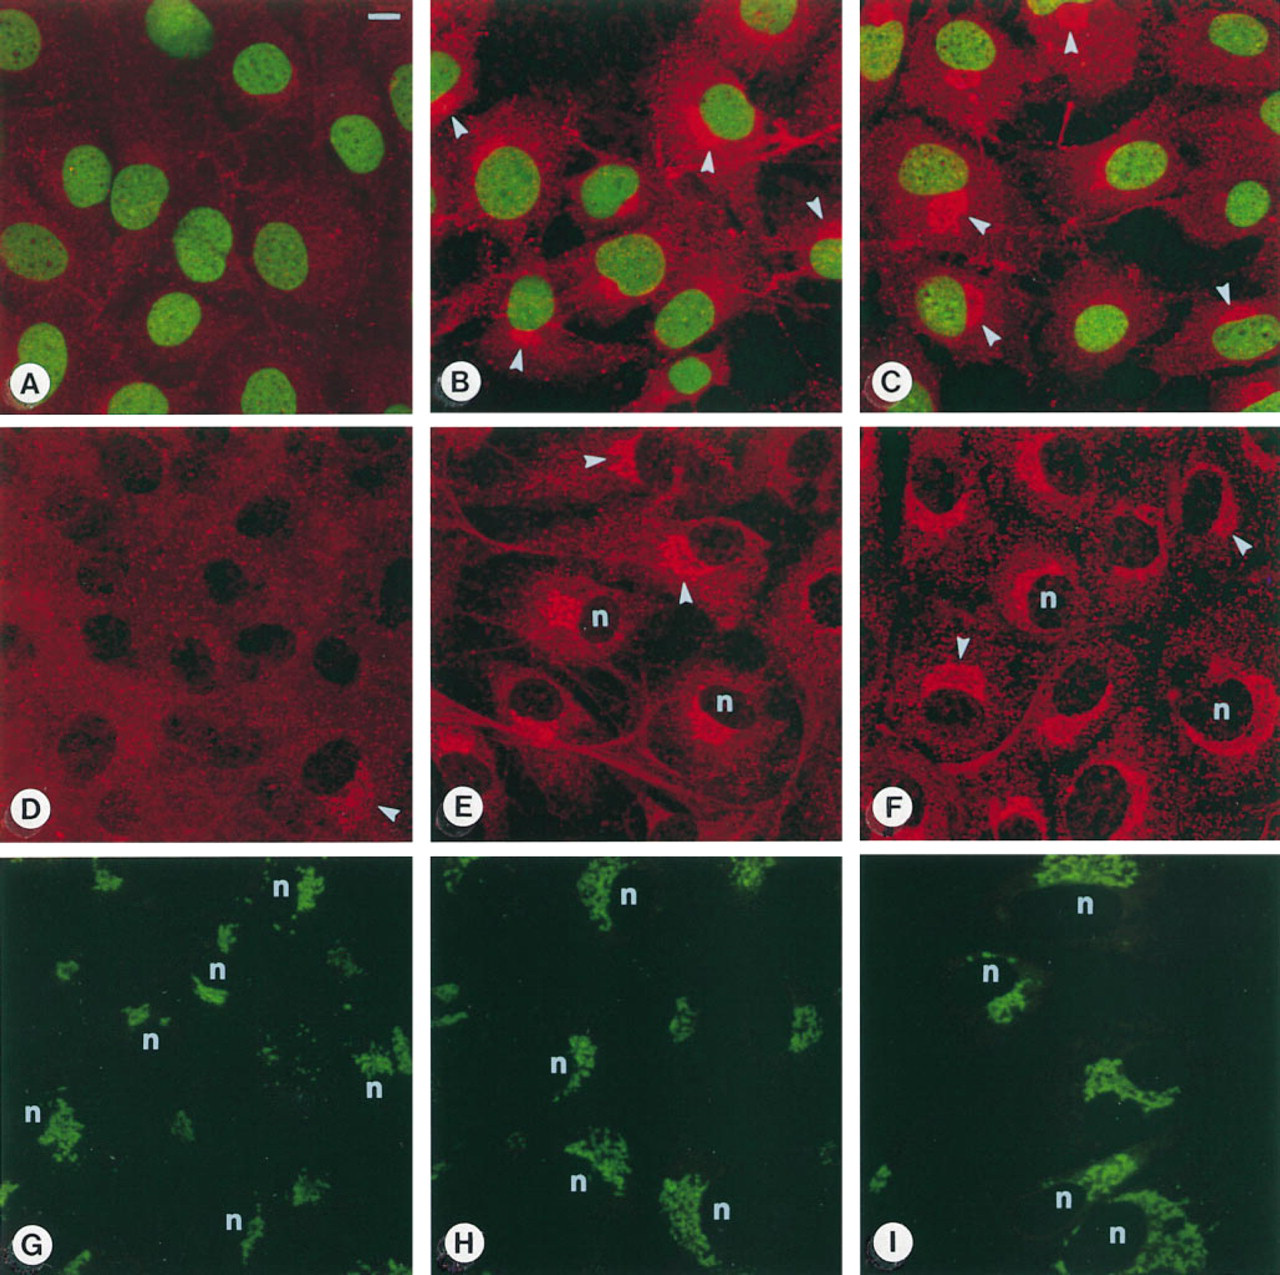
MC3T3-E1 osteoblast-like cells stained with the OC antiserum, picogreen, and NBD C6 ceramide. Left row, control cells; middle row, T3-treated cells; right row, D3-treated cells. (
Transfection Experiments
MC3T3-E1 cells were seeded on coverslips placed in culture dishes and were grown overnight in regular medium. The cells were transfected with 1 μg OC GFP fusion vector and 5 μg of transfection reagent DOSPER (Boehringer) in 700 μl αMEM for 6 hr, and this was continued for a further 18 hr after addition of 2.5 ml regular medium. Then the medium was completely replaced by regular medium with or without T3 (10−6 to 10−9 M) or D3 (10−7 to 10−10 M). A temperature block (15C for 1 or 2 hr; cf. Kaether and Gerdes 1995) was performed to visualize the fusion protein along its secretory pathway. During this period the medium was buffered with 20 mM HEPES (pH 7.4). Release of the temperature block was started by replacing HEPES-buffered culture medium with 37C regular medium. After fixation, at least 10,000 cells/coverslip were investigated to determine the number of transport-arrested cells after the respective hormone treatments.
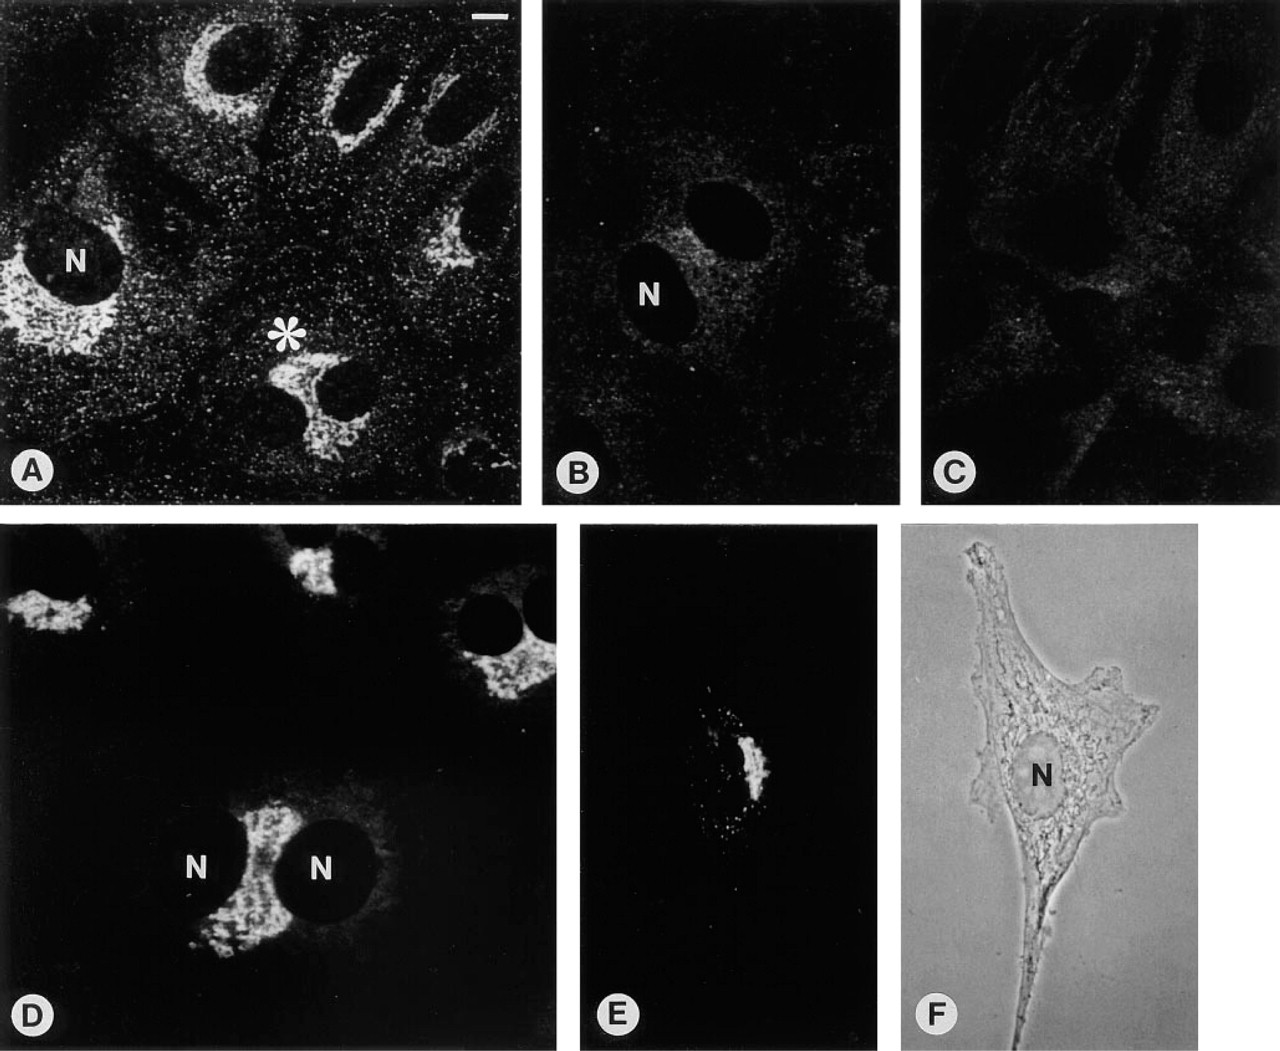
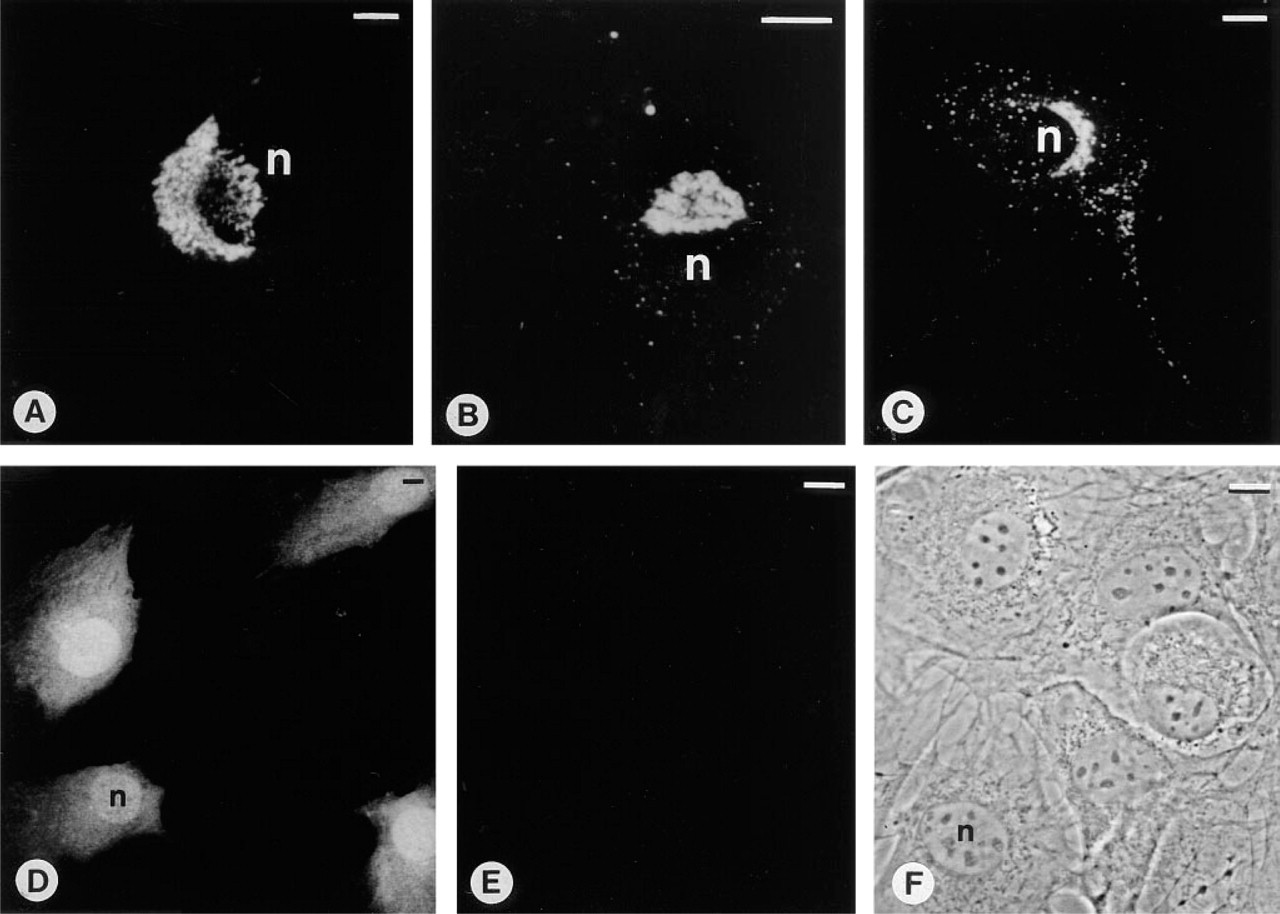
MC3T3-E1 osteoblast-like cells treated with D3. (
Statistical Analysis
ANOVA (Statview 4.0; post hoc test, Scheffe) was used for statistical analysis.
Results
Immunostaining of Endogenous OC
MC3T3-E1 Mouse Osteoblast-like Cells. After 3 days of culture, cells reached a subconfluent monolayer. In controls, only few cells exhibited positive immunostaining (Figure 1A). In contrast, the majority of T3- and D3-treated cells exhibited intense perinuclear staining (Figures 1B and 1C). Three days of treatment with T3 and D3 resulted in a highly significant increase in the percentage of positive cells (cf. Figure 4; Co 16 ± 7%, T3 69 ± 5%, D3 82 ± 3%).
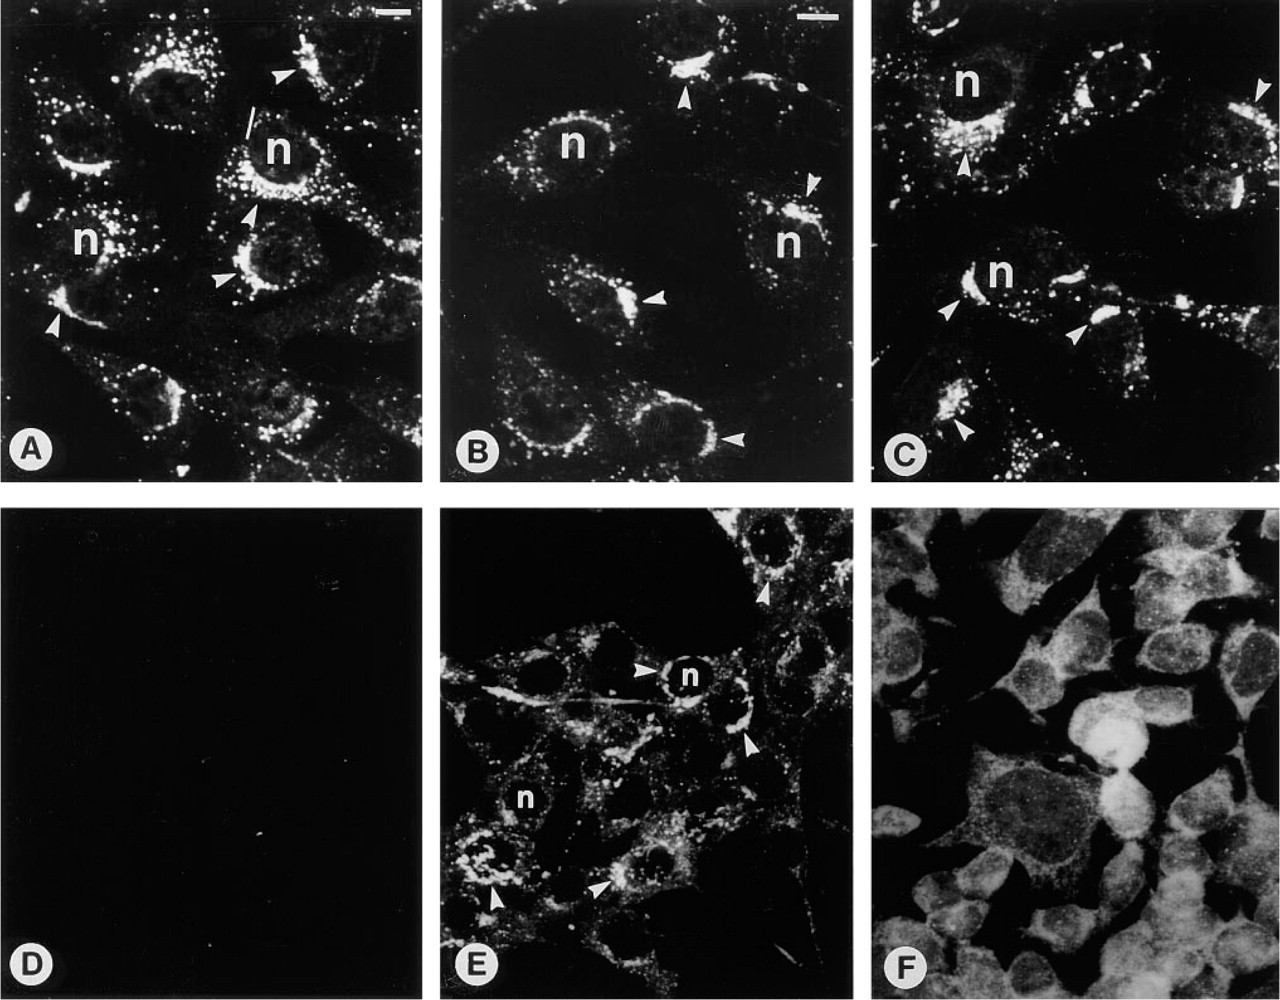
Nonosteogenic cells after 3 days of culture, immunostained with the OC antiserum. (
After 8 days of culture the percentage of immunopositive cells remained constant compared with Day 3 (cf. Figure 4; Co 17 ± 6%, T3 78 ± 5%, and D3 85 ± 3%). However, an increase in the intensity of the immunostaining in a distinct juxtanuclear region could be observed (Figures 1D-1F), especially after treatment with D3 (Figure 1F). The tubulo-vesicular structure of the staining appeared consistent with an accumulation of the antigen in the Golgi region. This is supported by comparison with the NBD C6 ceramide Golgi staining (Figures 1G-1I). In general, the stained Golgi stacks appeared to become enlarged with culture time. However, enlarged Golgi complexes were more abundant in cultures treated with T3 and D3. In D3-treated cultures, many large binucleate cells could be observed, showing extensive strong immunostaining mostly located between the two nuclei (Figure 2A). A similar localization was observed after NBD C6 ceramide Golgi staining (Figure 2D). Such conspicuous binucleate figures were found exclusively in D3-treated and, less commonly, in T3-treated MC3T3-E1 cells.
Preabsorption of the OC antiserum with purified OC (5 μg) resulted in complete inhibition of immunostaining (Figure 2B) comparable to the negative staining when nonimmune goat serum was used instead of the OC antiserum (Figure 2C). The perinuclear immunostaining gradually reappeared in response to increasing dilutions of the OC protein used for the preabsorption experiment (500 ng, 50 ng, and 5 ng OC), indicating the specificity of the antiserum for OC.
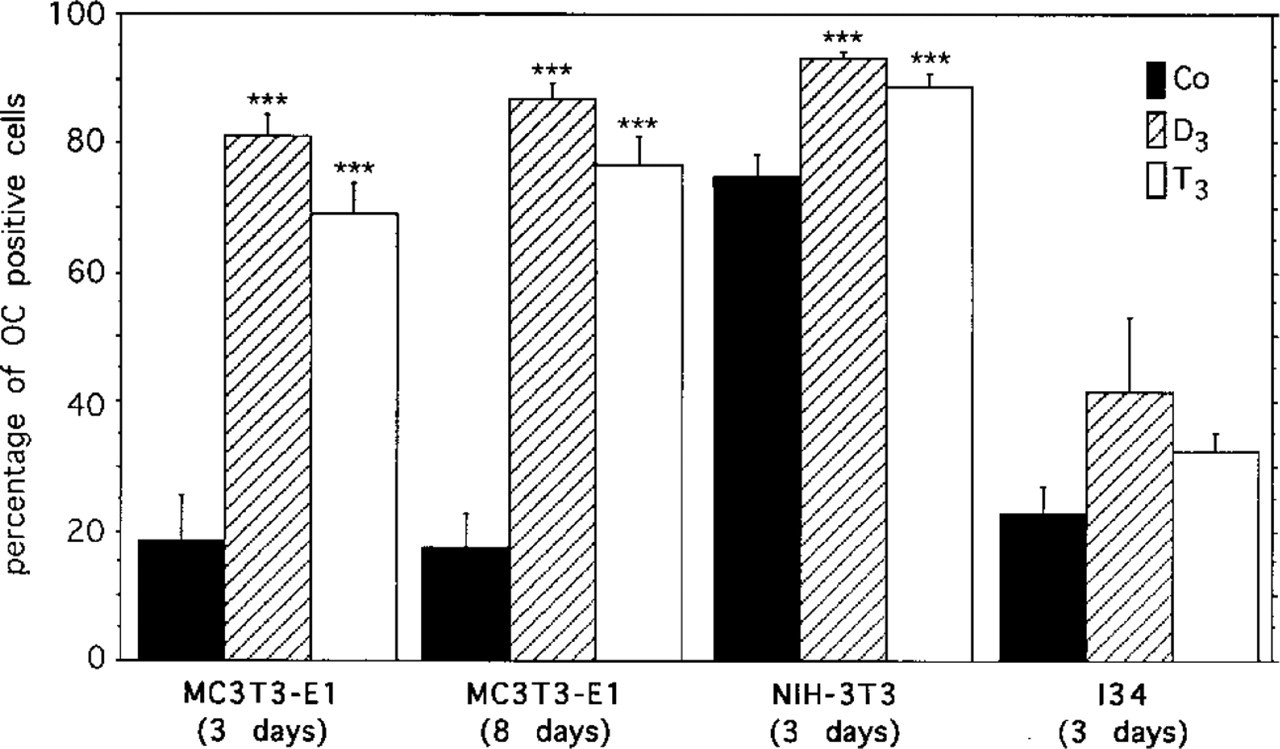
Effect of D3 and T3 treatment on the percentage of immunopositive cells as determined by counting at least 300 cells per time point and treatment. The stimulatory effect of the hormones was most profound in the osteoblastic MC3T3-E1 cells. Mean ± SEM; ∗∗∗ p < 0.001 (control vs T3 and D3).
To evaluate whether both hormones also stimulate the immunostaining at the single-cell level in actively growing MC3T3-E1 cells, cells were seeded and immediately treated with T3 or D3. Only 24 hr (Day 1) after seeding, many single cells without contact with neighboring cells showed positive perinuclear and vesicular staining in the cytoplasm (Figures 2E and 2F), predominately in hormone-treated but also in control cells.
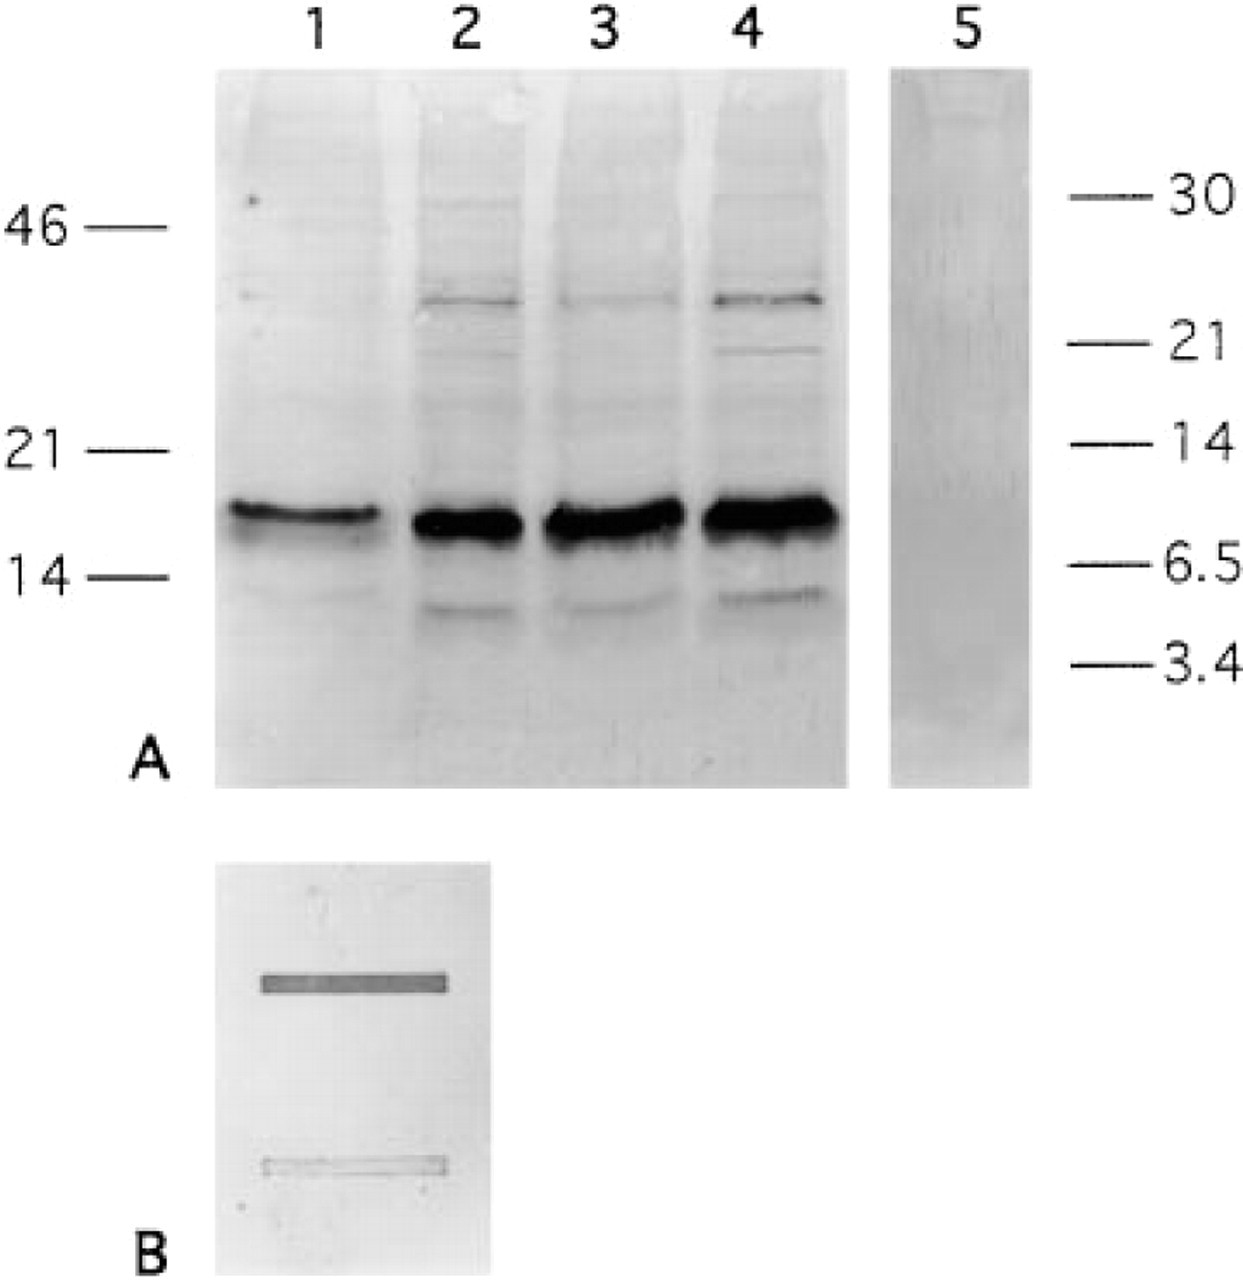
Immunoblotting with the OC antiserum. (A) SDS-PAGE of MC3T3-E1 protein extracts (Lanes 1–4) and mouse OC protein (Lane 5). Three distinct bands of ∼ 14, 18, and 40 kD were detected in the MC3T3-E1 protein extracts: Lane 1, Day 4 controls; Lane 2, Day 4 T3-treated; Lane 3, Day 8 controls; Lane 4, Day 8 T3-treated. The OC antiserum did not react with 100 ng mouse OC after SDS-PAGE (Lane 5). (B) Slot-blot analysis of native OC (upper slot) and denatured OC (lower slot) revealed that the antibodies failed to bind to denatured OC.
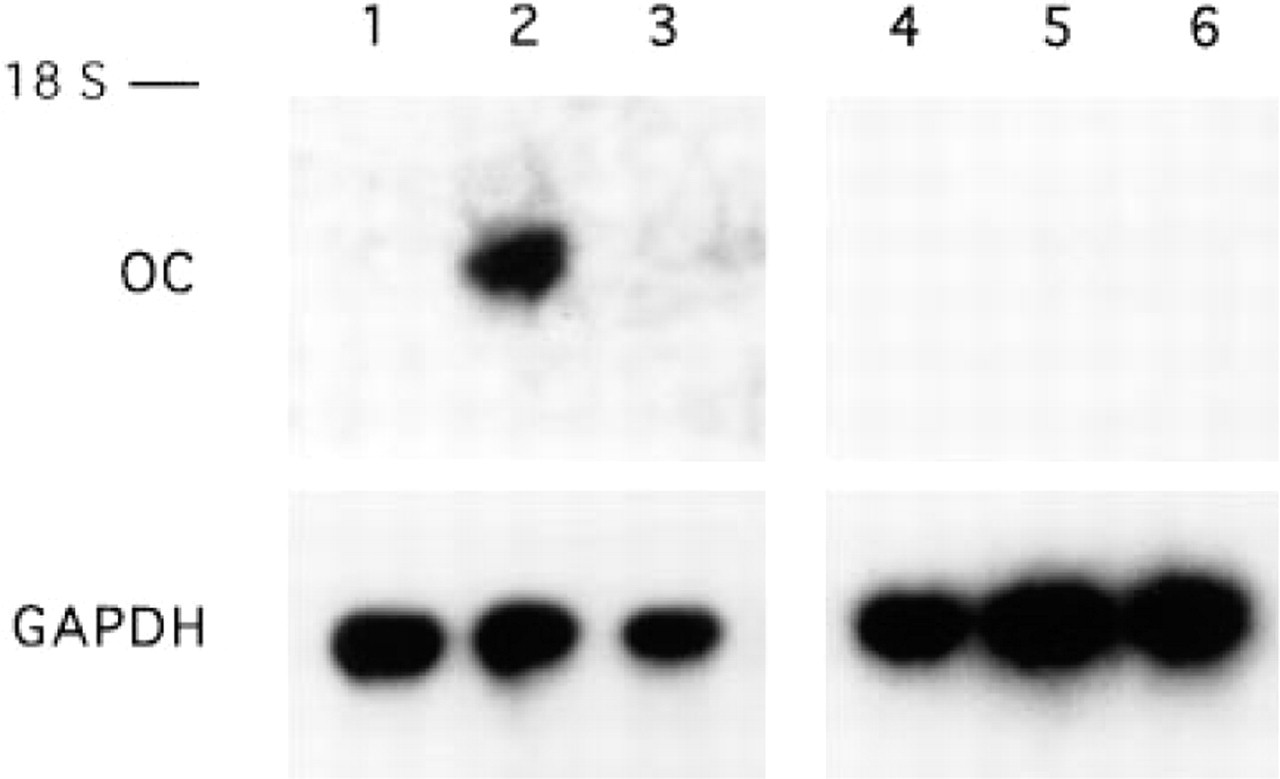
OC mRNA expression in MC3T3-E1 (Lanes 1–3) and NIH 3T3 (Lanes 4–6) cells. Northern blots of 10 μg RNA isolated from MC3T3-E1 or NIH 3T3 cells treated for 3 days with T3 (Lanes 2 and 5) or D3 (Lanes 3 and 6) or without hormones (Lanes 1 and 4) are shown. Control hybridizations were performed using a rat GAPDH probe. The 18S ribosomal RNA marker is indicated.
NIH-3T3 Mouse Fibroblasts, I34 Mouse Mammary Carcinoma Cells, and NB1 Mouse Neuroblastoma Cells. Surprisingly, some nonosteoblastic cell lines also showed similar positive results when stained with the OC antiserum.
NIH-3T3 Cells. After 3 days of culture, many control as well as T3- and D3-treated cells showed perinuclear immunostaining as well as immunoreactive vesicles throughout the cytoplasm (Figures 3A-3C). Again, immunostained regions corresponded to NBD C6 ceramide-positive Golgi elements (data not shown). However, in contrast to the results with MC3T3-E1 cells, a higher percentage of untreated NIH-3T3 cells were immunopositive (cf. Figure 4; Co 75 ± 5%, T3 88 ± 2%, D3 95 ± 1%).
I34 mammary carcinoma cells also showed a similar positive immunostaining pattern after 3 days of culture (Figure 3e), but the stimulatory effects of D3 or T3 did not reach significance (cf. Figure 4; Co 23 ± 5%, T3 32 ± 3%, D3 42 ± 12%).
Neither untreated nor hormone-treated NB1 neuroblastoma cells showed any immunohistochemical reaction with the OC antiserum (Figure 3F).
Comparison of the amount of OC in the cell culture media of mouse osteoblasts and mouse fibroblasts after treatment with D3 or T3 a
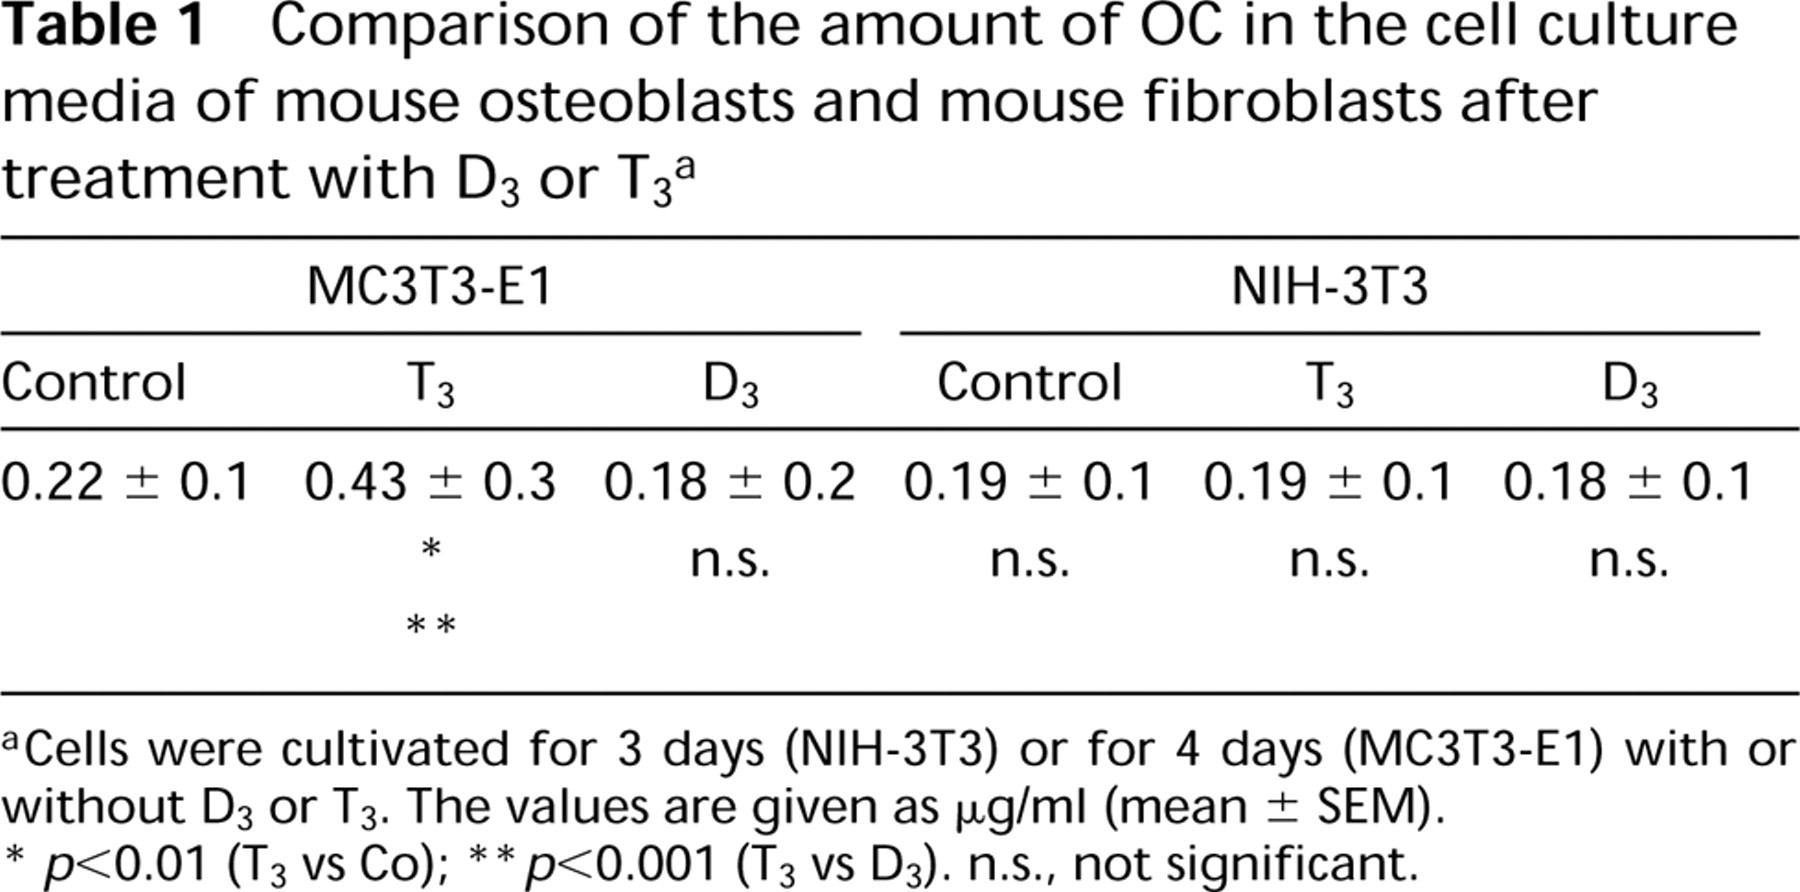
Cells were cultivated for 3 days (NIH-3T3) or for 4 days (MC3T3-E1) with or without D3 or T3. The values are given as μg/ml (mean ± SEM).
p<0.01 (T3 vs Co);
p<0.001 (T3 vs D3). n.s., not significant.
Western Immunoblot
The specificity of the OC antiserum was tested by immunoblotting under denaturing conditions. Three distinct bands of approximately 14, 18, and 40 kD were detected in MC3T3-E1 (Figure 5A) and in NIH-3T3 protein extracts (data not shown), none of them having the appropriate molecular weight of osteocalcin (5.8 kD). The OC antiserum did not react with 100 ng mouse OC standard after SDS-PAGE (Figure 5A) but immunoprecipitated native iodinated mouse OC (data not shown). Slot-blots with native mouse OC and denatured OC revealed that the OC antiserum failed to bind to denatured OC, whereas strong binding to native osteocalcin could be observed (Figure 5B).
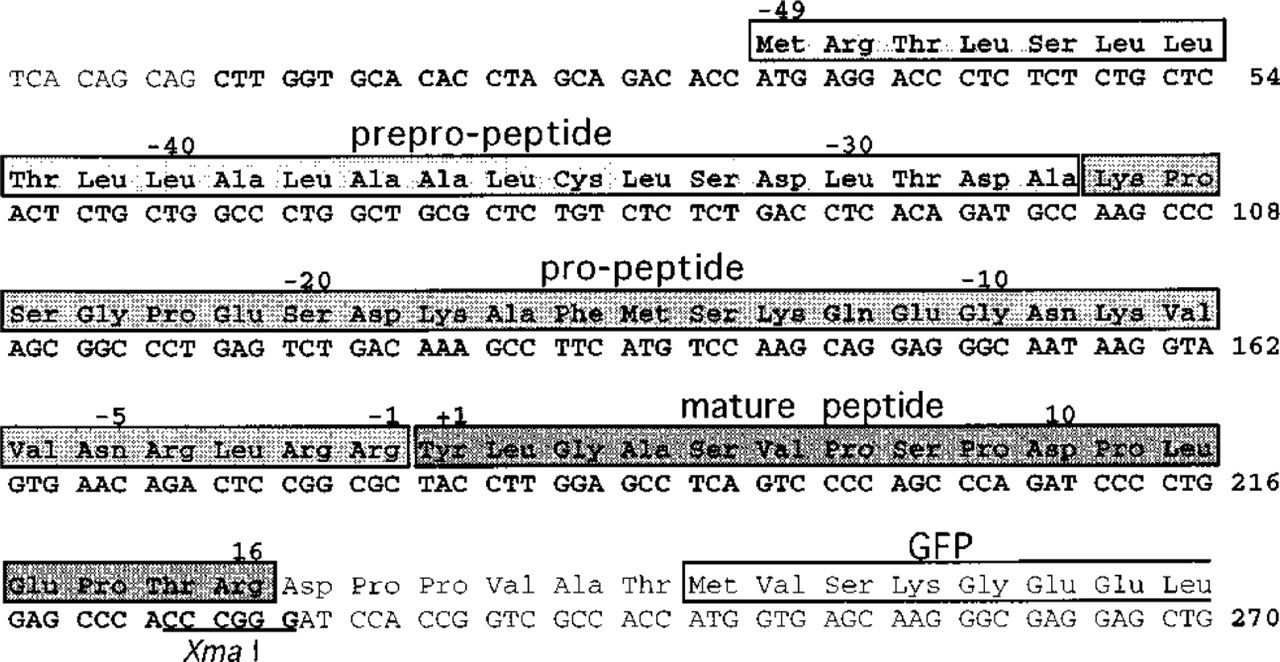
Mouse OC green fluorescent protein (GFP) fusion protein construct. The mouse OC cDNA sequence (bold letters) was fused in frame with the GFP coding sequence. The coding sequence is indicated by the derived amino acid sequence above. Numbering of the amino acids is with respect to residue 1 being the amino terminus of the mature OC. Numbering of nucleotides is shown at right. Indicated within shaded boxes are the amino acid residues of the 49-residue OC leader peptide (prepro-, propeptide) and 16 N-terminal residues of the mature peptide. Eight N-terminal amino acid residues of the GFP are marked within an unshaded box.
Northern Blot and RIA
Expression of OC was studied at both the mRNA and the protein level in MC3T3-E1 and NIH-3T3 cells. No OC mRNA was detected in untreated or D3-treated cultures. T3 significantly increased OC mRNA levels in the osteoblastic but not in the fibroblastic cells (Figure 6).
Measurement of the OC protein by RIA in the cell culture media exactly reflected the mRNA data (Table 1).
Transfection Experiments with OC GFP
By recombinant DNA techniques, we generated an OC GFP fusion protein. This fusion protein consisted of the OC prepropeptide and propeptide with specific recognition sites for signal peptidases and maturases in the secretory transport process (Figure 7). The correct recombination of the OC GFP was confirmed by sequencing and its expression at the mRNA level was proved by Northern blotting. The expression of the construct was not influenced by D3 or T3 treatment. The “functional integrity” of the fusion protein at the secretory pathway was demonstrated by incubating transiently transfected MC3T3-E1 cells for 1 or 2 hr at 15C. This arrest of protein transport due to low temperature resulted in strong perinuclear staining (Figure 8A). Release of the transport block led to a vesicular staining pattern (Figures 8B and 8C) and the complete disappearance of fluorescent OC GFP from the cells after appropriate incubation at 37C. Transfection of the pEGFP-N1 vector into MC3T3-E1 cells without the prepropeptide of OC resulted in uniform expression of GFP in the cytoplasm and nuclei (Figure 8D).
Different doses of T3 and D3 were used to study possible inhibitory effects on OC GFP transport and secretion. None of the hormones altered transport of OC GFP in comparison to untreated controls; 99.8% of the investigated cells did not show any accumulation of OC GFP in the Golgi complex (Figures 8E and 8F).
Discussion
Osteocalcin expression is a characteristic of the mature osteoblast phenotype (Stein et al. 1990; Weinreb et al. 1990). In the mouse osteoblast-like cell line MC3T3-E1, OC expression is progressively upregulated over culture time (Choi et al. 1996). Both D3 and T3 influence osteoblastic differentiation and therefore also regulate OC expression (Mahonen et al. 1990; Pirskanen et al. 1991; Ohishi et al. 1994; Pockwinse et al. 1995; Van Leeuwen et al. 1996; Varga et al. 1997). We initiated this study to investigate immunohistochemically the effects of D3 and T3 on localization and distribution of OC in MC3T3-E1 cells at different levels of phenotypic differentiation.
Treatment with D3 and T3 resulted in a highly significant increase in the percentage of immunopositive MC3T3-E1 cells that showed strong perinuclear staining. A comparable localization of OC has been shown previously (Malaval et al. 1994; Bos et al. 1996; Varga et al. 1997) and appeared consistent with an accumulation of the antigen at the Golgi region. In this study we show that between Day 3 and Day 8 the percentage of OC-positive cells remained constant. These immunohistochemical results were contradictory to the mRNA and RIA data, which demonstrated strong induction of OC expression only with T3 and not with D3. While this work was in progress, Zhang et al. (1997) reported that expression of OC in the mouse, unlike in rat and human, is downregulated by D3. This was also confirmed in MC3T3-E1 cells (Lian et al. 1997). These findings support our suggestion that in mouse osteoblasts T3 acts as an inducer of OC expression (Varga et al. 1997).
At this point we speculated that the contradiction of apparent immunolocalization of intracellular OC in the absence of detectable mRNA or protein secretion after treatment with D3 might be based on transport-inhibitory phenomena. To test this possibility, we initiated experiments with GFP (Prasher et al. 1992), which is a fluorescent genetic tag that can be used as an excellent marker for monitoring fusion proteins in the cytosol (Kaether and Gerdes 1995; Gerdes and Kaether 1996).
Transport of OC GFP fusion protein along the secretory pathway in MC3T3-E1 cells. (
We established an OC GFP fusion vector and transiently transfected this fusion vector into MC3T3-E1 cells treated with or without D3 and T3. To demonstrate its functional integrity, the fusion protein was visualized along the secretory pathway by exposing the cells to low temperature (15C), which resulted in a simple and reversible arrest of intracellular protein transport at the Golgi level (Kaether and Gerdes 1995). In contrast to the arrest of transport caused by temperature block, treatment with D3 and T3 did not lead to accumulation of fluorescent OC GFP at the Golgi compartment. We therefore conclude that in control and in treated MC3T3-E1 cells OC GFP is rapidly transported and secreted into the culture medium, a process that also occurred after release of the temperature block.
The discrepancies between OC immunohistochemistry and the mRNA and RIA data, as well as the OC GFP transfection results found in MC3T3-E1 cells, suggest that the OC antiserum reacts with one or more immunogenic epitopes that are not solely specific to OC. Therefore, we tested it in nonosteogenic cells, i.e., NIH-3T3 mouse fibroblasts and I34 mouse mammary carcinoma cells. Unexpectedly, we found positive immunostaining identical to that of the osteoblastic cells. However, we did not detect OC mRNA or OC protein (RIA) in NIH-3T3 fibroblasts, a result that is in agreement with earlier reports showing the inability of skin fibroblasts to synthesize OC (Lian et al. 1989; Bradbeer et al. 1994). High OC expression is generally accepted to be present solely in osteoblasts of the mature phenotype. In our MC3T3-E1 cell cultures we find significant amounts of OC expression at the mRNA and protein level after treatment with T3 only when cells had reached confluency (Varga et al. 1997). In contrast, in this study the percentage of immunopositive MC3T3-E1 cells remained constant from the early (single cells on Day 1) to the late (confluent cells on Day 8) cultures. This means that the number of positive cells was influenced only by the treatments but not by the culture time or the development of cell–cell or cell–matrix contacts.
Some evidence exists in the literature that OC anti-sera may recognize epitopes on proteins other than OC (Lian and Canalis 1986; Mahonen et al. 1990; Bradbeer et al. 1994). In agreement with these authors, we believe that the OC antiserum used in our study cross-reacts with a protein(s) that shares epitopes in common with OC, an assumption that is supported by the preabsorption experiments with purified OC. Moreover, by use of an OC GFP fusion vector we found that it is unlikely that large quantities of OC are accumulated at intracellular compartments. Instead, endogenous OC appears to be rapidly transported and secreted into the culture medium, as expected for a secretory protein that is mainly deposited into the bone matrix (Hauschka et al. 1975; Price et al. 1976). Therefore, our data indicate that the strong perinuclear OC immunostaining at least partially represents peptide epitopes related to but not identical to OC. The functional importance of such protein(s), which according to our data are influenced by D3 and T3 treatment, remains to be established.
Footnotes
Acknowledgement
We thank Prof Dr M.P.M. Erlee for critical reading of the manuscript.