
Abstract
Pearson's marrow/pancreas syndrome is a disease associated with a large mitochondrial DNA (mtDNA) deletion. The various tissues of a patient contain heteroplasmic populations of wild-type (WT) and deleted mtDNA molecules. The clinical phenotype of Pearson's syndrome is variable and is not correlated with the size and position of the deletion. The histo- and cytological distribution of WT and deleted mtDNA molecules may be factors that correlate with the phenotypical expression of the disease. Here we introduce a new application of two-color FISH to visualize WT and deleted mtDNA simultaneously in a cell population of in vitro cultured skin fibroblasts of two patients with Pearson's syndrome. At the third passage of culturing, fibroblasts showed a remarkable heterogeneity of WT and deleted mtDNA: about 90% of the cells contained almost 100% WT mtDNA, and 10% of the cells contained predominantly deleted mtDNA. At the tenth passage of culturing, fibroblasts showed a reduction of intercellular heteroplasmy from 10% to 1%, while intracellular heteroplasmy was maintained. This new approach enables detailed analysis of distribution patterns of WT and deleted mtDNA molecules at the inter- and intracellular levels in clinical samples, and may contribute to a better understanding of genotype-phenotype relationships in patients with mitochondrial diseases.
Keywords
A
Spontaneous or maternally inherited mutations lead to a mixed population of normal and mutant mtDNA molecules, a phenomenon generally called heteroplasmy. However, one can operationally define heteroplasmy at different histological and cytological levels. The most basic level of heteroplasmy can be defined for a single mitochondrion. One mitochondrion contains multiple copies of mtDNA. Therefore, various ratios of mutant–wild type mtDNA molecules can be present within one mitochondrion. This heteroplasmy at the organelle level is referred to as intramitochondrial heteroplasmy. These heteroplasmic mitochondria create in one cell a heteroplasmic situation at the cellular level, i.e., intracellular heteroplasmy. Intracellular heteroplasmy, in turn, leads to heteroplasmy at the cell population or tissue level, a situation referred to as intercellular heteroplasmy.
Pathogenic deletions of the mitochondrial genome are variable in size and are almost always confined to a region delineated by the H-strand and L-strand origins of replication. The most common deletion, found in 30–50% of patients, is flanked by two 13-
Pearson's marrow/pancreas syndrome is a disease associated with a large-scale deletion of the mitochondrial genome (Rötig et al., 1995). In this study we analyzed cultured skin fibroblasts of two Pearson's syndrome patients by two-color FISH and analyzed the intracellular and intercellular heteroplasmy during early and late passages of fibroblast culture. The results show the feasibility of the technique in determining the distribution of deleted mtDNA at the inter-and intracellular levels and illustrate its potential for studying the diversity of clinical phenotypes of mitochondrial DNA deletion syndromes in relation to intra- and intercellular heteroplasmy.
Materials and Methods
Cell Culture
Skin biopsy specimens were taken from two patients diagnosed as having Pearson's marrow/pancreas syndrome. For FISH, patient skin fibroblasts and control (HeLa) fibroblasts were grown on sterilized, uncoated glass microscope slides in Dulbecco's modified Eagle's medium without phenol red, containing 4.5 mg/ml glucose and 110 μg/ml pyruvate (DMEM) supplemented with 10% fetal calf serum (FCS), 0.03% glutamine, 1000 U/ml penicillin/streptomycin in a 5% CO2 atmosphere. After 24–36 hr of culture, cells were washed with PBS and fixed in 4% formaldehyde, 5% acetic acid in PBS for 20 min, followed by three 5-min washes with PBS. Fixed cells were stored in 70% ethanol at 4°C until further use (Dirks et al., 1993). Only samples from the third passage (1-month culturing time) and the tenth passage (2-month culturing time) were available for FISH analysis.
Probes
The position of the mtDNA deletions in both patients was determined by PCR and Southern blot analysis (De Vries et al., 1992; and ‘t Hart et al., manuscript in preparation). The mtDNA of Patient 1 contained a deletion of 8034
All PCR fragments were separated from primers by gel electrophoresis on a 1% agarose gel and purified using an agarose gel extraction kit (Boehringer Mannheim; Mannheim, Germany) according to manufacturer's instructions. After purification, the four PCR fragments were labeled with digoxigenin-11-dUTP (Boehringer Mannheim) or biotin-11-dUTP (Sigma; St Louis, MO) by nick translation according to standard procedures. After nick translation the PCR probes were ethanol-precipitated and dissolved at a final concentration of 10 ng/μl in 60% deionized formamide, 2 X SSC, 50 mM sodium phosphate buffer, pH 7.0, 10% dextran sulfate and 250 ng/μl herring sperm DNA.
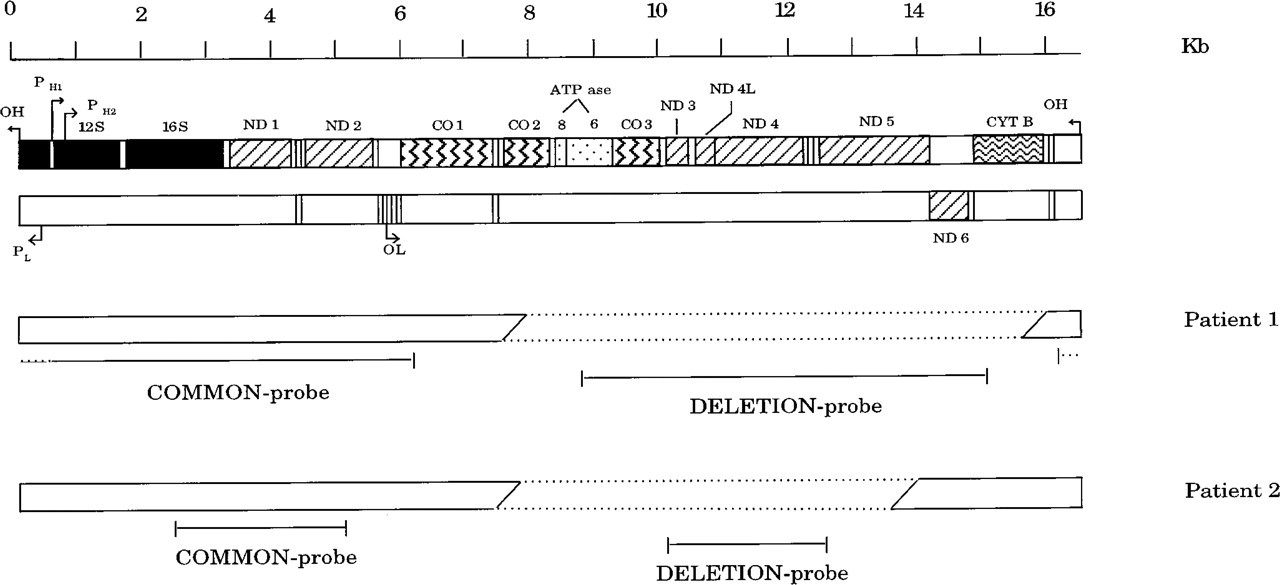
Linearized map of the total mitochondrial genome, showing the position of the deletions and the location of the common and deletion probe sequences of both patients that were used for fluorescence in situ hybridization (FISH). Maps just below the scale represent the heavy (upper map) and the light (lower map) strands, showing the genes for the subunits of NADH-coenzyme Q reductase (ND), sub-units of cytochrome-c oxidase (CO), and ATP synthase (ATP ase), for cytochrome-b (CYT B), and for the 12S and 16S ribosomal RNAs. The tRNA genes are represented by small open boxes. Arrows indicate the origins of the heavy-strand (OH) and light-strand (OL) replication and the promoters for initiation of heavy-strand (PH1 and PH2) and light-strand (PL) transcription. The mtDNA of both patients is represented by a bar in which the deleted fragment is defined by dashed lines. The mtDNA of Patient 1 contains a deletion of 8034 BP stretching from nucleotide position (
In Situ Hybridization
The in situ hybridization was performed as previously described (Dirks et al., 1993). Fixed cells, stored in 70% ethanol, were rehydrated, rinsed in distilled water, and pretreated for 1.5 min with 0.1% (w/v) pepsin (Sigma), pH 2.0, at 37°C. After pepsin treatment, the cells were rinsed three times in PBS. RNAse control slides were incubated for 1 hr at 37°C with RNAse A (0.1 mg/ml in PBS) and DNAse control slides were incubated for 1 hr at 37°C with RNAse-free DNAse I (0.1 mg/ml). After the enzyme treatments, the cells were washed twice for 5 min in PBS, dehydrated in 70, 90, 100% ethanol, and air-dried. A mixture of biotinylated COMMON and digoxygeninylated DEL probes (each with a final concentration of 5 ng/μl) was applied to the slide and covered with an 18 × 18-mm glass coverslip. Targets and probes were denatured simultaneously for 2.5 min on a hotplate at 80°C. Hybridization was performed overnight in a moist chamber containing 60% formamide in 2 X SSC at 37°C. After hybridization, slides were rinsed for 5 min in 2 X SSC at room temperature to remove the coverslips, three times for 10 min in 2 X SSC at 45°C, and three times for 5 min in TBS (100 mM Tris-HCl, pH 7.5, 150 mM NaCl) containing 0.05% Tween-20 (TNT). For simultaneous detection of digoxigenin- and biotin-labeled probes, cells were incubated for 45 min at 37°C with mouse anti-digoxigenin-FITC 1:250 (Sigma) and avidin D-Cy3 1:2000 (Jackson ImmunoResearch Labs; West Grove, PA) diluted in TBS containing 0.05% (w/v) blocking reagent (Boehringer Mannheim). Then, cells were rinsed three times for 5 min in TNT, dehydrated, air-dried, and embedded in Vectashield (Vector Labs; Burlingame, CA).
Microscopy and Photography
Slides were examined with a Leica DM microscope equipped with single and dual bandpass filters for FITC and Cy3 and with X63 and X100 oil objectives with 1.3 numerical aperture. Photographs were taken with automatic exposure time settings using Scotch 3M 640 ASA color slide films.
Results
FISH analysis of control fibroblasts revealed a typical mitochondrial staining pattern. When the cells were hybridized with probes for the undeleted region of the mitochondrial genome (further referred to as COMMON 1 and 2), specific fluorescent signals appeared as large, ragged spots lying in a ribbon-like pattern throughout the cytoplasmic volume. Such fluorescent patterns were more abundant around the nucleus, but the ragged distribution could be observed best in the fiber-like extensions of the cells, because there signals from individual mitochondria were not overlapping. When the cells were treated with RNAse the fluorescent pattern remained identical, but the fluorescence intensity was profoundly reduced because of RNA degradation. DNAse treatment resulted in hardly detectable loss of fluorescence.
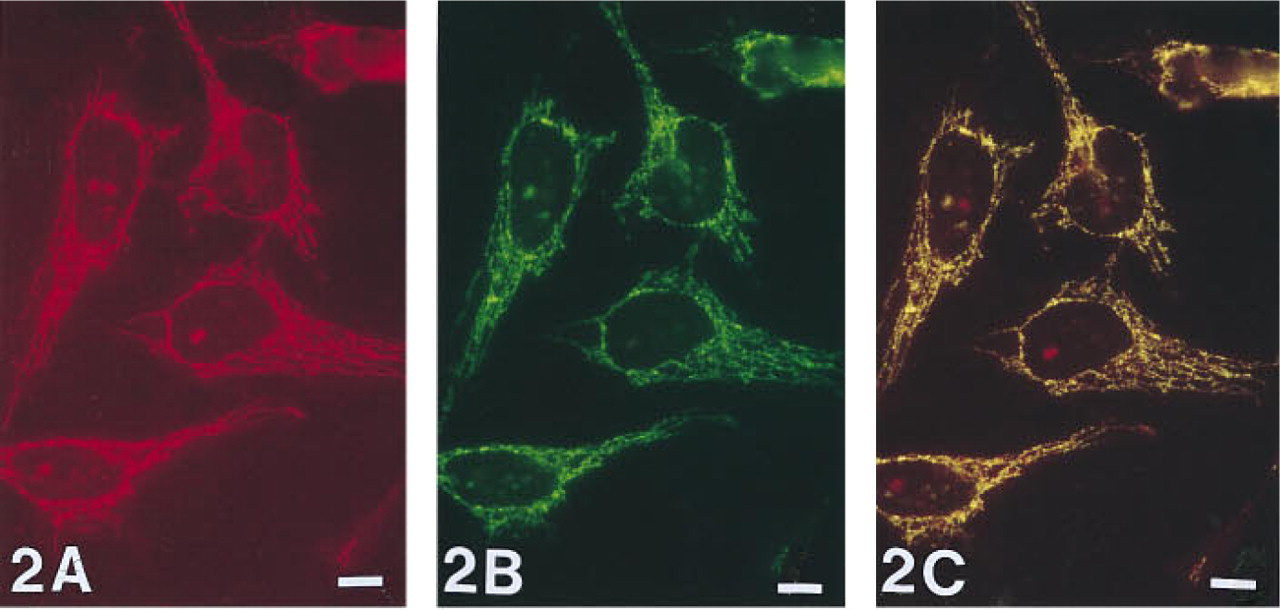
HeLa (cervical carcinoma fibroblast cell line) cells simultaneously hybridized with COMMON 1 and DEL 1 probes. Single excitation of the COMMON 1 probe, visualized with Cy3, shows red fluorescent signals lying in a ribbon-like pattern in the cytoplasm (
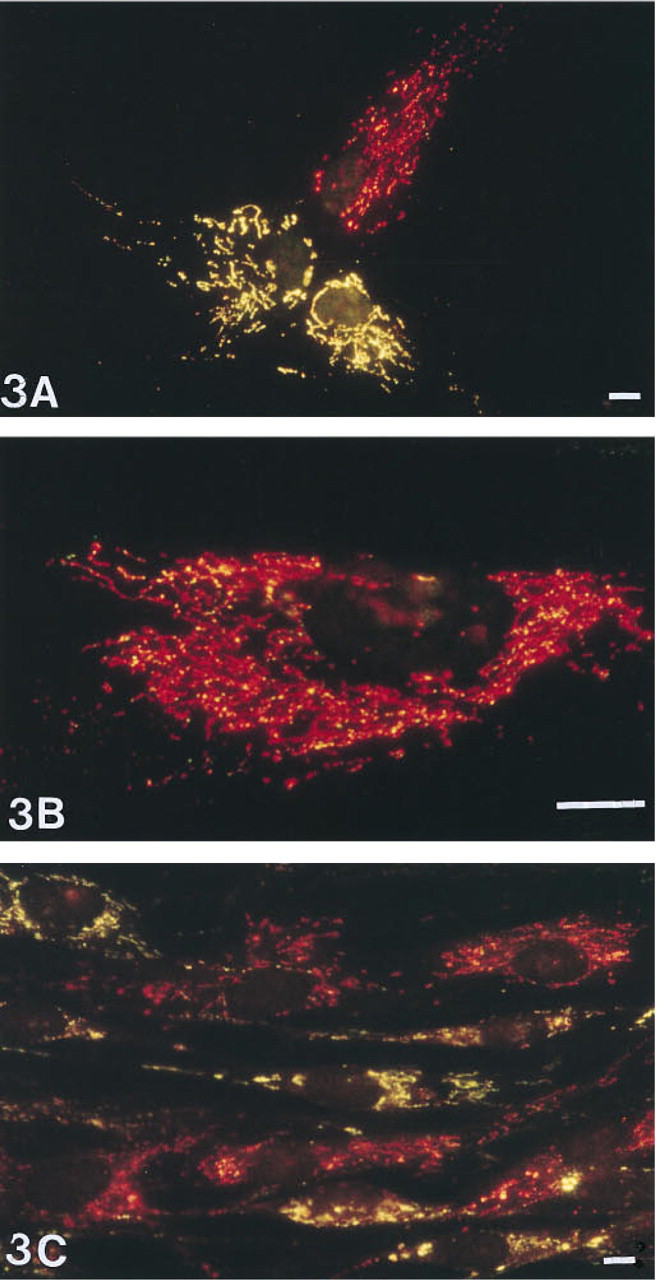
Third passage skin fibroblasts derived from Patient 1 hybridized with both COMMON 1 probe (red fluorescence) and DEL 1 probe (green fluorescence). Specific fluorescent signal appears as spots lying in a ribbon-like pattern throughout the cytoplasm and aggregating around the nucleus. Double excitation of FITC and Cy3 results in yellow fluorescent staining at the location of both probes (
Double hybridizations to control fibroblasts with COMMON 1 and a probe for the deleted region of the mitochondrial genome of Patient 1 (further referred to as DEL 1) or with COMMON 2 and a probe for the deleted region of the mtDNA of Patient 2 (further referred to as DEL 2) resulted in the same mitochondrial staining pattern. In all cells, the COMMON probe signals visualized in red fluorescence (Figure 2A) and the DEL probe signals detected with a green fluorochrome (Figure 2B) co-localized, resulting in a yellow fluorescent staining pattern (Figure 2C).
Simultaneous visualization of the COMMON 1 and DEL 1 probes on third-passage fibroblasts of Patient 1 showed, in most of the cells, the same yellow fluorescent pattern as was observed with the control cells (Figure 3A). However, a clear intercellular heteroplasmy was observed in this cell population. About 10% of the cells showed an intense red staining pattern of the COMMON 1 probe (Figures 3A and 3B). Among these red fluorescent signals a small amount of green fluorescent hybridization signals of the DEL 1 probe was clearly present (Figure 3B), indicating the presence of some wild-type mtDNA in these cells. Cells of the tenth passage showed a reduction in the degree of intercellular heteroplasmy from 10% to 1%, whereas the degree of intracellular heteroplasmy was maintained. The cells containing deleted mtDNA appeared in clusters, indicating that these cells still have mitotic activity (Figure 3C) (see also Table 1).
Essentially the same observations were made with the skin fibroblast cultures from Patient 2: a 10% intercellular heteroplasmy at the third passage and a reduction of intercellular heteroplasmy to 1% at the tenth passage. The intracellular heteroplasmy was less extreme compared to fibroblasts of Patient 1, but still a predominant presence of deleted mtDNA was observed. At the tenth passage this degree of intracellular heteroplasmy was maintained, as was also observed with the fibroblasts of Patient 1 (Table 1).
RNAse-treated cells of both patients showed the same reduction of fluorescent signals due to mtRNA degradation as in the control cells. The staining pattern of the mtDNA appeared as clearly defined spots lying in rows throughout the cytoplasm. The inter-and intracellular heteroplasmy was still evident. DNAse treatment did not result in a detectable loss of fluorescent intensity or of the heterogenous pattern.
Fibroblasts of both patients hybridized with digoxigenin-labeled COMMON probe, detected with fluorescein, and biotinylated DEL probe, visualized with Cy3, showed identical results to those described above, with reversed color patterns.
Discussion
The present findings show that two-color FISH permits the simultaneous detection of deleted and wild-type mtDNA in situ and is therefore well suited to assess levels of intercellular and intracellular heteroplasmy, two factors that are likely to correlate with clinical expression of Pearson's syndrome.
The degree of intercellular heteroplasmy in the third passage of the skin fibroblast cultures from the two patients available for this study was about 10%. The intracellular heteroplasmic cells contained wildtype mtDNA in addition to relative large amounts of deleted mtDNA. These wild-type mtDNAs appeared not to be structurally organized but were randomly scattered throughout the cytoplasmic volume. At the tenth passage of culturing, the intercellular heteroplasmy was reduced to 1%, whereas the degree of intracellular heteroplasmy was maintained. The cells containing predominantly deleted mtDNA were clustered (Figure 3C), indicating that these cells, in spite of high amounts of deleted cytoplasmic mtDNA molecules, still have mitotic activity (Wallace, 1989).
Distribution of wild-type and deleted mtDNA in samples from two patients with Pearson's syndrome a
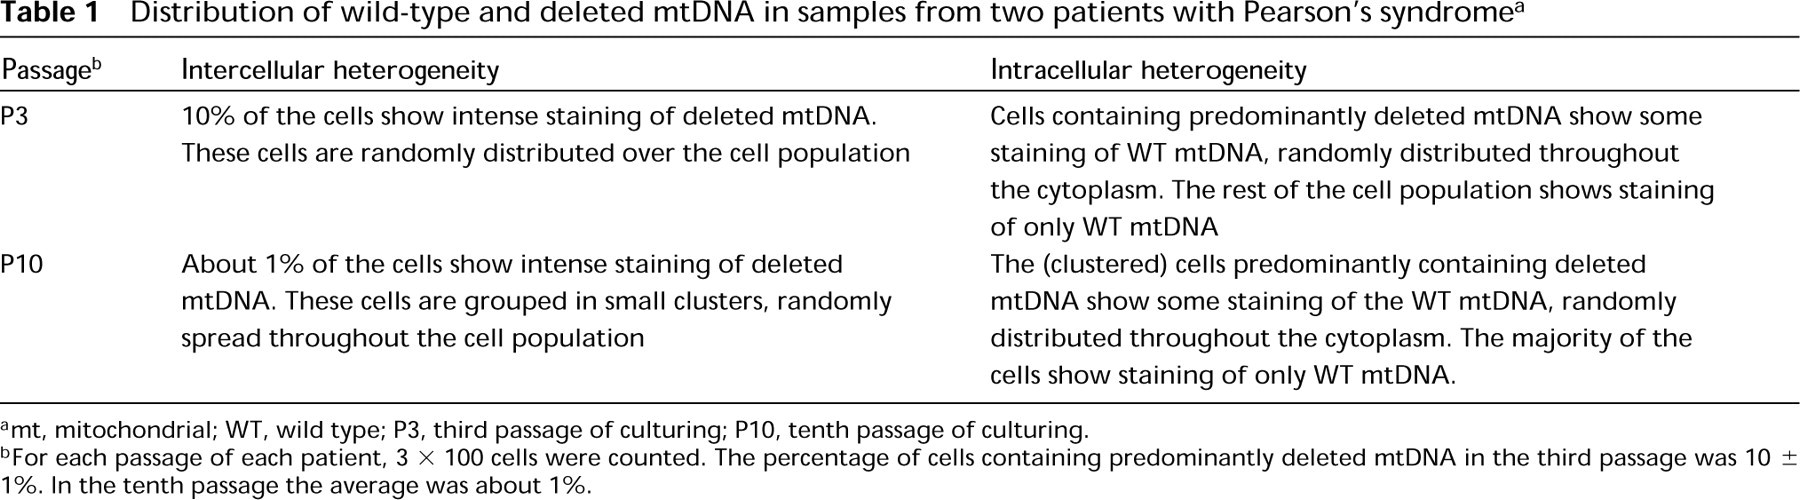
amt, mitochondrial; WT, wild type; P3, third passage of culturing; P10, tenth passage of culturing.
bFor each passage of each patient, 3 × 100 cells were counted. The percentage of cells containing predominantly deleted mtDNA in the third passage was 10 ± 1%. In the tenth passage the average was about 1%.
RNAse treatments resulted in considerable reduction of fluorescent signals. However, both inter- and intracellular heteroplasmy were still present, indicating that the deleted mtDNA is transcriptionally active, as has also been observed by in situ hybridization in muscle fibers of muscle biopsies of patients with mitochondrial myopathy (De Vries et al., 1992; Oldfors et al., 1992; Shoubridge et al., 1990; Mita et al., 1989). Sequence analysis of the deleted mtDNA of the two patients showed that both patients had a deletion in the region that encodes for subunits of cytochrome oxidase complex III, NADH 3, 4, and 5, cytochrome oxidoreductase b, and several tRNAs (De Vries et al., 1992; and ‘t Hart et al., manuscript in preparation). Because of deficient oxidative phosphorylation, the deleted mtDNA-containing cells have a growth disadvantage compared to wild-type cells (Wallace, 1989). This may explain the reduction in the degree of intercellular heteroplasmy from 10% in the third passage to 1% in the tenth passage (Hilton et al., 1994; Bourgeron et al., 1993). This in vitro reduction of the intercellular heteroplasmy is probably comparable to the in vivo situation for tissues that are mitotically active.
In both patients the deletion had left the replication initiation sites intact. Because of their shorter sequences, the deleted mtDNA molecules are likely to have a replicative advantage over wild-type mtDNA molecules (Wallace, 1994). Terminally differentiated skin fibroblasts (fibrocytes) have little or no proliferative activity. Therefore, the relatively high ratios of deleted mtDNA over wild type mtDNA in the heteroplasmic cells may be explained by the replicative advantage experienced by deleted mtDNA in the in vivo situation. In postmitotic tissues such as muscle fibers and neuronal tissues, accumulation of deleted mtDNA due to a replicative advantage has also been frequently observed (Sciacco et al., 1994; Cortopassi et al., 1992; Wallace, 1989; Johnson et al., 1988). To determine the distribution of deleted mtDNA over the cell population, we are presently investigating the possibilities for quantifying fluorescent signals obtained by two-color FISH. By determining the fluorescent ratio of deleted mtDNA signals over wild-type mtDNA signals, a more accurate view of the distribution of both types of mtDNA over the cell populations can be obtained.
In conclusion, two-color FISH is well suited to assess levels of intercellular and intracellular heteroplasmy in the mitochondrial large-deletion syndromes. Such studies may contribute to a better understanding of the variable clinical expression of Pearson's syndrome. In addition, the technique will be valuable for quantitatively addressing basic questions such as mitotic segregation of mutant mtDNA and drift in inter-and intracellular heteroplasmy.
Footnotes
Acknowledgements
Supported by the Dutch Science Organization, Area Medical Sciences (MW-NWO) project no. 900–543-109, and by a grant from Diabetes Fonds Nederland.
We wish to thank Dr H. Smeets of Nijmegen University Hospital for providing fibroblast cell cultures of Patient 2.