
Abstract
Glutamate and aspartate play important roles in the intermediary metabolism of the myocardium and have been shown to improve cardiac recovery after hypoxia or ischemia. Limited data are available about the expression of glutamate transporters that are involved in the uptake of glutamate and aspartate in cardiomyocytes. In this study, non-radioactive in situ hybridization (ISH) using complementary RNA probes was applied to detect the glutamate transporters GLT1 variant (GLT1v) and EAAC1 mRNA in rat cardiomyocytes. The transporter proteins were demonstrated by Western blotting and immunocytochemistry using affinity-purified antibodies against transporter peptides. ISH and immunocytochemistry showed that both glutamate transporters are coexpressed in cardiomyocytes. The ISH labeling indicates the distribution of transporter mRNA throughout the cytoplasm of cardiomyocytes. GLT1v and EAAC1 proteins, which showed in Western blots a molecular mass of ~60 kD, are strongly enriched and colocalized in the transverse (T)-tubular system of cardiomyocytes. These results may indicate that glutamate/aspartate uptake into cardiomyocytes could be mediated by the high-affinity transporters GLT1v and EAAC1. A high efficiency of glutamate/aspartate transport into cardiomyocytes could be achieved by their localization in the T-tubular system, which consists of tubular invaginations of the sarcolemma extending deep into the cell.
T
The concentrations of glutamate and aspartate in cardiomyocytes are ~50- to 100-fold greater than the concentrations found in the cardiac circulation (Suleiman and Chapman 1993; Dinkelborg et al. 1995; Suleiman et al. 1997). The cellular uptake of glutamate and aspartate may be enabled by glutamate transporters localized in the sarcolemma of cardiomyocytes. It is known that the mRNA for the glutamate transporters EAAC1 (detected by Northern blotting analysis; Kanai and Hediger 1992) and GLT1 variant (GLT1v, detected by RT-PCR; Schmitt et al. 2002) are present in the heart. Furthermore, glutamate (Dinkelborg et al. 1995,1996) and aspartate transport rates have been characterized and EAAC1 protein was detected in sarcolemmal vesicles in isolated cells from rat heart (King et al. 2001). However, no studies are available about the cellular expression of glutamate transporters in the heart.
In this study, I used a highly sensitive method that provides clear cellular resolution, i.e., non-radioactive in situ hybridization (ISH) using cRNA probes (Kugler and Schmitt 1999; Schmitt et al. 2002) to detect GLT1v and EAAC1 in rat heart. The distributions of GLT1v and EAAC1 proteins were detected by immunocytochemistry applying affinity-purified polyclonal antibodies against synthetic C-terminal transporter peptides to semithin plastic sections of myocardium (Kugler and Schmitt 1999; Schmitt et al. 2002). For confirmation of transporter protein detection in the heart I used Western blotting.
Materials and Methods
Tissue Sources
Twenty adult male Wistar rats, purchased from Winkelmann Versuchstierzucht (Borchen, Germany) were used. Under ether anesthesia, the hearts were quickly removed and further processed for ISH, Western blotting, and immunocytochemistry as described below. The animal care procedures were approved by the institutional animal care committee.
In Situ Hybridization
The hearts removed were frozen in liquid nitrogen-cooled propane. Twelve-μm-thick sections were cut in a cryostat (–20C; Frigocut 2800 E, Reichert-Jung, Nussloch, Germany). The sections were mounted on precoated glass slides (Superfrost Plus; Menzel, Braunschweig, Germany) and thawed. The sections were fixed for 5 min in freshly prepared 4% formaldehyde in 0.1 M PBS, pH 7.4. The fixed sections were transferred to absolute ethanol and stored at 4C for 1–2 days and then processed for ISH.
The ISH procedure used was previously described in more detail (Kugler and Schmitt 1999). Briefly, the sections were removed from ethanol, rehydrated in a graded series of ethanol, transferred to 2 × standard saline citrate (SSC), and treated with 0.05 N HCl for 30 min. After washing with 2 × SSC, the sections were incubated with freshly prepared 0.25% acidic anhydride, washed again with 2 × SSC, and covered with the hybridization solution containing the digoxigenin (DIG)-labeled antisense (sense) cRNA probe (final concentration 8–9 ng/μl) and 550 μg/ml salmon testis DNA (Sigma; Deisenhofen, Germany) in 4 × SSC, 1 × Denhardt's solution (Sambrook et al. 1989), 10% dextran sulfate, and 50% deionized formamide at 60C for 16–18 hr. Posthybridization washes were done stepwise at room temperature with 2 × SSC, 1 × SSC, 50% formamide, and then again with 2 × SSC. Next, the sections were treated with 40 μg/ml RNase A (50 Kunitz U/mg; Boehringer, Mannheim, Germany) in a solution containing 500 mM NaCl, 10 mM Tris-HCl (pH 8), and 1 mM EDTA at 37C for 30 min to remove unhybridized single-strand RNAs. After this treatment, the sections were incubated with the same buffer without RNase A at 60C for 30 min.
The sections were then rinsed in Tris-buffered saline (TBS; 100 mM Tris and 150 mM NaCl, pH 7.5) for 5 min, incubated with TBS containing 0.5% blocking reagent (DIG Nucleic Acid Detection Kit; Boehringer) for 30 min, followed by 0.3% Triton X-100 in TBS for 20 min. After incubation with 1.5 U/ml sheep anti-DIG-aP (alkaline phosphatase) conjugated (Boehringer) in TBS containing 0.3% Triton X-100 for 60 min, the sections were washed in TBS and transferred to a 0.1 M Tris buffer (pH 9.5) containing 100 mM NaCl and 50 mM MgCl2 for 2 min before the aP visualization (see below).
The DIG-labeled antisense (sense) cRNA probes used were generated exactly as described previously (Kugler and Schmitt 1999; Schmitt et al. 2002). The probes were complementary to nucleotide (nt) 1654–2043 of the GLT1v sequence (GLT1v cRNA; Schmitt et al. 2002) and to nt 247–1706 of the EAAC1 sequence (EAAC1 cRNA; Kugler and Schmitt 1999).
The procedure used for detection of aP was described recently (Asan and Kugler 1995). The incubation medium contained 0.4 mM 5-bromo-4-chloro-3-indolylphosphate (BCIP; Boehringer), 100 mM NaCl, 50 mM MgCl2, 0.4 mM tetranitroblue tetrazoliumchloride (Serva; Heidelberg, Germany) in 100 mM Tris-HCl buffer at pH 9.5.
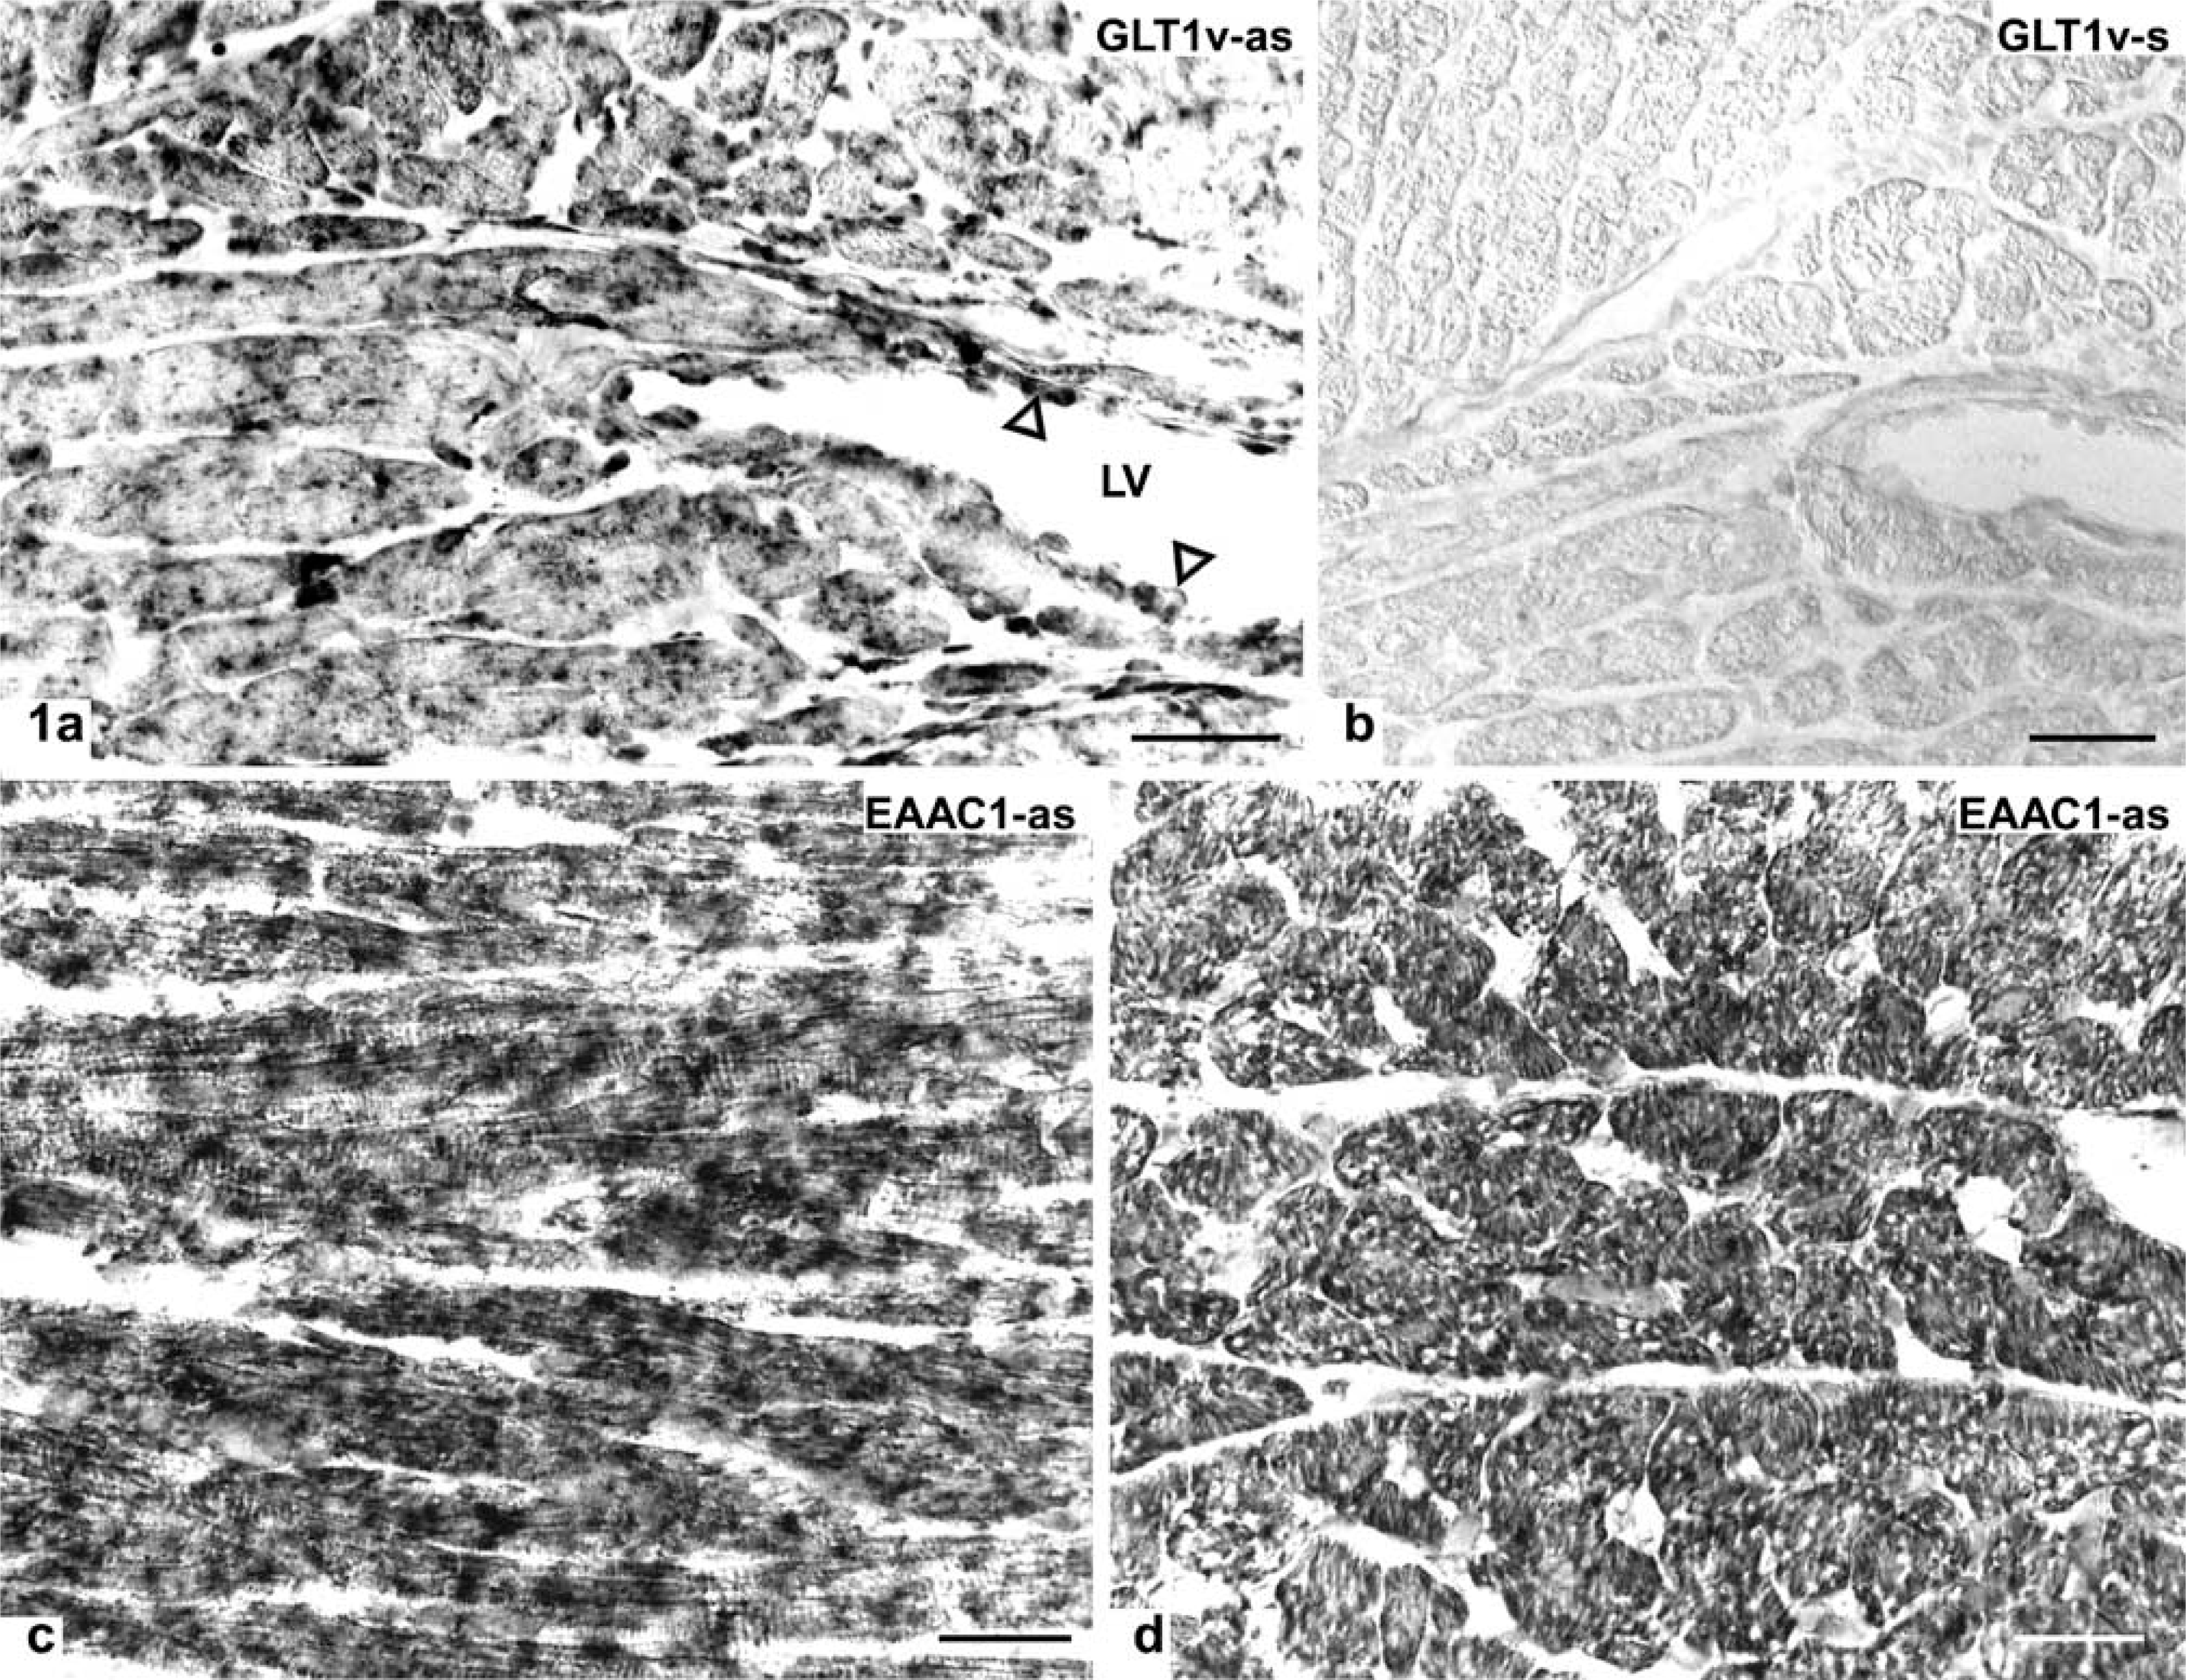
For a control, substitution of the antisense cRNA probe by an equivalent amount of labeled sense cRNA probe led to a complete lack of staining (Figure 1b). Omission of labeled cRNA probes from the respective hybridization mixtures resulted in completely unstained sections.
Antibodies
Affinity-purified polyclonal (rabbit) peptide antibodies against the glutamate transporters were used. These antibodies were characterized elsewhere: anti-GLT1v antibody (against a peptide corresponding to amino acid residues 522–541; Schmitt et al. 2002) and anti-EAAC1 antibody (against a peptide corresponding to amino acid residues 480–499; Kugler and Schmitt 1999). In addition, a polyclonal (mouse) peptide antibody against GLT1v (same peptide as described above) was generated and affinity purified as described in detail by Drenckhahn et al. (1993). A mouse monoclonal antibody (MAb) against type IV collagen (MAB 1910, clone 2311C3) was purchased from Chemicon International (Hofheim, Germany). Immunolabeling with this antibody was performed to detect transverse (T)-tubules that contain basal lamina proteins such as type IV collagen (Vracko et al. 1988). As an additional marker protein for T-tubules, the Na+/Ca2+ exchanger (NCX) was detected (Frank et al. 1992; Thomas et al. 2003) using a mouse MAb (code no. R3F1; Swant, Bellinzona, Switzerland).
Immunoblotting
For immunoblotting, the hearts and whole brains (for a positive control) removed were homogenized at 4C in 10 mM NaH2PO4 (pH 7.2) containing 2 mM MgCl2, aprotinin (5 μg/ml), leupeptin (2 μg/ml), pepstatin (2 μg/ml), and phenylmethylsulfonyl fluoride (100 μg/ml). The homogenate was centrifuged at 1000 × g for 10 min, and the resulting supernatant was centrifuged at 150,000 × g for 1 hr. The protein content of the 150,000 × g pellet was determined by the Bio-Rad protein assay (Bio-Rad; Munich, Germany) and used for immunoblotting. Proteins (60 μg per lane) were electrophoretically separated on 10% gels by SDS-PAGE. Then the proteins were transferred electrophoretically to nitrocellulose membranes (Burnette 1981). Strips of the nitrocellulose membranes were incubated for 24 hr at 4C with the affinity-purified transporter antibodies (~1.8 μg/ml). Bound immunoglobulins were visualized using peroxidase-conjugated goat anti-rabbit IgG (1:3000; Bio-Rad, Richmond, Canada; blotting grade) and the enhanced luminol chemiluminescence technique (Amersham; Braunschweig, Germany). Antibodies previously absorbed with an excess of the peptides used for immunization served as control. These immunoblots showed no labeling (Figure 2).
Distribution of GLT1v (
Immunostaining
Pieces of ventricular myocardium were frozen in liquid nitrogen-cooled propane, then freeze dried and embedded in Epoxy resin Quetol 651 (Science Services; Munich, Germany). Semithin sections (1 μm) were mounted on glass slides. The resin was removed by placing the slides for a few seconds in sodium methylate solution (Fluka; Neu-Ulm, Germany) (Mayor et al. 1961).
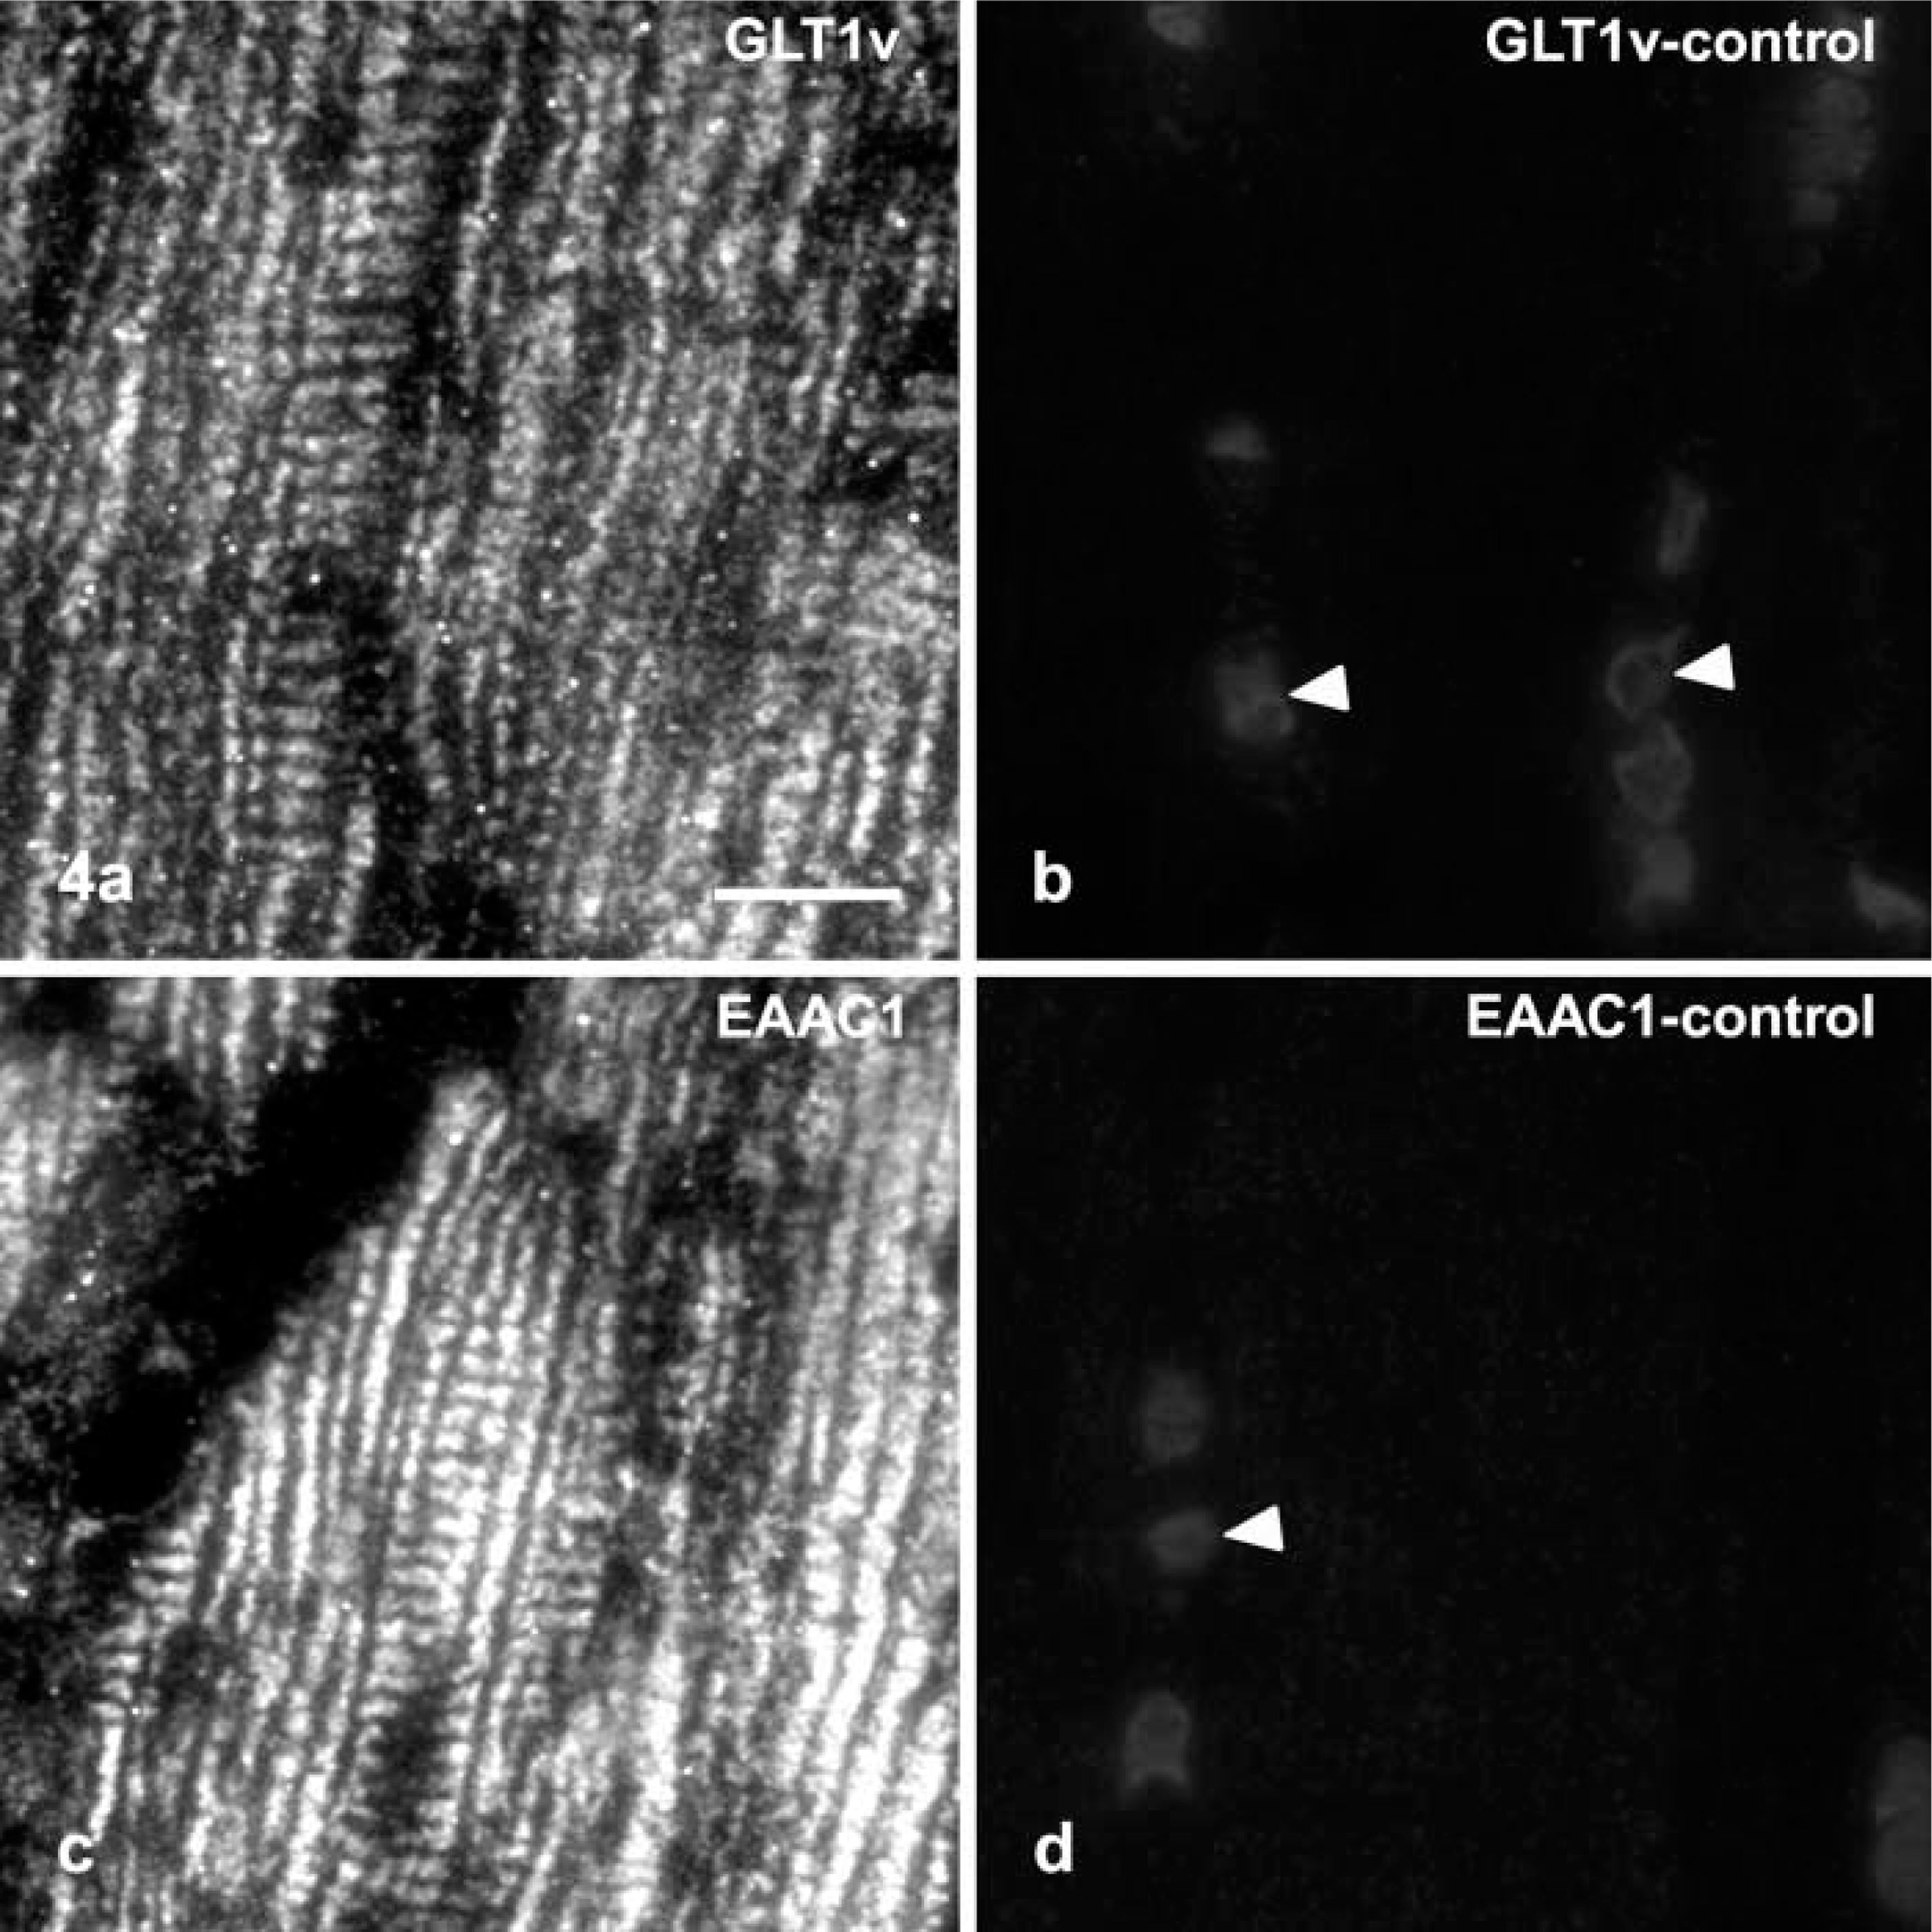
The tissue sections were preincubated for 3 hr at room temperature with 2% bovine serum albumin, 10% normal goat serum, and 0.05% Tween-20 (Ferrak; Berlin, Germany) in PBS, pH 7.4. Then the sections were incubated for 24–48 hr at 4C with the primary antibody diluted in the preincubation solution (anti-glutamate transporters 15 μg/ml; antitype IV collagen 1:50; anti-NCX 1:5 to 1:20). After several washes with PBS, the semithin plastic sections were incubated for 90 min at room temperature with indocarbocyanin (Cy3)-labeled secondary antibody (1:800; goat anti-rabbit IgG; Dianova, Hamburg, Germany) and/or with carbocyanin (Cy2)-labeled secondary antibody (1:50; goat anti-mouse IgG; Dianova). Controls were performed with primary antibody, previously absorbed with an excess of the corresponding glutamate transporter peptide used for immunization or without primary antibody. These sections were unstained (Figures 4b and 4d). The sections were examined with a Zeiss laser-scanning microscope (Zeiss LSM 510) equipped with an argon laser (488 nm) for excitation of Cy2, an HeNe laser (543 nm) for excitation of Cy3, and appropriate filter combinations for visualization of Cy2 and Cy3 emissions.
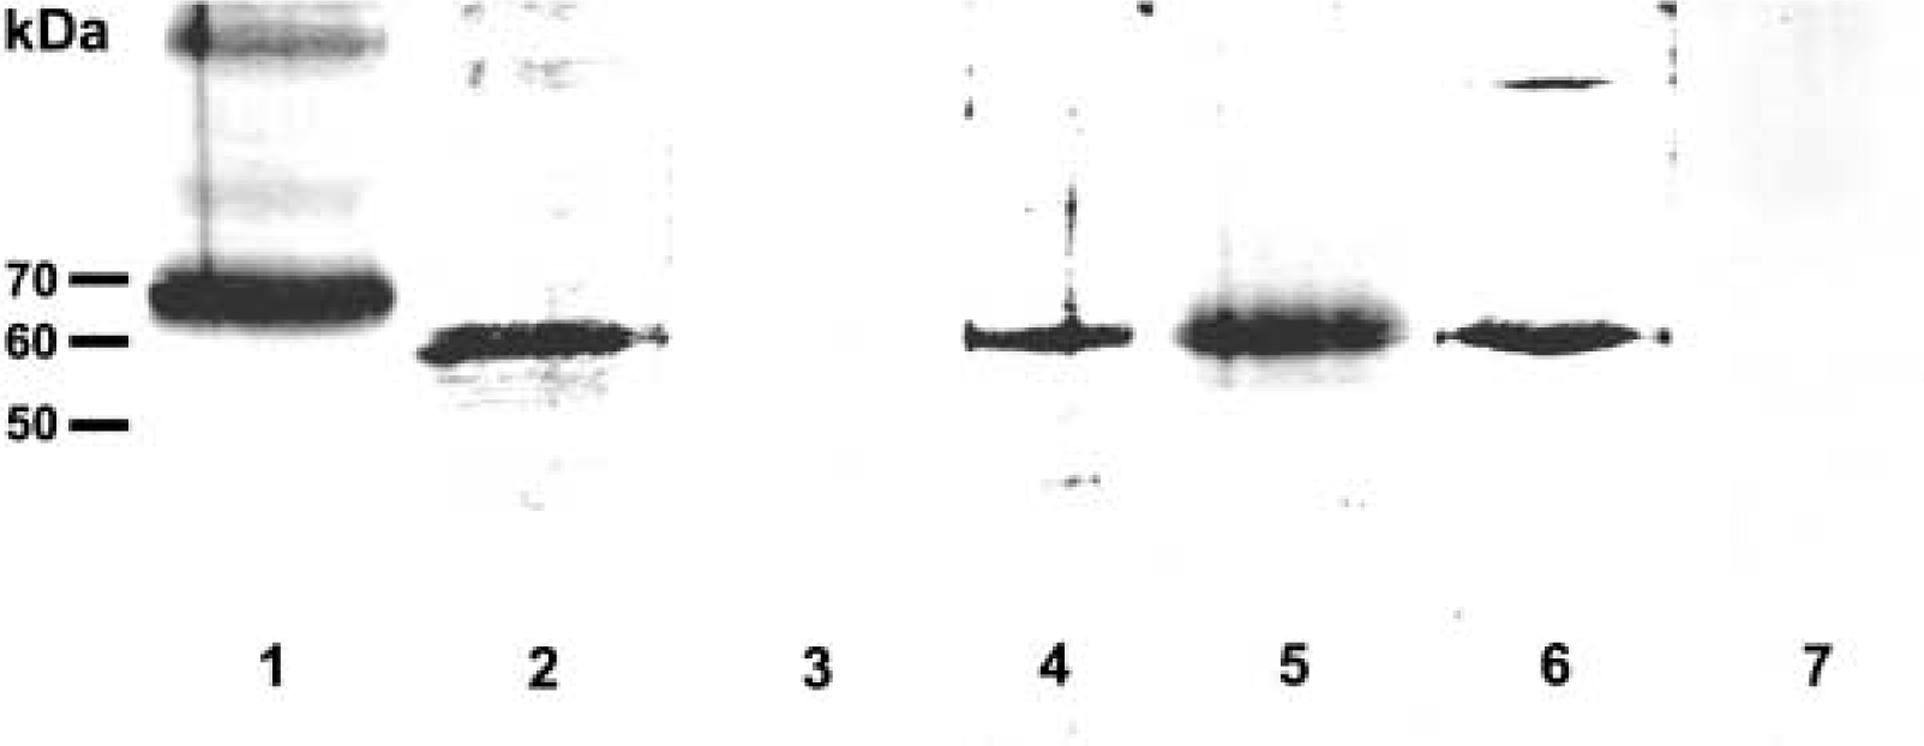
Western blot (10% SDS-PAGE) of left and right ventricular wall and brain (for a positive control) using affinity-purified antibodies against GLT1v peptide generated in rabbit (Lanes 1 and 2) and mouse (Lane 4) and against EAAC1 peptide generated in rabbit (Lanes 5 and 6). The amount of protein loaded per lane was 60 μg. In the 150,000 × g pellet, the antibodies labeled bands at ~60 kD, with the exception of brain (Lane 1), in which the GLT1v antibody labeled a band at ~70 kD. Lanes 1 and 5, brain; Lanes 2, 4, and 6, heart. Antibodies previously absorbed with an excess of GLT1v peptide (Lane 3) or EAAC1 peptide (Lane 7) served as controls.
Results
In Situ Hybridization
Application of the cRNA probes to cryostat sections of rat heart for detection of GLT1v and EAAC1 mRNAs resulted in identical patterns of cellular distribution (Figure 1). ISH reaction product was deposited throughout the cytoplasm of cardiomyocytes of left and right ventricles. The amount of granular reaction product was moderate. ISH reaction product was also detected in endothelial cells of the endocardium (Figure 1a) and in not-further-characterized cell types in the stroma between cardiomyocytes.
Western Blotting and Immunostaining
In immunoblots of the 150,000 × g pellet of heart homogenate, the affinity-purified antibodies generated in rabbit and mouse against GLT1v peptide labeled a band at ~60 kD (Figure 2), showing a somewhat higher electrophoretic mobility than in brain homogenates (Figure 2; cf. Schmitt et al. 2002). This may becaused by variant glycosylation of GLT1v in heart and brain. The affinity-purified antibody against EAAC1 peptide (from rabbit) labeled a band at ~60 kD (Figure 2), which is in accordance with previous results of immunoblotting analyses in heart (King et al. 2001) and brain (Figure 2; cf. Kugler and Schmitt 1999; Kugler and Beyer 2003).
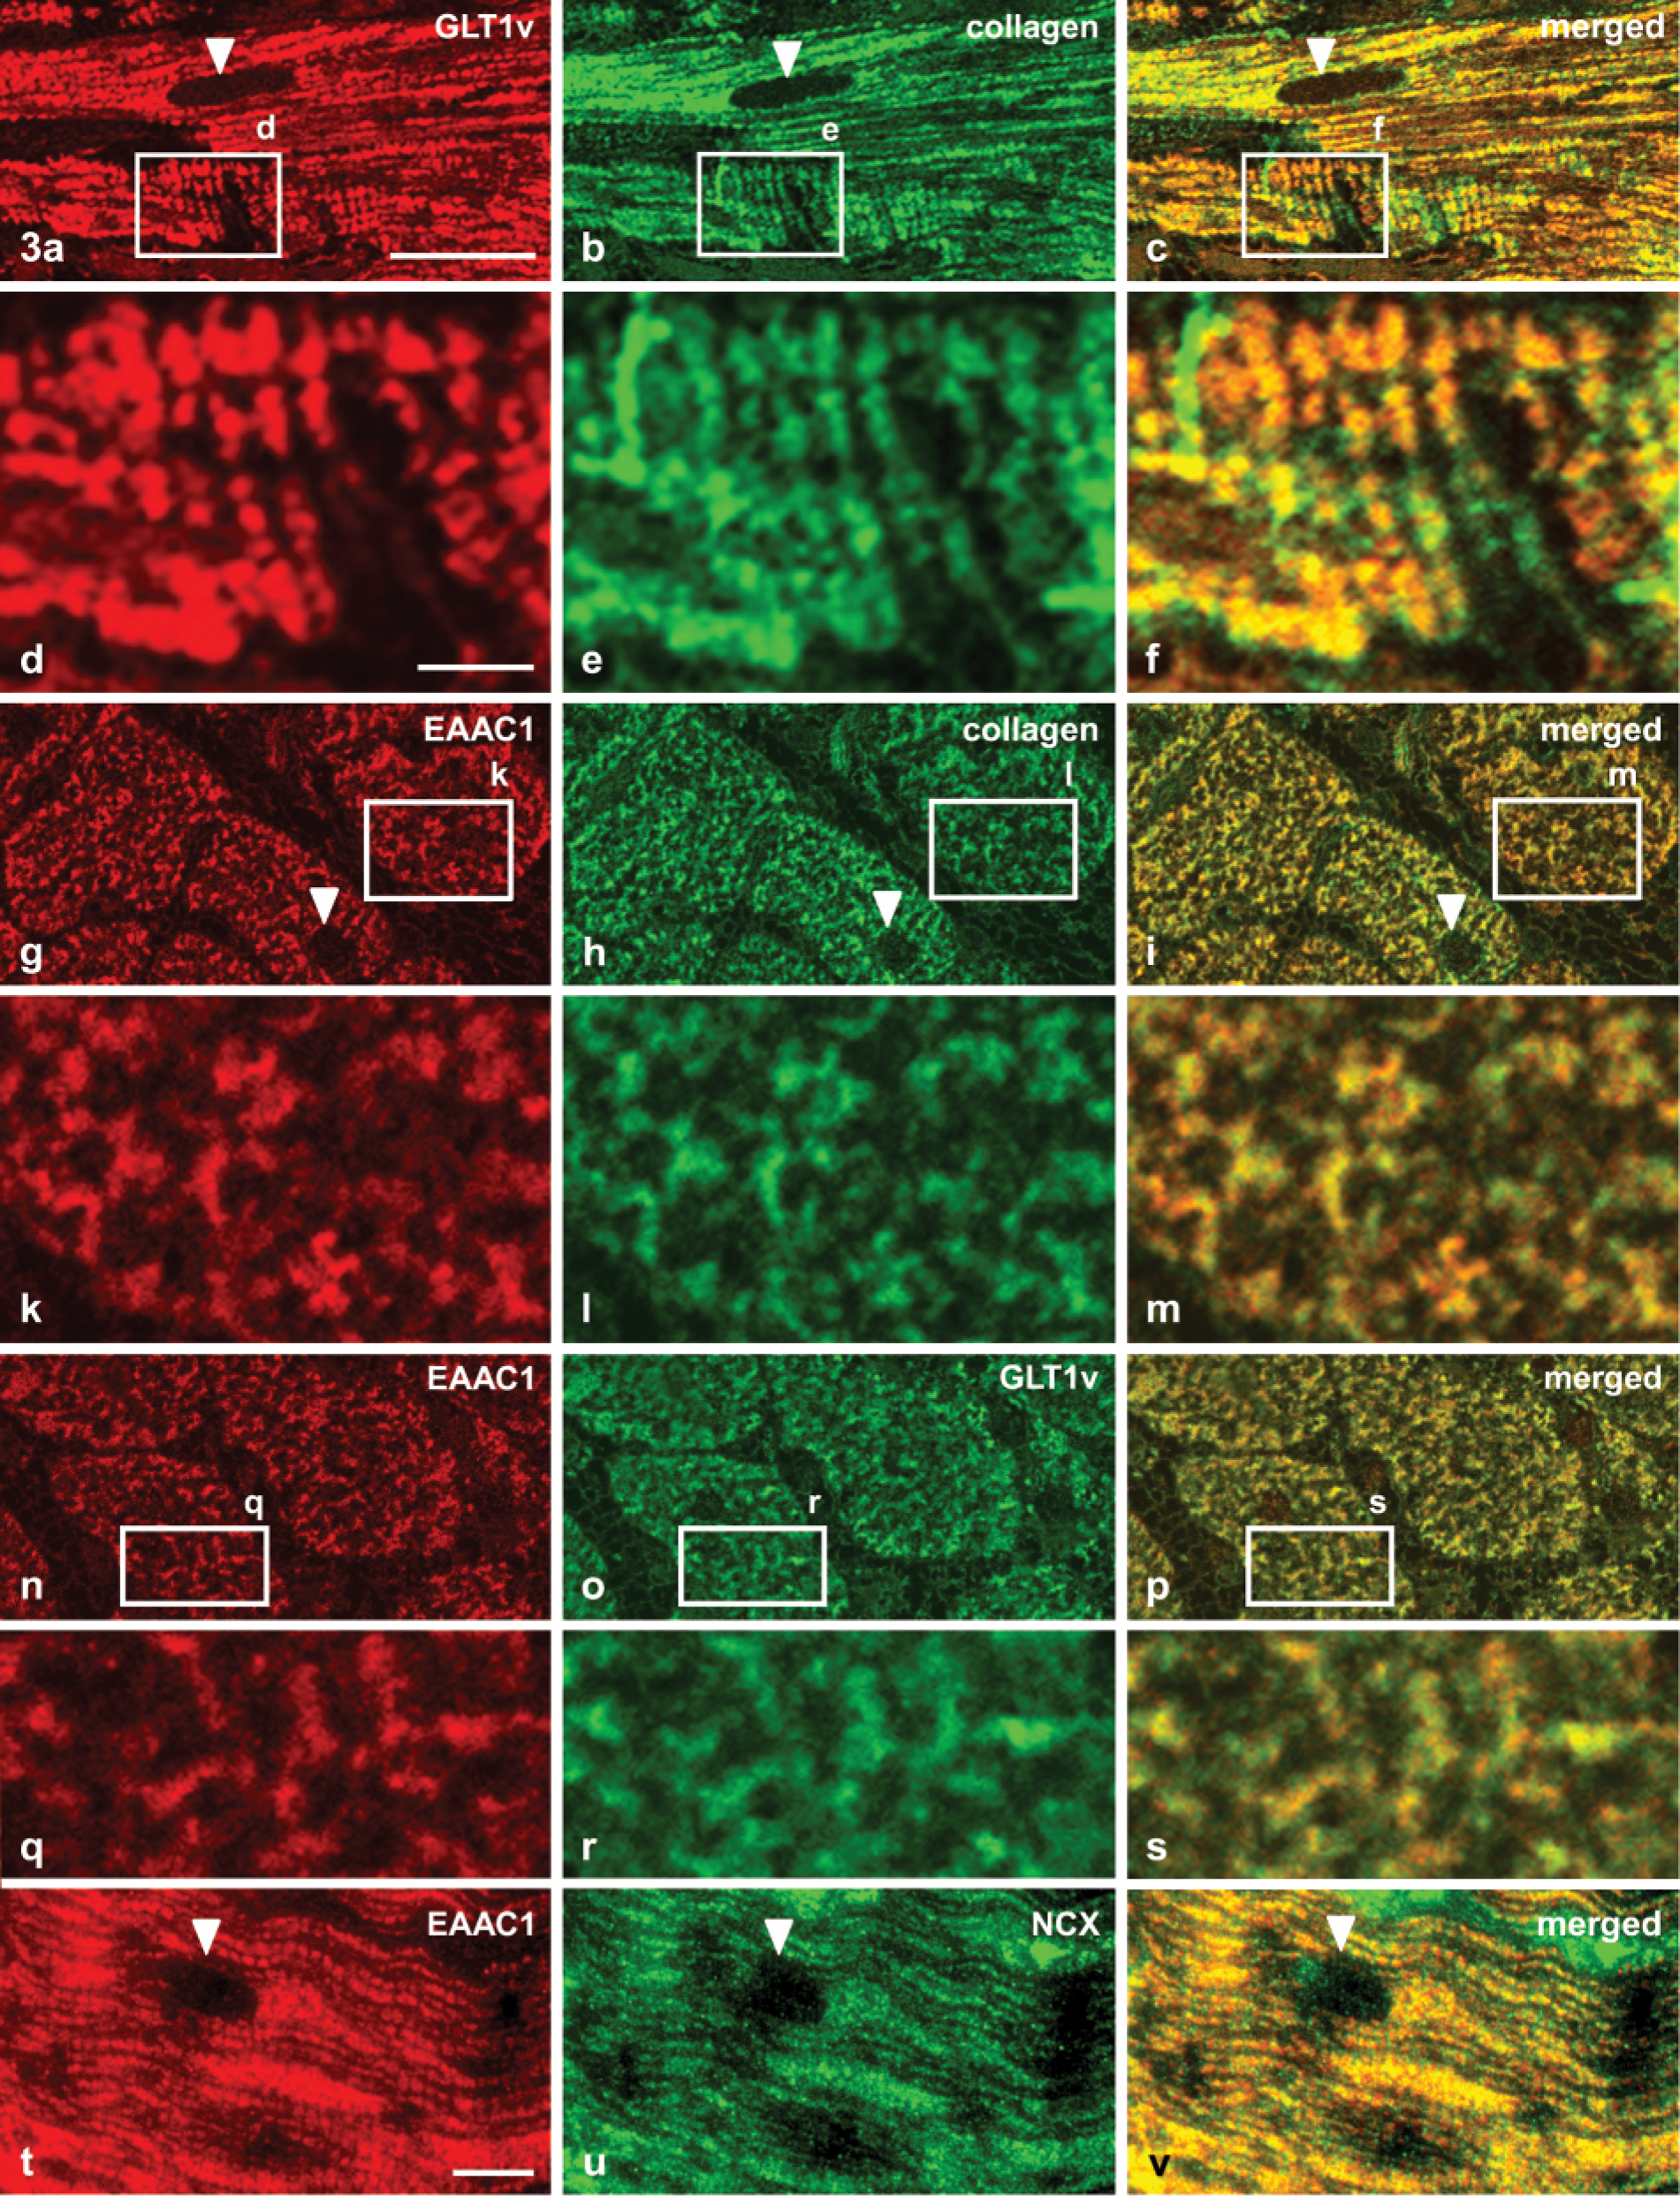
When the affinity-purified antibodies against GLT1v and EAAC1 were applied to semithin plastic sections (1 μm thick) of the myocardium (left and right ventricular walls), an identical staining pattern was observed intracellularly in cardiomyocytes (Figures 3, 4a, and 4c). In longitudinal sections through cardiomyocytes, reaction product was deposited in small dots that were arranged in longitudinal parallel rows forming dotted strands (Figure 3a). In tangential longitudinal sections through the cell periphery of cardiomycytes, it was obvious that the dots of neighboring strands also formed transversely oriented dotted strands with regular distances (Figures 3a, 3d, 4a, and 4c). In transverse sections through cardiomyocytes, the fluorescent staining was also arranged in small dots and in short strands that sometimes formed circular profiles and reached to the surface of cells (Figures 3g and 3k). The sarcolemma of cells seemed to be almost unstained, but the dots of reaction product detected in the cell periphery could be also bound to the sarcolemma.
Because the staining pattern of cardiomyocytes showed apparent similarities to that of T-tubules immunostained for the detection of other molecules (Kostin et al. 1998), double-immunolabeling experiments with antibodies against type IV collagen and NCX were performed. The demonstration of the basal lamina protein type IV collagen enables the detection of T-tubules (Kostin et al. 1998), which are invaginations of the sarcolemma extending deep into the cell and containing basal lamina material at the outer surface. In addition, NCX is concentrated in T-tubules (Frank et al. 1992; Thomas et al. 2003). These double-labeling experiments showed that GLT1v and EAAC1 immunostaining was colocalized with the immunolabeling for type IV collagen (Figures 3a–3m) and for NCX (Figures 3t–3v). This indicates a localization of GLT1v and EAAC1 in membranes of the T-tubular system. However, it could not be excluded at the light microscopic level that the immunolabeling was in aggregated small vesicles just beneath the T-tubular membranes. In neurons, both transporters are preferentially localized in such cytoplasmic vesicles (Kugler and Schmitt 1999; Schmitt et al. 2002).
Distribution of GLT1v (
To prove the likely colocalization of GLT1v and EAAC1, double immunolabeling was performed using a mouse antibody against GLT1v and a rabbit antibody against EAAC1. The resulting immunostaining showed that both transporters are equally codistributed throughout the T-tubular system (Figures 3n–3s).
Discussion
Using non-radioactive ISH and immunocytochemistry, it was found that the glutamate transporters GLT1v and EAAC1 are coexpressed in rat cardiomyocytes. GLT1v was initially cloned from mouse brain and liver (Utsunomiya-Tate et al. 1997) and recently also from rat brain (Chen et al. 2002; Schmitt et al. 2002). Our PCR analyses showed that GLT1v is also expressed in peripheral organs of rats, including the heart (Schmitt et al. 2002). GLT1v is generated by alternative splicing at the 3′ end of the generic GLT1 cDNA, which has been cloned by Pines et al. (1992) and only detected in the central nervous system (Kugler and Schmitt 2003; for review, see Danbolt 2001). Both generic GLT1 and GLT1v are high-affinity glutamate transporters with similar transport characteristics (Utsunomiya-Tate et al. 1997; Chen et al. 2002). On the other hand, EAAC1 was initially cloned from rabbit intestine (Kanai and Hediger 1992) and is expressed in the central nervous system and in peripheral organs, including the heart (for review, see Danbolt 2001). EAAC1 is also a high-affinity transporter whose transport characteristics in rat heart preparations have been reported recently (King et al. 2001). In addition to
Distribution of GLT1v (
Applying immunocytochemistry on semithin plastic sections (1 μm thick), I was able to detect GLT1v and EAAC1 proteins colocalized in the T-tubular system of cardiomyocytes. The transporter proteins were highly enriched in this localization, and a possibly sarcolemmal spotty labeling could not be excluded with certainty at the light microscopic level. The T-system consists of tubular invaginations of the sarcolemma at the Z-band, extending deep into the cytoplasm and representing a specialized form of sarcolemma. The volume density of the T-system is up to 3.2%, and it represents about one third of the entire cell membrane area (Stewart and Page 1978; Severs et al.1985). It is generally accepted that the T-system is necessary for the rapid propagation of the excitation impulse throughout the muscle fiber (Sommer 1995).
Key proteins involved in excitation-contraction (E-C) coupling and further membrane proteins are concentrated at the T-tubules, e.g., L-type Ca2+ channels (Carl et al. 1995; Takagishi et al. 2000), Na+/Ca2+-exchange protein (Frank et al. 1992; Thomas et al. 2003), voltage-gated K+ channel, Kv 4.2 (Takeuchi et al. 2000), and Na+-pump α-catalytic subunit isoforms (McDonough et al. 1996). On stimulation, the insulin-regulated glucose transporter GLUT4 is found not only in the sarcolemma but also in the T-tubular system (Slot et al. 1991). Moreover, we now can show that the glutamate transporters GLT1v and EAAC1 are also localized in this special domain of the sarcolemma. The deep invaginations of the T-tubules in the cytoplasm of cardiomyocytes contribute to the shortening of the cytoplasmatic diffusion distances of glutamate and aspartate transported through the T-tubule membranes. They also facilitate the intracellular enrichment of both amino acids for their extensive use in the intermediary metabolism.
The uptake process of both glutamate transporters is electrogenic and is driven by the ion gradients of K+ and Na+ (for review, see Danbolt 2001). Under ischemic conditions in the brain, glutamate is released mainly from neurons via reversed operation of glutamate transporters (Seki et al. 1999; Rossi et al. 2000; for review, see Danbolt 2001). Provided that the glutamate transporters in the heart operate similarly to those in the brain, the same mechanism could be responsible for the severe loss of dicarboxylic amino acids during acute ischemia or anoxia of the myocardium (Song et al. 1996). In brain slices, ischemia removes the ATP supply to the Na+/K+ pump, K+ accumulates in the extracellular space, depolarizing the cells, and the Na+ gradient driving glutamate uptake is reduced so that glutamate is moved not into the cells but out of them to the extracellular space (Rossi et al. 2000). In hearts perfused by the Langendorff technique, the reversed operation of glutamate transporters is probably one of various mechanisms that lead to loss of these amino acids during acute ischemia (Song et al. 1998).
Further studies are needed to show whether, in addition to GLT1v and EAAC1, further glutamate transporters are expressed in the myocardium. It is now proven (Y. Dehnes and N.C. Danbolt, unpublished data) by immunoprecipitation, subsequent SDS-PAGE, and immunoblotting that at least three different glutamate transporters are detectable in the heart (Danbolt 2001). The significance of the coexpression of different high-affinity glutamate transporters in the same cell type (also documented in the brain; Lehre et al. 1995; Schmitt et al. 2002; Kugler and Beyer 2003) is not obvious.
Footnotes
Acknowledgements
Supported by a grant from the Deutsche Forschungsgemeinschaft.
I am indebted to Erna Kleinschroth and Julia Medvedev for their excellent technical assistance.