
Abstract
Alpha 7 nicotinic acetylcholine receptors are involved in learning and memory, and are implicated in the pathology of Alzheimer's disease and schizophrenia. Detection of α7 subunits can be accomplished via immunodetection or α-bungarotoxin-binding techniques. Standard protocols for immunohistochemistry and Western blotting were followed using several commercially available antibodies. Various mice were evaluated, including non-transgenics, APP, PS1, APP + PS1, and α7 knockouts. Initial results with amyloid-depositing mice revealed α7 immunolabeled astrocytes, in addition to expected neuronal staining. Subsequent studies with intrahippocampal injections of lipopolysaccharide (LPS) into α7 knockout mice showed that both neuronal and astrocytic labeling by α7 antibodies was nonspecific. On Western blots of mouse brain proteins, none of the bands detected with antibodies directed against α7 subunits diminished in the α7 knockout mice. Although LPS-related changes in the expression of some bands were found, these also were unaffected by the α7 genotype of the mice. In general, the Western staining patterns for these antibodies revealed few overlapping bands. These immunodetection data are in contrast to genotyping results and mRNA analyses that confirmed the disruption of the α7 allele and lack of α7 message in the knockouts. These findings suggest caution in interpreting results when using several commercially available α7 nicotinic receptor antibodies.
Keywords
C
In human AD brain, nicotinic receptor populations have been extensively studied. Alpha 7 levels are generally decreased in AD, although there are variations in reports (reviewed in Perry et al. 2001). Declines in receptors may be due to cell loss or synaptic decline. Age-related changes in α7 expression in mice transgenic for a human mutated amyloid precursor protein (APP) have also been reported (Dineley et al. 2001,2002). Particular focus has been on α7 because of the potential interaction of the receptor with Aβ peptides. Co-immunoprecipitation and receptor-binding assays indicate that Aβ1–42 binds α7 with high affinity, but not α4β2, in both human and rat tissue (Wang et al. 2000a, b). Studies conducted with wild-type α7 receptors indicate that Aβ1–42 blocks the receptor (Liu et al. 2001; Pettit et al. 2001; Grassi et al. 2003; Lee and Wang 2003). Glial cells may also be involved in these interactions; recent reports have shown expression of α7 by reactive astrocytes in human AD brain, particularly in association with amyloid deposits (Wevers et al. 1999; Graham et al. 2002; Teaktong et al. 2003).
In these experiments, we used standard protocols for immunohistochemical and Western blot analysis of α7 nAChR subunits in murine models of AD and neuroinflammation. Several commercially available antibodies were evaluated, and the results compared with genotyping and RNA analyses. Initially, four genotypes resulting from breeding transgenic mice carrying either mutant APP or mutant presenilin 1 (PS1) were examined for α7 expression. Various reports in the literature led us to expect decreases in levels of nicotinic receptors in amyloid-depositing mice, such as the APP and APP+PS1 transgenics. Although no decreases in neuronal staining were seen, a surprising finding was α7-immunopositive astroglia in apposition with compact plaques in APP and APP+PS1 mice, but in not PS1 or non-transgenics. To determine if amyloid was causing the astrocytic α7 expression, or if it was part of a more general inflammatory response, we injected lipopolysaccharide (LPS) intrahippocampally into APP and non-transgenic mice. Immunohistochemical analysis revealed many α7-positive astrocytes in the injected animals, leading us to believe that the expression was part of a general inflammatory response. In a final experiment using α7-null mice, the specificity of the antibodies was tested under both control and LPS-stimulated conditions. No discernible differences were seen between α7+/+ versus α7–/– mice with any antibody used, regardless of the procedure. Genotyping and RNA analyses confirmed the disruption of the α7 allele and lack of α7 message in the knockouts. We therefore conclude that commercially available antibodies against α7 as used in the methods detailed here fail to specifically detect the subunits.
Materials and Methods
Mouse Strains
Transgenic mice were bred to develop Alzheimer's-like pathology using Tg2576 APP mice and line 5.1 PS1 mice, yielding four genotypes: non-transgenic, PS1, APP, and APP+PS1 transgenic (Holcomb et al. 1998). Alpha 7-null mutant mice, originally described by Orr-Urterger et al. in 1997, were derived from heterozygous breedings of animals purchased from Jackson Laboratories (Bar Harbor, ME). Non-transgenic and homozygous null mice from this cross were used in this study. Animals were group-housed under a 12 hr light-dark cycle with free access to chow and water. Experimental groups were balanced with regard to age and sex.
Genotyping
APP and PS1 lines were analyzed as previously reported (Gordon et al. 2001). Mice from the α-null mutation line were genotyped as follows: 2-mm diameter ear clips from the α heterozygous breedings were digested and the DNA extracted using Qiagen's DNeasy Kit (Valencia, CA) according to the manufacturer's instructions. Jackson Laboratories supplied the sequence of primers used to identify either the neo-cassette of the null mutation or the wild-type allele, for use with the polymerase chain reaction (PCR): forward, 5′-CCTGGTCCTGCTGTGTTAAACTGCTTC-3′; reverse WT (α+), 5′-CTGCTGGGAAATCCTAGGCACACTTGAG-3′; reverse Neo (α7–), 5′-GACAAGACCGGCTTCCATCC-3′. Thermocycling conditions were as follows: 95C for 4 min; 30 cycles of 95C for 15 sec, 60C for 60 sec, 72C for 60 sec; 72C for 7.5 min; store at 4C. PCR products were run on a 1% agarose gel, using ethidium bromide ultraviolet (UV) detection of bands at 440 bp (α+) or 750 bp (α7–).
Intrahippocampal Injections
APP mice aged 16 months, α-null mice aged 11 months, and their non-transgenic littermates were used in these studies. Mice were anesthetized using isoflurane and immobilized in a stereotaxic apparatus. One-μl injections of either saline or 4 μg/μl LPS (Salmonella abortus equi, Sigma, St Louis, MO) were delivered over a 2-min period into the hippocampus (stereotaxic coordinates from bregma: −2.7 mm posterior; ±2.5 mm lateral; −3.0 mm ventral). This procedure had been previously demonstrated in our lab to induce a neuroinflammatory response without adversely affecting animal survival (DiCarlo et al. 2001). All animal work was conducted under National Institutes of Health guidelines and approved by the University of South Florida's institutional animal care and use committee. Animals were singly housed for the seven-day posttreatment survival period under standard vivarium conditions.
Tissue Preparation
Mice were anesthetized with pentobarbital (200 mg/kg IP), then perfused transcardially with 25 ml of saline. The brain was removed, the right hemisphere dissected into regions, and the tissue stored at −80C for subsequent biochemical analyses. For immunohistochemistry, left hemispheres were transferred into a 4% paraformaldehyde solution for 24 hr, then processed through a cryprotection schedule of 10%, 20%, then 30% sucrose (24 hr in each solution). The tissue was sectioned horizontally on a sliding microtome at 25 μm. Sections were then stored in Dulbecco's phosphate-buffered saline (DPBS), pH 7.4, with sodium azide (100 mM) at 4C.
RNA Analysis
Mice obtained from the α-heterozygous breedings were analyzed for mRNA using reverse transcription followed by PCR. The procedure was originally described in detail elsewhere (Dickey et al. 2003). RNA was extracted from the injected hippocampus of α+ and α– mice, using Qiagen's RNeasy procedure. RNA concentration was determined with Molecular Probes RiboGreen RNA quantitation kit (Molecular Probes, Eugene, OR). Reverse transcription with mMLV (Invitrogen, Carlsbad, CA) was performed, and the resulting cDNA subjected to PCR. Primers used to identify α were directed toward portions of exons 9–10: forward, 5′-GTGGGCCTCTCAGTGGTCGT-3′; reverse, 5′-GTCCCCATCAGAGGGGTGTG-3′. Thermocycling conditions were as follows: 95C for 3 min; 45 cycles of 95C for 15 sec, 60C for 60 sec, 72C for 60 sec; 72C for 7.5 min; store at 4C. PCR products were run on a 1% agarose gel, using ethidium bromide UV detection of bands at 381 bp.
Histology
Immunohistochemical analysis of α nAChRs was performed using 25-μm free-floating sections spaced 300 μm apart through the hippocampus. Details of this procedure were originally described elsewhere (Gordon et al. 1997). All steps were performed on a rotating platform at ~40 rpm, room temperature, unless otherwise stated. Sections were first blocked for endogenous peroxidases (10% methanol, 3% hydrogen peroxide in DPBS) for 15 min, then washed three times for 5 min with DPBS. The tissue was then permeabilized in a solution of 100 mM lysine, 0.2% Triton X-100, and 4% normal goat or horse serum (Pel Freeze, Rogers, AK) in DPBS for 30 min. Sections were then incubated overnight in the appropriate primary antibody in DPBS and 4% serum, without shaking (Table 1). The following day, sections were incubated with shaking in primary antibody for 1 hr, washed three times for 5 min with DPBS, and then incubated in the appropriate biotinylated secondary antibody (Vector Laboratories, Burlingame, CA) at a concentration of 0.5 μg/ml in DPBS and 4% serum, for 2 hr. Sections were then washed three times for 5 min with DPBS, then incubated for 1 hr in Vectastain Elite ABC solution (Vector Laboratories) using 8 drops each of components A and B per 100 ml of DPBS. Sections were then washed two times for 5 min with DPBS, followed by a single wash in Tris-buffered saline (TBS), pH 7.6, for 5 min. The tissue was then incubated with a solution of 0.5% nickelous ammonium sulfate hexahydrate and 0.05% diaminobenzidine in TBS for 5 min. Color development was achieved by the addition of 0.03% hydrogen peroxide, and incubation for an additional 5 min, followed by a single wash in TBS, then two washes in DPBS, each for 5 min. Controls for nonspecific binding of the secondary antibody were performed by excluding primary antibodies. Stained sections were mounted onto slides and air dried overnight. Slides were then processed through a dehydration schedule of 10 dips in water, followed by two washes for 3 min each in 25%, 50%, and 75% ethanol, then three washes for 5 min each in 95% ethanol, 100% ethanol, and Histo-Clear (National Diagnostics, Atlanta, GA). Slides were coverslipped with DPX (E.M. Sciences, Fort Washington, PA) and allowed to dry overnight.
In some cases, tissue stained with α antibodies was counterstained with Congo red to verify the location of compact amyloid deposits. For this counterstain, immunostained sections were slide mounted and allowed to dry overnight. The slides were then hydrated for 30 sec in water. Slides were then submerged for 20 min in a solution of 80% ethanol saturated with sodium chloride, then made alkaline with a final concentration of 0.01% sodium hydroxide. Slides were then incubated for 30 min in a separate portion of alkaline alcoholic saturated sodium chloride containing 0.2% Congo red dye (solution filtered prior to use). Slides were then dehydrated with eight dips in 95% ethanol, then eight dips in two baths of 100% alcohol. The tissue was finally run through xylene three times for 5 min and coverslipped with DPX.
Primary antibodies used for immunodetection
Western Blotting
Mice obtained from the α-heterozygous breedings were analyzed for protein using SDS-PAGE followed by Western blot. Cerebral cortex previously stored at −80C was homogenized in 10 mM HEPES buffer, pH 7.4, containing a protease inhibitor cocktail (Roche, Indianapolis, IN). Crude protein concentrations were determined by the Bradford method using Bio-Rad Protein Assay Dye Reagent (Hercules, CA). Samples were denatured with Bio-Rad Laemmli sample buffer by boiling for 5 min. Ten μg of protein was loaded per well, and proteins were separated using 10% polyacrylamide Bio-Rad Ready Gels. Bio-Rad Precision-Plus Protein All Blue molecular weight standards were run for band identification. The separated proteins were transferred to Immobilon-P polyvinylidine fluoride membranes and immunoblotted (Millipore, Bedford, MA). Membranes were first blocked with 5% non-fat dry milk in borate-buffered saline, pH 8.5, and 0.05% Tween-20 (BST) for 1 hr on a rocking platform at room temperature. Membranes were then incubated with primary antibody in 2.5% non-fat dry milk in BST for one hour (Table 1). After washing three times for 5 min with BST, blots were incubated with the appropriate horseradish peroxidase-conjugated secondary antibody (Santa Cruz Biotechnology, Santa Cruz, CA) at a 1:10,000 dilution in 2.5% milk-BST for 30 min. Finally, membranes were triple washed in BST. Bands were identified using Western Blotting Luminol Reagent (Santa Cruz Biotechnology) for chemiluminescent detection and subsequent film exposure for 0.5–5 min. The presence of α protein was verified by comparing the protein bands to the molecular weight standard markers. The expected molecular weight of the α subunit was 56 kDa.
Results
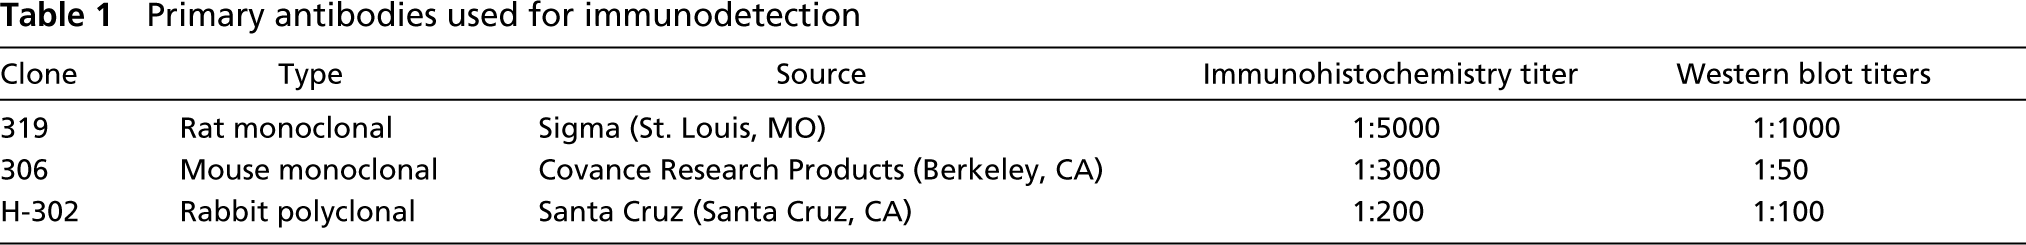
Standard protocols for immunohistochemical and Western blot detection of α7 nAChR subunits were followed using several commercially available antibodies. These results were ultimately compared with genotyping and mRNA analyses of the α7 subunit. Initially, four genotypes resulting from breeding of APP and PS1 transgenics were examined for α7 expression. Previous data had been published demonstrating the amyloid burden, gliosis, and behavioral phenotype of these mice (Gordon et al. 2002). The antibodies used for the current study included a rat monoclonal antibody (mAb 319), a mouse monoclonal (mAB 306), and a rabbit polyclonal (pAb H-302). In non-transgenic mice (Figure 1), distinct ubiquitous positive immunostaining was seen throughout the brain with mAb 319. Regions analyzed included the dentate gyrus of the hippocampus, frontal cortex, striatum, and cerebellum. These results are consistent with previous reports (Del Toro et al. 1994).
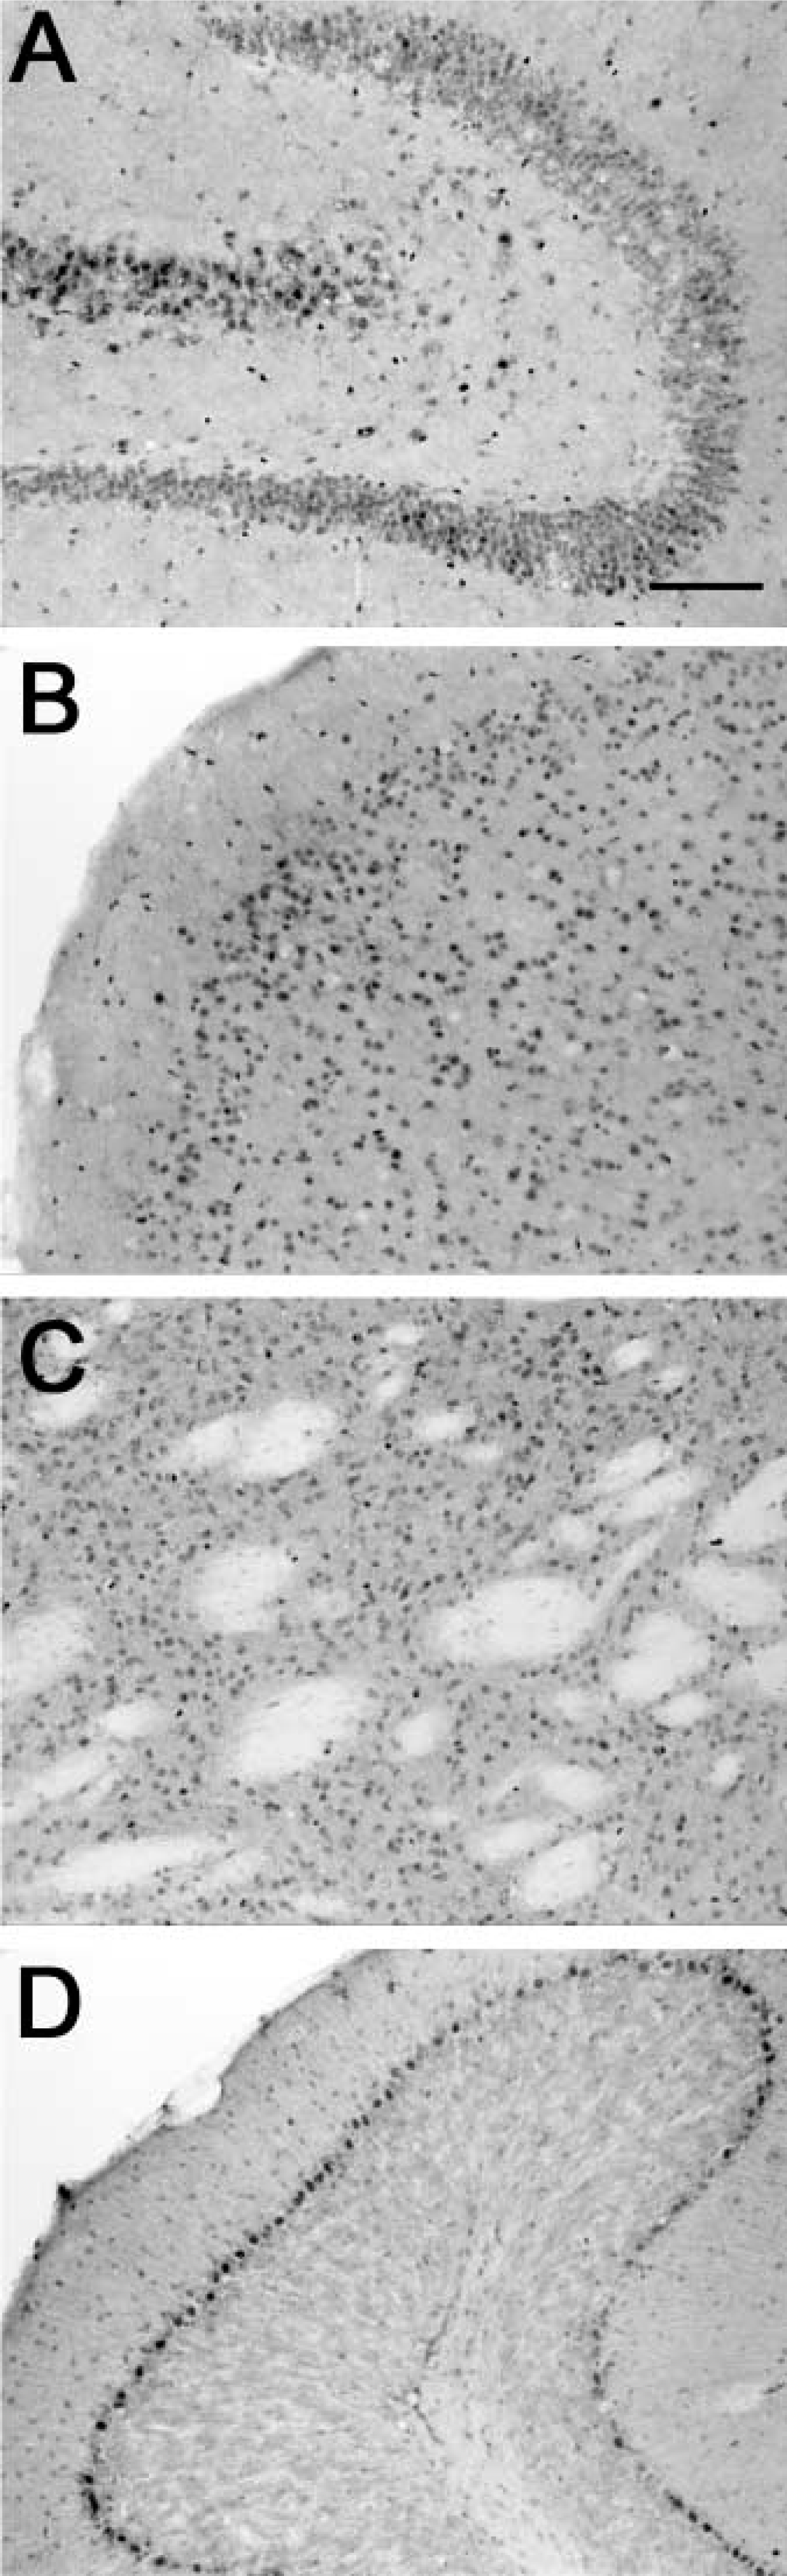
Mice transgenic for APP+PS1 were next analyzed. Distinct neuronal staining was noted with mAb 319 (not shown), similar to that seen in non-transgenics (Figure 1). A comparison of non-transgenic versus APP+PS1 mice revealed no differences in the intensity of neuronal staining in any region. In amyloid-bearing regions, such as the hippocampus and cortex, immunolabeling of reactive astrocytes was also noted. The cells were deemed astrocytes on the basis of their size, morphology, and distribution within the laminated regions, such as hippocampus. The α7-immunopositive astrocytes seemed to cluster around amyloid deposits. This clustering was confirmed when brain sections were counter-stained with Congo red (Figure 2). This micrograph shows mAb 319-positive cells associated with a congophillic plaque. APP mice showed similar patterns of astrocytic staining, but to a lesser degree, possibly because of the lower amyloid burden in these mice (data not shown). PS1 mice resembled non-transgenics; rarely were α7-immunolabeled astrocytes seen in those mice.
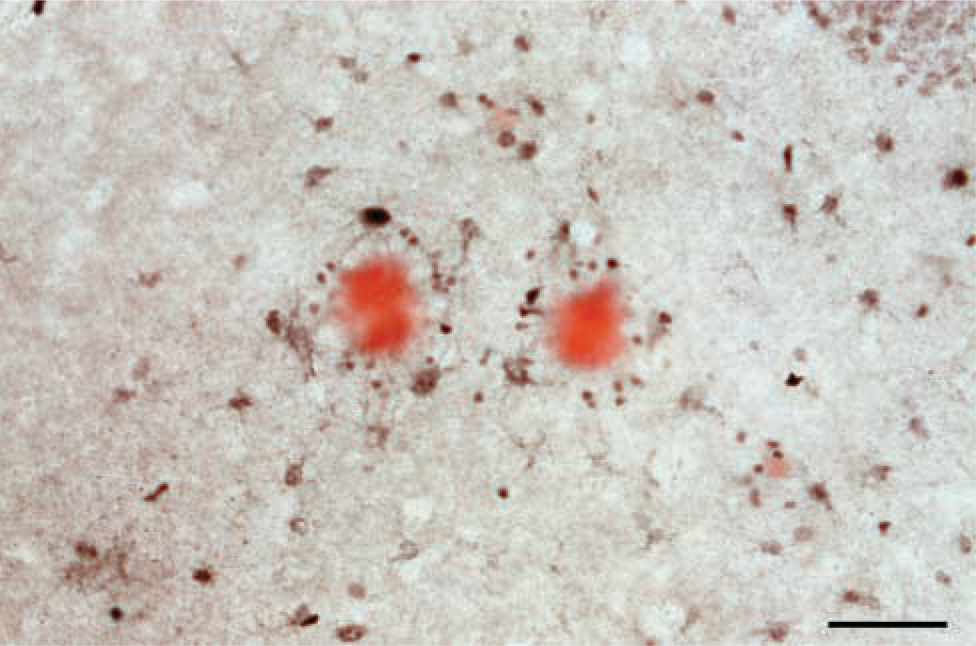
To determine whether α7 expression by reactive astrocytes was due to a generalized inflammatory response to amyloid, we injected LPS into the right hippocampus of APP and non-transgenic mice. LPS treatment resulted in a widespread pattern of mAb 319 immunolabeling of astrocytes, cells known to react to LPS injections (Hauss-Wegrzyniak et al. 1998). No changes were seen in neuronal staining with mAb 319 (Figure 3). Figure 3 depicts the CA3 regions of saline-injected (panels A,C) versus LPS-injected mice (panels B,D). A few immunopositive astrocytes were seen in saline-treated APP mice (panel C), but not in the non-transgenics (panel A). All mice showed reactive α7-immunopositive astrocytes upon LPS treatment (panels B,D).
In a final set of experiments, LPS was injected into α7-null mice, thus testing the specificity of the anti-α7 antibodies. Mice carrying a null deletion for α7 were genotyped and selected to be either non-transgenic (α7+) or homozygous null (α7–). Genotyping results indicated a single band at 440 bp for α7+ mice or at 750 bp for α7-null mice. Figure 4A shows typical PCR product banding for non-transgenic and null genotypes. All mice were genotyped and sorted on the basis of these results. Subsequently, RNA was extracted from the hippocampus, reverse transcribed, and subjected to PCR to determine whether α7 mRNA was expressed. Mice that had been genotyped as α7– did not express α7 mRNA. Typical samples are shown in Figure 4B, with a positive signal at 381 bp in lane 1 (non-transgenic), as well as a smaller primer-dimer product running at the end of the gel (present even in the absence of cDNA). All animals genotypically α7+ also had α7 mRNA; none of the α7-null mutant mice had α7 mRNA.
Immunolabeling by α7 antibodies in non-transgenic mouse brain. Horizontal sections were immunostained using mAb 319 at a 1:5000 dilution. Ubiquitous neuronal stain was seen in all regions examined, including the dentate gyrus of the hippocampus (
Reactive astrocytes colocalize with congophillic plaques in APP + PS1 mice. Horizontal sections were immunostained using mAb 319 at a 1:5000 dilution and then counterstained with Congo red. Micrographs show the molecular layer of the CA3 region of the hippocampus. Black staining of the cell bodies is clearly defined, with faint staining of processes, all surrounding the red plaque core. Bar = 50 μm.
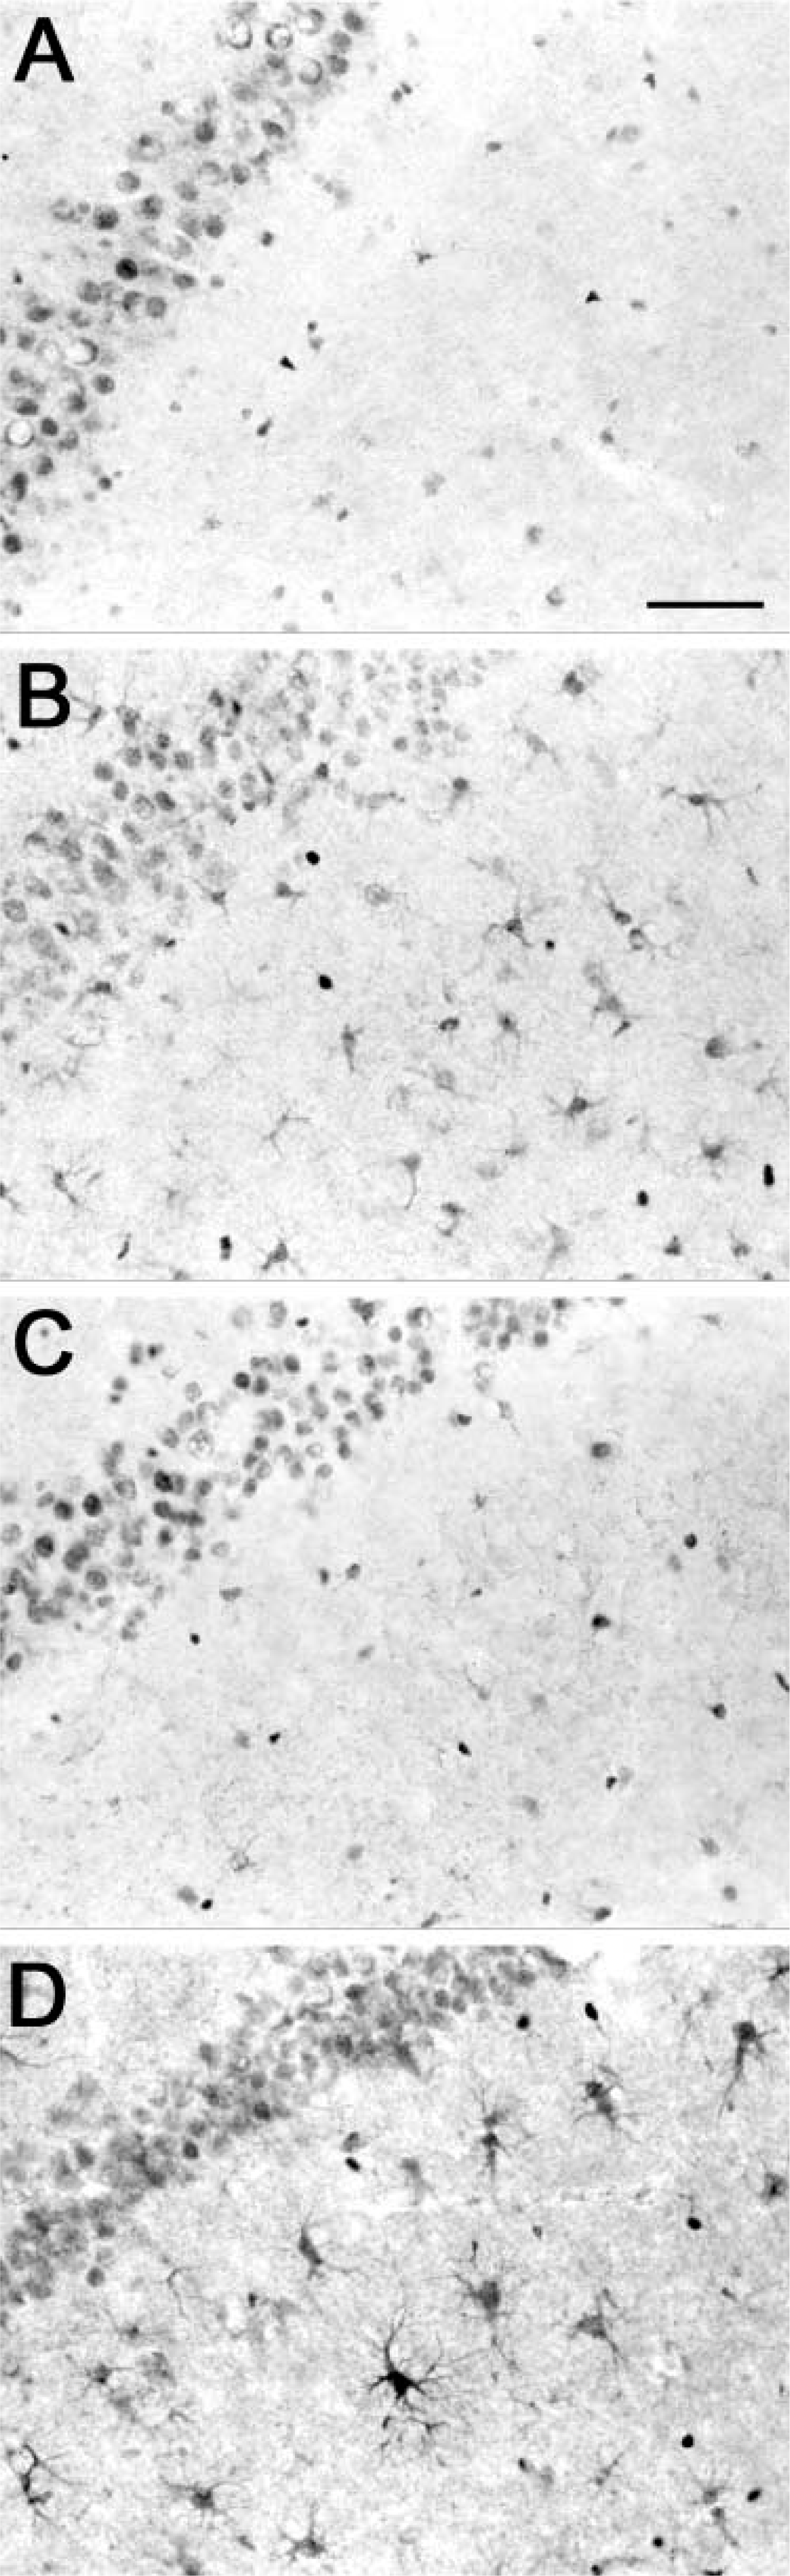
Immunohistochemistry was performed using tissue from both α7+ and α7– genotypes, with or without LPS injection. A variety of commercially available antibodies were used (Table 1). Shown in Figure 5 are three anti-α7 antibodies (mAb 319 in panels A,B; mAb 306 in panels C,D; and pAb H-302 in panels E,F). Each antibody showed intense, ubiquitous labeling of neurons throughout the brain; cortical neurons are shown in this figure. No difference in the staining patterns was seen between untreated α7+ (Panels A,C,E) and α7– mice (Panels B,D,F). All three antibodies immunolabeled neurons in both genotypes. LPS injection into the hippocampus caused reactive astrogliosis similar to that seen in Figure 3 (data not shown). Again, mAb 319 labeled astrocytes in both α7+ and α7– mice. Astrocytes were not labeled by mAb 306 or pAb H-302 in either genotype or treatment. Thus, regardless of treatment or antibody used, both α7+ and α7– mice showed distinct nonspecific labeling of neurons (mAbs 306 and 319, and pAb H-302) as well as astrocytes (mAb 319).
Lipopolysaccharide (LPS) stimulates astrogliosis and immunolabeling by anti-α7 antibodies. Non-transgenic (
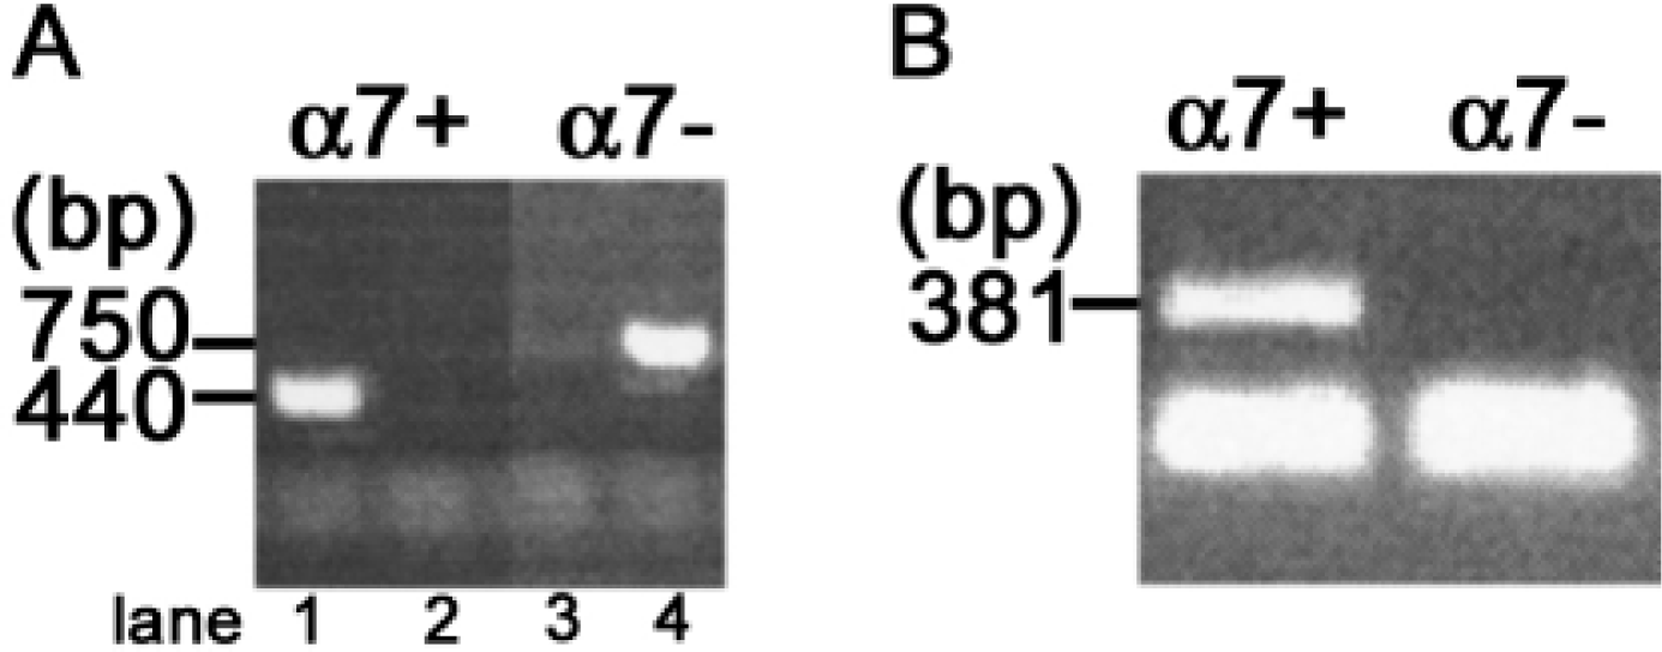
Genotyping and RNA analysis of α7+ and α7– mice. (
Antibody staining patterns were also examined by Western blot, using cortical tissue from both genotypes, with or without LPS injection. The exposure times were increased to maximize detection of faint bands. Although most antibodies showed many nonspecific bands, no antibody revealed differences between untreated α7+ versus α7– mice at the expected molecular weight of 56 kDa (Figure 6). LPS injection caused upregulation of an unknown protein in both α7+ and α7– mice at ~45 kDa (mAb 306) and ~75 kDa (mAb 306, pAb H-302). No additional bands were seen with mAb 319 after LPS treatment. However, none of the antibodies detected differences between LPS-treated α7+ versus α7– mice.
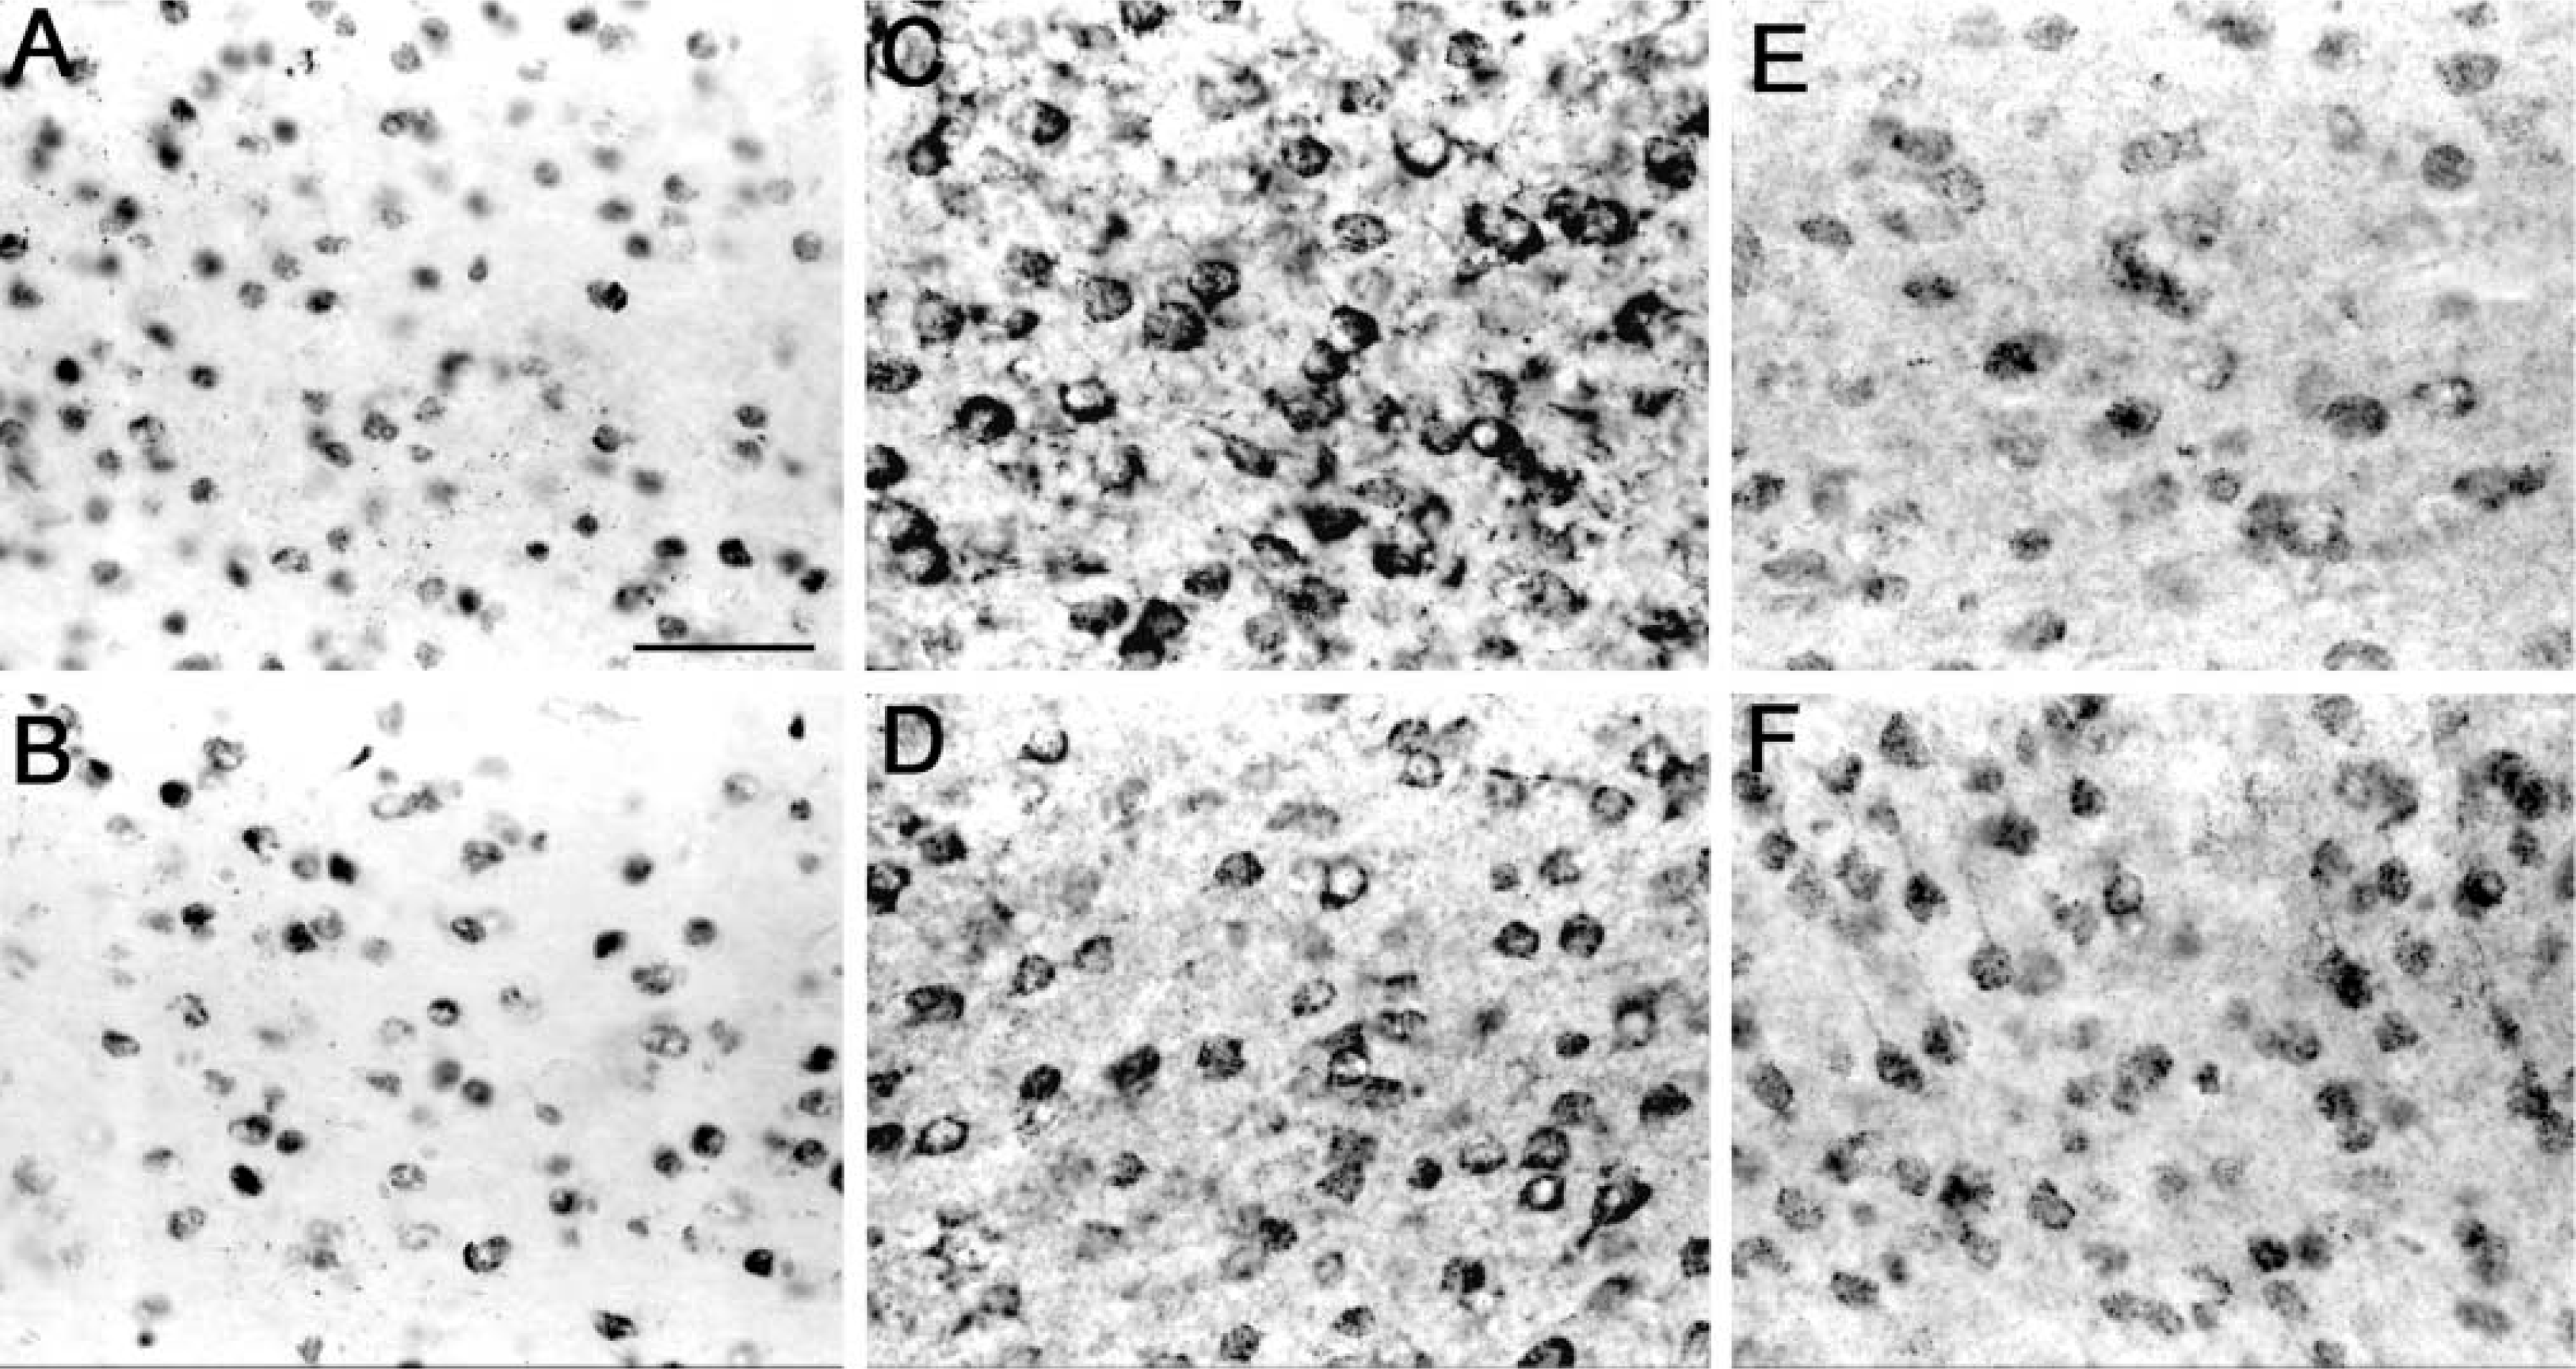
Immunohistochemical analysis of nontransgenic α7+ and null mutant α7– tissue. Horizontal sections were immunohistochemically analyzed using various anti-α7 antibodies. Micrographs show neurons in the frontal cortex. Ubiquitous staining of cell bodies was seen with all antibodies. Some cytoplasm and processes are stained with mAb 306 (
Discussion
Three different commercially available antibodies intended to label α7 nAChR subunits were used in standard immunohistochemical and immunoblotting protocols. The antibodies were generated using different host species and different α7 subunit sequences, although all products are directed toward portions of exon 10.
Previous reports have shown the utilization of monoclonal antibodies from clones 306 and 319 for immunohistochemical analysis of rat brain (Del Toro et al. 1994). The results reported by Del Toro indicated ubiquitous neuronal expression, similar to that seen in our studies. Both the Del Toro procedure and ours used paraformaldehyde fixation of the brain prior to sucrose cryoprotection. Both procedures used 25-μm free-floating sections, an avidin-biotin-peroxidase protocol, and diaminobenzidine tetrahydrochloride color development. The immunohistochemical protocols used in our experiments were developed to yield significant positive stain while minimizing background. Various concentrations and combinations of primary (1:100–1:10,000) and secondary (1:1000–1:10,000) antibodies were tested in an effort to identify conditions that stained the α7+/+ mice but not the α7-null mice, without success. Tissue perfusion (saline versus paraformaldehyde) and post-fixation times (2–24 hr) were also evaluated separately in non-transgenic α7+ mice. No differences in the immunolabeling patterns were seen with any of these variations. It is conceivable that the antigenic determinant(s) was modified by the paraformaldehyde treatment (Montero, 2003). Another possibility is that the levels of α7 may be so low, or the amount of antibody needed to yield a signal so high, that cross-reacting protein binding masked any α7-positive cells. Other researchers who have worked with the α7-null mice did not use immunohistochemistry to demonstrate the absence of this receptor, but rather showed the absence of α-bungaro-toxin binding in unfixed tissue (Orr-Urtreger et al. 1997; Franceschini et al. 2002; Wang et al. 2003). Using our paraformaldehyde-treated tissue, we failed to detect specific labeling using fluorophore-conjugated α-bungarotoxin (data not shown).
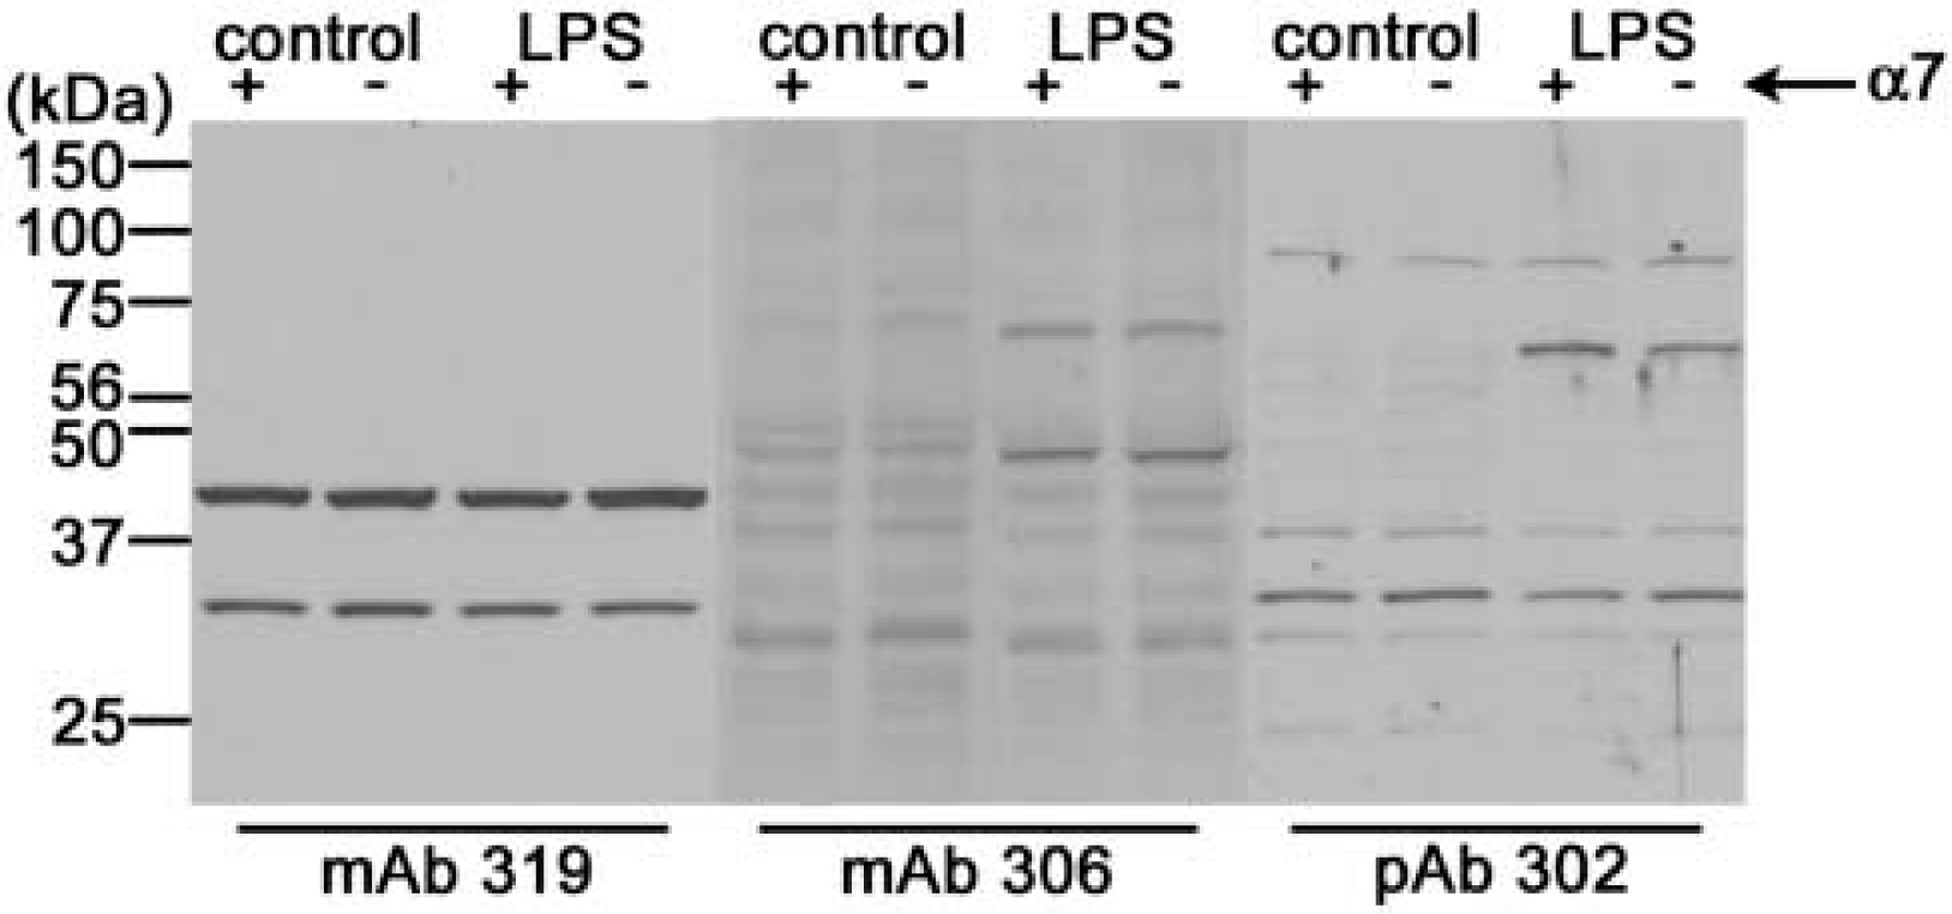
Western blot analysis of non-transgenic α7+ and null mutant α7– tissue. Cortical tissue was homogenized, subjected to SDS-PAGE, transferred, and immunoblotted. Enhanced chemiluminescence detection was captured with subsequent film exposure. The scanned image shown contains typical samples of alternating lanes of α7+ tissue and α7– tissue. Tissues from both untreated control mice and LPS-injected mice were run for each genotype and antibody. A primary band at 45 kDa and a secondary band at 30 kDa were seen with mAb 319 (lanes 1–4). Strong bands at 30, 50, and 75 kDa were seen with mAb 306 (lanes 5–8). Strong bands at 30, 45, 75, and 100 kDa were evident with pAb H-302 (lanes 9–12). Both non-transgenic α7+ and null mutant α7– tissues were immunolabeled by these anti-α7 antibodies. LPS treatment resulted in an increase in immunolabeling by mAb 306 (bands at 50 and 75 kDa) and pAb H-302 (bands at 75 kDa). This increase in staining was seen in both α7+ and α7– tissue.
The immunolabeling of reactive astrocytes in amyloid-depositing mice by mAb 319 was an interesting finding of these studies. Subsequent studies with LPS injection in α7 knockout mice revealed this labeling to be nonspecific. A recent report by Teaktong et al. (2003) showed immunolabeled α7+ astrocytes in human AD brain. Cholinergic signaling by rat astrocytes has been demonstrated (Sharma and Vijayaraghavan, 2001). Activation of these cells produced calcium flux that was blocked by α-bungarotoxin, indicating the presence of α7 nAChRs. The potential for some of the astrocyte α7 labeling to be specific should not be ruled out. Thus, in designing experiments to evaluate α7 expression, an alternative approach would be the use of α-bungarotoxin instead of anti-α7 antibodies. However, we were unable to develop adequate α-bungarotoxin labeling in formaldehyde-fixed sections.
Several reports have demonstrated Western blot analysis of α7 in rodent brain extracts using monoclonal antibodies from clones 306 and 319 (Schoepfer et al. 1990; Del Toro et al. 1994; Orr-Urtreger et al. 1997; Dineley et al. 2001; Fabian-Fine et al. 2001). These reports have listed the apparent molecular weight of the α7 subunit as ranging from 48 to 72 kDa, although the calculated molecular weight is 56 kDa. Some of the investigators used standard homogenization procedures, SDS-PAGE separation, transfer, and subsequent immunoblotting, similar to the procedure described here. Other reports affinity purified the α7 nAChRs with cobratoxin or bungarotoxin prior to SDS-PAGE, resulting in a primary band at ~56 kDa (Del Toro et al. 1994; Orr-Urtreger et al. 1997). The immunoblotting protocols used in our laboratory were developed to minimize nonspecific bands and background. Various concentrations and combinations of primary and secondary antibodies, ranging from 1:50 to 1:10,000, were tested in an effort to come up with conditions that differentiated between the α7+ and the α7-null mice, without success. Separately, various homogenization buffers (10 mM HEPES ± 1–2% Triton X-100, 50–150 mM PBS ± 1–2% Triton X-100, 50 mM TBS ± 1–2% Triton X-100), vendors of secondary antibodies (Vector, Santa Cruz), blocking solutions (BST + 2.5–5% milk, tris buffered saline plus 0.05% tween-20 + 2.5–5% milk), and subcellular fractionation preparations (crude, membrane, and solubilized fractions) were tried, but failed to reveal differences in the staining pattern between α7+ and α7-null mice. Other researchers who have performed Western blot analysis of α7-null tissue did not use commercially available antibodies, and also affinity purified the α7 subunit before analysis (Orr-Urtreger et al. 1997; Franceschini et al. 2002; Wang et al. 2003). Again, an alternative approach in designing experiments to evaluate α7 expression would be the use of α-bungarotoxin affinity purification. However, the large amounts of tissue needed for affinity purification complicate the procedure and preclude analysis of small brain regions (such as the hippocampus) in individual rodents.
There have been reports of a partial duplication of the human α7 nAChR gene, which has four novel N terminus exons and conserved exons 5–10 (Gault et al. 1998; Villiger et al. 2002). Such duplication has not been reported in rodents, but cannot be completely ruled out. If there were such duplication, it might account for the α7 protein detection in the absence of α7 gene expression. Still, one would expect at least a quantitative difference in the amounts of stained material. Alternatively spliced α7 mRNAs have recently been shown in mice (Saragoza et al. 2003). The resultant mRNA includes a novel exon 9b. Additionally, another splice variant with novel exon 4b has been reported in rat (Severance et al. 2002). The Saragoza variant could potentially interfere with our RNA analysis, in as much as the primers are designed to prime to exons 9–10. In contrast, the Severance variant does contain exons 9–10 and should be eliminated in the knockout mouse. However, alternatively spliced mRNAs would have no effect on the genotyping results, because exons 8–10 are interrupted in the knockout. Moreover, the complete absence of α7 mRNA in the null mice would require some mutation in any duplicated α7 gene, which would disrupt the annealing of the primer pairs. We find such circumstances unlikely to account for the results we have obtained here.
In conclusion, careful examination of protocols is necessary when drawing conclusions from immunodetection studies of α7 nAChRs. Localization of the α7 subunit with immunohistochemistry must be interpreted with caution. Confirmation with α-bungaro-toxin-binding experiments is recommended, as well as RNA analysis, where applicable.
Footnotes
Acknowledgements
This work was supported by grants AG15490 and AG18478 from the National Institute on Aging. It was an honor to have Dr. Hannsjoerg Schroeder of the University of Cologne and Dr. Jon Lindstrom of the University of Pennsylvania provide critical comments for this manuscript, for which the authors thank them.