
Abstract
In this study we investigated the levels of expression of sialic acid and N-acetylgalactosamine residues on the cell surface of a normal intestinal epithelium cell line, IEC-6, and in two colon adenocarcinoma cell lines with different metastatic potential, Caco-2 and HCT-116. Glycoprotein expression was estimated initially by cytochemistry with WGA and HPA lectins and biochemistry with isolated plasma membrane fractions of the cells. Fluorescence and electron microscopic analyses revealed differences in the expression profile of carbohydrates recognized by the lectins used on the cell surface of IEC-6, Caco-2, and HCT-116 cells. Lectin blotting identified a range of eight HPA-binding glycoprotein bands with molecular weights of 16–66 kD in Caco-2 cells, six glycoproteins of 16–36 kD, and three protein bands of 35, 24, and 21 kD in IEC-6 cells. A minor band of 66 kD and a major one of 50 kD for WGA-binding glycoproteins were observed in IEC-6 cells and seven glycoproteins of 18–97 kD in Caco-2 and HCT-116 cells but with a visible higher expression of these glycoproteins in the latter. Furthermore, significant quantitative difference in levels of expression of WGA- but not of HPA-binding glycoconjugates was noted, as analyzed by high-resolution scanning electron microscopy using backscattered electron images of cells incubated with gold-labeled lectins.
I
Progress in the study of differences in carbohydrate structures on the cell surface has been achieved by the use of lectins. Lectins are proteins or glycoproteins of non-immune origin with specific binding affinities for the carbohydrate moieties of glycoconjugates. They have gained considerable popularity as histological reagents in many areas of diagnostic investigation, especially those related to changes in the expression of cell membrane glycoconjugates (Gabius et al. 1991; Miyoshi et al. 2001). It has also been reported that lectins recognize certain sugars that carry out various functions such as cell attachment, migration, and invasion (Nangia-Makker et al. 2002).
Various studies have shown altered carbohydrate composition in colorectal adenomas and carcinomas. For example, Baldus et al. (1996) showed the significance of the lectins obtained from Erythrina cristagalli (ECA) and Erythrina corallodendron (EcorA), both known to recognize Galβ1–4 GlcNac residues, which are biosynthetic precursors of ABH and Lewis blood group antigens, also related to tumor-associated carbohydrate antigens. Altered lectin binding in colorectal tumors has also been reported. Iwakawa et al. (1996) found modification in expression of N-acetyl-galactosamine (GalNac),
To characterize the relationship between the expression of carbohydrates and colorectal cancer, most studies have used lectin histochemistry and quantification by light and electron microscopy or, in other cases, biochemical analysis using serum of patients. However, despite the wide information regarding the use of lectins as probable markers in colorectal cancer, previous studies using these probes, HPA in particular, in colorectal tumors of patients are contradictory, probably because different approaches were used (Kim and Isaacs 1975; Hakomori 1989; Kemmner et al. 1992).
In this study, using fluorescence and electron microscopy as well as biochemical analysis, we report differences in the expression of sialic acid and N-acetylgalactosamine residues on the cell surface of a normal intestinal cell line and two colon adenocarcinoma cell lines, with variations in relation to their differentiation state and metastatic potential. Furthermore, using high-resolution scanning electron microscopy, we present evidence of significant quantitative differences in surface labeling of these cells.
Materials and Methods
Cell Cultures
IEC-6, a non-transformed rat small intestinal epithelial cell line, Caco-2, a differentiated with moderate invasive potential cell line derived from colon adenocarcinoma, and HCT-116, a very invasive cell line derived from colon carcinoma, were obtained from the American Type Culture Collection (ATCC; Manassas, VA). Cells were cultured at 37C in a humidified atmosphere of 5% CO2/air in DMEM medium (Sigma Chemical; St Louis, MO) supplemented with 10% heat-inactivated fetal bovine serum (Sigma), penicillin G (60 mg/liter), and streptomycin (100 mg/liter). For IEC-6 cells, the DMEM medium was also supplemented with 100 μl of insulin (Biobrás; MG, Brazil). For experimental purposes, cells were plated on culture flasks, glass coverslips, or on polycarbonate filters (Transwell, 0.4-μm pore size; Costar, Cambridge, MA).
Fluorescence Microscopy
Cells were grown on glass coverslips. After achieving confluence, cells were washed three times with PBS and fixed with freshly prepared 4% paraformaldehyde in PBS (pH 7.2) for 10 min. Then they were washed and incubated with 50 mM NH4Cl in PBS for 15 min. This was followed by sequential incubation for 15 min in 3% BSA in PBS and for 60 min with 100 μg/ml TRITC-labeled WGA (pH 7.2) and with 15 μg/ml HPA conjugated to TRITC (pH 7.4). Both lectins were purchased from Sigma. The coverslips were washed in PBS, mounted with n-propilgallate, and observed in an Axiovert S 100 microscope equipped with a KS300 image analyzer (Zeiss; Oberkochen, Germany).
Neuraminidase Treatment of Cells
Cells were grown as described above and, after achieving confluence, they were treated for 1 hr at 37C with 0.5 U/ml neuraminidase from Clostridium perfringens (Sigma) or with 10 mM Tris, pH 6.9, 140 mM NaCl, 10 mM CaCl2 as control. After treatment with neuraminidase, cells were washed and labeling for WGA was performed as detailed above.
Electron Microscopy
For localization of carbohydrate residues by transmission electron microscopy, cells were grown on polycarbonate filters (Transwell, 0.4 μm pore size). Cell monolayers were pre-fixed for 90 min at room temperature in a solution containing 1% glutaraldehyde, 8% sucrose, 5 mM CaCl2 in 0.1 M cacodylate buffer, pH 7.2. After pre-fixation, cells were washed three times in PBS and incubated for 2 hr with WGA and HPA labeled with 10 nm colloidal gold particles (Sigma), both diluted 1:30. After incubation, cells were washed five times and fixed for 1 hr in a solution containing 2.5% glutaraldehyde, 1% paraformaldehyde, 8% sucrose, 2 mM CaCl2 in 0.1 M cacodylate buffer, pH 7.2, at 37C. Post-fixation was carried out in 1% osmium tetroxide, 0.8% potassium ferricyanide, and 5 mM CaCl2. Cells were then washed, dehydrated with acetone, and embedded in Epon. Ultrathin sections were obtained, stained with uranyl acetate and lead citrate, and examined in a Zeiss CEM 900 transmission electron microscope.
High-resolution Field Emission Scanning Electron Microscopy
Cells were grown on glass coverslips until confluence was achieved. After washing with PBS, they were pre-fixed for 2 hr in a solution containing 1% glutaraldehyde, 8% sucrose, 5 mM CaCl2 in 0.1 M cacodylate buffer, then washed five times with PBS and incubated for another 2 hr with 10 nm gold-labeled HPA and WGA at their corresponding dilution and pH of incubation. After incubation, cells were washed five times with PBS and fixed for 1 hr at room temperature with 2.5% glutaraldehyde in 0.1 M cacodylate buffer. Post-fixation was carried out for 60 min in 1% osmium tetroxide and 0.8% potassium ferricyanide, 30 min with 1% tannic acid in 0.1 M cacodylate buffer and, finally, for 30 min with 1% osmium tetroxide and 0.8% potassium ferricyanide. Samples were then dehydrated in graded ethanols, critical point-dried in CO2, coated for 15 sec with carbon in a Penning sputter system in a high-vacuum chamber (Gatan model 681), and viewed in a JEOL-JSM-6340F field emission scanning electron microscope at an acceleration voltage of 10 kV and a working distance of 8 mm. Images were obtained using secondary and backscattered electrons.
Quantification of Lectin-Gold Labeling
The quantification was performed on cells labeled with WGA and HPA. Images visualized by high-resolution field emission scanning electron microscopy using secondary and backscattered electron imaging were taken at a magnification of ×40,000 diameters. The area of cell surface regions was measured manually and the labeling intensity was expressed as the number of gold particles/500 nm2 of cell surface in 30 fields observed for each cell line. Statistical evaluations were performed using a t-paired test.
Isolation of Plasma Membrane Fractions
Membrane fractions were obtained as described by Graham (1997). Cells were washed briefly three times with PBS, removed from the flasks with a rubber policeman in buffer A (10 mM Tris-HCl, pH 7.4, 250 mM sucrose, and 1 mM MgCl2) and harvested by centrifugation in a Sorvall Super T21 centrifuge (SL-50T rotor) at 1500 × g for 10 min. Then the cells were resuspended in buffer A and disrupted with 40 strokes in a Potter-type homogenizer. Cell disruption was monitored by phase-contrast microscopy. Cells lysates were centrifuged for 5 min at 1500 × g and the pellet containing unbroken cells and nuclei was discarded. The resultant post-nuclear supernatant (PNS) was harvested and centrifuged for 10 min at 10,000 × g. The pellet obtained was resuspended in buffer A and two volumes of buffer B (10 mM Tris-HCl, pH 7.4, 2.0 M sucrose, and 1 mM MgCl2) were added to the solution and homogenized with a Potter-type homogenizer. This solution (4 ml) was loaded at the bottom of ultracentrifuge tubes and overlaid with 1 ml of buffer A. This gradient was centrifuged in a Beckman L8–70M ultracentrifuge at 113,000 × g for 1 hr using a Beckman SW 50.1 rotor (Palo Alto, CA). The interface formed, corresponding to the desired plasma membrane fraction, was carefully collected with a Pasteur pipette and diluted with buffer A, collected by centrifugation at 95,000 × g for 30 min in a Beckman Type 60 Ti rotor, and used for subsequent analysis. All procedures were performed at 4C. Electron microscopic analysis of these fractions showed that they appeared as long membrane sheets without organelle contamination, such as mitochondria and nuclei.
Protein Determination
Protein content was estimated using the standard Bio-Rad Protein Assay Reagents kit with bovine serum albumin (Bio-Rad Technologies; Hercules, CA).
Electrophoretic Analysis and Lectin Blotting
Proteins of plasma membrane fractions were electrophoretically separated by SDS-PAGE in a 10% gel (Laemmli 1970) and transferred to nitrocellulose sheets using a semidry transfer cell at 10 V for 60 min (Towbin et al. 1979). Then the nitrocellulose membranes were blocked for 1 hr with a solution containing 2 mM Tris-HCl, pH 7.0, 1% BSA, and 0.1% Tween-20. The nitrocellulose sheets were incubated for 2 hr with peroxidase-conjugated WGA and HPA diluted 1:100 in blocking buffer, and proteins were visualized with an enhanced chemiluminiscence kit (Amersham Pharmacia Biotech; Poole, UK) and autoradiography.
Results
Analysis of Glycoconjugate Residue Expression by Fluorescence Microscopy
Cells were grown on glass coverslips and, after achieving confluence, they were processed for fluorescence microscopic analysis. Figure 1 shows the labeling on the cell surface of IEC-6 (Figures 1A and 1B), Caco-2 (Figures 1C and 1D), and HCT-116 (Figures 1E and 1F) cells using WGA and HPA lectins, respectively. IEC-6 cells were largely unlabeled by these lectins. Caco-2 cells displayed labeling for both lectins, but with a different pattern between them. WGA showed heavy labeling on the cell surface, including microvilli and cell-cell contacts (Figure 1C), while HPA staining was punctate and intense on the cell surface (Figure 1D). Intense labeling with WGA in HCT-116 was detected at the whole cell surface, microvilli, and intercellular junctions (Figure 1E), whereas HPA was seen mainly at the cell border and with minor intensity (Figure 1F). All binding reactions were inhibited or greatly reduced by the addition of appropriate sugars (sialic acid and N-acetylgalactosamine) or unlabeled lectins to the incubation medium (not shown). We further confirmed the specificity of WGA lectin for sialic acid residues by treating the cells with neuraminidase and analyzing them by fluorescence microscopy. Figure 2 shows loss of the WGA labeling profile in Caco-2 (Figure 2B) and HCT-116 (Figure 2D) cells that were treated with neuraminidase compared with untreated cells (Figures 1A and 1C, respectively).
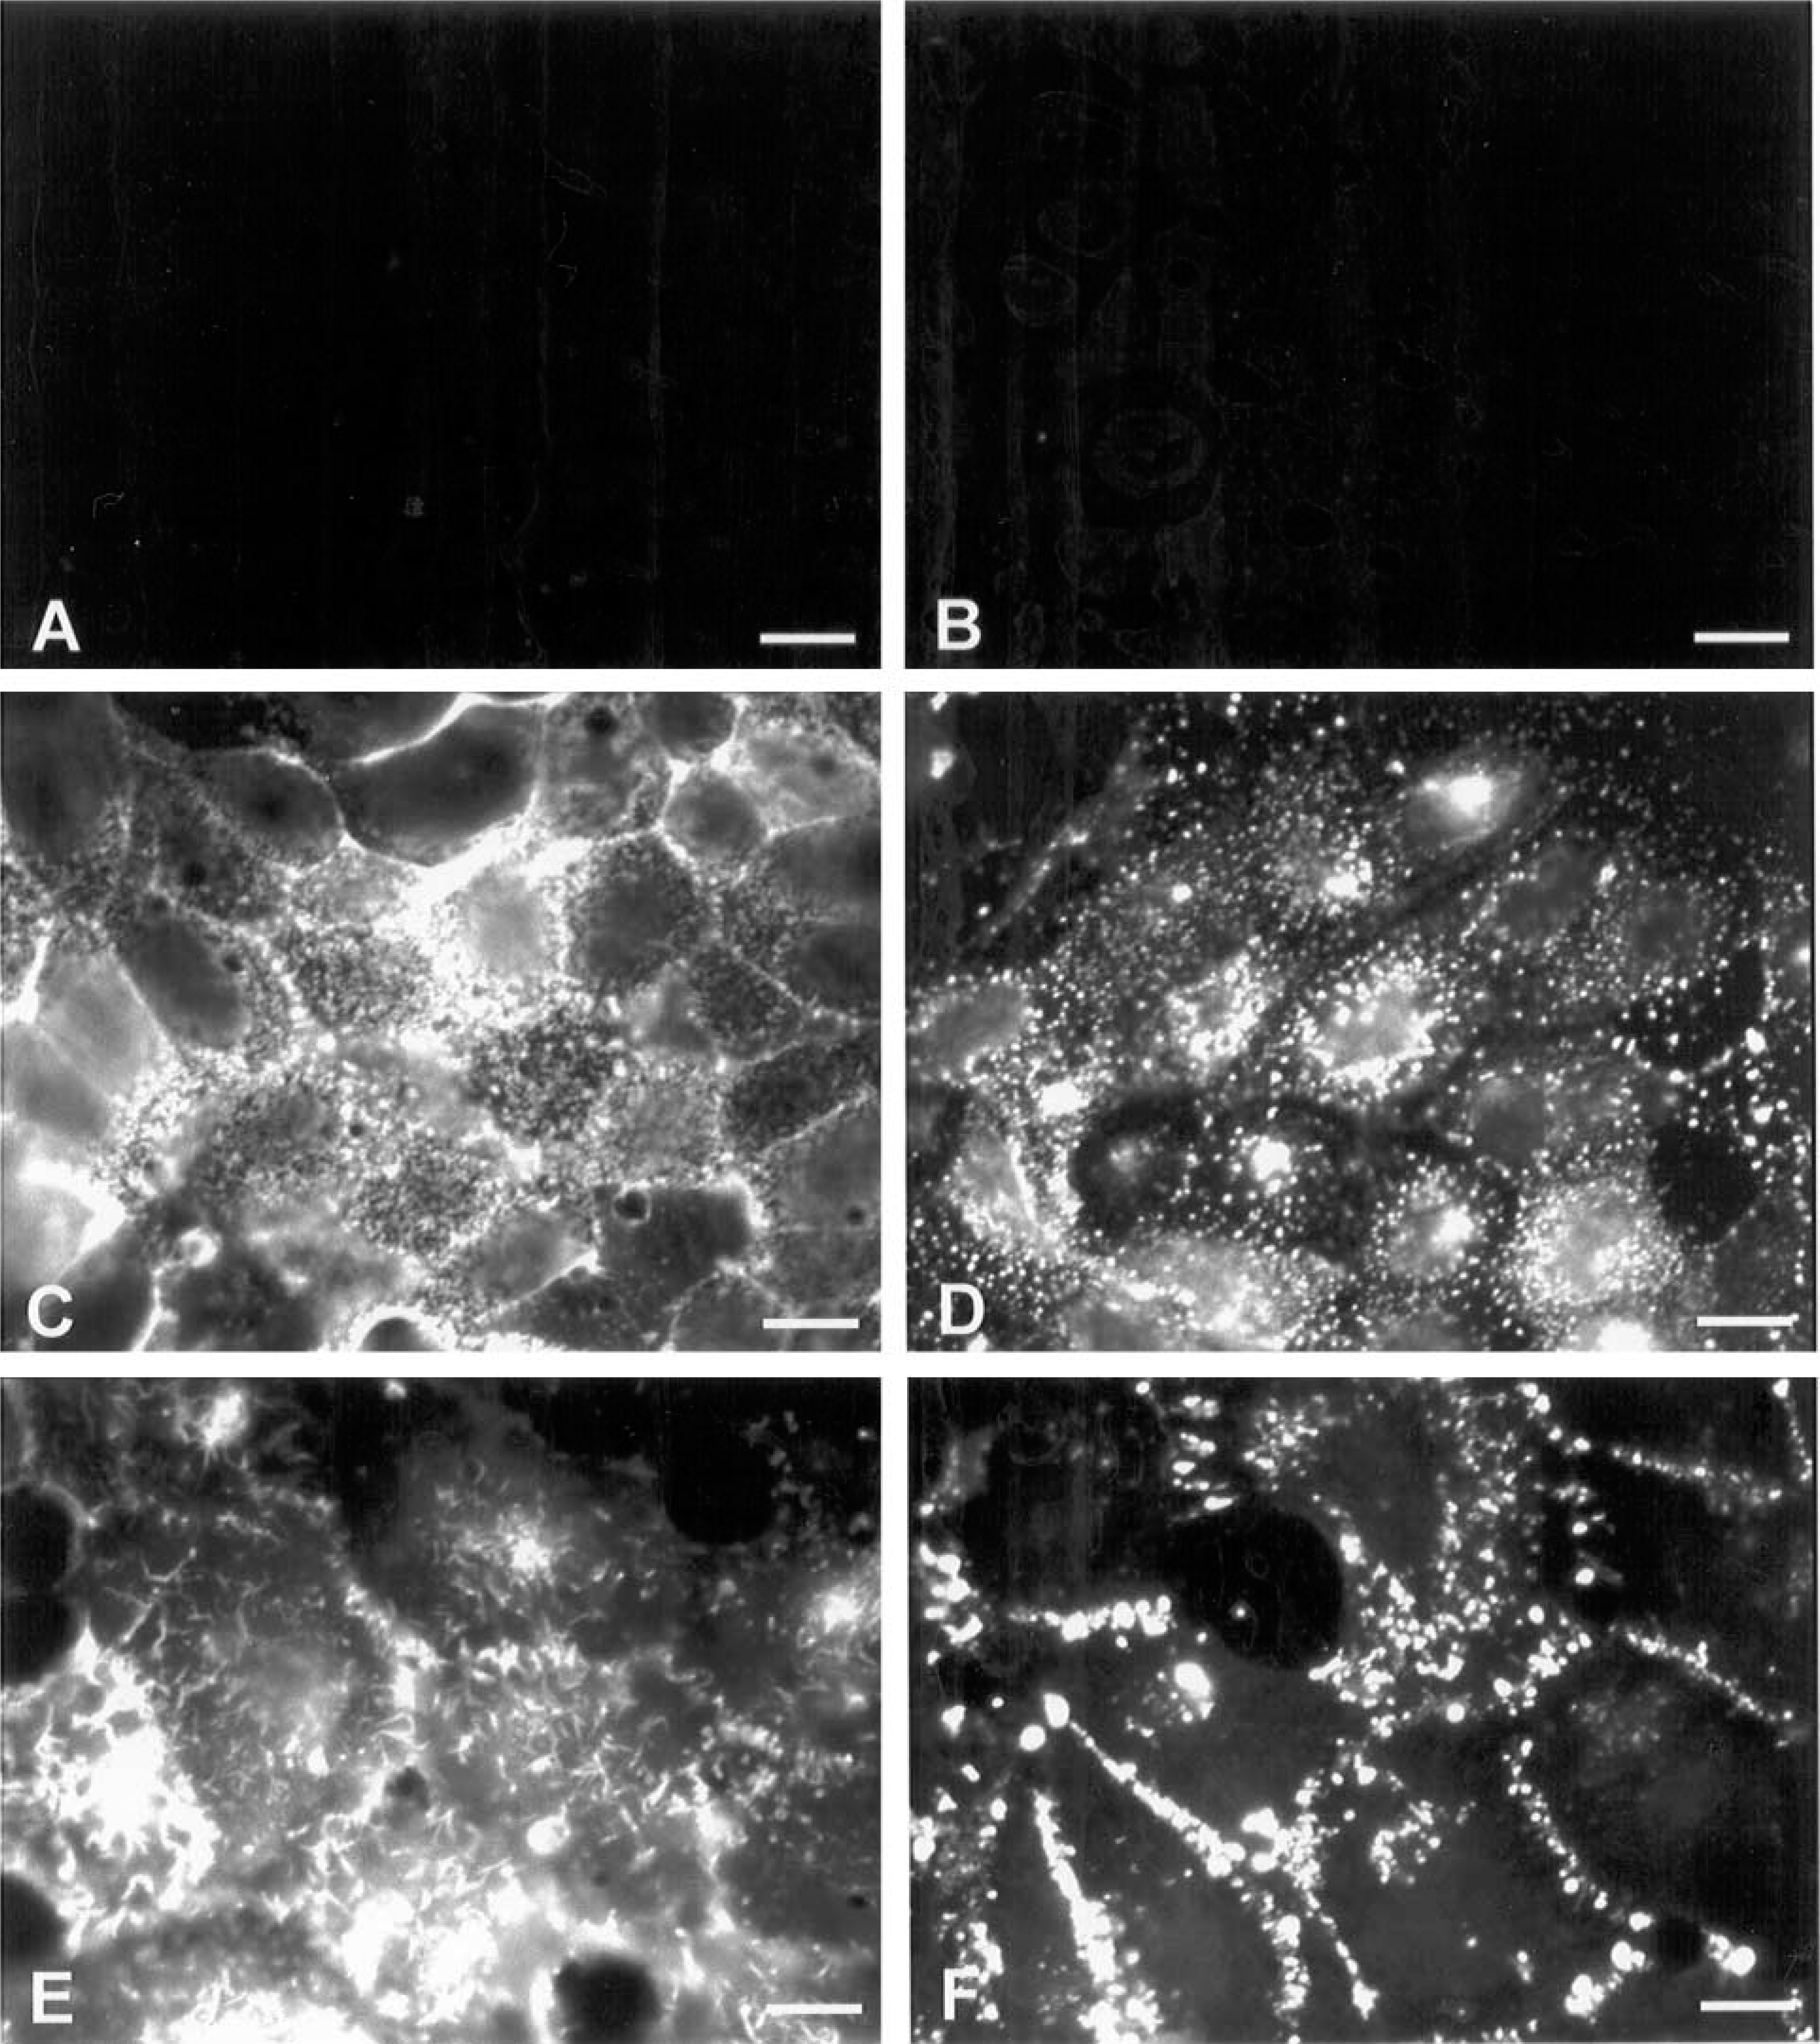
Fluorescence images of IEC-6, Caco-2, and HCT-116 cells after incubation with TRITC-labeled WGA and HPA lectins. Cells were previously fixed and labeled with the lectins. (
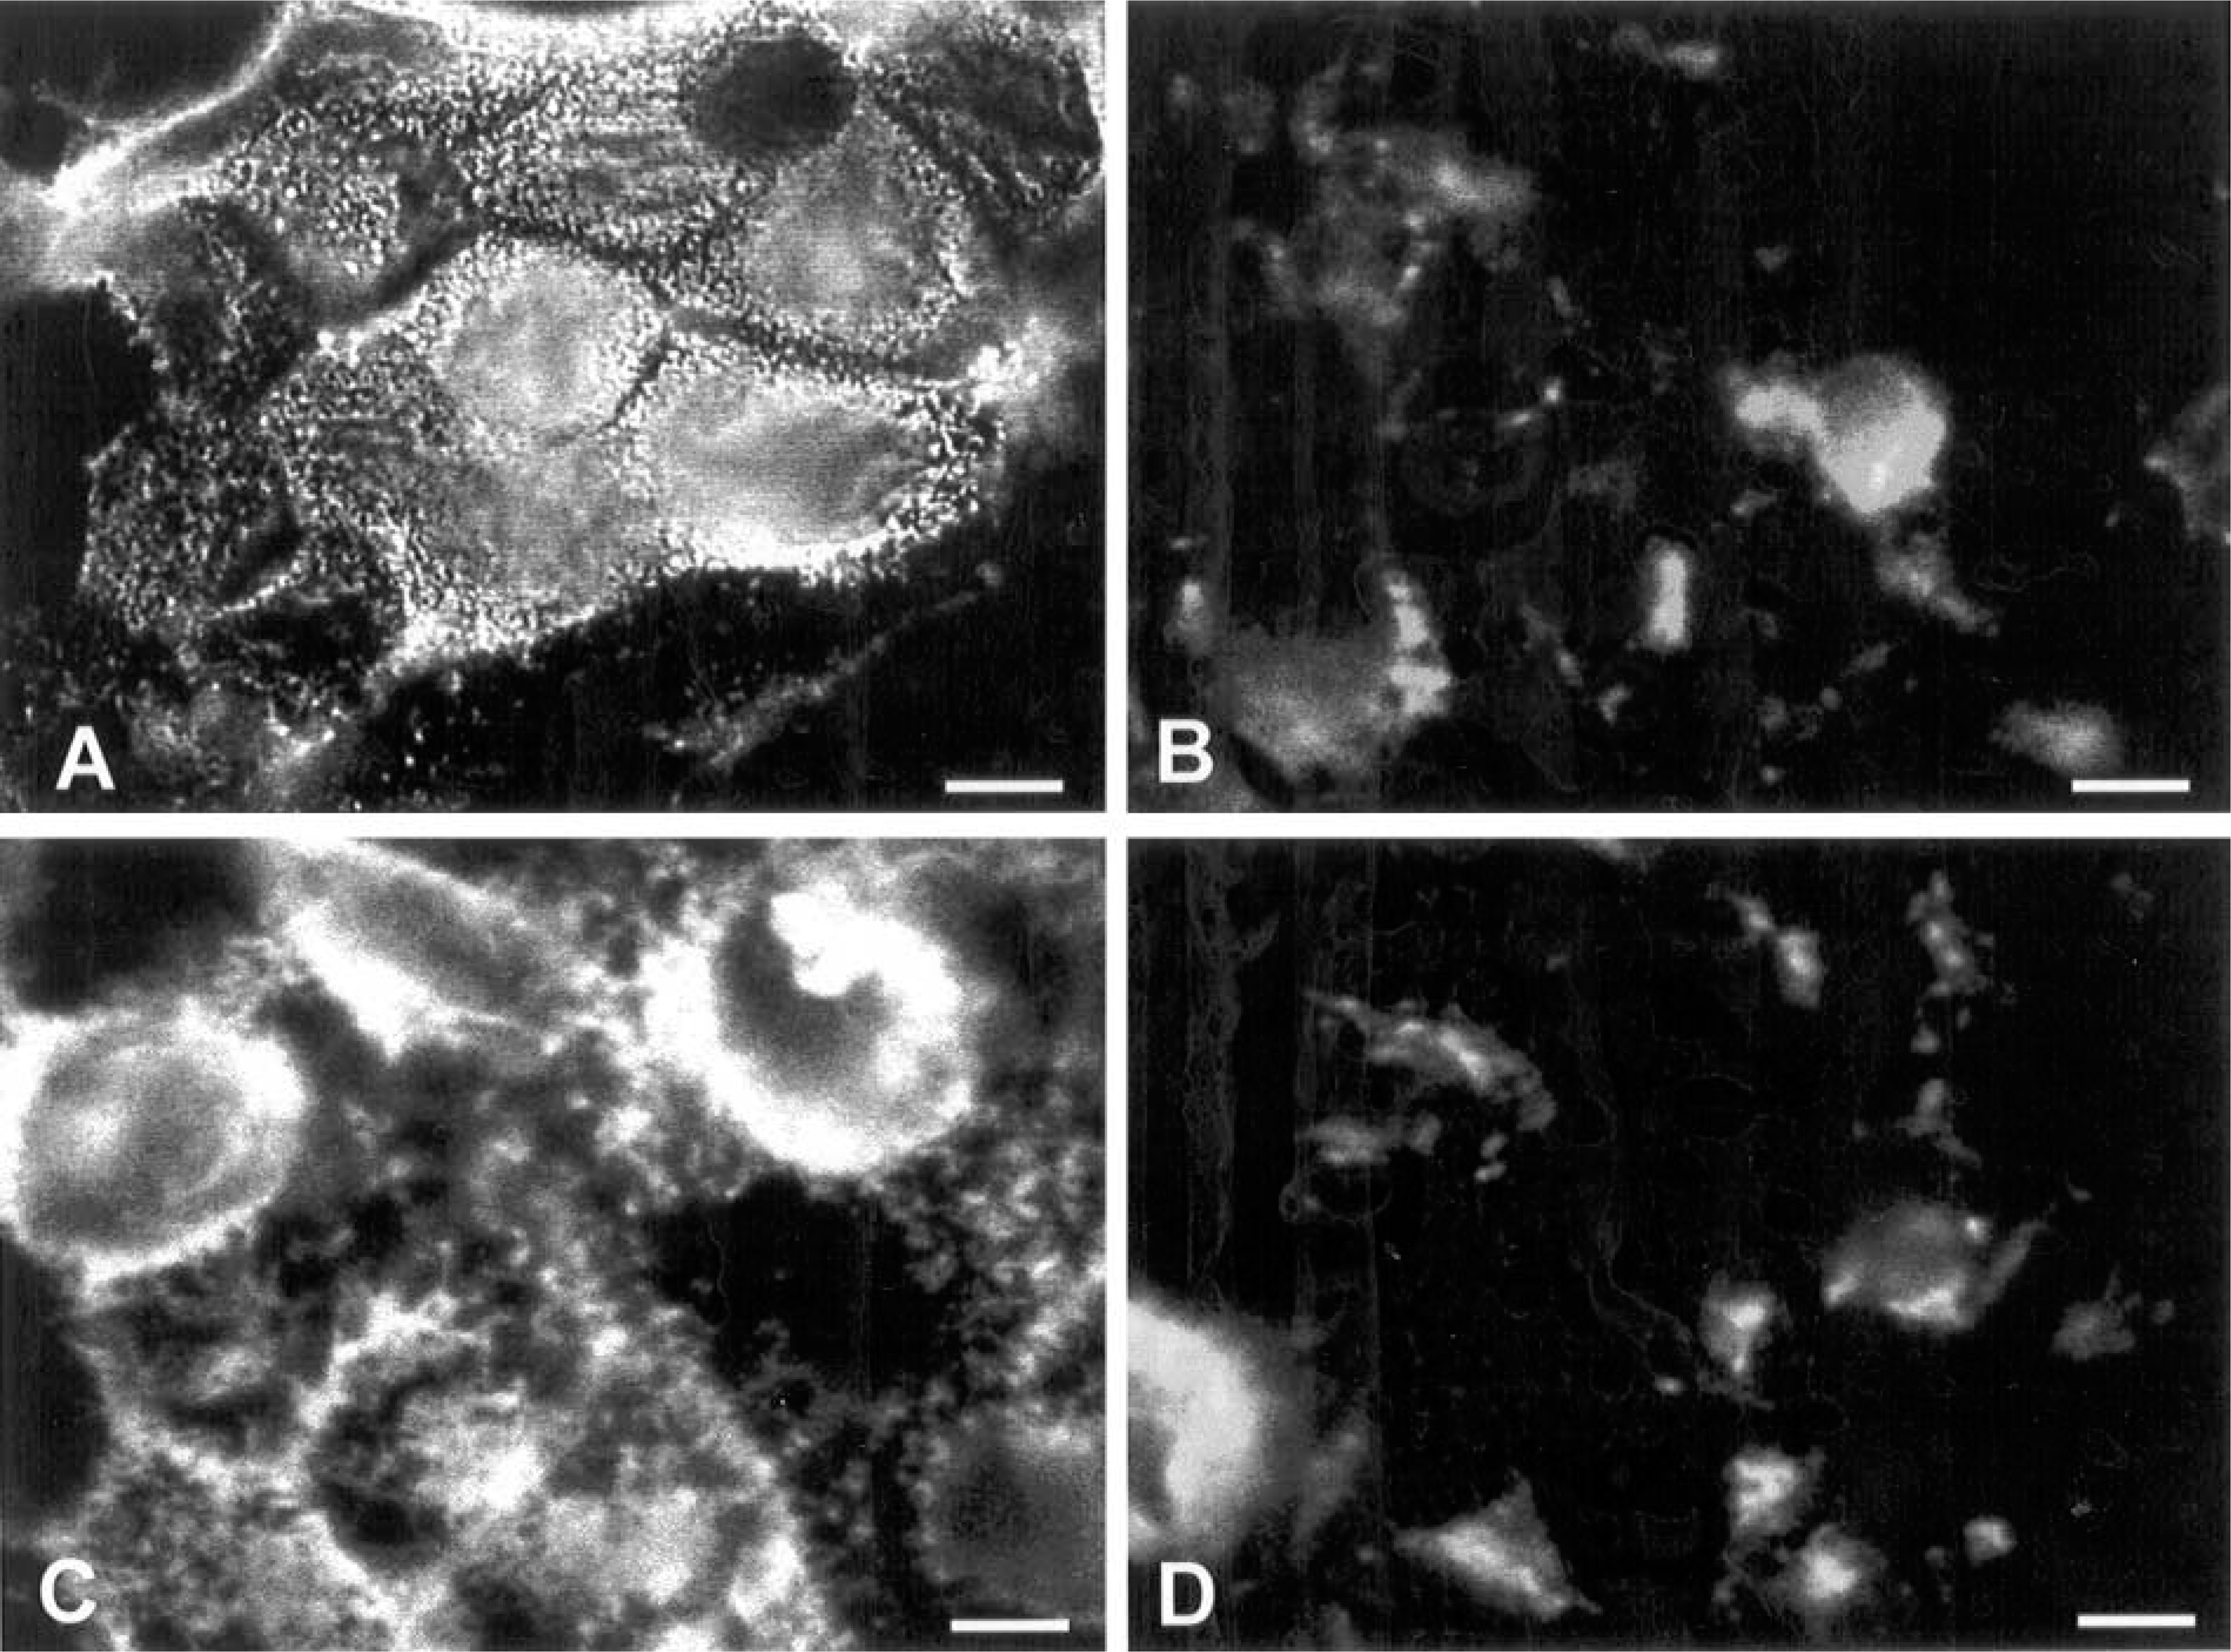
Fluorescence images of Caco-2 and HCT-116 cells labeled with TRICT-WGA before (
Labeling with Gold-conjugated Lectins Detected by Transmission Electron Microscopy
After reaching confluence, cells were processed for analysis by the pre-embedding technique using gold-conjugated lectins. Very little or no labeling was observed in IEC-6 cells and apparently different labeling in Caco-2 and HCT-116 cells for WGA and HPA lectins (Figure 3), corroborating the results obtained by fluorescence microscopy. Other lectins known to be specific for certain linkages of sialic acid residues, such as Limax flavus (LFA) and Sambucus nigra (SNA) agglutinins, showed no labeling with this technique (data not shown). On the basis of these results, we decided to focus the analysis of WGA and HPA lectins using quantitative scanning electron microscopy with gold-labeled lectins and biochemical analysis of enriched plasma membrane fractions of the three cell lines.
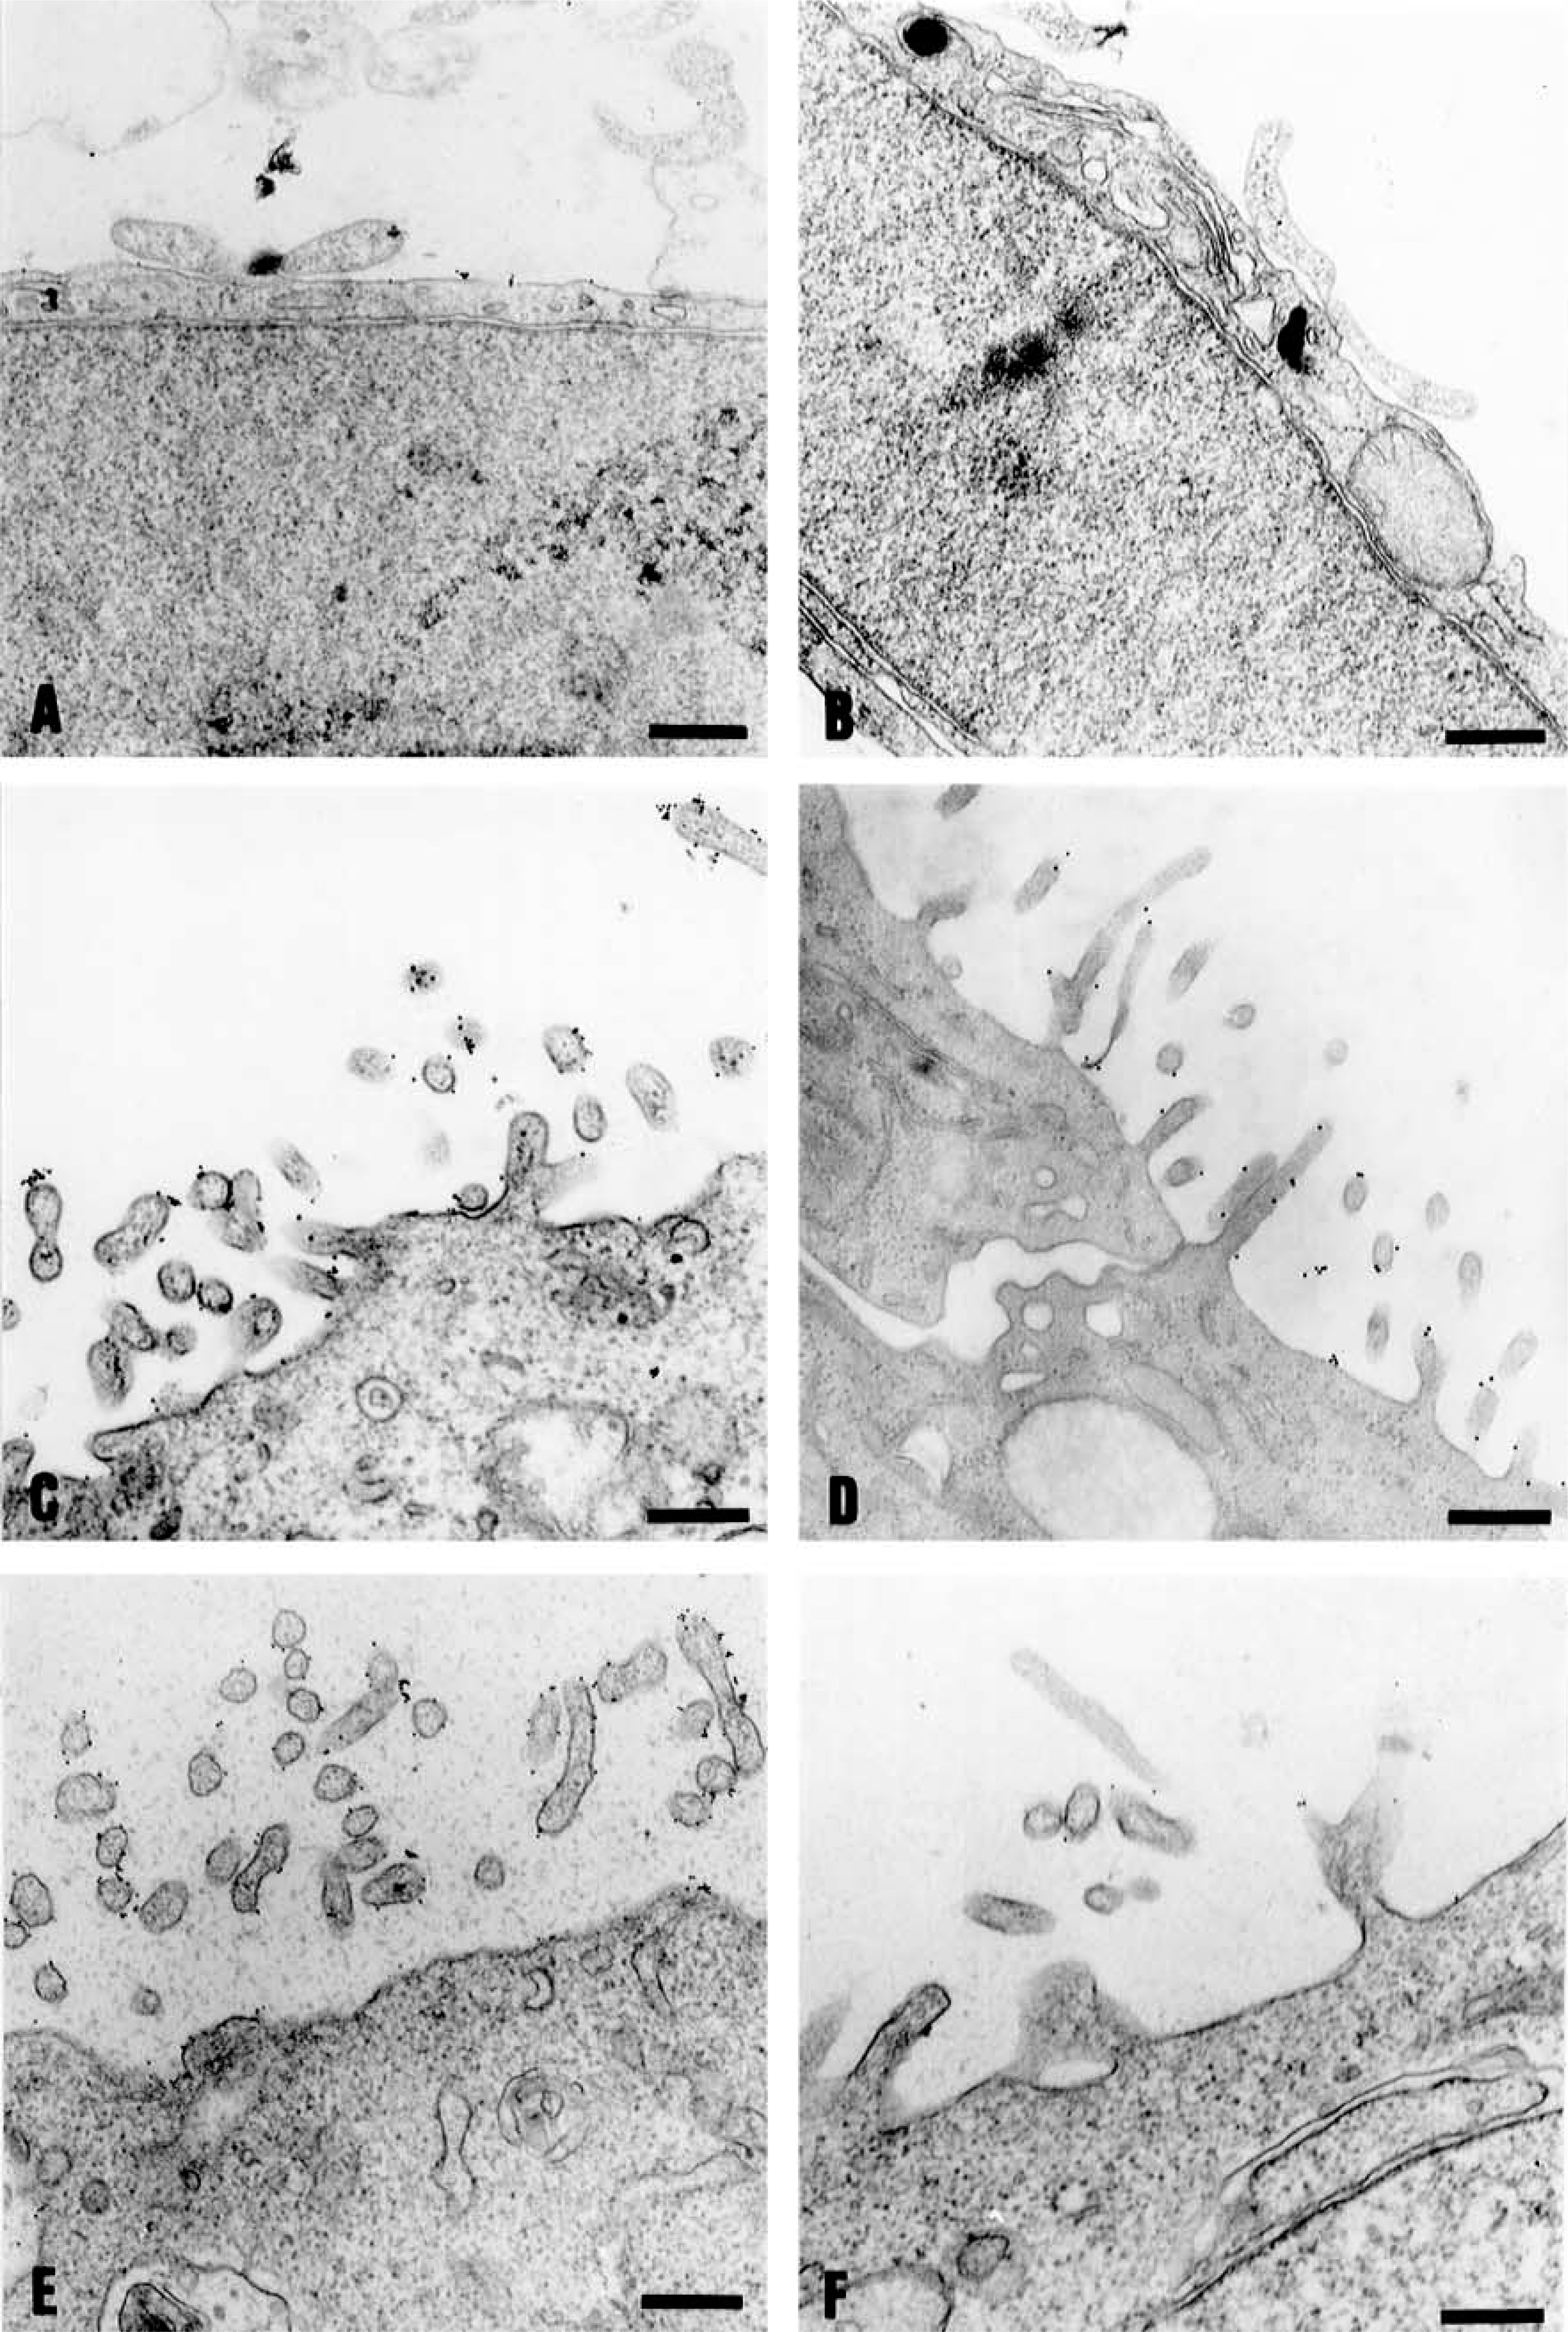
Transmission electron microscopy showing the distribution of binding sites for WGA and HPA on the surface of IEC-6 (
High-resolution Scanning Electron Microscopy and Labeling Evaluation
High-resolution scanning electron microscopy allows the observation of fine details on the cell surface and intracellular structures (Joy and Pawley 1992; Müller et al. 2000). The use of this approach and high-resolution images obtained using backscattered electrons of samples incubated with gold-labeled probes is the most suitable technique now available to examine and quantify larger areas of the cell surface. Incubation of cells in the presence of WGA and HPA lectins labeled with colloidal gold particles led to labeling of their surfaces. It was possible to observe a pronounced difference in labeling intensity on the cell surface of the three cells investigated. Sialic acid and N-acetylgalac tosamine residues, as detected using gold-labeled WGA and HPA, respectively, were present in low quantities in IEC-6 cells, whereas in Caco-2 and HCT-116 cells they were abundant. However, differences of labeling intensity among them could be observed (Figures 4 and 5; Table 1). A significant increase in WGA labeling was observed in HCT-116 compared with Caco-2 and IEC-6 cells (Figures 4B, 4D, and 4F; Table 1). The intensity of cell surface labeling with HPA was not significant when Caco-2 and HCT-116 cells were compared, but remained significantly higher in relation to IEC-6 (Figures 5B, 5D, and 5F; Table 1).
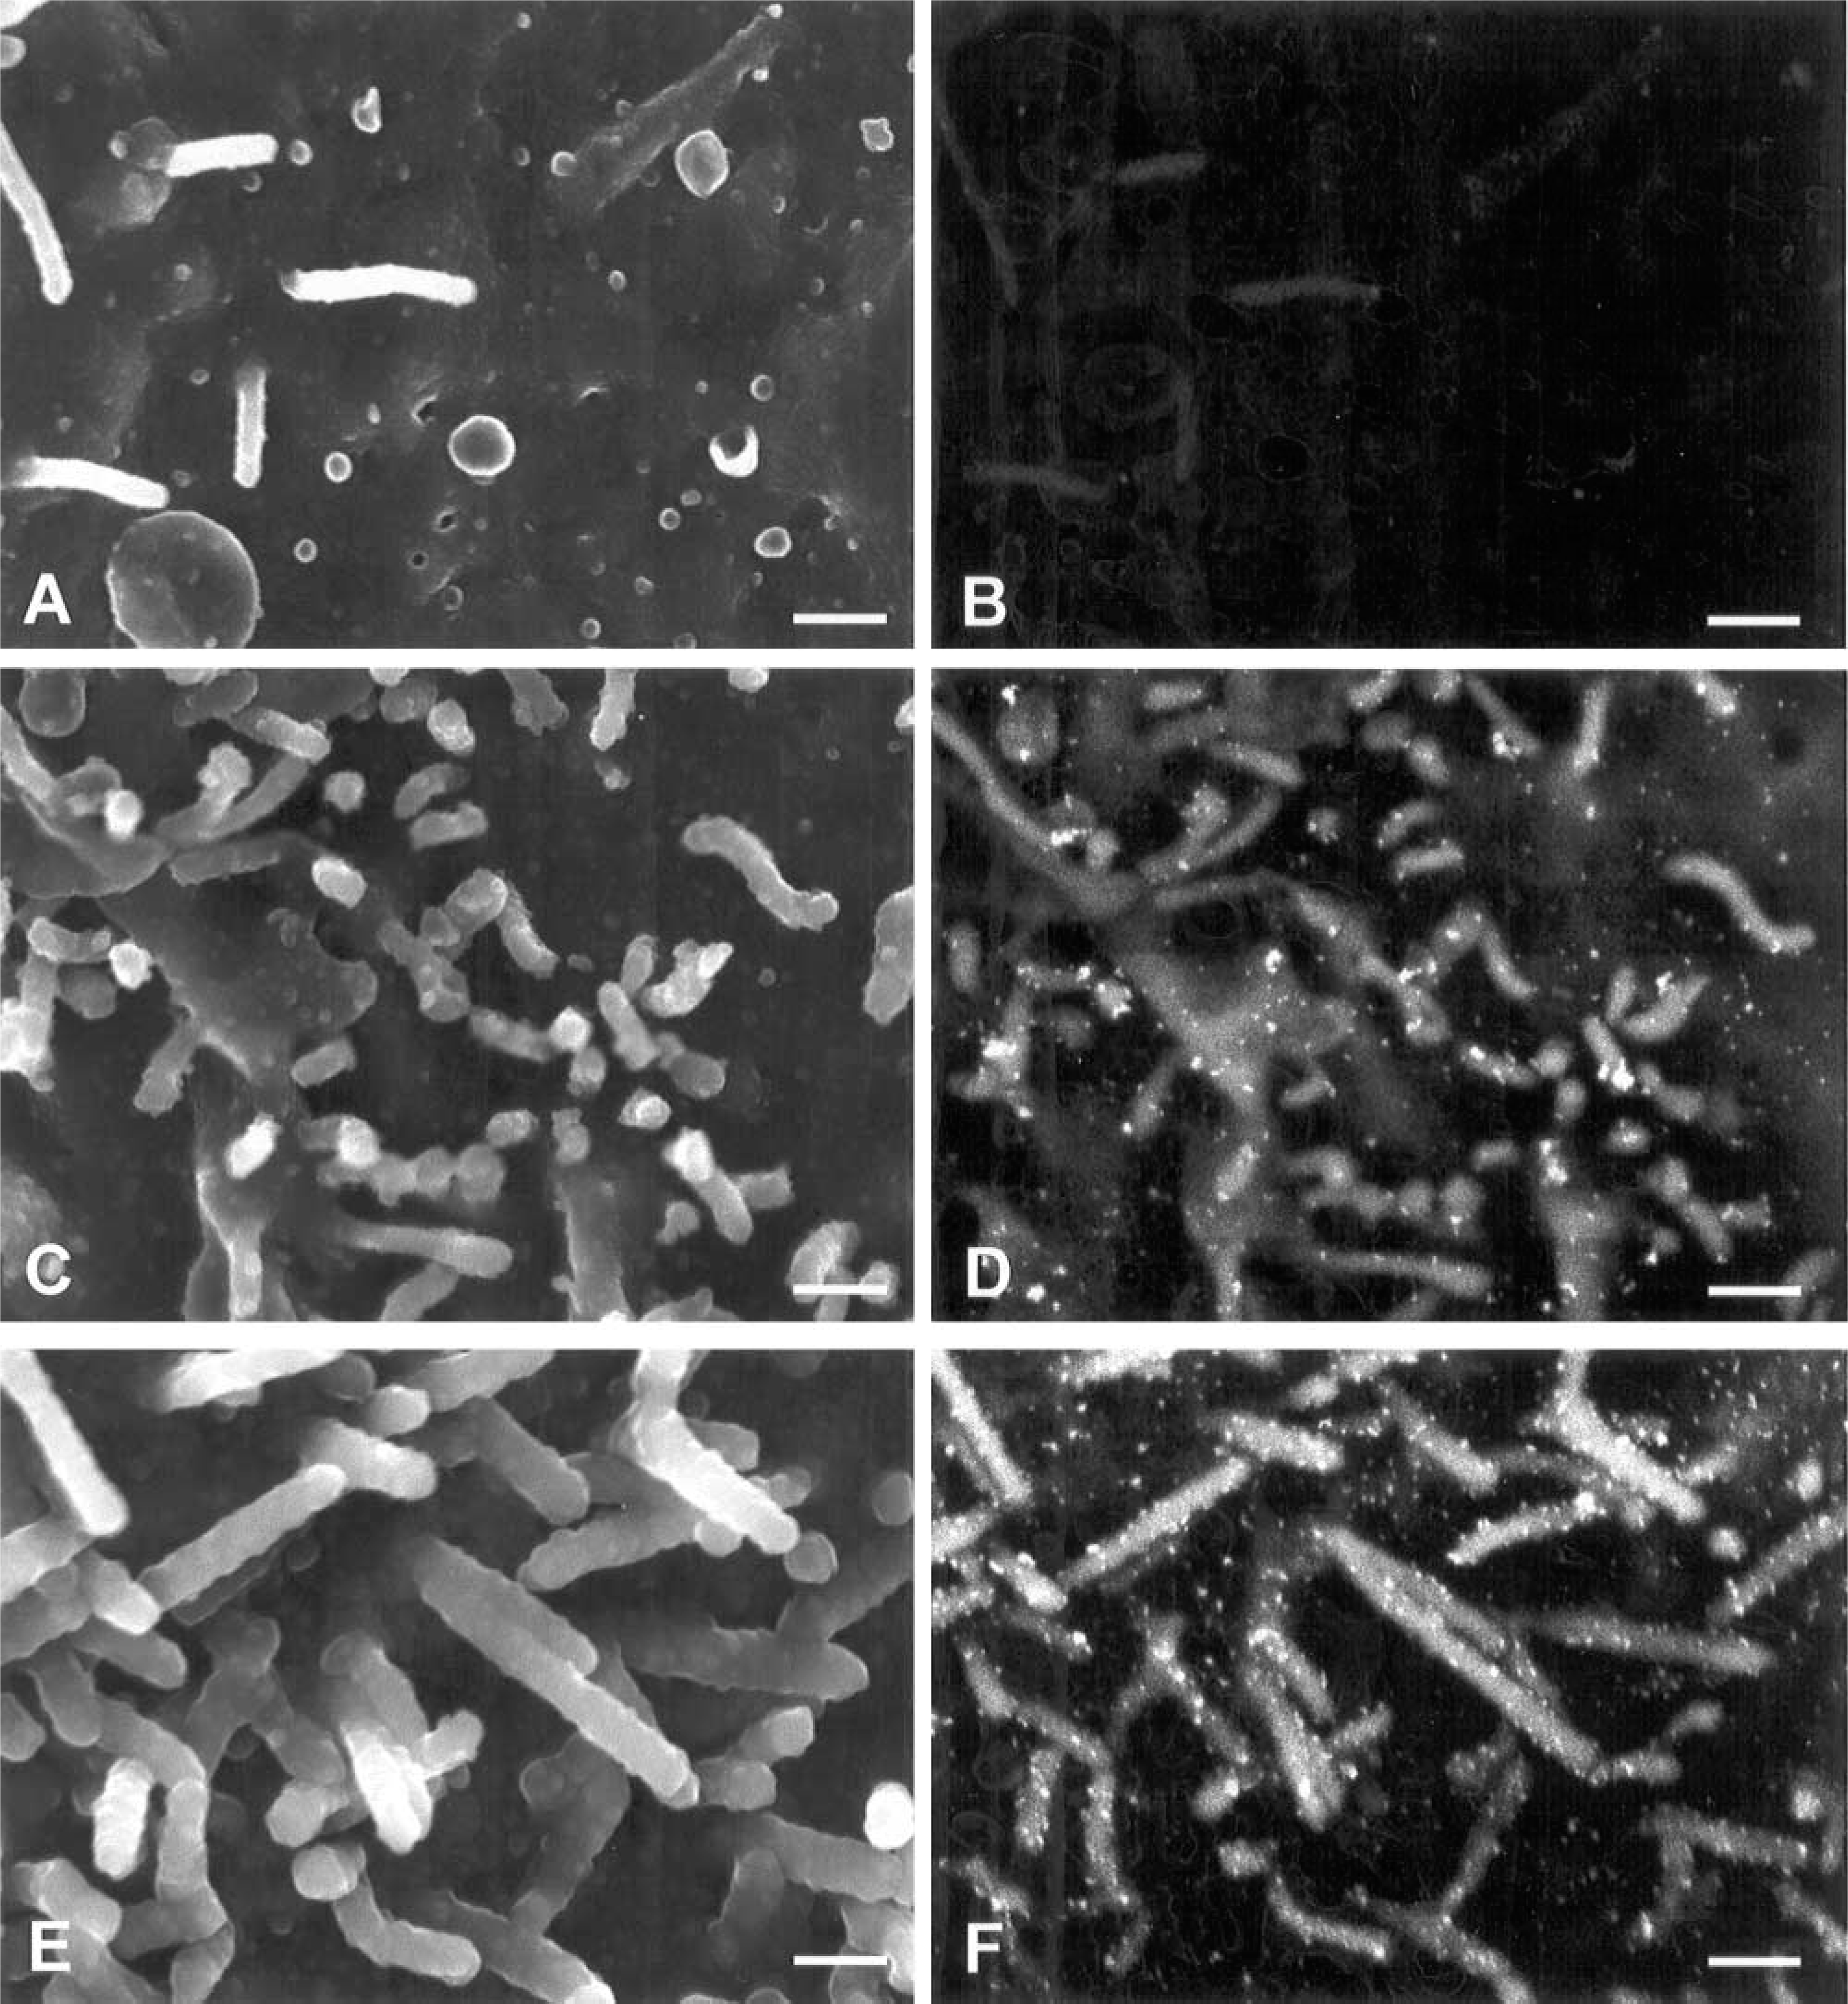
Cell surface views of IEC-6 (
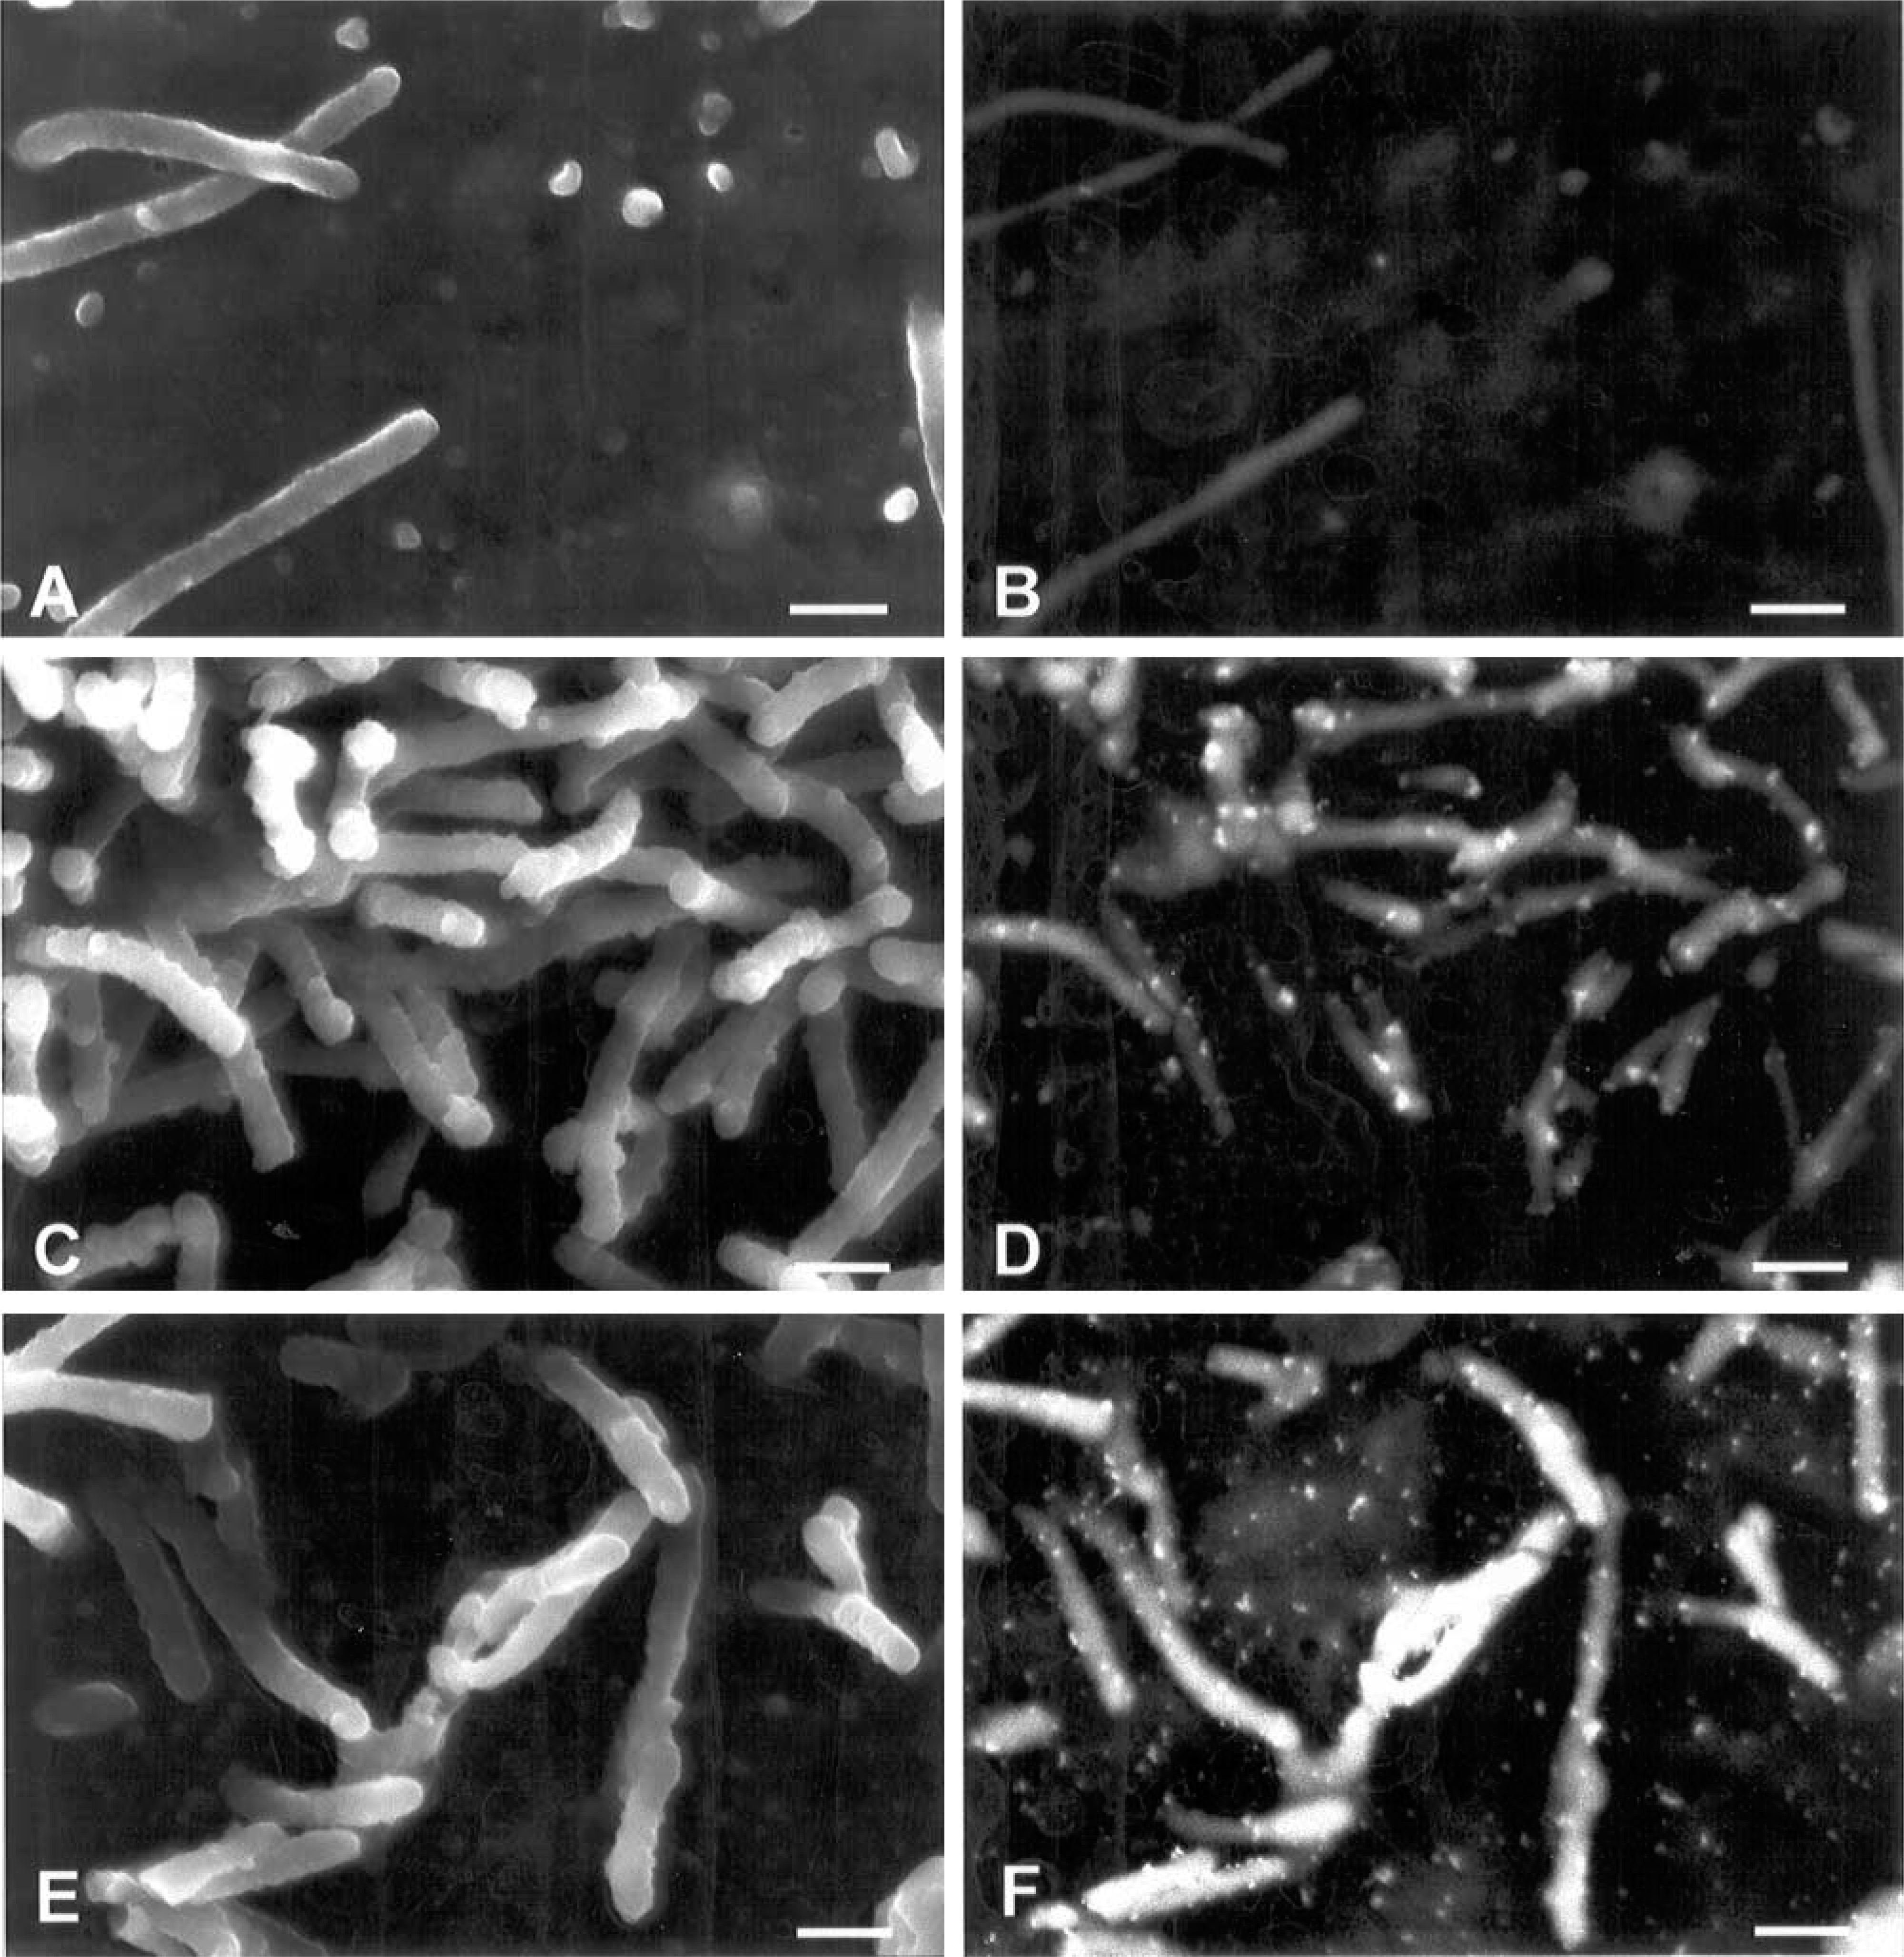
Cell surface views of IEC-6 (
Density of cell surface labeling by gold-labeled lectins in IEC-6, Caco-2, and HCT-116 cells with high-resolution field emission scanning electron microscopy
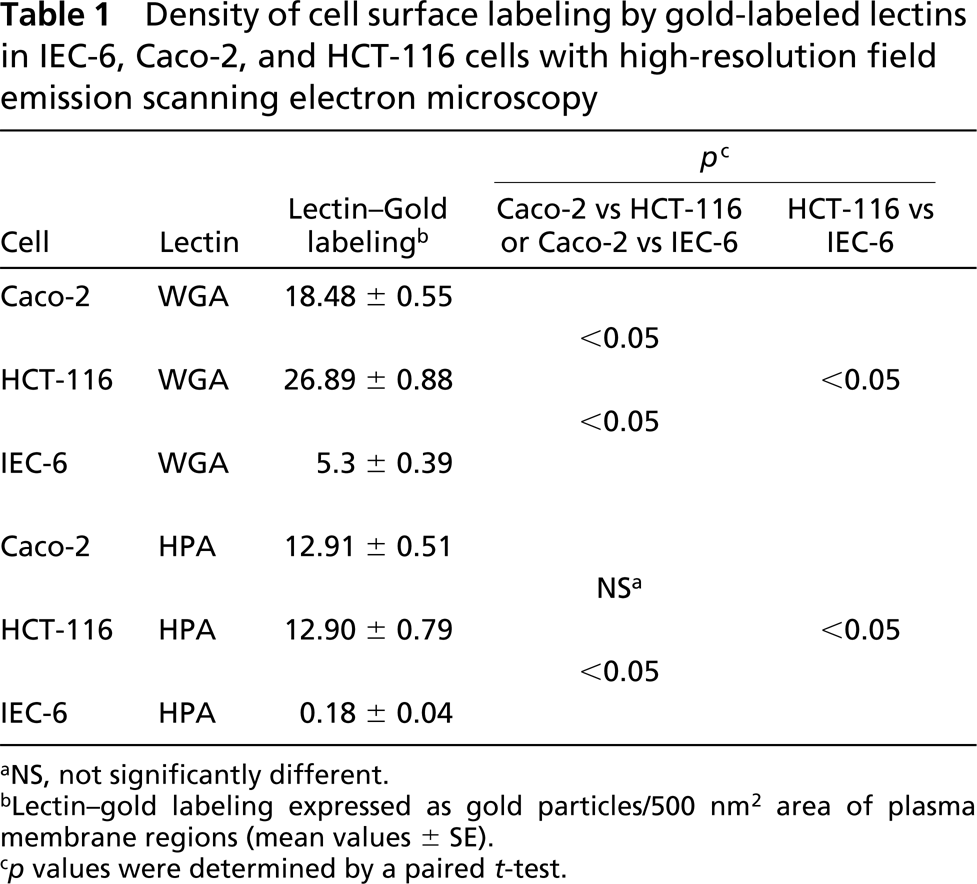
NS, not significantly different.
Lectin-gold labeling expressed as gold particles/500 nm2 area of plasma membrane regions (mean values ± SE).
p values were determined by a paired t-test.
SDS-PAGE and HPA and WGA Lectin Blotting
SDS-PAGE analysis of the polypeptide composition of enriched plasma fractions of IEC-6, Caco-2, and HCT-116 cells demonstrated differences in composition among them. However, some common protein bands were also present. Major proteins ranging from 18 to ∼98 kD could be visualized by silver staining (Figure 6A). Similarly, differences in composition of HPA- and WGA-binding glycoproteins were present in the enriched plasma membrane fraction of cells (Figures 6B and 6C). Three HPA-binding bands of 35, 25, and 21 kD were mainly detected in samples of IEC-6 cells. A range of eight HPA-binding glycoproteins with molecular masses of 66, 34, 32, 25, 21, 20, 17, and 16 kD were present in the plasma membrane of Caco-2 cells, whereas HCT-116 cells displayed glycoprotein bands of 36, 32, 25, 20, 17, and 16 kD. It was possible to identify HPA-binding glycoproteins with the same molecular mass in the cells, but a marked difference in levels of expression, particularly those of 25 kD, was observed (Figure 6B). WGA-binding glycoproteins with different levels of expression were also observed. A minor band of 66 kD and a major band of 50 kD were mainly observed in IEC-6 cells, whereas a range of major WGA-binding proteins, from 97 kD to 18 kD, was observed in Caco-2 and HCT-116 cells. However, a visibly higher expression of these glycoproteins was detected in HCT-116 cells, in particular those of 95, 66, and 48 kD (Figure 6C).
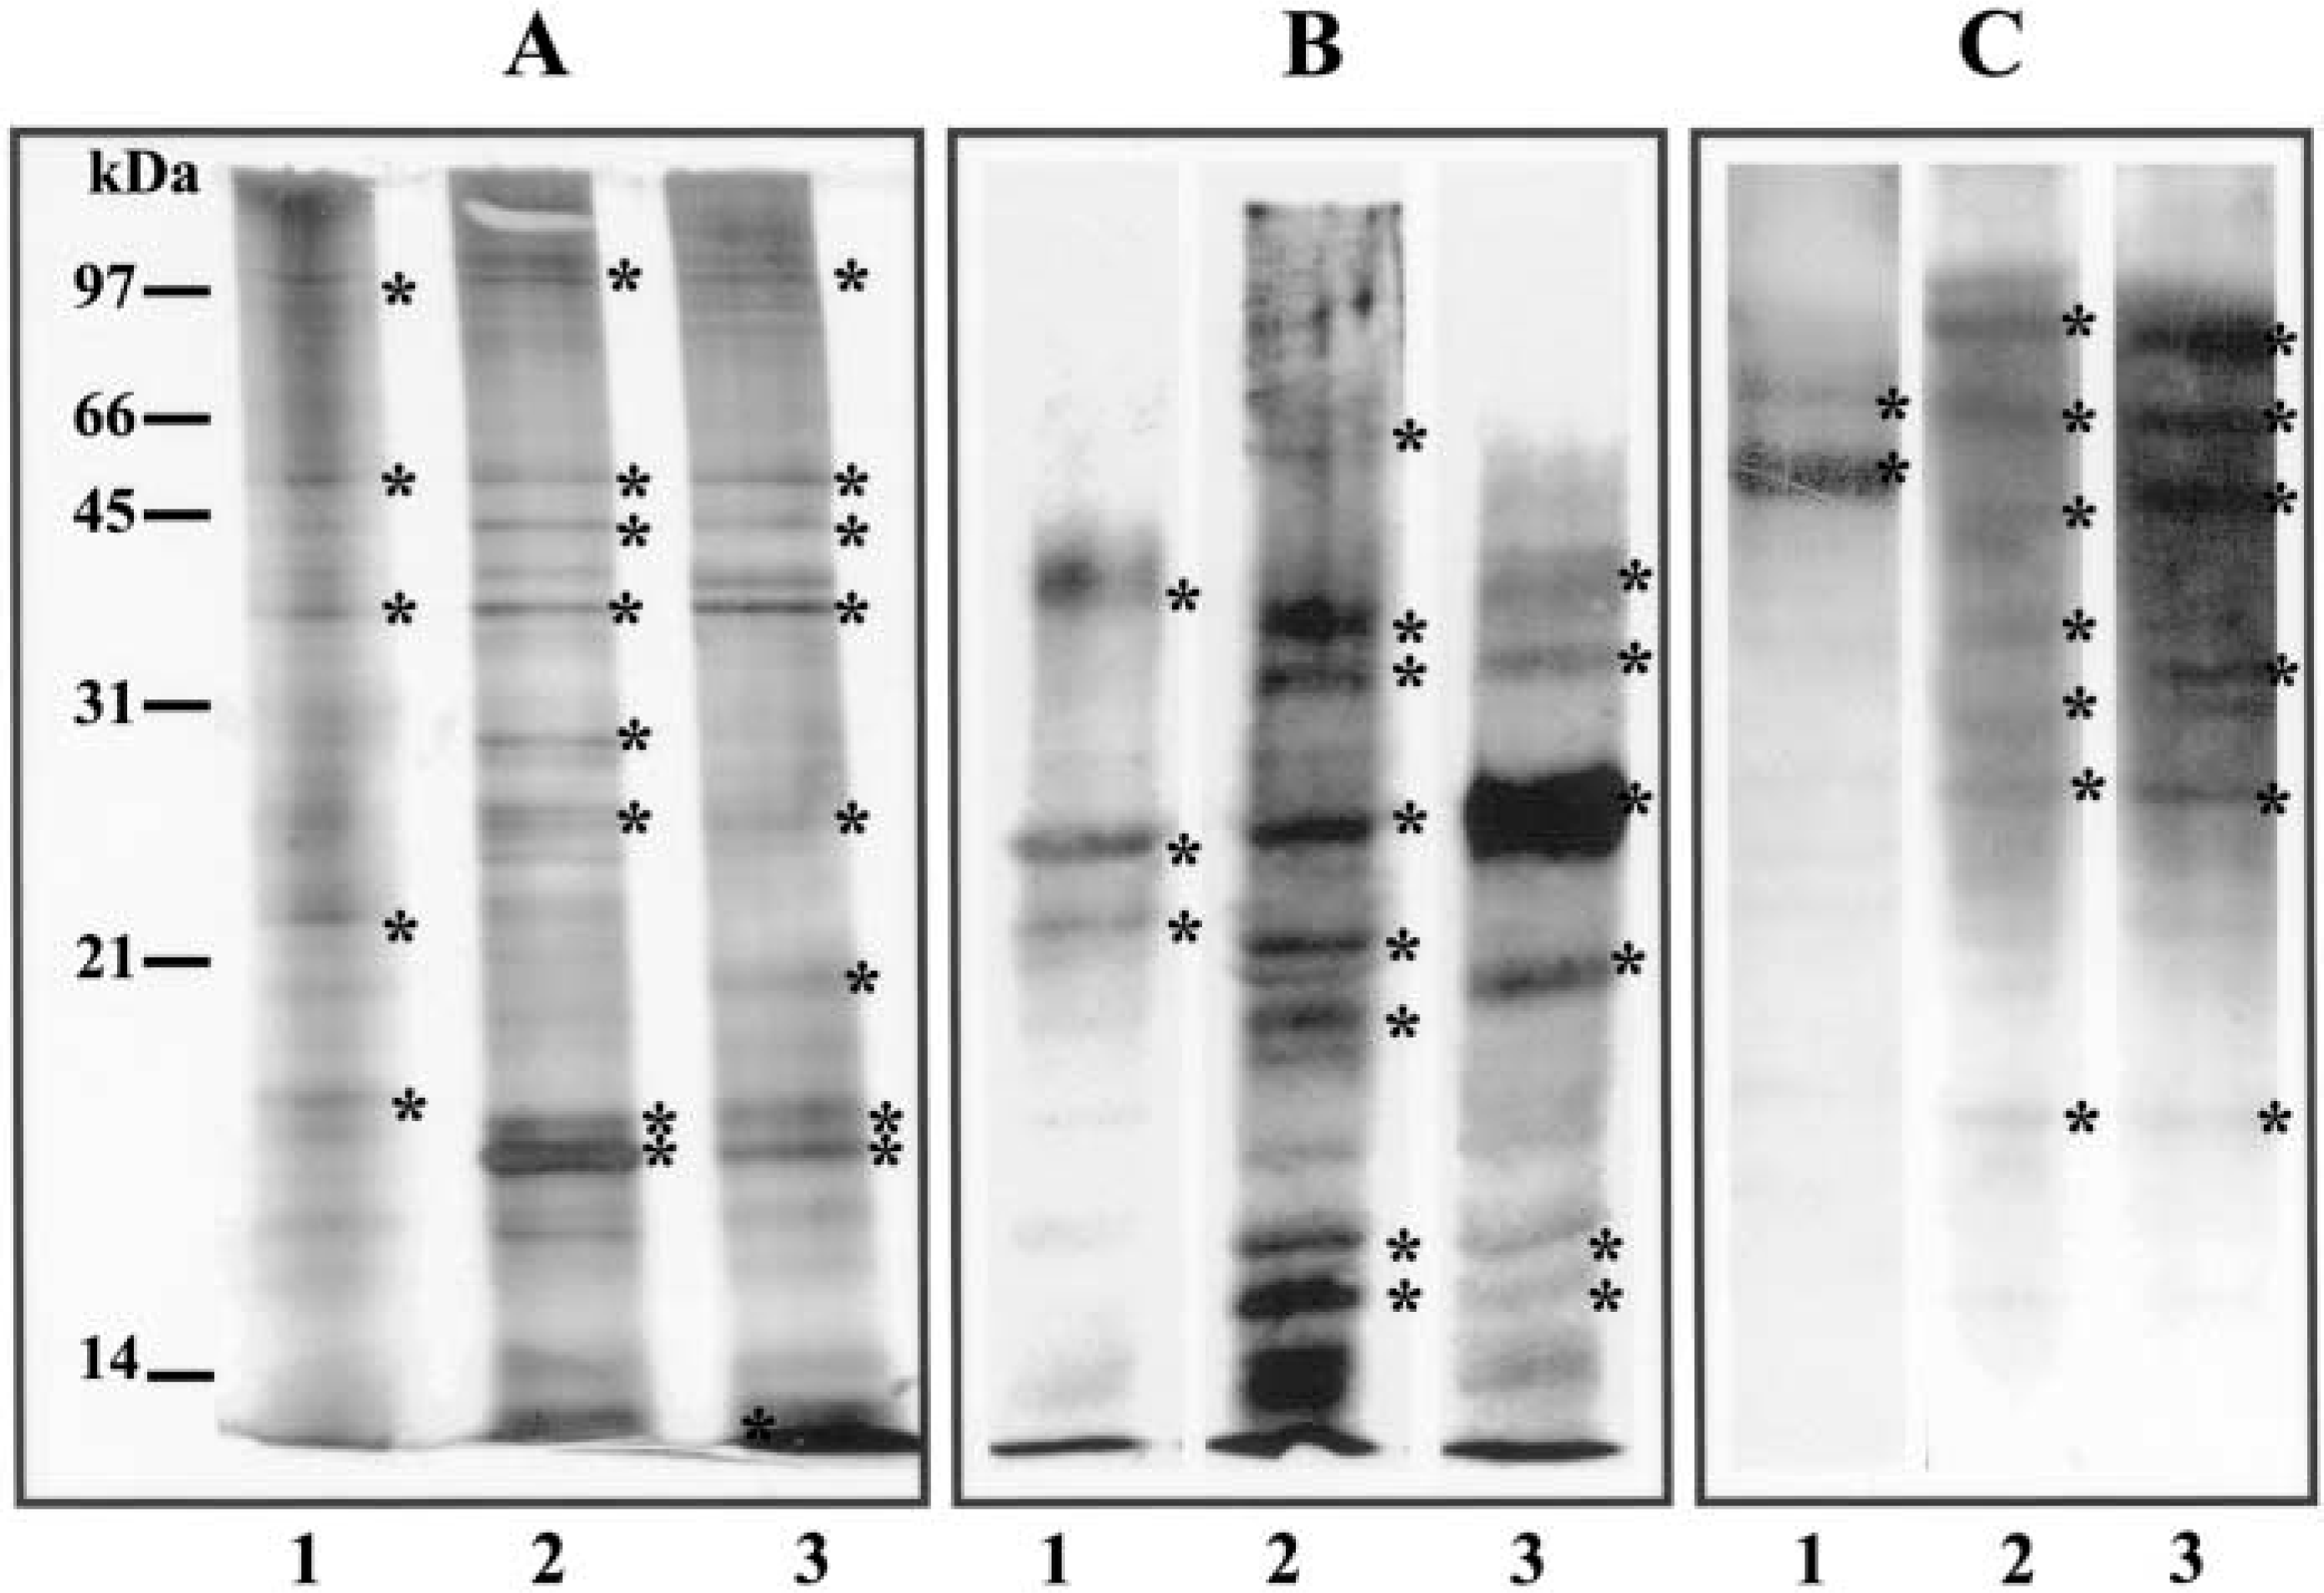
Comparative protein profiles of plasma membrane fractions (
Discussion
Previous studies using epithelial cancer cells have shown that variations in the expression of glycoconjugates on the cell surface play an important role during cell differentiation and malignant transformation. The cell lines used in this study were chosen because they represent a range of intestinal epithelial sources, from normal (IEC-6) to moderately malignant (Caco-2) and highly metastatic (HCT-116) cells. Although the IEC-6 cell line is not derived from the colon, it is the most well-characterized normal intestinal cell line and has been widely used to compare several properties with those of colon epithelium (Quaroni et al. 1979; McKaig et al. 1999).
Lectin cytochemistry using light and electron microscopy revealed that the cells displayed variable degrees of HPA and WGA binding, ranging from light binding in cells derived from normal intestine epithelium to intense binding in those derived from metastatic colon adenocarcinoma. Recently, the expressions of α-N-acetylgalactosamine and sialic acid residues have emerged as interesting markers for altered glycosylation in cancer, in which expression of glycoconjugates recognized by specific lectins appears to be associated with patient prognosis.
There are few studies on the features of HPA binding to tumor tissues in the gastrointestinal tract. Macartney (1986) studied the lectin histochemistry of GalNAc residues in gastric cancer using GalNAc-specific lectins, such as HPA, DBA, and soybean agglutinin. Among these lectins, HPA showed the most widespread staining on tumor cells. However, no correlation was found between HPA expression and stage of tumor differentiation. Kakeji et al. (1991) have reported that positive HPA staining correlated with lymphatic invasion, metastasis, and poor prognosis. It was also demonstrated that the histochemical expression of HPA in tumor tissues was useful in predicting the prognosis for patients with advanced colorectal cancer (Schumacher et al. 1994a). Later, Schumacher and Adam (1997) described HPA as a good indicator of metastasis in colon cancer cell lines in SCID mice. However, in this work Caco-2 cells were indicated as an HPA-negative cell line when processed for wax histology and labeled by an indirect immunochemical technique. These data are not in agreement with the results reported here but can be explained by differences in the approaches used, because we present strong evidence based on four different techniques that Caco-2 cells grown in culture and labeled by the direct method constitute an HPA-positive cell line.
In this study we found no significant difference between Caco-2 and HCT-116 cells in relation to HPA binding, as analyzed by quantitative high-resolution scanning electron microscopy (Table 1). Because HCT-116 cells have a more invasive potential than do Caco-2 cells, our results regarding HPA expression do not agree with the possibility that GalNAc residues are associated with invasive potential of cancer cells, as reported by Rye et al. (1998). We do not discard the possibility that other factors could have interfered with the finding of these authors, e.g., the use of paraffin-embedded cancer tissues. Further work on alteration of the glycosylation pathways in the Golgi apparatus/endoplasmic reticulum, in transport pathways, or in localization of N-acetylgalactosaminylated glycoforms in these cell compartments, as reported by Brooks et al. (2001), may help to explain these contradictory results.
N-Acetylneuraminic acid is the most common form of sialic acid present as a component of soluble and cell surface glycoconjugates in animal cells and tissues, and appears to be involved in the regulation of cell surface phenomena and therefore in malignant transformation (Schauer 1985; Narayanan 1994). In this study, we used three lectins known to bind sialic acid residues: LFA, which binds α-2,3 and α-2,6 sialic acid residues (Knibbs et al. 1991); SNA, which binds α-2,6 residues (Sata et al. 1991); and WGA, which is specific for N-acetyl-
Analysis of HPA-binding glycoproteins by SDS-PAGE and HPA-lectin blotting revealed that the cell lines used in this study expressed different profiles of glycoprotein bands. It was possible to observe a significant quantitative difference in levels of expression of an HPA-binding glycoprotein of molecular weight ∼25 kD that was more expressed in HCT-116 cells in relation to IEC-6 and Caco-2 cells. One other interesting fact was that IEC-6 cells expressed a greater level of HPA-binding glycoproteins of 35 and 22 kD, which were not seen in Caco-2 and HCT-116 cells. Despite these observations, it was possible to determine that IEC-6 cells quantitatively expressed the lowest number of HPA-binding glycoproteins compared with Caco-2 and HCT-116 cells, which is consistent with the results obtained by cytochemistry at both light and electron microscopy. Previous studies using lysates of various cell lines derived from normal and cancerous breast epithelium have reported 11 major glycoprotein bands detected by HPA-lectin blotting (Brooks et al. 2001). These bands ranged in molecular weight from 20 to 200 kD. However, Schumacher et al. (1995) and Mitchell et al. (1995) reported between four and seven HPA-binding bands ranging in molecular weight from 20 to 90 kD. One of these bands (69 kD) was identified as an N-acetylgalactosaminylated form of albumin, and another band at 90 kD was identified as the transferrin receptor.
The analysis of cell membrane fractions of cells here used revealed a markedly different level of expression of WGA-binding bands. Normal intestinal cells (IEC-6) expressed two WGA-binding glycoprotein bands. Only that of 50 kD was expressed to a larger extent in IEC-6 than in Caco-2 and HCT-116 cells. On the other hand, Caco-2 and HCT-116 cells expressed apparently the same profile of WGA-binding glycoprotein bands, ranging between 97 and 18 kD. However, HCT-116 cells showed levels of expression higher than Caco-2 cells. Previous studies using different human colon adenocarcinoma cell lines have reported various glycoproteins to be present at the cell surface. Electrophoresis of radioactive material from six cultured human colon cancer cell lines possessing different biological characteristics indicated that essentially all of the recovered labeled glycoproteins were of molecular weights between 92 and 18 kD in indolent lines, whereas the intermediate and highly aggressive cell lines had patterns with significant peaks between molecular weights of 45 to 92 kD (Marks et al. 1983). Le Bivic et al. (1988) have reported a 38 kD glycoprotein as a basolateral marker in cultured cell lines originating from human colon adenocarcinoma. A glycoprotein of 72 kD, corresponding to an ecto-5′-nucleotidase, was identified from DCS-TC2 cells (Navarro et al. 1998). The ME6H2 target antigen, which is adenocarcinoma-specific and whose lack of expression is a marker for the metastatic potential of these cells, was identified as a double band in SDS-PAGE with 31 and 33 kD in membrane fractions from HT-29 cells (Puhlmann et al. 1994). In colon adenocarcinoma cell lines there are no data reporting HPA- and WGA-binding glycoproteins using isolated plasma membrane and lectin blotting. Antibodies raised against these proteins used by Western blots containing the enriched plasma membrane fractions can directly identify them.
In conclusion, the present study has demonstrated that the level of expression of WGA- and HPA-binding glycoproteins varied among the three cell lines used and appears to be associated with the origin of the cell types. In addition, with exception of a major HPA-binding band glycoprotein of 25 kD, which was more strongly expressed in HCT-116 cells than in IEC-6 and Caco-2 cells, it was possible to determine that the levels of WGA-binding glycoproteins were quantitatively greater than those of IEC-6 and Caco-2 cells, as analyzed by lectin blotting and quantitative high-resolution scanning electron microscopy. On the basis of these observations, it is possible to suggest that WGA binding, but not HPA binding, appears to be associated with metastatic potential, at least in these cell lines. Our results therefore support the concept that cell membrane sialylation is important in determining the metastatic potential of cancer cells. Furthermore, this study illustrates that the use of high-resolution scanning electron microscopy and images obtained using backscattered electrons in samples with gold-labeled lectins is also useful to examine and quantify the expression of glycoconjugates at the cell surface of colon cancer cells.
Footnotes
Acknowledgements
Supported by Fundação Ary Frauzino para Pesquisa e Controle do Câncer (FAF), Fundação Carlos Chagas Filho de Amparo à Pesquisa do Estado do Rio de Janeiro-FAPERJ, and Conselho Nacional de Desenvolvimento Científico e Tecnológico (CNPq).
We thank all members of our laboratory for helpful suggestions and discussion of the manuscript.