
Abstract
Silver staining methods, when selective, yield a high-contrast and high-resolution image in optical microscopy. A classical method for silver impregnation of mitochondria has been applied to murine tissues and reveals a marked heterogeneity among mitochondria in single cells. This heterogeneity can be detected in the optical microscope but is even more evident at the ultrastructural level. The differences in staining intensity may reflect different stages in the mitochondrial life cycle. The progressive accumulation of uranyl-argyrophilic material may be a marker of mitochondrial aging. This highly selective staining procedure may be of use in studies of mitochondrial changes under pathological conditions and during apoptosis.
Keywords
T
When the population kinetics of enlargement-fission (or fission-enlargement) and elimination are altered, enlarged or even giant “megamitochondria” accumulate in many cell types (Wakabayashi 2002). In addition, mitochondrial fusion may occur, at least in some cell types (Bereiter-Hahn and Voth 1994; Nakada et al. 2001; Mattenberger et al. 2003). Investigations of mitochondrial replication and turnover require methods for estimating not only total mitochondrial number but also variations in the states of the mitochondrial life cycle. Furthermore, any adequate technique for evaluation of the mitochondrial pool at the optical microscope level requires the ability to detect extraordinarily small mitochondria that are just at the limit of the optical resolution. Finally, such procedures probably cannot employ the activities of specific enzymes or antigens, which could vary enormously at different stages in mitochondrial maturation, aging, and replication.
The quantitative approach to assessing mitochondrial numbers and volume density has antecedents in reports such as Thurlow's (1917) on mitochondrial numerical densities (per cubic mm) in different nerve cells, or Rasmussen's (1919) studies during hibernation. These works were performed with a method that could be described as an “optical dissector” (Benes and Lange 2001). This enables three-dimensional counting and eliminates biases arising from differences in object size, shape, and orientation. However, this slow (but precise), direct (non-stereological) counting is not currently applied to assess mitochondrial density changes. Because the enzymatic methods do not provide single-mitochondria resolution at the optical level by diffusion or low staining intensity, several classical and presumably selective methods for silver mitochondrial staining in fixed sections were tested to explore systematically (with quantitative image analysis) the mitochondrial density changes in normal aging human tissues and mouse models in which respiratory chain activities and antioxidant status were biochemically evaluated (Navarro et al. 2002).
In 1918, Río-Hortega introduced the ammoniacal silver carbonate staining procedure involving a multipurpose colloidal silver solution (Río-Hortega 1918). Since then, many variants of this method have been described, providing a wide range of different selective impregnations for cell types (microglia), organelles (mitochondria, centrioles, intermediate filaments), or pathological material (lipofucsin, Alzheimer's plaques). These variations were reviewed by Río-Hortega in an extensive (and largely unknown) review (Río-Hortega 1942–1945). Unfortunately, this unfinished review does not include the planned chapter on cytological methods to obtain selective impregnation of subcellular structures. These latter have since been characterized with much better resolution using TEM, making the methods of classical cytology largely obsolete.
In addition to the first variant of Achúcarro's method for silver staining of mitochondria and other organelles (Río-Hortega 1916), five different procedures for silver impregnation of mitochondria have been published (Río-Hortega 1925; Ortiz-Picón and Pérez-Lista 1929). The last of these variations on the main method was published by Polak (1946) and provides a simple and reliable silver impregnation method that can be used on both plant and animal tissues fixed in formaldehyde. All these methods yield a very similar high-contrast mitochondrial impregnation.
In the present work, an electron microscopic analysis of silver impregnation was used to determine whether this procedure can detect even minute mitochondria and to estimate the whole mitochondrial population. The goal was to use three-dimensional counting along the z-axis (and not to rely on stereological methods) to assess quantitative variations in mitochondrial densities. An additional goal was to determine maximal values for mitochondrial numerical and volume density and to compare the results with values derived from other methods (enzymatic activity or immunoreactivity). To correlate the optical image with the ultrastructural control, we used mouse liver fixed by perfusion to standardize the procedure and preserve ultrastructure. However, human tissues from normal biopsy specimens, also fixed in formalin, were used. The results suggest a marked heterogeneity in mitochondria even within single cells. Almost certainly, this is not a technical artifact but reflects real differences among individual mitochondria that may be related to variations in mitochondrial age and development.
Materials and Methods
Adult mouse tissues were fixed after administration of chloral hydrate anesthesia by transcardiac perfusion with a peristaltic pump, first with saline and then with 4% paraformaldehyde in PBS, pH 7.4. Brain, liver, kidneys, and muscle cell tissue (tongue) were excised. Organs were maintained in the same fixative from 24 hr up to 3 weeks at room temperature (RT). Cryosections 10–15 μm thick were made daily for the first week, and once after 2 and 3 weeks, with a CO2-cooled microtome without sucrose cryoprotection. The floating sections were recovered in slightly alkaline distilled water (1 drop of ammonia/50 ml) or in PBS. The floating frozen sections were manipulated with a glass rod and stained with Río-Hortega's silver carbonate method (Polak's variant) (Polak 1946) and usually mounted in less than 90 min as described below. On formol reduction of silver, the sections have a golden-brown color and other structures are slightly impregnated. However, after gold-chloride toning, colloidlike gold particles substitute for the metallic silver originally deposited inside mitochondria during impregnation and formol reduction. This gold substitution dramatically reduces background to almost zero. Almost all sections were dehydrated and mounted with fluid Canada's balsam or DPX, taking care not to press excessively on the coverslips. The final image is formed by metallic gold, and hyposulfite fixation removes all the oxidized silver. Therefore, the image quality in even very old slides is perfectly maintained for years if they have been carefully washed to eliminate any trace of fixer (hyposulfite). Optical images at different z-levels were obtained with a ×100 immersion-oil objective in an Olympus microscope equipped with an Olympus DP digital camera and were merged using Microimage software.
Some sections of liver tissue were dehydrated in graded alcohols and embedded in Epon 812. Ultrathin sections were cut with glass knives in Reichert ultramicrotomes and mounted on formvar coated grids (a) without any counterstaining to study the pattern and distribution of metallic gold precipitates and (b) after counterstaining with routine uranyl acetate and lead citrate. Osmium postfixation was strictly avoided. Some purple (thick) ultrathin sections were used to obtain stereopairs with a tilting angle from ±5° to ±12° to study the three-dimensional distribution of gold deposits inside mitochondria. Electron microscopy was carried out in two different JEOL-1200 TEMs operated at 80 kv, one equipped with a digital camera and image analysis software with automated measurements and the other with photographic plates that were enlarged and digitally scanned.
Río-Hortega's Silver Carbonate Solution
As in many other silver methods, the silver solution must be carefully prepared in clean glassware and with high-quality distilled water. The silver carbonate obtained by precipitation of silver nitrate with sodium carbonate must be white or yellowish. If it is brown or black, both reagents must be discarded. The solution is stable for months in dark bottles and even in clear bottles if not contaminated by dust particles. For this solution, 30 ml of 10% silver nitrate is admixed with 90 ml of 5% sodium carbonate. After the silver carbonate precipitate has formed, 25% ammonia is added dropwise until precisely the point at which the precipitate disappears. Any excess of ammonia invalidates the reagent. Finally, 330 ml of distilled water is added (Río-Hortega 1918). This is the “débil” (diluted) solution that may be used directly or as a 50% aqueous dilution.
Polak's Method with Silver Carbonate
This method was performed as follows. (a) Tissues were fixed in 10% formol, phosphate-buffered formol, or 4% paraformaldehyde-PBS for 24 hr up to 2 weeks. It should be noted that glutaraldehyde- or formol-glutaraldehyde fixed tissues do not react in the same way. (b) Frozen or cryostat sections 5–15 μm were recovered, as above, in a Petri dish with slightly alkaline distilled water (1 drop of ammonia/50 ml). PBS is not recommended in this case. (c) For mordant, the specimens were washed in distilled water and incubated for 30–40 min at 37C in prewarmed 5% uranyl acetate (or overnight at RT). (d) Impregnation was carried out with specimens adhering to a bent and very thin glass rod. Each section was immersed for 15–60 sec in the silver solution with constant slow motion until the yellowish color disappeared. (e) For reduction, the section was placed in 1% high-quality freshly prepared formalin (neutral but not buffered) and agitated slowly until some brown clouds are liberated (2 min or more). (f) For gold toning, specimens were washed in distilled water and placed in 1:500 (w/v) gold chloride at RT for 30–60 min. (g) The samples were then fixed in 1:500 (w/v) sodium thiosulfate for 3–5 min and washed in three changes of distilled water. (h) Specimens were mounted on gelatinized slides, dehydrated quickly with alcohols and xylene or phenicated xylene (if available), and mounted in Merckoglas or DPX. Although thin sections are preferable, sections of up to 20-μm can be stained. Thicker specimens cannot be used because the impregnation of the central part is not complete even with prolonged impregnation. Furthermore, the nuclei start to impregnate and the staining is no longer selective for mitochondria.
The silver nitrate (S-0139), sodium carbonate (S-6139), and gold chloride (tetrachloroauric acid (III) (Cl4AuH) yellow, G-4022, trihydrated) were obtained from Sigma (St Louis, MO). Uranyl acetate (dihydrate) (108473) and Merckoglas were from Merck (Darmstadt, Germany).
Results
Optical Microscopy
These silver staining procedures stain mitochondria with unmatched contrast, selectivity, and low background. Using a ×100 oil objective and a narrow depth of field, the high diffraction angle from the metallized mitochondrial border permits blurring of normal-sized mitochondria (around 1 μm diameter in mouse hepatocytes) through minimal variations in z-axis and the successive focusing of several mitochondria on the same section (Figures 1 and 2). Three-dimensional counting was easily performed with an ocular grid in all tissues studied. Material from the central nervous system showed less mitochondrial density than expected in the neuropil, and in the myelinized areas the impregnation did not work. Given sections of standardized thickness, a statistically ran dom sampling on vertical columns is a more rapid method to estimate the distribution of mitochondrial density than stereological methods.
Merging the different digital images (Figure 3) taken at three to five focused z-levels with the algorithm used by the Microimage software changes the values of peripheral pixels for minute mitochondria (≤0.3 μm), but the central pixels maintain their gray values and this is related to the optical density (and staining density). Therefore, although the staining intensity could be digitally quantified, there is no correspondence between density and diameter (see below) and it is not a useful parameter. The detection limit for minute mitochondria in brightfield was very low and difficult to quantify but could be estimated from the distance that can be resolved between mitochondria. This limit appears to be exactly at the resolution limit for the optical microscopy (0.2 μm) (Figure 2, inset). This limit of detection is in agreement with further studies of the deposition pattern of metallic dots in TEM (see below). At the optical microscopic level, only mitochondria are detected but not all the mitochondria are stained, as revealed by TEM controls.
Electron Microscopy
Examination of ultrathin sections of impregnated tissue, not counterstained, revealed that the colloidal silver, converted to metallic silver by formol reduction, had been substituted by colloid-like gold deposits. These have little or no tendency to aggregate and vary in size from 5 to 20 nm (Figure 4; the small red dot scale is 20 nm). These deposits remain perfectly circumscribed by an invisible membrane with an otherwise absolutely clean adjacent background. Adjacent mitochondria of the same size and in the same area were differentially stained. The density of gold grains was not related to mitochondrial size in the medium range, but all the really large mitochondria were intensely stained, as were the smallest mitochondria. Approximately half of the heavily impregnated mitochondria had clumps of argyrophilic material apposed on their surface.
A continuum of impregnation density was evident until the mitochondria become small, dense, and aggregated deposits with irregular limits. To locate these deposits and to correlate them with hepatocyte ultrastructure, uranyl-lead stained grids were studied. The results indicated that not all the mitochondria were stained. In spite of the technical manipulation and the absence of osmium postfixation, ultrastructure was clearly recognizable, and in every field 10–25% of otherwise normal mitochondria were not stained at all. In some hepatocytes the percentage was low, and in others the staining was only moderate, perhaps reflecting the well-established differences in hepatocyte ultrastructure related to acinar position. Mitochondrial impregnation was heterogeneous and sporadic cytoplasmic foci were also detected. However, these did not arise from unspecific background impregnation or technical noise.
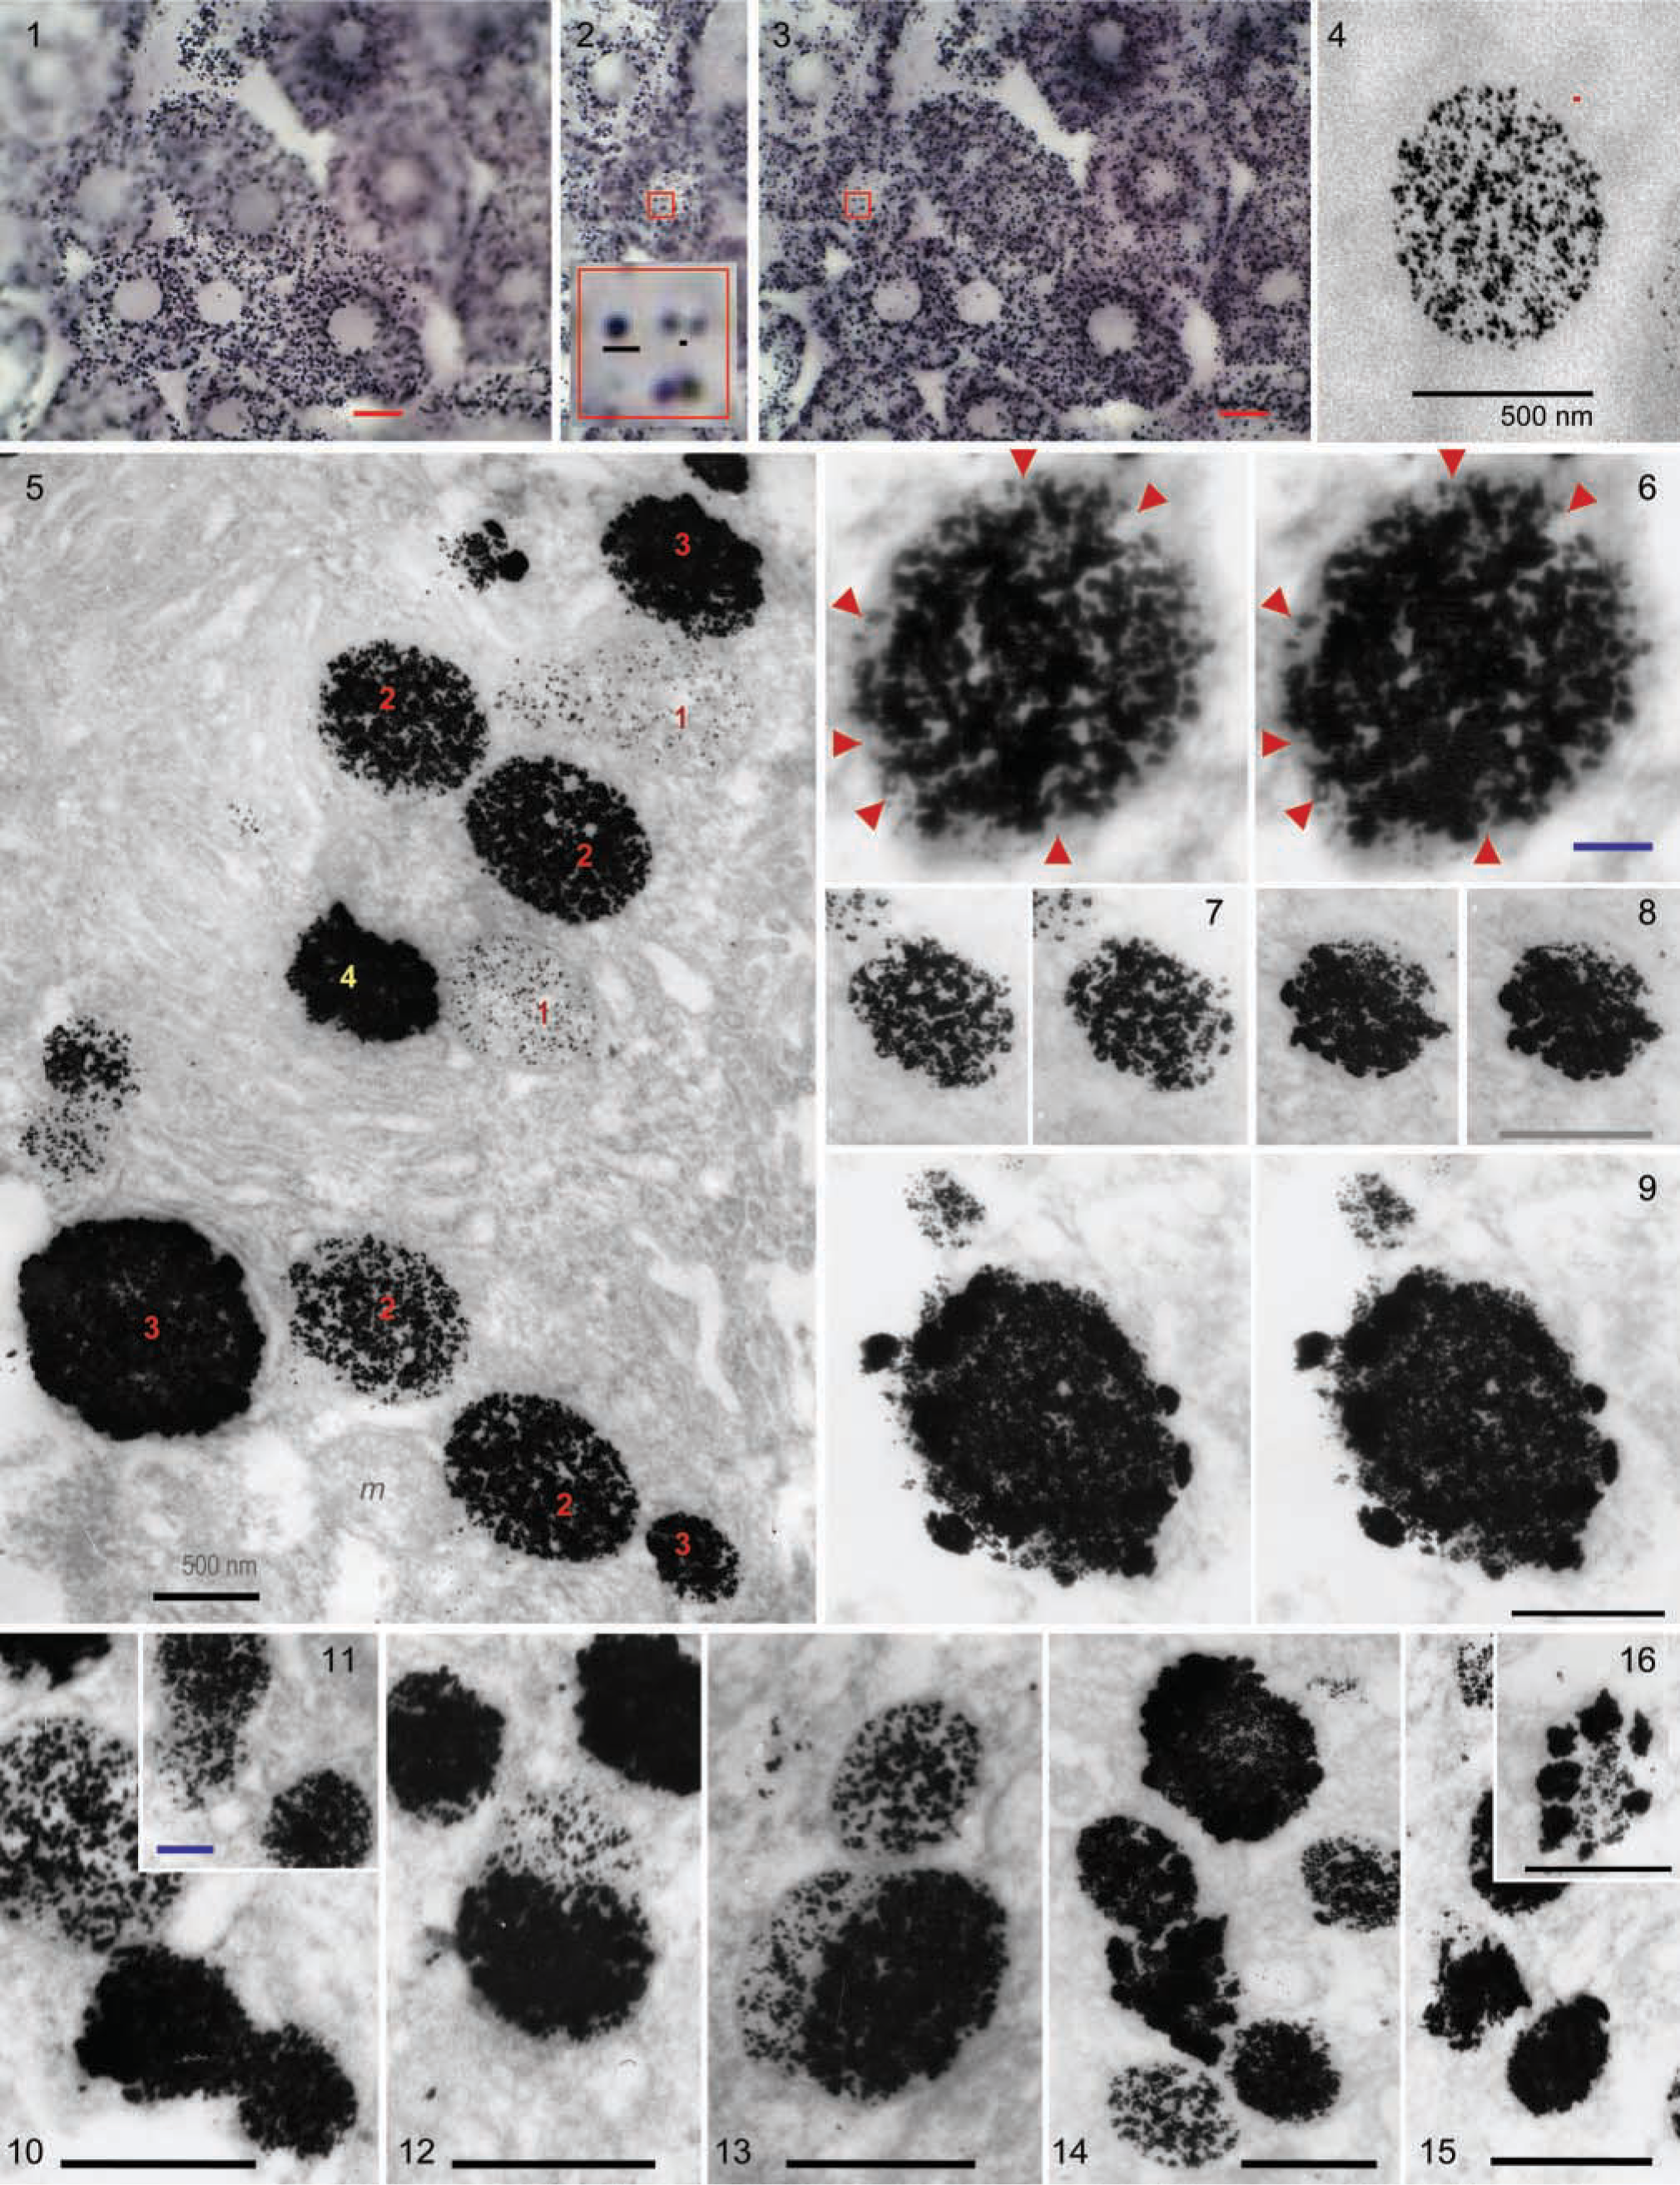
Silver carbonate-impregnated mitochondria in hepatocytes. Images at ×100 focused at four different z-levels (two are shown in
Silver carbonate staining of mitochondria revealed not only heterogeneity but also what appears to be a graded morphological transition (Figure 5). This can be described as four different stages starting from very slight staining (Figure 5, number 1). The individual mitochondria varied from slightly and diffusely stained (Figure 5, number 1) to an intense accumulation in the matrix (Figure 5, number 2), to complete staining with an irregular surface (clumps of argyrophilic material appear on the external surface) (Figure 5, number 3) and, finally, small irregularly shaped mitochondria exhibiting very dense staining (Figure 5, number 4). Save for the most densely stained mitochondria, colloidal silver was not deposited along outer membranes but only within the mitochondrial matrix. In stereo images, the staining revealed slit-like plates corresponding to the negative images of cristae (Figures 6 and 7). Argyrophilic material appeared to form clumps on the mitochondrial surface only on the compacted-stage compartments (Figure 8) and, in these cases, was clearly located outside the limiting membrane (Figure 9). Some images could be attributed to mitochondrial fission or fragmentation (Figure 10), whereas other images suggested possible mitochondrial fusion (Figure 10, inset, and Figures 11–13). The most frequent were two-hemispheric images suggesting a lateral fusion and not elongation and fission (Figures 12 and 13). The cytoplasmic foci show also a gradual transition from small isolated and dispersed dots to well-defined clouds (200–300-nm diameter) with some dense clumps. This transition can also be interpreted in reverse, as the final dissolution of shrunken mitochondria, as suggested by the transition from dense broken masses, to dispersed material (Figures 14–16).
Discussion
This method of silver staining was found to preferentially stain mitochondria with an otherwise very low background. However, it does not impregnate all the mitochondria. The meaning of the positive reaction must be established.
In the present investigations, we employed murine liver because cells in this organ have relatively homogeneous mitochondrial density, size, and form, although there can be variability arising from the location of hepatocytes in different acinar zones. Hepatocytes, like other cell types, continuously replicate and degrade mitochondria. Therefore, we assume that all stages of the mitochondrial life cycle should be represented. We might further assume that the duration of a given stage in this life cycle will be proportional to the frequency of their images. If so, we suggest that the most lightly stained mitochondria (and, perhaps, the unstained mitochondria observed with TEM) may represent the earliest phase of the mitochondrial life cycle. This may well reflect the time necessary for importation of products of the nuclear genome that are crucial to the synthesis of fully active mitochondria. On the other hand, the progressively darker staining and final appearance of shrunken mitochondria may reflect the maturation and “senescence” (or irreparable damage) of these organelles.
Unfortunately, the physicochemical basis for this staining method is largely unknown. The silver-diamine ions of the colloidal solution can have many different interactions with protein structures. However, the background (noise) is almost zero, so the method, although not yet specific in biochemical terms, is highly selective for mitochondria. At the optical microscopic level, only mitochondria are stained in all tissues. The selectivity of the silver deposition, in many different methods, can reach a very high signal-to-noise ratio, as demonstrated by the silver enhancement techniques applied to amplify nanogold-labeled probes or antibodies (Hacker and Gu 2002). Even in this situation, in which the process involved is a physical developer, the threshold for a false-positive detection is very high. With careful control of the impregnation and reduction conditions, the results are selective and highly reproducible.
On the basis of these considerations, it is highly probable that the selectivity is due to a specific interaction with one or more proteins relatively unique to the mitochondrion (and, perhaps, to the mitochondrial matrix, which appears to have greatest avidity), i.e., a protein that is selective and progressively concentrated in mitochondria as these organelles mature (or as they age). If the shrunken and densely stained mitochondria do represent the end of the mitochondrial life cycle, it is interesting that a similar pyknotic state characterizes apoptotic hepatocytes (Rouiller 1957) and other cell types. Such a process of “mitochondrial apoptosis” might make sense, given the clear danger presented by incidental release of cytochrome c, apoptosis-inducing factors, and other proapoptotic materials from “necrotic mitochondria.”
The significance of cytoplasmic accumulation of the silver stain is less clear. It may represent staining mediated by interactions with another type(s) of protein(s) or of an identical but less abundant protein as is stained within the mitochondrial matrix. They can also be considered the remnants of mitochondrial dissolution, as suggested by morphological transition.
We conclude that silver carbonate impregnation of mitochondria is a selective way to detect mitochondria, filling their matrix with colloid-like gold dots 5–20 nm in size. The results of such staining reveal a mitochondrial heterogeneity that may correspond to the progressive accumulation of some imported matrix protein followed by mitochondrial senescence and, finally, by pyknosis. Unfortunately, this procedure does not reveal all mitochondria, and therefore it cannot be used for estimations of mitochondrial density. However, this technique may be useful in studies of the kinetics of mitochondrial turnover and mitochondrial aging within cells.
Footnotes
Acknowledgements
Part of this work was performed in Linköping University with Prof Ulf Brunk. I am grateful to Helge Dalen and Alexei Terman for their support and their helpful comments, and to John Eaton for his careful reading of the manuscript.