
Abstract
Magmas is a protein that is involved in GM-CSF signaling in a myeloid cell line. Its precise role in the signal transduction process is unclear. To accurately characterize Magmas expression in a variety of cells, mouse embryos and adult murine tissues were analyzed for both mRNA and protein content. Magmas expression was detected as early as the day 6.5 embryo. The level of expression was developmentally regulated. During embryo-genesis, elevated Magmas was observed in several structures, including heart, liver, notochord, choroid plexus, cervical ganglion, and nasal mucosa. Muscle, pancreas, intestinal mucosa, and testes were among the adult tissues with high Magmas expression. Most cell types, including hepatocytes and skeletal, smooth, and cardiac myocytes, also expressed the GM-CSF receptor (GMR) but the relative tissue levels of GMR were not always proportional to Magmas. The expression patterns suggest that Magmas has a role in both developing and mature tissues.
M
Studies in yeast and Drosophila suggest that Magmas has critically important although uncharacterized functions. Inactivation of MIA1, the Magmas homologue (42% amino acid identity) in S. cerevisiae results in respiratory death (Winzeler et al. 1999). Similarly, loss of activity of blp, the corresponding Drosophila gene, causes lethality at the first instar stage of development (Becker et al. 2001).
Immunohistochemistry (IHC) and electron microscopy show that Magmas is located in the mitochondrial and ribosomal compartments. Reduced Magmas expression resulting from transfection of an antisense-containing vector impaired the GM-CSF- but not the IL-3-stimulated proliferation of PGMD1 cells (Jubinsky et al. 2001). These results suggest that Magmas could link GM-CSF signal pathways to functions such as ATP synthesis, apoptosis, and protein synthesis.
To gain insight about the role of Magmas in vivo, mRNA levels and protein expression were examined in murine embryos and adult tissues. Several of these tissues were also tested for expression of the GM-CSF receptor α-subunit (GMR).
Materials and Methods
Tissue Sections
Mouse embryos and adult murine tissues were harvested in accordance with the Animal Protection Committee guidelines at Children's Hospital Medical Center. The embryonic material was fixed in 4% paraformaldehyde for 24–48 hr, then embedded in paraffin blocks and sectioned into 4-μm sections. Some mouse embryo sections obtained from the Histopathology Core Facility (Albert Einstein College of Medicine; Bronx, NY) were identically prepared. The adult murine tissue sections were made similarly, except that 10% neutral buffered formalin was used as fixative. There was no difference in the relative intensity when adult tissues fixed with either of the two solutions were stained for Magmas expression. Archival paraffin-embedded tissue blocks were used as the source for the human tissue slides and were obtained with the approval of the Institutional Review Boards of Children's Hospital Medical Center and the University of Cincinnati Medical School.
Immunohistochemistry
The generation and characterization of a polyclonal antibody against Magmas have been described (Jubinsky et al. 2001). Immune and preimmune sera were purified on a Hi-Trap protein-G column (Amersham Pharmacia Biotech; Piscataway, NJ) and used at a concentration of 160 ng/ml. The embedded murine sections were treated in 0.1 M Tris-borate buffer, pH 8.0, overnight. After blocking in 5% goat serum/ PBS (Vector Laboratories; Burlingame, CA), Magmas expression was determined by incubating the samples in anti-Magmas antibody or control antibody, followed by biotinylated goat anti-rabbit Ig (1:275; Vector Laboratories), both diluted in blocking solution. After incubation with streptavidin-conjugated horseradish peroxidase (LSAB2 Kit; DAKO, Carpinteria, CA), slides were incubated in diaminobenzidine (DAB) solution (DAKO) all according to the manufacturer's directions. Staining was performed on sections obtained from a minimum of two different animals or embryos, with similar results.
The human tissues were blocked in 5% milk and then sequentially incubated in anti-GM-CSF receptor α-subunit antibody (5 μg/ml; Alpha Diagnostics, San Antonio, TX) or isotype control antibody (Sigma-Aldrich; St Louis, MO), anti-rabbit IgG-horseradish peroxidase and DAB, (Ventana Enhanced DAB Kit; Ventana Medical Systems, Tucson, AZ). Two different samples were stained. All slides were counterstained with Mayers hematoxylin (Polyscientific; Bayshore, NY).
Northern Blotting
Murine Magmas and human GMR cDNA probes were labeled with [32P]-dCTP (PerkinElmer Life Science; Boston, MA) using random primers (High Prime; Roche Applied Sciences, Indianapolis, IN) and hybridized, respectively, to a murine or human tissue array dot-blot (Murine MTE Array and Human MTE Array2; BD Biosciences Clontech, Palo Alto, CA). Specificity of the Magmas probe has been demonstrated by the detection of a single identical-sized transcript when hybridized to RNA derived from a variety of normal murine and human tissues. The mRNA (poly A selected) from the various tissues represented on the blots was normalized to eight different housekeeping genes by the manufacturer. The murine blot contained 100–600 pooled samples per dot. The human mRNA was derived from 1-140 pooled samples.
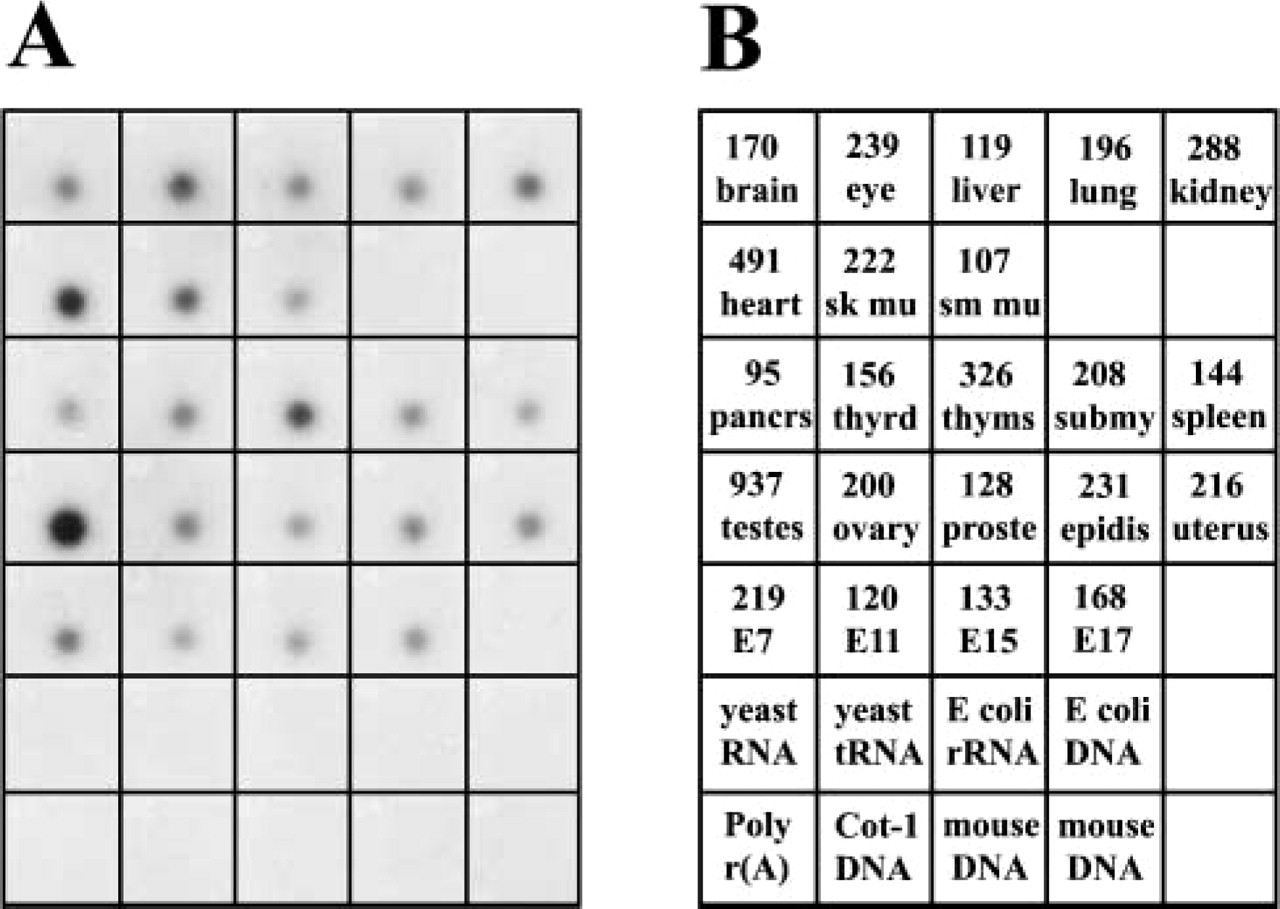
Magmas mRNA levels in murine tissues. 32P-labeled Magmas probe was hybridized to a membrane containing mRNA isolated from the indicated samples. (
Blots were blocked with ExpressHyb solution (BD Biosciences Clontech) containing salmon testis DNA 0.1 mg/ml (Sigma-Aldrich). Labeled probe was heated in saline sodium citrate (SSC; 150 mM NaCl and 15 mM sodium citrate) (Fischer Scientific; Fair Lawn, NJ) containing 150 μg/ml Cot-1 DNA (Roche Applied Sciences) and 750 μg/ml of salmon testis DNA for 5 min at 100C, then 30 min at 65C, and then added to prewarmed ExpressHyb solution for overnight hybridization at 65C. The blots were then washed four times for 20 min in 2 × SSC containing 0.1% sodium dodecyl sulfate (SDS) at 65C, followed by two washes in 0.1 × SSC/0.1% SDS for 20 min at 55C to remove nonspecific binding. A Phosphoimager plate (Storm 860 Phosphoimager; Molecular Dynamics, Sunnydale, CA) was exposed to the membrane for 3 days and the signal was analyzed using ImageQuant 1.2 software. All values shown have been corrected for the background signal, which was negligible. Each membrane was hybridized with two independently prepared probes, with similar results.
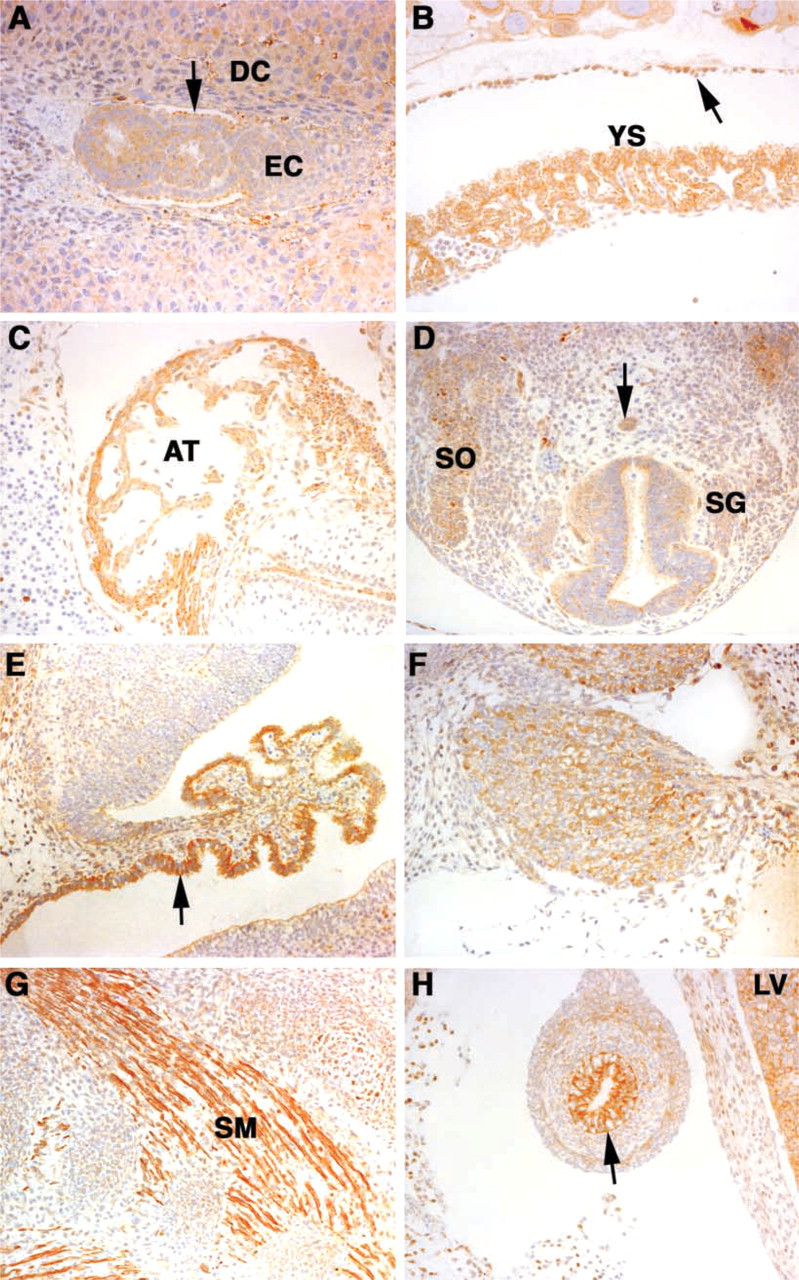
Magmas expression in the developing mouse embryo. (
The GenBank accession numbers for murine and human Magmas are AF349454 and AF349455, respectively.
Results
Expression of Magmas mRNA in Murine Tissues
A survey of Magmas mRNA in various murine tissues was performed using a tissue dot-blot. The samples on the blot are normalized to eight housekeeping genes by the manufacturer. An autoradiograph of the hybridization of 32P-labeled Magmas probe to the membrane is shown in Figure 1A. Figure 1B is the key to the tissues represented on the membrane. The relative signal intensity of each tissue (derived from Phosphoimager analysis and reduced by 3 logs) is indicated by the number in the upper portion of the box.
Magmas message was detected in all of the adult murine tissues as well as in the four whole embryo samples (E) represented on the blot. The mean signal intensity for all adult tissue was 167,415 with a standard deviation (SD; σn-1) of 183,319. Higher levels of Magmas mRNA were found in testes (937,420; >3 SD from mean) and heart (491,236; >1 SD from mean). Liver (119,275), smooth muscle (107,342), and pancreas (95,588) had the lowest signals but did not vary from the mean by more than 1 SD. The values from whole mouse embryos showed increasing signal intensity with age from day 11 to day 17, but the highest value was on a day 7 embryo sample. The signals observed for the negative controls (yeast total RNA, yeast tRNA, E. coli rRNA, E. coli DNA, poly r(A), and repetitive DNA sequences) were all similar to the background. In separate Northern blotting analyses, the amount of Magmas message in placenta was similar to that found in kidney (data not shown).
Expression of Magmas Protein During Murine Development
Protein expression during murine development was examined at days 6.5, 10, 12.5, 14.5, 15.5, and day 18 by IHC using anti-Magmas antibody. Illustrative examples are shown in Figure 2. The amount of protein expressed is reflected by the intensity of brown precipitate resulting from the peroxidase reaction. The data shown are at the earliest gestational age that a cell, tissue, or organ expressed Magmas at a level significantly higher than the surrounding tissue. Tissues and cell types not mentioned had minimal to undetectable staining.
Figure 2A is a section from a day 6.5 embryo. An intermediate amount of staining is observed in the proximal and distal endoderm, including Reichert's membrane, ectoplacental cone, the embryonic ectoderm, and the decidua. A section through placenta on day 10 (Figure 2B) shows strong staining in the yolk sac epithelial lining, as well as the parietal endoderm and surrounding decidual cells.
In the day 12.5 embryonic heart, strong staining occurs in the myocytes in the atria and in the muscle cells in the region of the atrioventricular canal (Figure 2C). No significant staining is observed in the stromal cells of the endocardial cushions. Figure 2D shows a section through a spinal cord region of the day 12.5 embryo. Enhanced staining is observed in the notochord, the spinal ganglia, and the somites, which give rise to the skin and skeletal elements.
In the day 14.5 embryo, intense staining is observed in the epithelial lining of the choroid plexus of the developing brain, as illustrated in Figure 2E. The primitive neuroectodermal layer also shows weaker staining. The stroma underlying the epithelial cells in the choroid plexus is negative. There was no significant staining in this region of the brain at day 12.5. Figure 2F shows a section through the cervical ganglion at day 14.5. There is strong staining in the neural cells throughout the ganglia. In contrast, the connective tissue surrounding the ganglia shows no significant staining. Also in the day 14.5 embryo, strong staining was observed in the developing muscle layers, as shown in Figure 2G. In addition, Magmas expression is also seen in the cartilage of the developing ribs and in the spinal ganglia adjacent to the muscle layers. The spinal ganglion cells here stain less than the cervical ganglia shown in Figure 2F because they are develop-mentally more immature. Figure 2H shows a section through the developing intestinal tract of the day 14.5 embryo. There is strong staining in the epithelial lining of the intestinal tract and weaker staining in the developing muscular wall of the intestinal tract. No significant staining is observed in the developing diaphragm. However, the liver is strongly positive.
In the day 18 embryo (not shown), in addition to the staining of the tissues already discussed there is very strong staining in the salivary gland epithelium, although the surrounding connective tissue is negative. The nasal mucosal epithelium in the underlying sub-mucosal glands, which are morphologically identifiable at day 17, also shows strong expression during this stage of development.
As summarized in Table 1, the level of Magmas expression varied considerably during embryonic development. For example, Magmas expression was elevated in skeletal muscle, beginning at the inception of morphologically identifiable fibrils. The high level continues until sometime between day 15 and day 18, when Magmas is barely detectible. Liver, cardiac muscle, and bronchioles also had decreased Magmas expression in the day 18 sections. In contrast, staining of renal structures occurred relatively late (weak on day 15.5) and was highest on day 18.
Magmas expression during murine embryogenesis a
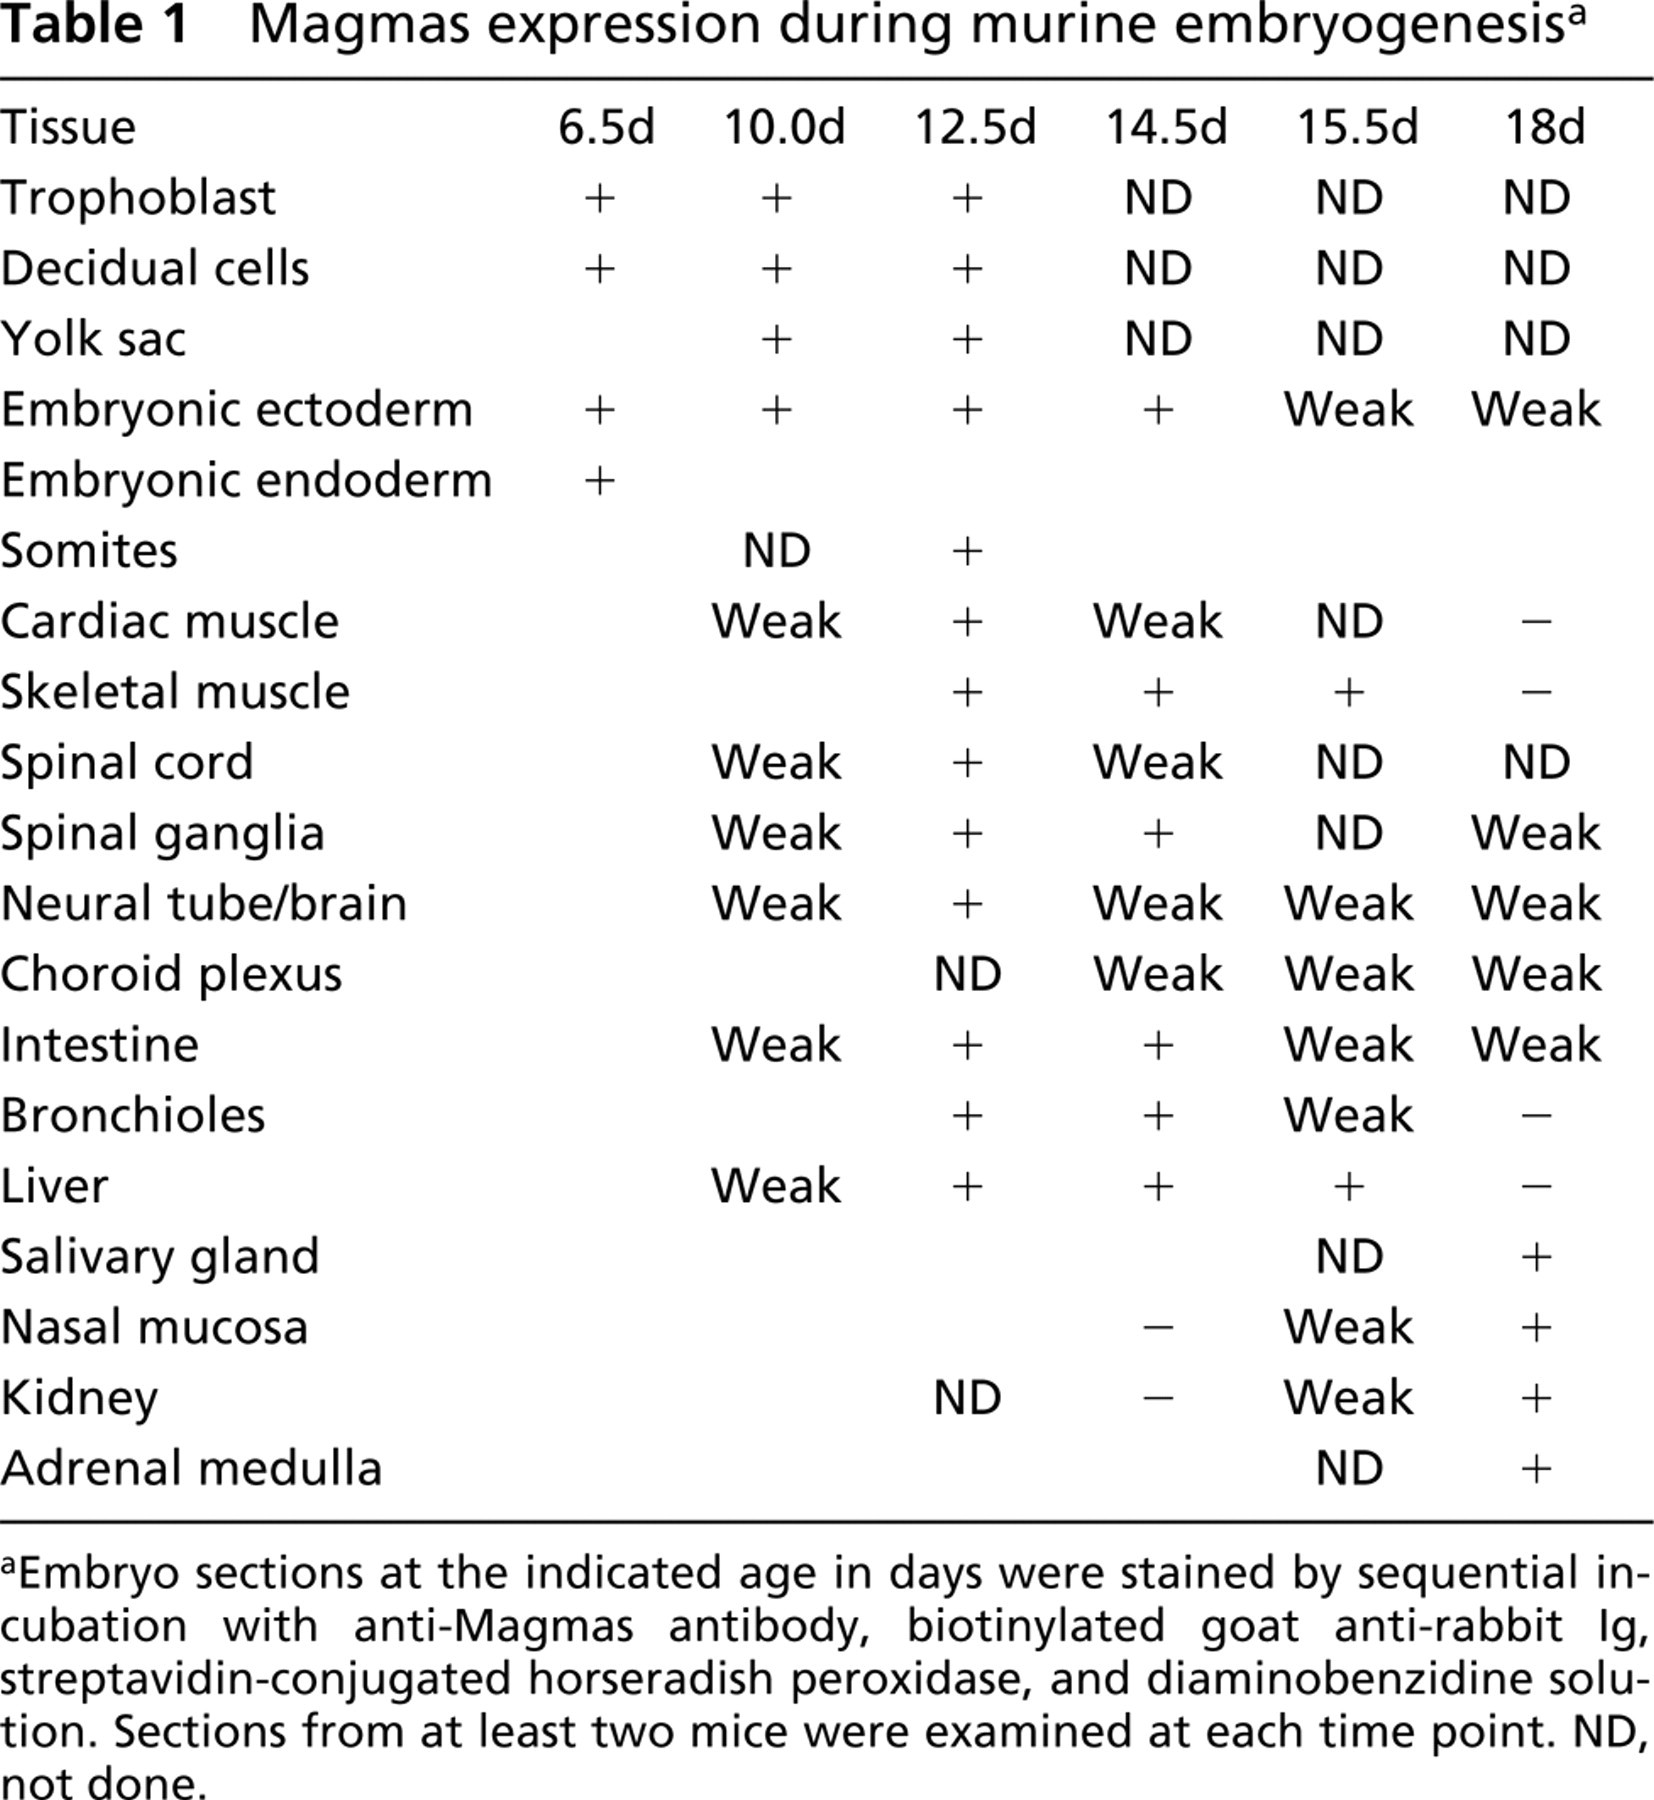
aEmbryo sections at the indicated age in days were stained by sequential incubation with anti-Magmas antibody, biotinylated goat anti-rabbit Ig, streptavidin-conjugated horseradish peroxidase, and diaminobenzidine solution. Sections from at least two mice were examined at each time point. ND, not done.
Magmas Protein Expression in Adult Tissues
Tissues from the adult mouse, including brain, spinal cord, liver, spleen, pancreas, small bowel, heart, lung, kidney, ovary, uterus, and testes, were evaluated by IHC for the expression of Magmas. The results of Magmas expression in muscle tissue samples are shown in Figures 3A-3C. Cardiac muscle fibers, as illustrated in Figure 3A, show a variable reaction pattern, with many strongly positive fibers, in contrast to clusters of many negative fibers adjacent to the positive fibers. Moreover, even in the positively staining fibers there is variability of the staining intensity within the fiber, with some fibers showing more intense staining at the periphery of the cell. Skeletal muscle fibers also show strong positive staining, as illustrated in Figure 3B. Most muscle cells are strongly positive, and in the skeletal muscle fibers the staining is associated with the filaments and z-bands. In a transverse section of cardiac muscle, Figure 3C, compartmentalization of the staining pattern in a coarse, granular pattern, often with a perinuclear distribution, is apparent.
Other organs, such as the kidney, pancreas, and intestine (Figures 3D-3F), show positive staining for Magmas. Liver shows diffuse cytoplasmic staining in most hepatocytes and no significant staining of the bile duct epithelium (data not shown). The kidney section shows intense staining in the perirenal fat cells. Prominent expression is also observed in the proximal tubules in the renal cortex. In contrast to the cortex, the renal medulla exhibits little evidence of staining of the tubule epithelial cells. The glomeruli are also negative. The pancreas, as shown at left in Figure 3F, has diffuse positive cytoplasmic staining in the acinar cells. The intestinal tract (at right in Figure 3F) shows positive staining in the mucosal epithelial lining of the small bowel.
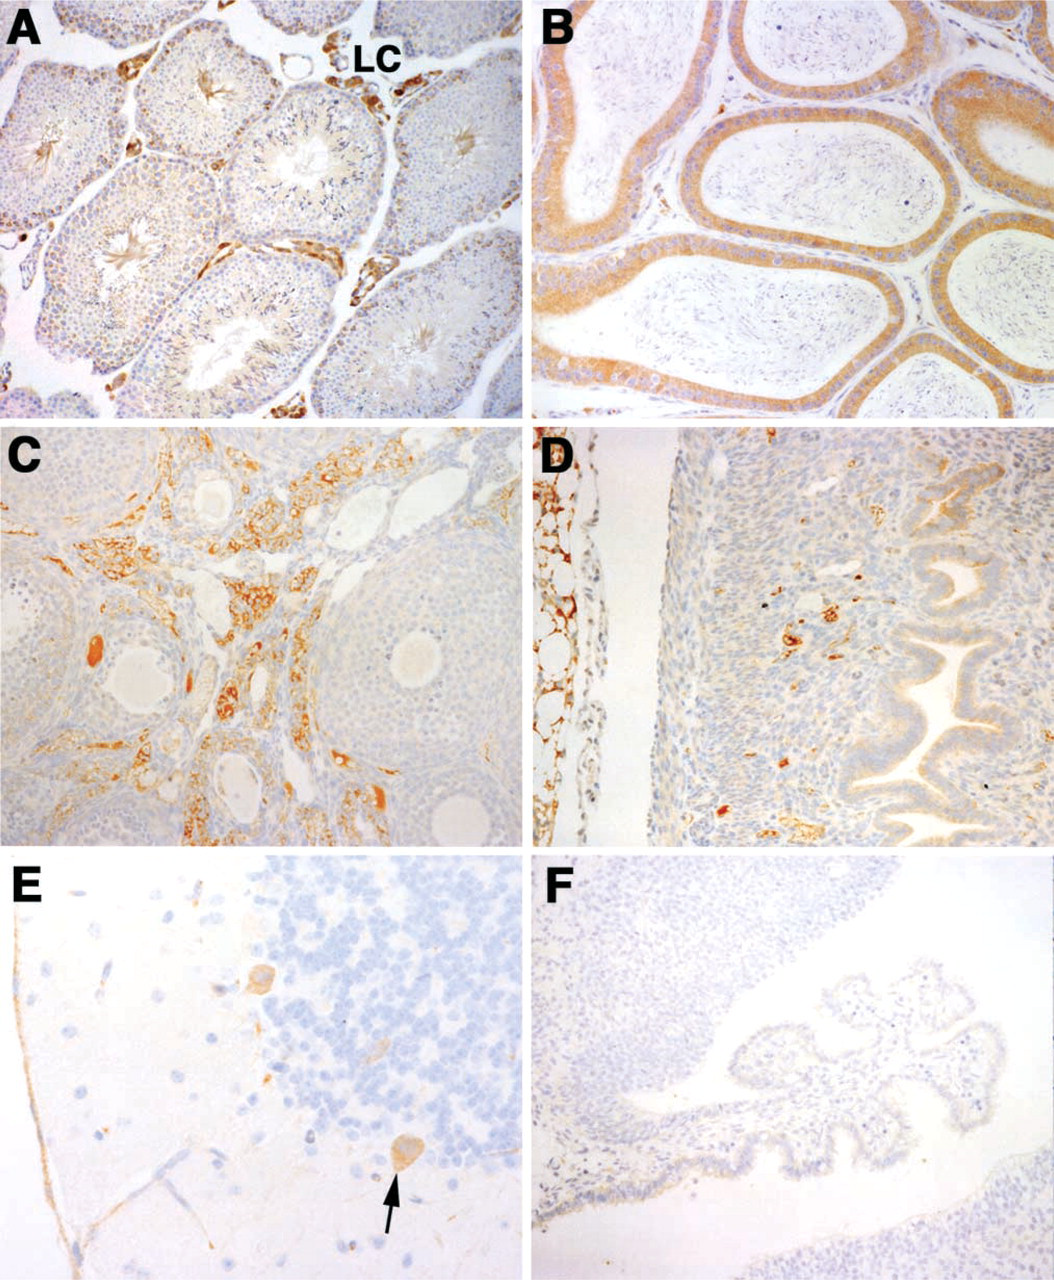
The reproductive tract shows extensive evidence of Magmas expression. In the mouse, the testes were among the tissues having high levels of Magmas mRNA by Northern blotting. Figures 4A and 4B show the staining pattern observed using the antibody on adult testes. There is strong staining in the interstitial Leydig cells as well as positive staining in the spermatocytes and spermatids. The epithelium lining the epididymis was also strongly positive. In the female reproductive organs, the ovary, unlike the testes, did not show much Magmas expression. Both the follicle and the perifollicular cells are negative, as shown in Figure 4C. The only cell populations in the ovarian tissue that were positive were the fibrous tissue and blood vessels in the ovarian stroma. A section of murine uterus is shown in Figure 4D. The endometrial mucosal cells lining the uterus were weakly positive.
Expression in the brain is illustrated in Figure 4E, which shows strong staining in the Purkinje cells of the cerebellum. The granular cells in the white matter of the cerebellar cortex do not express significant amounts of Magmas. In the cerebral cortex of the adult murine brain, high levels of Magmas expression were observed in neuronal cells, although the glial cells were generally negative or showed weak staining (data not shown). In contrast to the developing spinal cord, the adult spinal cord did not show significant staining. Minimal expression of Magmas was observed in other organs, such as the lung, spleen, and thymus.
As one example of a negative control for the anti-Magmas antibody, Figure 4F is the section containing choroid plexus (corresponding to Figure 2E) incubated with preimmune serum as the primary reagent. Each panel has a matching negative control, which shows minimal to no background staining. Inclusion of a 10fold molar excess of uncoupled immunizing peptide with the anti-Magmas antibody eliminated Magmas staining on testes and prostate sections, further demonstrating the specificity of the antibody (data not shown).
GM-CSF Receptor mRNA Expression
Magmas was initially shown to be involved in GM-CSF signaling pathways in hematopoietic cells. However, our data show that the tissue distribution of Magmas is more extensive than what has thus far been reported in the literature for the GM-CSF receptor. To determine if the GM-CSF receptor α-subunit (GMR) might be expressed in a variety of tissues similar to Magmas, Northern blotting analysis was performed on human samples. Murine tissues were not assayed because the sequence of the murine GMR receptor was not known.
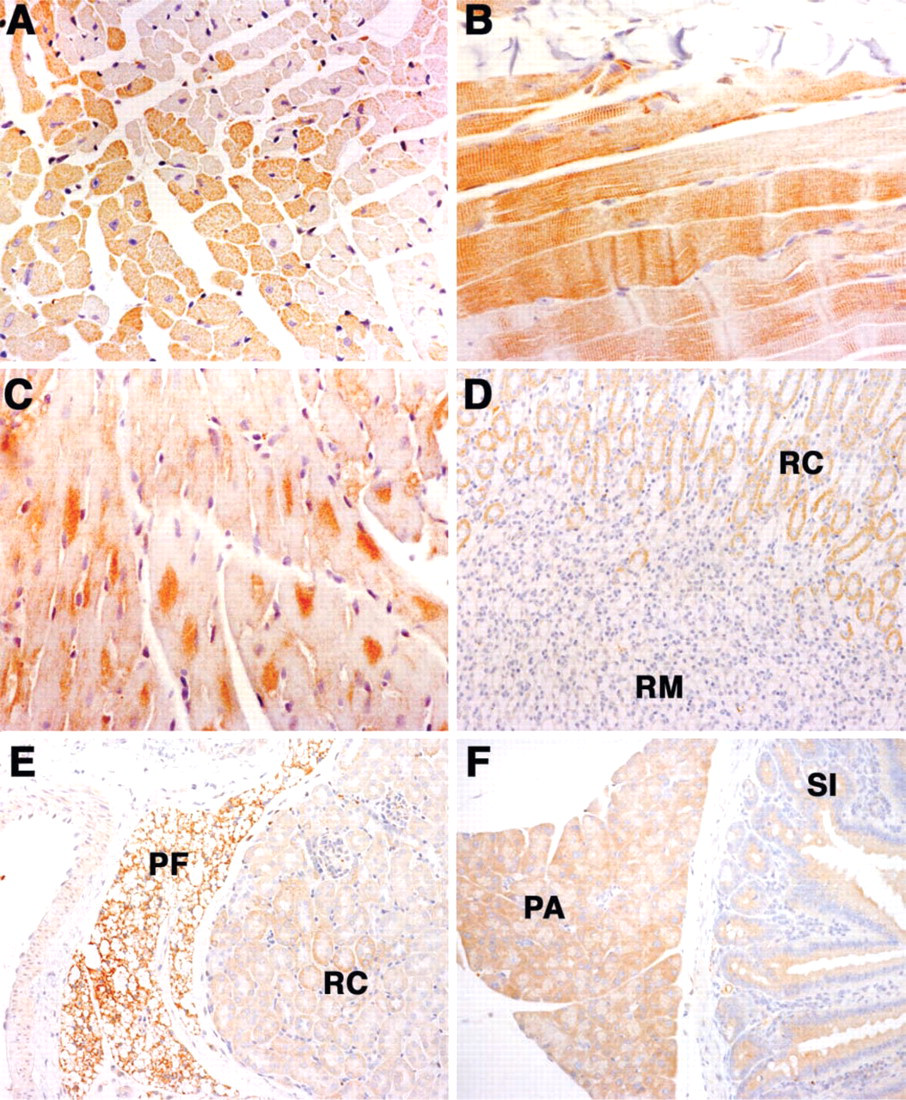
Magmas expression in adult tissue. (
Magmas expression in adult murine tissue. (
A total of 80 samples, including 56 adult tissues/ structures, seven fetal tissues, placenta, and several cell lines and controls were evaluated. An autoradiograph of 32P-labeled GMR probe hybridized to the tissue blot membrane is shown at left in Figure 5. The relative GMR signal for many of the tissues evaluated for Magmas message levels (Figure 1) are reported at right.
GMR message was detected in all tissues represented on the blot. The mean relative intensity for the all adult tissues was 93,301 and the SD was ± 65,599. The level of GMR message was highest in placenta (767,349). It was nearly twice as abundant as the next highest specimen. Peripheral blood leukocytes, bone marrow, lymph node, lung, and spleen were the samples having values greater than the mean by more than 1 SD.
In general, tissues with elevated Magmas mRNA did not have heightened GMR message. For example, testis and heart, the tissues with the highest Magmas mRNA, both had GMR mRNA levels significantly below the mean at 69,521 and 56,741, respectively. Similarly, the signal intesity of skeletal muscle was higher than the mean value for Magmas but had the lowest GMR signal of any sample.
Specific regions within an organ system had differing amounts of GMR message. For example, when areas of the heart were analyzed as a group (mean 54,621; SD ± 8257), the right ventricle (65,709) was statistically higher than the left ventricle (47,445) by nearly 2 SD. In the brain, the corpus callosum, medulla oblongata, and pons had elevated GMR signal. The ileum, jejunum, and appendix also had increased expression that was more than 1 SD from the mean of the gastrointestinal tract samples. Yeast RNA and tRNA, E. coli DNA and rRNA, and poly r(A) all had values similar to background.
GM-CSF Receptor Protein Expression
Accurate measurement of GMR expression in tissues using mRNA-based techniques can be affected by the presence of hematopoietic cells. IHC was therefore used to determine which cell types in a tissue were responsible for the signal observed on Northern blotting. Human samples had to be used to detect GMR protein expression because antibodies against the murine receptor are not available and because performing ligand-binding assays on all these tissues is not practical.
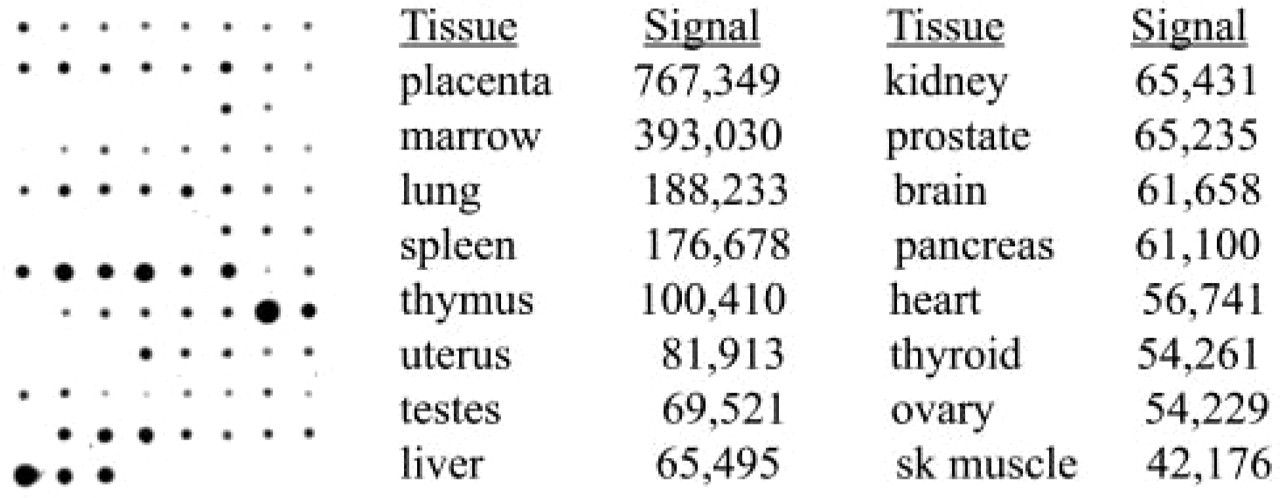
GMR message expression in murine tissues. Autoradiograph of membrane incubated with 32P-labeled probe to GMR mRNA is shown at left. Relative intensity of GMR mRNA signal of selected tissues is at right side. Other values are available on request.
The results of the immunohistochemical staining for GMR protein expression are shown in Figure 6. Figure 6A shows skeletal muscle that had the lowest GMR signal on the tissue blot. Staining was variable in intensity, and appeared band-like in some of the individual cells. Figure 6B is skeletal muscle stained with the isotype control antibody, demonstrating the specificity of the GMR antibody. In cardiac muscle, fibers show small patches of granular staining in the cytoplasm, frequently in a perinuclear distribution (Figure 6C). Figure 6D is a section of liver with weak but diffuse staining of hepatocytes similar to that seen with Magmas. In testis, diffuse positive staining in the Sertoli cells lining the tubules and in the spermatogonia is observed (Figure 6E). In contrast to the results for Magmas, there was no significant staining of adipose tissue with the GMR antibody (Figure 6F). Strong GMR staining is seen in the smooth muscle layer of the intestinal wall and weak staining in the small intestine epithelial lining (Figure 6G). Figure 6H is a section corresponding to that in Figure 6G stained with isotope control antibody. There is essentially no staining with isotype control antibody. The negative controls for the other sections had similar results.
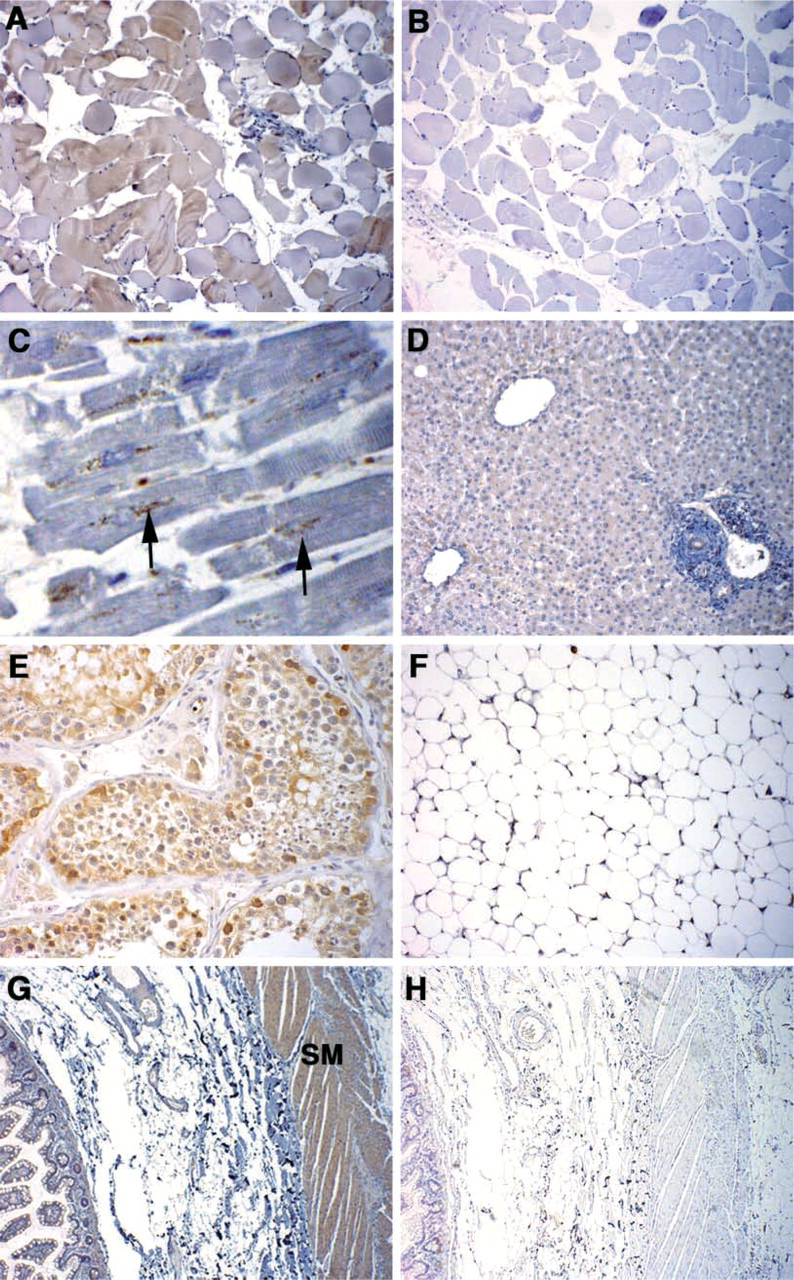
GM-CSF receptor staining in human adult tissue. (
Discussion
Magmas is expressed in a wide variety of cell types. Northern blotting showed that Magmas message is present in variable amounts depending on the tissue. Heart and testis had the highest mRNA levels of samples evaluated. The results obtained in murine tissues are consistent with those reported for Magmas mRNA expression in human tissues (Jubinsky et al. 2001).
IHC using a peptide-specific polyclonal antibody was done to supplement the tissue blot data and provide a more detailed analysis of Magmas expression patterns during development. Magmas protein was detected as early as the day 6.5 embryo and was found in each of the three germ lineages. Throughout development, expression was cell type-specific and temporally regulated. Elevated Magmas levels were found in cells and structures such as myocytes, small bowel epithelium, kidney proximal tubules, nasal mucosa, and salivary gland during embryogenesis. In adult tissues, Magmas expression was also high in the epithelial cells as well as muscle.
Many of the tissues with Magmas expression express GMR, including placenta (Chiba et al. 1990; Crosier et al. 1991; DiPersio et al. 1991; Loke et al. 1992; Jokhi et al. 1994), uterus (Jokhi et al. 1994), intestinal epithelial cells (Panja et al. 1998), testes (Zambrano et al. 2001), astrocytes (Guillemin et al. 1996), oligodendrocytes (Baldwin et al. 1993), fibroblasts (Postiglione et al. 1998), prostate (Rivas et al. 1998), ovarian tissue (Zhao et al. 1995), and cells comprising the blastocyst (Robertson et al. 2001).
Our Northern blotting data suggested that GMR was expressed in other tissues as well. However, it was possible that the GMR signal came from bone marrow-derived cells present in the sample. Several of the tissues with low GMR message were therefore examined in greater detail by IHC to determine the origin of the signal. Specific GM-CSF receptor α-subunit staining was observed on cardiac, skeletal, and smooth muscle myocytes and hepatocytes. The adipocyte was one cell type that was not found to co-express the two proteins. These cells had high Magmas but no detectable GMR expression by IHC.
These results are consistent with previous studies showing that cardiac (Knoops et al. 2001) and skeletal muscle (Schuler et al. 1991) are GM-CSF-responsive tissues. GM-CSF is important in cardiac tissue during times of stress. It is produced by the heart (Metcalf et al. 1995) and is elevated in hypertension (Parissis et al. 2002) and in left ventricular hypertrophy (Parissis et al. 2000), conditions that increase oxygen utilization.
A functional relationship between Magmas and GM-CSF signaling has been demonstrated in the PGMD1 cell line. Although the co-expression of Magmas and GMR shown here does not prove that there is a similar connection in other cell types, our expression data and studies on GM-CSF action support the hypothesis that they interact through metabolic pathways.
A primary function of GM-CSF is regulation of glucose uptake and utilization. GM-CSF administration increases glucose metabolism in hematopoietic cell lines (Wada et al. 1993; Ahmed et al. 1997; Fiorentini et al. 2001) and primary hematopoietic cells (Hamilton et al. 1988; Yao et al. 1995; Tan et al. 1998) Similar effects of GM-CSF have been observed in non-blood tissues including skeletal muscle, lung, liver, and skin (Schuler et al. 1991), male germ cells (Zambrano et al. 2001), and blastocysts (Robertson et al. 2001). Transgenic mice that overexpress GM-CSF in many tissues exhibit severe wasting (Houzet et al. 2001), consistent with an increased catabolic state and the role of GM-CSF in glucose metabolism. Death of these animals occurs in utero without any apparent evidence of tissue destruction. This effect cannot be explained solely by the presence of monocytic tissue infiltrates, which is the predominant pathological finding. Transgenic mice with targeted GM-CSF expression limited only to hematopoietic cells also have high mononuclear cell infiltrates but did not exhibit the early muscle wasting (Lang et al. 1987).
Epithelial cells were chief among the cells with significant Magmas expression. These cells are involved in protein and electrolyte transport and have high metabolic requirements. This relationship is illustrated by the staining pattern of the developing renal structures and the choroid plexus. In the day 14.5 embryo there is no staining of the mesonephros, which contains primative glomeruli and collecting tubules. Weak Magmas expression becomes apparent (day 15.5) with the formation of increasing numbers of proximal and distal tubules and the initiation of urine production (Terreros and Tiedemann 1991; Kaufman and Bard 1999). Intense staining of the kidney is seen on day 18, when the organ is fully functional. In the choroid plexus, the detection of Magmas at day 14.5 correlates with the production of cerebral spinal fluid by this structure (Catala 1998; Dziegielewska et al. 2001).
Our data are consistent with the hypothesis that Magmas is involved in GM-CSF signal transduction pathways in tissues other than those of hematopoietic origin. However, the co-distribution of both Magmas and GMR clearly does not exclude a role for Magmas in the activities of other cytokines or growth factors. In GM-CSF-deficient mice, Magmas expression in pulmonary tissue is similar to the wild-type control animals (unpublished data), implying alternative pathways. Future studies, including tissue-specific conditional homozygous inactivation of the gene, characterization of interacting proteins, and the determination of which GM-CSF signal pathways interact with Magmas, should provide a framework for understanding the function of this interesting protein.
Footnotes
Acknowledgements
Supported by the Ruth Lyons Cancer Fund, Cincinnati, OH, and by the Abbie Harkleroad Foundation.
We thank Lisa Artmayer, Lynn McKee, and Janice Armstrong for technical support, Alicia Emley for photographic assistance, and Darryl Hake for dedication to patient care. Sections from the GM-CSF-deficient mouse were kindly provided by Dr Ann Marie LeVine.