
Abstract
Our aim was to determine the pattern of expression of MUC1 mucin cytoplasmic tail (MUC1 CT) in breast carcinoma. A total of 98 invasive breast adenocarcinoma tumor samples were assayed by immunohistochemical (IHC) analysis. The pattern of reaction was classified as membrane, cytoplasmic, or mixed. Subcellular fractions were prepared after SDS-PAGE and Western blotting. The antibodies employed were anti-MUC1 CT (CT2 monoclonal antibody, MAb) and C595 MAb against the extracellular MUC1 core protein. With the CT2 MAb, IHC showed a high percentage of positive staining in 93% of specimens, with membrane staining the most common pattern observed. C595 MAb was reactive in 73% of specimens. Similar percentages of membrane and cytoplasmic staining were found, mainly in a mixed pattern. Western blotting showed different bands. With the CT2 MAb, the membrane fraction showed the most intense reaction; a strong band of reaction was detected at approximately <30 kD. With the C595 MAb, in most cases a double band at 200 kD was found. In breast epithelium, the pattern of MUC1 CT expression may constitute an indicator of MUC1 production because it does not depend on glycosylation. The pattern and extension of MUC1 CT positivity do not vary according to the histopathological subtype of the tumor.
I
MUC1 exists in a heterodimeric form with a large extracellular domain consisting predominantly of variable numbers of O-glycosylated 20-amino-acid tandem repeat peptides (VNTR) (mucin domain) bound via noncovalent forces (Ligtenberg et al. 1992) with a membrane-associated subunit. It consists of an extracellular stem with a cleavage site, a transmembrane domain, and a 72-amino-acid cytoplasmic tail (CT) (Gendler et al. 1990, 1998). Gendler (2001) has speculated that this heterodimeric presentation of MUC1 may provide a mechanism for rapid shedding of the mucin domain. Soluble forms include the ectodomain of full-length MUC1, termed MUC1/REP, and a secreted form resulting from an alternative splicing event, MUC1/SEC (Wreschner et al. 1990; Smorodinsky et al. 1996). Additional cell-associated forms have been detected in malignant cells, MUC1/Y (Zrihan-Licht et al. 1994; Hartmann et al. 1999) and MUC1/Z (Oosterkamp et al. 1997), which lack the tandem repeats.
MUC1 has been involved in cell–cell (Wesseling et al. 1995) and cell–matrix interactions (Regimbald et al. 1996; Kam et al. 1998). It has also been observed that MUC1 CT interacts with β-catenin through a similar motif to that found in E-cadherin and inhibits the formation of an E-cadherin–β-catenin complex, reducing cell–cell adhesion (Yamamoto et al. 1997). On the other hand, MUC1 has been associated with putative signaling functions through motifs in the CT (Li et al. 1998) because it contains potential docking sites for SH2-including proteins as well as a variety of possible kinase recognition sites (Spicer et al. 1995). In MCF-7 breast carcinoma cells, Pandey et al. (1995) demonstrated that on phosphorylation, MUC1 can bind Grb2/SOS, signaling mediator of a number of tyrosine kinase receptors. Recent data obtained by Schroeder et al. (2001) demonstrated that MUC1 colocalizes and physically interacts with members of the erbB receptor kinase family. Furthermore, EGF-dependent activation of ERK1/2 is strongly induced in the presence of high levels of MUC1 in the mouse mammary gland, suggesting that MUC1 potentiates the signaling of erbB family members, proteins whose increased expression is correlated with aggressive breast cancer (Wesseling et al. 1995).
The transmembrane and cytoplasmic domains of MUC1 are conserved among mammalian species with an amino acid identity of 80–90% (Pemberton et al. 1992). These authors suggested that this domain is functionally important in the MUC1 molecule as a whole. MUC1 has been shown to be recycled through the trans-Golgi network from the apical surface several times (Litvinov and Hilkens 1993). It has also been shown that the cytoplasmic tail may be involved in endocytosis (Pemberton et al. 1996).
Immunohistochemical (IHC) MUC1 detection studies have included diverse anti-MUC1 monoclonal antibodies (MAbs) against the extracellular domain, mainly against different sequences from the VNTR (Griffiths et al. 1987; Croce et al. 1997; Luna-Moré et al. 2001; Rahn et al. 2001) and also against the carbohydrate side chains (Renkonen et al. 1997; Nakagoe et al. 2002). The present study was developed to find evidence about MUC1 pattern expression in breast carcinoma by use of an anti-MUC1 CT MAb, because it is a reliable indicator of the abundance of cell-associated MUC1 mucin.
Materials and Methods
Tissue Specimens
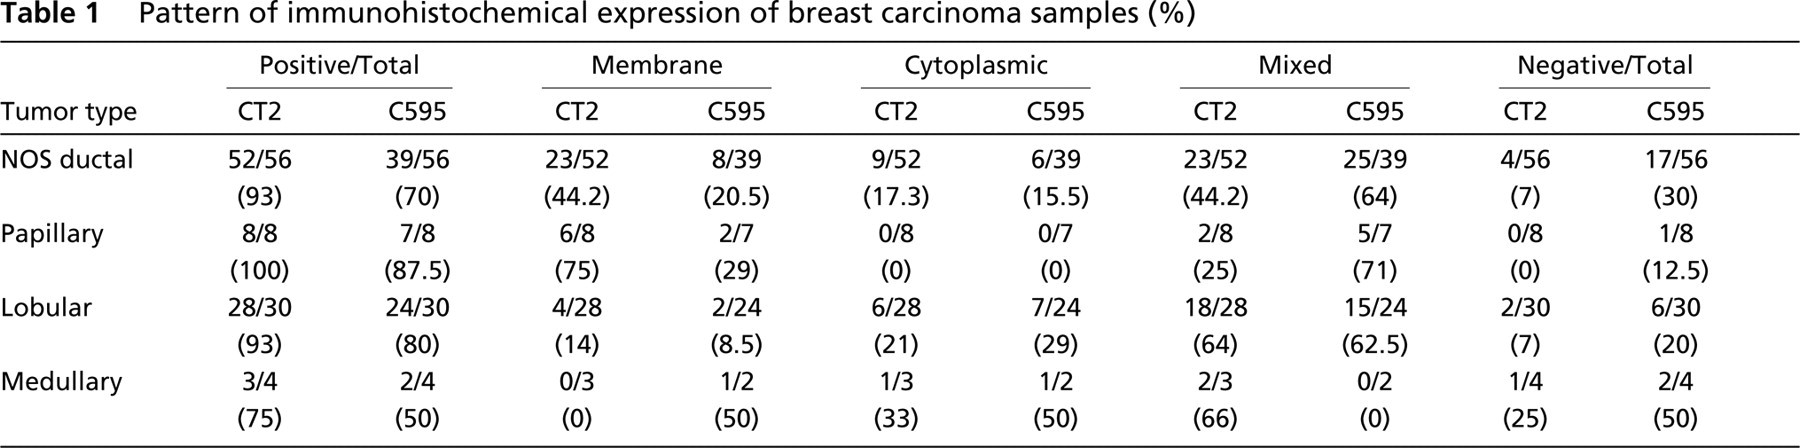
A total of 98 pretreatment tumor samples were obtained from newly diagnosed breast cancer patients at different stages of disease; all cases were typed as invasive adenocarcinoma: not otherwise specified ductal type (NOS ductal) 56 (57%), papillary ductal carcinoma in situ (DCIS) with invasive component 8 (8%), lobular type (LC) 30 (31%). Four cases (4%) were medullary (MC). Disease staging was also established: 23 (23%) corresponded to stage I, 45 (46%) to stage II, 25 (25.5%) to stage III, and 5 (5%) to stage IV (Table 1). Tumors corresponding to NOS ductal type showed different grades of differentiation as follows: 7/56 (12%) were well differentiated, 11/56 (20%) moderately differentiated, and 38/56 (68%) were poorly differentiated tumors. Mean age was 56 with a range of 25–86 years. The population under study included non-smoking women.
Tissue samples from normal biopsy samples (n=7) obtained during breast cosmetic surgery as well as samples from six patients with benign breast disease (cystic changes, adenosis, and atypical hyperplasia) were also included as controls.
Procedures followed were in accordance with the Helsinki Declaration. Informed consent was obtained from all women included in this study.
Each tissue was studied using routine procedures. Specimens were sectioned in several parts to cover different programmed studies. A piece of tissue was fixed for histopathological diagnosis and IHC analysis. Another tissue sample was rinsed with sterile Hank's balanced solution and processed for preparation of subcellular fractions (see below).
Antibodies
Two monoclonal antibodies were assayed: MAb CT2, developed in Armenian hamster, directed against the last 17 amino-acids (SSLSYNTPAVAATSANL) of the cytoplasmic tail of MUC1 (Schroeder et al. 2001), and MAb C595 developed against the VNTR from MUC1 core protein, which defines the tetrameric epitope Arg-Pro-Ala-Pro (RPAP) in the protein core (Price et al. 1990).
Methods
IHC Analysis. The technique was performed according to standard procedures. The specimens were fixed in Methacarn (chloroform:methanol:acetic acid 60:30:10) for 2 hr and then transferred into 70% ethanol until processing in paraffin. Tissues were treated with 10 mM sodium citrate buffer at 100C for 5 min and incubated overnight at 4C with either CT2 or C595. In the first case, MAb CT2 diluted 1:500 was employed. After three washes with phosphate buffer, biotin–SP-conjugated affinity-purified goat anti-Armenian hamster IgG (H+L) (Jackson ImmunoResearch; West Grove, PA) diluted 1:1000 was added and incubated for 1 hr. A final incubation with peroxidase-conjugated streptavidin (Jackson ImmunoResearch) was performed. MAb C595 diluted 1:1000 was used. After three washes with phosphate buffer, peroxidase-conjugated goat anti-mouse IgG (Dakopatts; Copenhagen, Denmark) diluted 1:400 was added and incubated for 60 min. The slides were counterstained with hematoxylin and coverslipped with mounting medium.
Pattern of immunohistochemical expression of breast carcinoma samples (%)
Negative controls were incubated with PBS instead of MAbs. Staining of cytoplasm and of plasma and nuclear membranes was evaluated. Cells were considered positive when at least one of these components was stained.
Sections were examined by light microscopy and the antibody staining patterns were scored in a semiquantitative manner. Staining intensity was graded as negative (-), low (+), moderate (+ +), or strong (+ + +) (Feickert et al. 1990). The number of low power (X10) optical fields in a specimen that were positively stained was expressed as a percentage of the total number of optical fields containing tissue.
The pattern of reaction was classified according to other authors (Renkonen et al. 1997): membrane, cytoplasmic, or mixed pattern (cytoplasmic mixed with plasma membrane staining), and the positive reaction of the lumen content was identified as cell debris or secretion.
Preparation of Subcellular Fractions. Fractions were prepared from all breast tissues according to Price et al. (1985). Samples were exhaustively dissected, necrotic areas were discarded, and neoplastic or normal tissues were cut into 1-mm pieces and extensively washed with 10 mM Tris, pH 7.2. Immediately thereafter, homogenization was performed in an ice bath employing the same buffer with 0.01 M polymethylsulfonylfluoride (Sigma–Aldrich; St Louis, MO). Homogenates were filtered through a metallic mesh and centrifuged at 600 × g at 4C for 30 min. The pellet obtained was called the pellet/nuclear fraction. Supernatants were centrifuged at 105,000 × g at 4C for 60 min. Precipitates were resuspended in 1.41 M PBS and called the membrane fraction; supernatants corresponded to the cytoplasmic fraction.
Pellets, membrane as well as cytoplasmic fractions, were dialyzed against 1.41 M PBS at 4C for 48 hr, lyophilized, and stored at −20C. Samples were then analyzed by SDS-PAGE and immunoblotting.
SDS-PAGE and Immunoblotting. The isolated fractions were analyzed under reducing conditions in SDS-PAGE in a discontinuous buffer system according to Laemmli (1980). Fractions were resuspended in SDS-PAGE sample buffer containing 2% SDS and 5% 2-mercaptoethanol and heated at 90C for 5 min. After electrophoresis, gels were either stained with Coomassie brilliant blue (Sigma–Aldrich) or they were transferred electrophoretically to nitrocellulose membranes (Towbin et al. 1979), which were blocked with 10 mM Tris-HCl (pH 7.4)/1% BSA (blocking buffer), washed with saline 10 mM Tris-HCl (pH 7.4), and incubated with MAb CT2 or C595 in blocking buffer. Primary MAb CT2 was used at 1:500 and C595 at 1:800 in blocking buffer. After an overnight incubation at 4C, the blots were rinsed three times for 5 min in saline 10 mM Tris-HCl (pH 7.4) buffer. For blots incubated with MAb CT2, biotin–SP-conjugated affinity-purified goat anti-Armenian hamster IgG (H+L) (Jackson ImmunoResearch) diluted 1:10,000 in saline 10 mM Tris-HCl was added, incubated for 1 hr, and washed with the same buffer. A final incubation with peroxidase-conjugated streptavidin (Jackson ImmunoResearch) was performed according to the manufacturer's instructions.
When MAb C595 was used as second antibody, peroxidase-conjugated goat anti-mouse IgG (Dakopatts) diluted 1:800 was added. Nitrocellulose sheets were developed with 3,3'-diaminodiazobenzidine in 10 mM Tris-HCl (pH 7.4) containing 1 μg/ml 30% H2O2.
Statistical Analysis
Statistical study was performed employing different methods. A multivariate analysis was applied through principal component analysis (PCA) with Kendall correlation including all standardized data. Relationship among variables (metric and non-metric) was studied; a set of dichotomous variables (dummy) was used to represent each non-metric variable. Spearman rank correlation (p<0.05) was also run, including MUC1 detection through MAb CT2 and MAb C595 and disease stage, histological type, and histological grade. Comparison of percentage of positivity among groups was studied using χ2 analysis.
Results
Immunohistochemical Staining
Breast Carcinoma. Employing MAb CT2, IHC analysis showed a high percentage of positive staining in 91/98 (93%) specimens. In 60/91 (66%) positive samples, the reaction comprised the entire specimen, while in 31/91 (34%) staining was restricted to a few areas of the sample. In most cases (82/91; 90%) the staining intensity was strong (+ + +).
Table 1 summarizes the percentage of positive results as well as the pattern of reaction according to the tumor type.
In NOS ductal carcinoma, considerable heterogeneity of staining at the cellular localization was found. In 44.2% of specimens, only plasma membranes reacted positively. Several tumors showed a continuous reaction, whereas others showed a discontinuous pattern. In several samples, luminal content was also stained. Frequently, cytoplasmic staining was observed together with a membrane reaction in a mixed pattern (Figures 1A and 1B). In 17.3% of specimens, the reaction was restricted to the cytoplasm, either in a homogeneous pattern (Figure 1C) or with a granular aspect.
A high percentage of LC (64%) was stained both in plasma membrane and in cytoplasm, with a mixed pattern (Figure 1D). In 6/28 specimens, reaction comprised only the cytoplasm, while staining restricted to plasma membrane was found in a few samples.
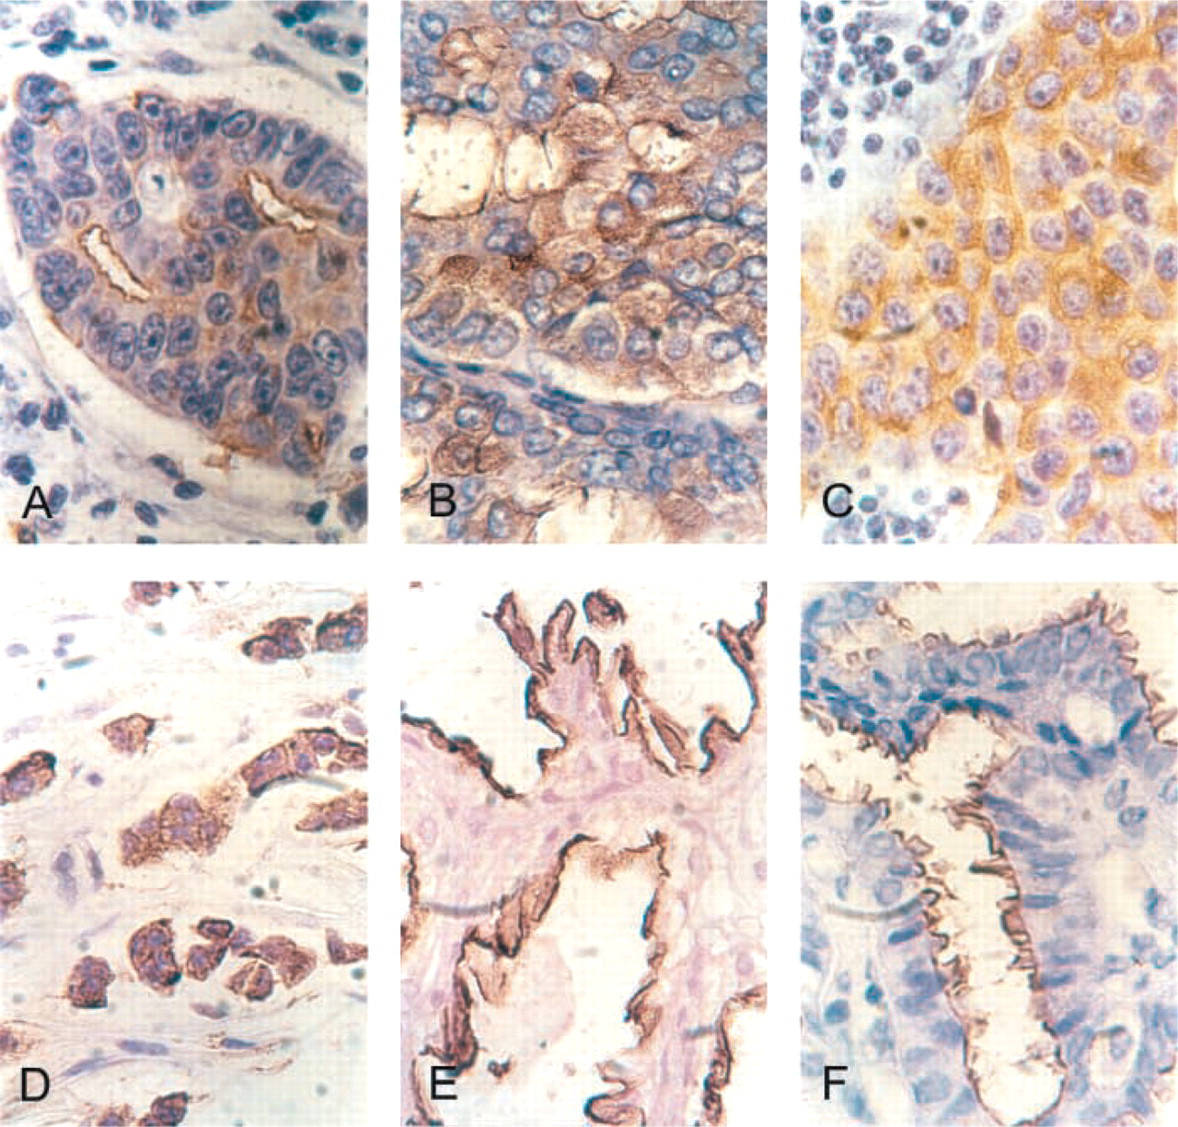
Immunohistochemical findings obtained by incubation with MAb CT2. (
All papillary DCIS with an invasive component examined showed a positive reaction, mainly at the plasma membrane. Usually the reaction covered the papilla externally and internally lined the apical membrane (Figure 1E). Two specimens were also reactive at the cytoplasmic level (mixed pattern).
Cytoplasmic staining was predominant or exclusive in MC samples. As was expected, given that 93% of tumors were reactive, no statistically significant correlation was obtained among tumor stage, degree of differentiation, or histopathological tumor type and MUC1-CT expression detected with MAb CT2.
Immunohistochemical analysis was also performed employing an anti-MUC1 VNTR MAb (MAb C595). Intensity of reaction observed was as follows: 19/72 (26%) malignant samples showed strong intensity; 32/72 (44%) showed moderate staining; 21/72 (29%) showed low intensity, and 16/72 (22%) were negative.
Percentages of subcellular localization of MUC1 reactivity related to tumor type are summarized in Table 1. Similar percentages of membrane and cytoplasmic staining were found, mainly in a mixed pattern.
Statistical analysis did not show any correlation between MUC1 detection and disease stage, histological type, or histological grade. Multivariate analysis by PCA with Kendall correlation showed a significant correlation between MAb CT2 and C595 staining (τ=0.5147).
Control Samples. With the anti-cytoplasmic tail MAb (MAb CT2) all control specimens showed positive reactivity. MUC1 expression in samples of benign breast disease and normal tissues was similar. Some specimens showed a reaction restricted to a few areas, but others showed more extensive staining. The pattern of reaction was observed mainly at the apical level of plasma membranes (Figure 1F), although several samples also showed a cytoplasmic apical reaction.
With MAb C595, benign breast samples showed MUC1 tissue expression in two of six samples, while three of seven normal specimens were reactive. The staining pattern was mainly restricted to the apical plasma membrane.
Subcellular Fractions
All tissue samples were subjected to subcellular fractionation followed by SDS-PAGE and Western blotting analysis of their derived fractions. In malignant tissue fractions, this analysis demonstrated the presence of several bands at different molecular weights (MW). With MAb CT2, the fraction showing the most intense reaction was the membrane moiety. Under denatured conditions, a smear reaction was usually obtained from 20 kD up to <200 kD, although some bands were impossible to identify. An example is shown in Figure 2A, where a strong band of reaction was found at approximately <30 kD and other minor bands were found at 60 kD. The cytoplasmic and nuclear fractions showed the same reaction, with a minor intensity of staining. In some other samples, the reaction at <30 kD was split into two different bands (data not shown).
The incubation with MAb C595 showed a double band of reaction at approximately 180-200 kD in all malignant tissue-derived fractions (Figure 2B). In one third of samples, bands of MW >200 kD were also found in pellet, membrane, and cytoplasmic fractions. A smear reaction from >50 kD up to >200 kD was frequently observed in all fractions. In pellet fractions, some samples (32%) showed additional bands at 70, 60, and 50 kD. In 29% of membrane fractions, bands of about 100, 70, 60, 50, 40, and 25 kD were found. Finally, in 50% of cytoplasmic fractions, bands of 80, 70, 60, 50, 40, 25 kD were observed.
Control Samples
By employing MAb CT2, pellet, membrane, and cytoplasmic fractions belonging to control samples showed bands at 30 kD and also at about 60 kD. In some samples, a double band at >180 kD, corresponding to membrane fractions, was identified.
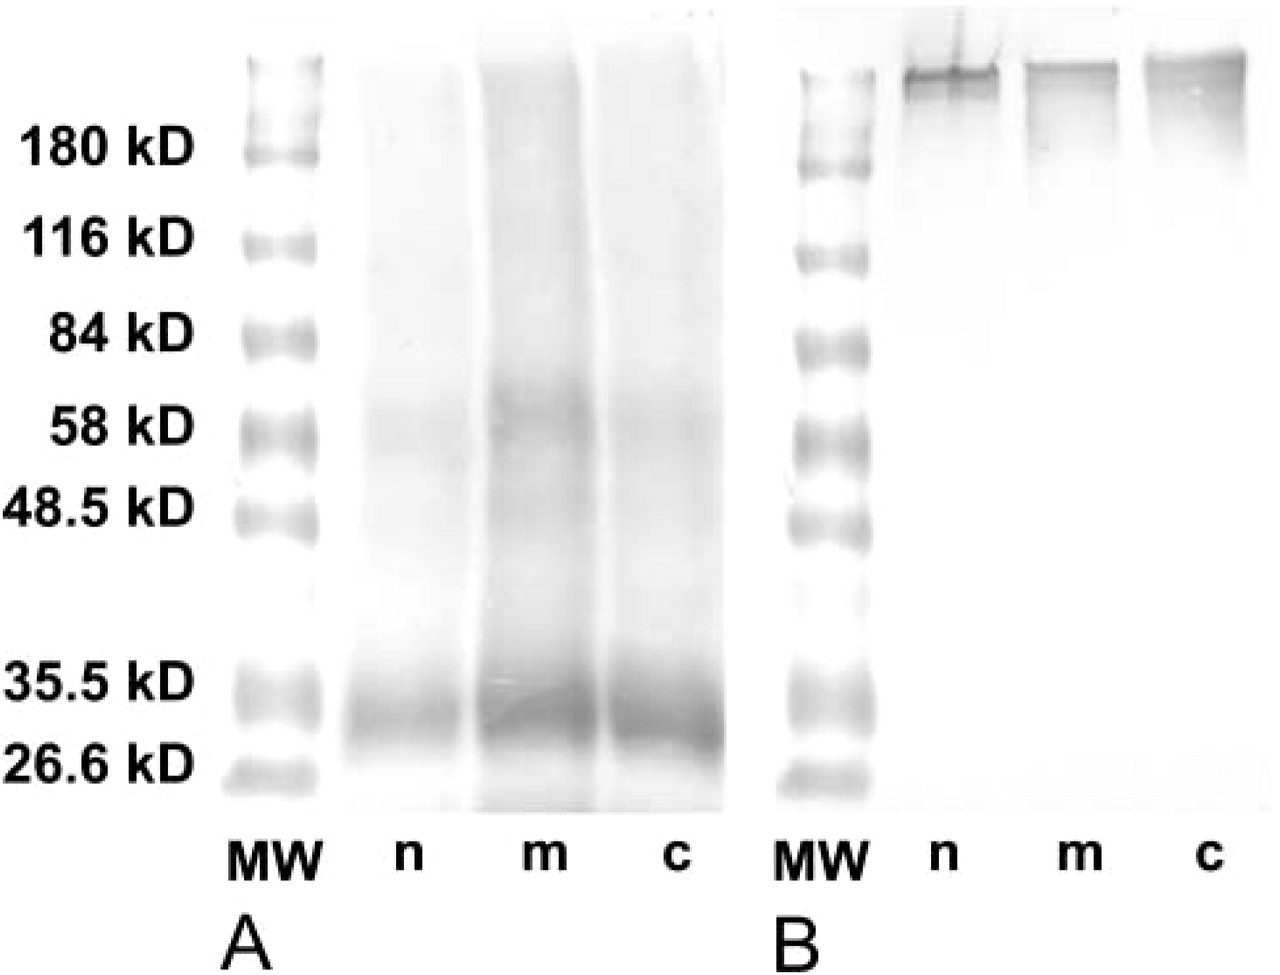
Western blot of extranuclear membranes belonging to breast cancer samples. n, nuclear fraction; m, membrane fraction; c, cytoplasmic fraction. Standard molecular weights are indicated at left. (
With MAb C595, a double band at 180 kD was found in all fractions. A smear reaction from 50–60 kD up to >200 kD was frequently observed in pellet, nuclear, and membrane fractions. In pellet fractions derived from three normal and two benign breast disease samples, bands at 70 kD and at 80 kD were also found.
Discussion
To our knowledge, this is the first extended IHC study developed in mammary gland tissues by employing an anti-MUC1 CT MAb (MAb CT2). Results were compared with an MUC1 tandem reactive MAb (MAb C595) which may place our findings in the context with the previously published literature. In breast cancer, MAb CT2 reacted with 93% of samples, and MAb C595 stained 73.5%. All benign and normal samples were reactive with CT2 but C595 failed to react with some control specimens.
Breast carcinoma tumors are frequently reactive with anti-VNTR MUC1 MAbs. Differences in percentages of reactive tumors depend on the MAb employed (Taylor-Papadimitriou et al. 1999). In recent investigations on breast cancer tissue samples (Croce et al. unpublished), we studied MUC1 expression employing three anti-MUC1-VNTR, C595, HMFG2, and SM3 MAbs. Through this IHC approach, percentage of reactivity was 74%, 70%, and 47%, respectively, lower than positive results obtained with MAb CT2 in the present study.
MAb C595 binds the RPAP sequence (Price et al. 1990). The trimer DTR is recognized by different MAbs (Petrakou et al. 1998) such as MAb HMFG2 (Burchell et al. 1989). In the study by Rahn et al. (2001), all breast tumor specimens expressed MUC1 (71 in situ and invasive ductal, lobular, and ductal–lobular admixed carcinomas), as well as adjacent regions of normal glandular tissue. Their findings may be explained by the fact that they used MAb B27.29, which targets PDTRPAP (Blockzjil et al. 1998) and which includes all the amino acids recognized by MAbs C595 and HMFG2. Carbohydrate side chains may also play a role because it is known that reactivity of MAbs C595 (Spencer et al. 1999), HMFG2 (Burchell and Taylor-Papadimitriou 1993), and B27.29 (Grinstead et al. 2002) are influenced by glycosylation.
On the other hand, MAb SM3 (Burchell et al. 1987) is considered the most cancer-specific MAb because it reacts mainly with malignant cells, whereas low staining is observed in normal samples (Croce et al. 1997; Taylor-Papadimitriou et al. 1999). MAb SM3 binds the pentapeptide PDTRP and the glycopentapeptide PDT(O-alpha-d-GalNAc)RP; these epitopes are recognized when the mucin is under-glycosylated (Burchell et al. 1989; Möller et al. 2002).
Different authors (reviewed by Rahn et al. 2001) have found contradictory results about MUC1 expression detected with anti-VNTR MUC1 MAbs in relation to different parameters such as prognosis, histological grade, response to treatment, estrogen and progesterone receptors, and disease dissemination. We are unable to comment on survival because of the very short follow-up of our patients, but through a multivariate statistical analysis we did not find a significant correlation among MUC1 expression and disease stage, histological type, and histological grade.
With respect to subcellular localization of MUC1, we have performed a detailed study of samples. In breast cancer, MAb CT2 showed reactivity mainly at the plasma membrane. The cytoplasmic staining was more frequently found in a mixed pattern. MAb C595 showed a similar percentage of cytoplasmic and membrane staining, mainly in a mixed pattern. Most samples did not show any polarization of the reaction which, on the other hand, constituted the hallmark of normal and benign tissue sample staining. In 330 breast carcinomas, Luna–Moré et al. (2001) have found that a linear (membrane) pattern was the least node-metastasizing, while the negative pattern was the most with the exception of micropapillary carcinomas. Rahn et al. (2001) have pointed out that an extended expression of MUC1 in cancer cells correlates with a better prognosis, although expression at the apical level is an accurate indicator of functional differentiation. In this sense, a correct localization is probably crucial for normal function. Pemberton et al. (1996) found that apical localization of MUC1 is conferred by a motif in the extracellular domain and is reported to require a CQC motif at the junction of the cytoplasmic and transmembrane domains. Deletions of the cytoplasmic tail of MUC1 have no effect on the apical localization, and MUC1 without a cytoplasmic tail is also correctly localized at the apical microvilli.
The use of an anti-MUC1-CT may constitute an accurate marker for MUC1 because it has not been described whether this MUC1 fraction can be liberated by the cell, although extracellular MUC1 may be secreted and released to serum as well as to ascites fluid (Devine et al. 1993; Linsley et al. 1998; Croce et al. 2001). Release of the ectodomain of MUC1 as a soluble form (MUC1/REP) appears to be the fate of the majority of MUC1 arriving at the surface of tumor cells (Julian and Carson 2002). To determine the molecular mass of the epitopes reactive with MAb CT2, Western blotting analysis was performed. In agreement with other authors (Schroeder et al. 2001) by Western blotting assay with MAb CT2, a main band was detected at about 30 kD, which corresponds to MUC1-CT. In some samples it was found split into two bands, which may represent the cytoplasmic and transmembrane domain, as well as 58 amino acids of the extracellular region, up to the cleavage site at Ser-Val-Val-Val (Hilkens et al. 1995; Schroeder et al. 2001).
It is possible that the 60-kD band is an alternative splice variant of MUC1, such as MUC1/Y (Zrihan-Licht et al. 1994). Using MAb C595, a characteristic band with different electrophoretic mobilities at approximately 200 kD was obtained, corresponding to the two human alleles of MUC1-VNTR (Price et al. 1990). These bands may correspond to the VNTR sequence from the heterodimeric MUC1, MUC1/REP, or the MUC1/SEC splice form.
In a percentage of subcellular fractions, different bands of low MW were also found, which may be due either to different steps of cellular metabolic processing or to generation by sample treatment (Julian and Carson 2002).
Many carcinoma-associated markers are glycoconjugates whose expression undergoes temporal or spatial regulation. MUC1 mucin is a well-documented example of such a molecule. In this sense, an anti-cytoplasmic tail MAb that recognizes the molecule, regardless of the presence of the VNTR sequence, may be useful to target intracellular MUC1 processing, and may also be an accurate marker at the membrane level. It may detect heterodimeric MUC1, MUC1/A, and MUC1/B variants as well as MUC/Y, MUC/X, and MUC1/Z isoforms. Alternatively, reactivity with MAb C595 may be explained by the fact that other spliced forms, such as MUC1/SEC, may also be expressed.
Our study indicates that the pattern of expression of MUC1 CT in breast epithelium may constitute a better indicator of MUC1 production because it does not depend on glycosylation. It also shows that the pattern and extent of MUC1 CT positivity do not vary according to the histopathological subtype of breast cancer.
Footnotes
Acknowledgements
Supported by CONICET (BID-CONICET: PICT05-06544 and PIP: 4718/96) and by the University of La Plata. This research project is part of the Program PRECANMA (Program for Breast Cancer Prevention) CICPBA-CINIBA, La Plata, Prov. Buenos Aires, Argentina).
We thank Dr Clemente Sala and Dr Jorge Gori for providing patient samples and Lic. Sandra Demichelis for statistical analysis.