
Abstract
Keywords
Introduction
Pancreatic adenocarcinoma (PAAD) is one of the most life-threatening malignancies globally because of its insidious onset, late diagnosis, and rapid malignant progression. Approximately 53% of patients with PAAD are diagnosed with metastasis, and the 5-years survival rate is only 9%. 1 In 2020, the global epidemic statistics listed PAAD as the seventh most common cause of cancer-related death, 2 which accounted for 4.5% of cancer deaths worldwide in 2018.3,4 Fewer than 20% of patients diagnosed with PAAD exhibit localized and resectable features, and only 5–8% of those have over 5 years of survival after excision. 5 However, the pathophysiological mechanisms underlying PAAD initiation and progression are still unclear.
Aging is a complex biological phenomenon involving various physical and physiological changes that increase the risk of multiple diseases, including cancers, neurological deterioration, inflammation, and metabolic associated diseases. 6 The mechanisms linking aging and cancer remain broadly unclear. Aging is associated with cellular senescence, which attributes to various biological and pathological changes, such as oxidative stress, cell longevity, and stem cell senescence. Cellular senescence is closely related to oxidative stress, cell longevity, and stem cell senescence. 7
Cancer is a disease of aging characterized by the incremental accumulation of somatic mutations. 6 Recent therapies targeting aging-related diseases revealed a positive antitumor effect by preventing a senescence-associated secretory phenotype. 8 Aging-associated genes have been shown to demonstrate essential roles in cellular senescence. Paradoxically, aging-associated genes can promote and inhibit tumor progression. 9 However, the correlation between aging-associated genes and PAAD proliferation and progression is unknown.
Cellular senescence is often accompanied by immune cell senescence and chronic inflammation, 10 which can contribute to cancer initiation and progression, indicating that inflammation might crosslink aging and cancer development. 10 Studies suggest that aging-related genes may affect human T cell populations, inducing immune cell senescence. 11 Studies have also demonstrated that aging and chronic inflammatory states can also cause immunosuppressive activities. 12
Immunotherapies have shown great potential in tumor treatment, 13 and immunotherapeutic responses have a close association with patient prognosis in multiple cancers. The efficacy of immunotherapy is closely related to the immune microenvironment, immune characteristics, and genomic features. 14 However, PAAD is often characterized as an immunologically “cold” cancer, making it less sensitive to immunotherapies. Therefore, developing novel strategies to better understand the relationships between aging, the immune microenvironment, and cancer is critical.
In this study, we identified three clusters based on differentially expressed aging-associated genes between healthy individuals and patients with PAAD. We also analyzed the clinical, immune, and mutation features. Additionally, we developed a novel prognostic prediction model based on aging-associated genes.
Materials and methods
Data collection and processing of the genomic profile
The workflow of this analysis is illustrated in Supplementary Figure 1. The genomic profiles and detailed basic information were obtained from the public databases of the International Cancer Genome Consortium (ICGC) PACA-AU and The Cancer Genome Atlas (TCGA)-PAAD cohorts (https://www.tcga.org/). The following inclusion criteria were followed: (1) histology was diagnosed with PAAD, and (2) data of samples have both transcriptional and clinical information. The following exclusion criteria were followed: (1) histologic diagnosis was not PAAD, (2) patients suffered from other malignant neoplasms except for PAAD, and (3) over 5 years of overall survival. Based on these criteria, 267 samples were selected as the testing dataset. Additionally, GDC API was adopted to download the RNA-seq data from the TCGA-PAAD cohort. After selection, 102 samples were chosen for further analysis. Also, 102 PAAD samples were obtained from the GEO dataset. This study identified the TCGA-PAAD cohort as the training set and TCGA-PAAD and GSE21501 as independent validation datasets.
CellAge
Cellular senescence genes were downloaded from CellAge (https://genomics.senescence.info/cells/). In this dataset, 279 aging-associated genes with gene expression signatures were available.
Data cleaning process
The raw data obtained from the ICGC database was cleaned and transformed before use. Samples that lacked gene test values or clinical information were excluded from the analysis. The chip probe identifiers were mapped onto the human genomic profile, and ensemble data was converted into gene symbols. The average value of some gene symbols combined with many expression values was adopted for further analysis. The annotation information was applied to chip probe genes for the GEO dataset, and the medium value was identified as the target gene expression level.
Classification of aging-associated genes via consensus cluster plus
Based on the expression level of aging-associated genes, the “pam” algorithm and “Pearson” was used from the ConsensusClusterPlus software (version 1.54.0) as length distance, 33 and 500 bootstraps were performed. The number of clusters was set as 2–10, and three subtypes were identified using R3.6.1. Additionally, the differences in prognosis and clinical features between these subtypes were explored. The Kaplan–Meier (K-M) curve in R3.6.1 package version 2.41–1 was used to investigate the overall survival of the three subtypes. 34
Construction of the cellular senescence-related signature scoring system of pancreatic adenocarcinoma samples
This study identified the differentially expressed aging-associated genes in the three clusters. A p-value less than 0.01 was considered statistically significant.
The least absolute shrinkage and selection operator (LASSO) Cox regression and univariate Cox analysis were applied to construct the aging-related genes-based prognostic risk model. The cellular senescence-related signature (CSRS) scoring system was calculated as CSCR score = Σβ1i × Exp i. The “i” represents the expression level of cellular senescence-related, while β is the cox regression index. The patients were classified into high and low-risk score groups, and a K-M curve was used for prognosis prediction.
Cell culture
1.1B4/PANC-1 pancreatic cancer cell and hTERT-HPNE cell line were cultured in complete culture medium (90% Dulbecco’s Modified Eagle Medium, 10% fetal bovine serum, 1% penicillin-streptomycin Solution), at 37°C with 5% CO2. The cells were cultured in large dishes, the media was replaced every 2 days, and the cells were allowed to grow for four generations until they reached 70–80% confluency.
RNA extraction and qPCR analysis
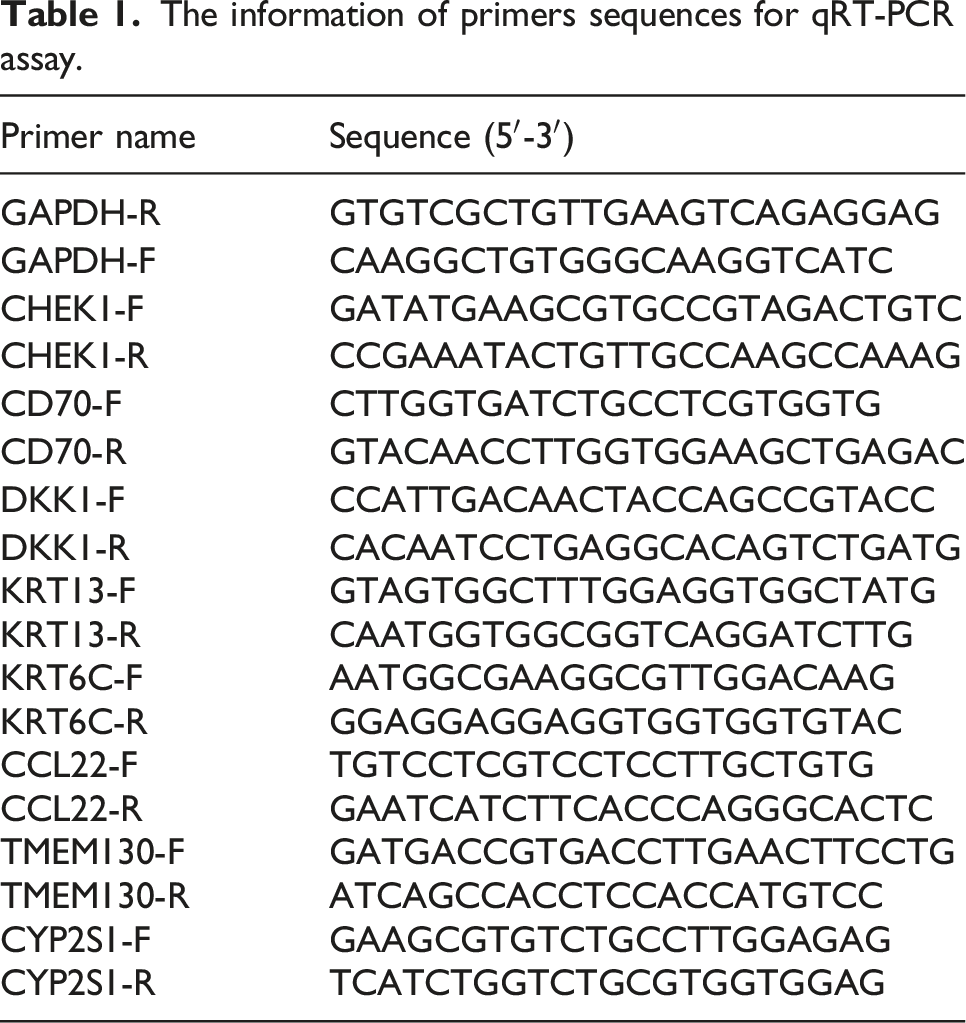
The information of primers sequences for qRT-PCR assay.
Immunotherapy responsiveness prediction
This study utilized the TIDE database (http://tide.dfci.harvard.edu/login/) to investigate factors involved in immune responses and immune escape.
Gene set enrichment analysis
The GSEA software (http://software.broadinstitute.org/gsea/doc/desktop_tutorial.jsp) was used to investigate the differentially enhanced signaling pathways between the subtypes of patients with PAAD. In the GSEA analysis, the “hallmark” database was selected as a candidate gene set for final analysis. Finally, the Kyoto Encyclopedia of Genes and Genomes (KEGG, www.kegg.jp/kegg/kegg1.html) was used to draw the pathway. 35
CIBERSORT analysis
CIBERSORT (http://cibersort.stanford.edu/) is an analytical tool, 36 which estimates the relative proportions and abundances of different immune cells with different signature gene files. CIBERSORT provides single-cell RNA-seq and cell type-specific gene expression purification.
Immune infiltration and immune purity evaluation
Databases and methods.

Statistical analysis
The R software 3.6.1 was used to analyze all the data. p-values less than 0.05 and log (fold change) larger than 1 were considered significant. The student’s t-test was applied to determine the clinical signatures between high and low-risk score subgroups.
Results
Aging-associated genes-based classification of pancreatic adenocarcinoma
To better understand the characteristics of aging-associated genes in PAAD, we performed univariate Cox regression analysis on the ICGC database. We obtained 53 cellular senescence genes closely related to PAAD prognosis using the Human Ageing Genomic Resources (https://genomics.senescence.info/cells/index.html). We used the same method for the Cancer Genome Atlas (TCGA)-PAAD dataset and identified 102 prognosis-related genes. The union of the two datasets resulted in the identification of 21 hub genes associated with PAAD prognosis (Figure 1(a)). Based on these 21 cellular-associated genes, we applied the ConsensusClusterPlus on 267 PAAD samples. The cumulative distribution function (CDF) consensus status (Figure 1(b)) and delta curve (Figure 1(c)) suggested that “k = 3” would result in stable clustering, which produced three clusters, C1, C2, and C3 (Figure 1(d)). The K-M curve revealed that C3 had the longest survival time, while C1 had the shortest overall survival time in the ICGC dataset (Figure 1(e)). The mortality rate was significantly higher in C1 than in C3 in the ICGC dataset (Figure 1(f)). Similarly, patients in C1 had the shortest survival time and highest mortality in the TCGA-PAAD dataset (Figure 1(g)–(h)). Classification of aging-related genes profiles. (a) Overlap of senescence-related genes with significant prognosis in the ICGC and TCGA-PAAD datasets. (b) CDF curve of the ICGC cohort. (c) CDF delta area curve of the ICGC cohort. (d) Sample clustering heatmap with consensus K = 3. (e) K-M curve for prognosis of C1, C2, and C3 in the ICGC cohort. (f) Differences in the survival status of C1, C2, and C3 in ICGC. (g) Prognostic differences among C1, C2, and C3 in the TCGA-PAAD cohort. (h) Differences in the survival status of different subtypes of TCGA-PAAD. The lower part represents the proportion, and the upper part indicates the statistical significance of the distribution difference between pair-log10 (p-value).
The differential clinical-pathological features between C1, C2, and C3
To investigate the clinical features between the three clusters, we identified the patients with PAAD with T2 and T3 stages, N1 stage, and G2 and G3 grades. The C1 cluster exhibited advanced G3 and G4 grades compared with the C3 cluster in the ICGC-PAAD cohort (Figure 2(a)). Additionally, most patients with PAAD in T2 and T3 stages, N1 stage, and G2 were G3 grade. Cluster C1 had a higher proportion of patients above 80 years old than C3 (Figure 2(b)). Differences in the clinicopathological characteristics between the three clusters. (a) Clinicopathological characteristics of the ICGC cohort between the three clusters. (b) Clinicopathological characteristics of the TCGA-PAAD cohort between the three clusters.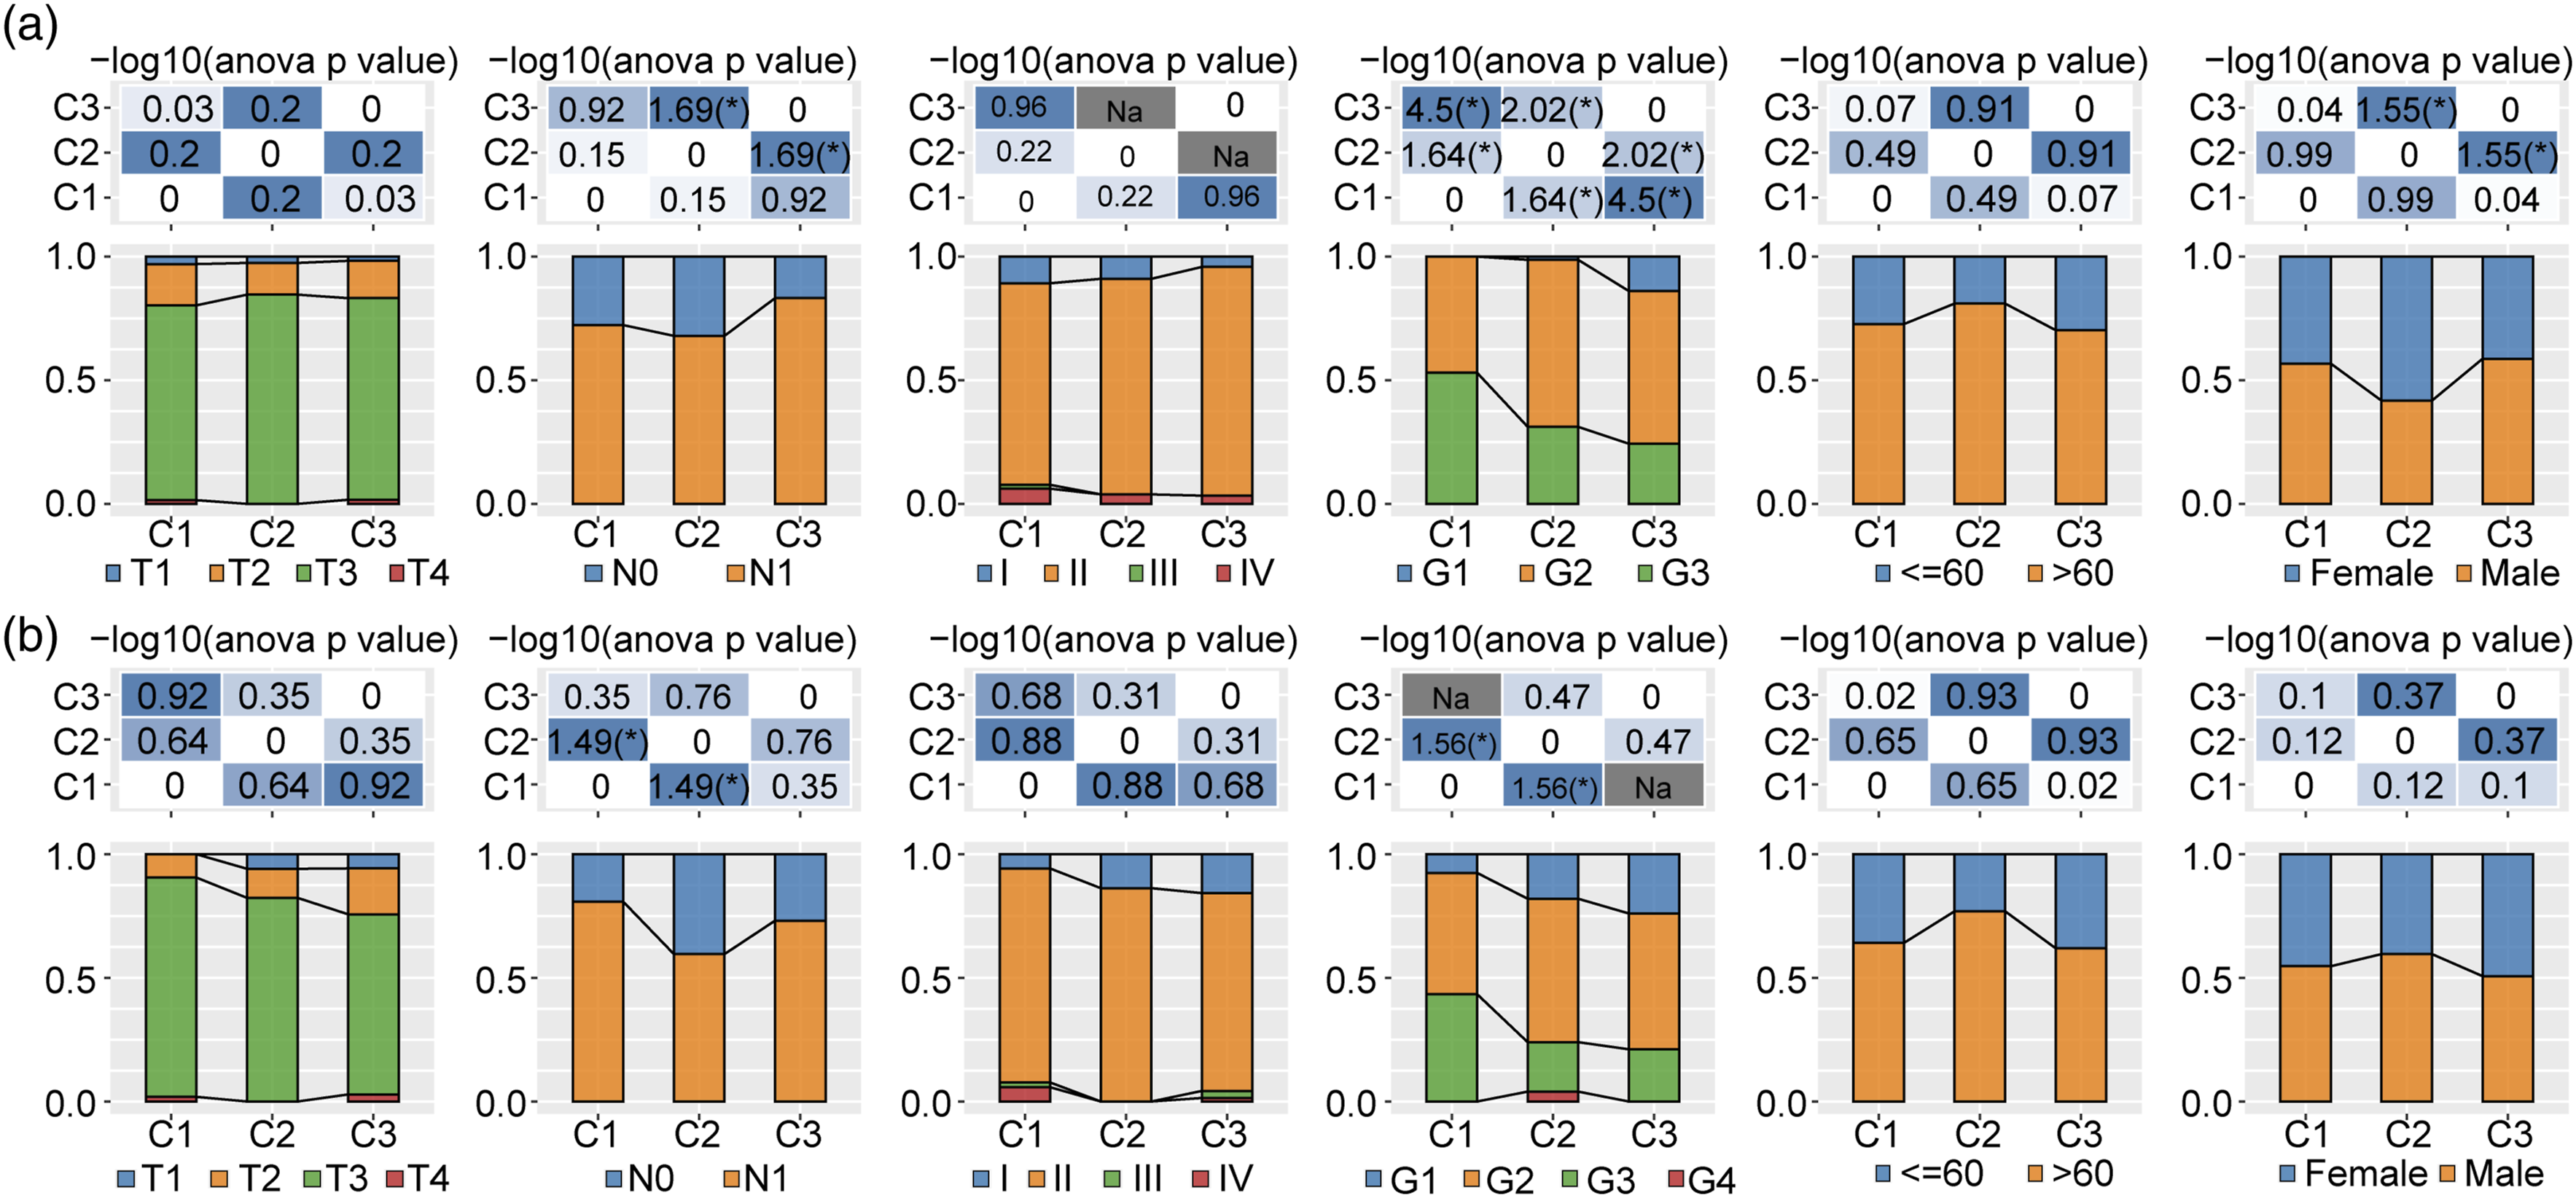
The significantly enriched signaling pathways in the clusters
To further investigate the enriched signaling pathways, we performed a GSEA analysis using the Hallmark database, with a false discovery rate (FDR) < 0.05 considered statistically significant. In the ICGC cohort, 23 pathways were significantly enriched in C1 (Supplementary figure 2A), while in the TCGA-PAAD cohort, 28 pathways were significantly enriched in C1 compared with C3 (Supplementary figure 2B). We also compared the differentially expressed signaling pathways between C1 and C3 subtypes in ICGC pancreatic cancer cohorts (Supplementary figure 2B). The activated pathways primarily included cell cycle pathways, such as E2F targets, G2M checkpoint, Myc targets V1, and Myc targets V2. Additionally, we compared the differentially enriched signaling pathways between the C1 and C2, C1 and C3 subtypes, and C2 and C3 subtypes. Overall, the cell cycle pathway was significantly activated in C1 (Supplementary figure 2C). Therefore, we conclude that molecular typing of cellular senescence genes may play an essential role in the cell cycle pathway and tumor microenvironment.
The immune signatures between the three clusters
To identify differences in the immune microenvironment between the three clusters, we used CIBERSORT. Our analysis revealed that C1 had a higher CD8+ T cell infiltration than C2 and C3. Moreover, C1 had fewer CD4 memory T cells than C2 and C3, while C3 had a higher monocyte level than C1 and C2 in the ICGC cohort (Supplementary figure 3A). ESTIMATE was also used to evaluate the immune infiltration status in the three clusters (Supplementary figure 3B). Our results demonstrated that the C3 cluster had the highest immune, stromal, and ESTIMATE scores in the ICGC cohort (Supplementary figure 3B). In the TCGA-PAAD cohort, naïve B cells, CD8+ T cells, and monocyte levels were higher in C3 than in C1 (Supplementary figure 3C). Therefore, our results established that the C3 cluster had higher immune, stromal, and ESTIMATE scores in the TCGA-PAAD cohort.
The immunotherapies difference between the three clusters
We further compared immune checkpoint gene expression differences between the three clusters and observed a differential expression of most of the immune checkpoint genes in the three clusters. CD276, CD44, CD70, CD86, NRP1, and TNFSF4 were highly expressed in C1 in the ICGC cohort (Figure 3(a)). In the TCGA-PAAD cohort, CD276, CD44, CD70, and TNFSF4 were highly expressed in C1 (Figure 3(b)). Furthermore, we used the tumor immune dysfunction and exclusion (TIDE) software and evaluated the immune microenvironment. The TIDE score of the C1 subtype was slightly higher than the C2 and C3 in the ICGC cohort, suggesting that the C1 subtype has a higher possibility of immune escape and is less likely to benefit from immunotherapy (Figure 3(c)). Similar results were observed in the TCGA-PAAD cohort (Figure 3(d)). In addition, we analyzed the immunotherapeutic response of the three clusters in the ICGC and TCGA-PAAD cohorts to traditional chemotherapeutic drugs, gemcitabine, cisplatin, erlotinib, and 5-fluorouracil. The results suggest that C1 is sensitive to gemcitabine, while chemical therapies like cisplatin and erlotinib were more sensitive (Figure 3(e)). Differences in immunotherapy/chemotherapy between the three clusters. (a, b) Differentially expressed immune checkpoint genes between the three clusters in the ICGC (a) and TCGA-PAAD (b) cohorts. (c, d) TIDE score differences between the three clusters in the ICGC (C) and TCGA-PAAD (d) cohorts. (e) The box plots of the estimated IC50 for Gemcitabine, Cisplatin, Erlotinib, and 5-fluorouracil in the ICGC and TCGA-PAAD cohorts.
Identification of key aging-associated genes
We utilized the limma package to identify the C1, C2, and C3 molecular subtypes of differentially expressed genes with a screening threshold of FDR <0.01 and | log2FC | > 1. We screened 522 genes (ICGC.deg.sig.txt) and conducted a univariate Cox regression analysis of differentially expressed genes between subtypes. Our analysis identified 219 genes with a significant prognostic ability (p < 0.01), including 121 “Risk” and 98 “Protective” genes (Figure 4(a)). Next, we applied the LASSO Cox regression analysis to construct the prognostic model, with a 10-fold cross-validation to validate the confidence intervals under each lambda. The results revealed that the model is optimal when lambda = 0.069; therefore, we selected 19 genes at lambda = 0.069 as the target genes for further analysis (Figure 4(b)). We used stepwise multifactor regression analysis based on the 19 genes in the LASSO analysis. Finally, eight genes, CHEK1, CD70, DKK1, KRT6C, KRT13, CCL22, TMEM130, and CYP2S1, were found to be associated with cellular senescence phenotypes that affect prognosis (Figures 4(c) and (d)). We also observed a significant increase of CCL22, CHEK1, CYP2S1 KRT13, DKK1, and CD70 in 1.1B4/PANC-1 pancreatic cancer cells compared with hTERT-HPNE cells. TMEM130 was significantly decreased in the pancreatic cancer cells compared with hTERT-HPNE cells (Figure 4(e)). Combined with the results of wet experiment validation, these genes were found to have good prediction ability in pancreatic cancer. Identification of eight aging-related hub genes and establishment and validation of prognostic models. (a) A total of 219 promising candidates were identified among the differentially expressed aging-related genes. (b) The trajectory of each gene with lambda changes. (c) The confidence interval estimation of partial area under curve based on the eight hub genes. (d) The LASSO Cox coefficients of the aging-related genes were recognized. CHEK1, CD70, DKK1, KRT6C, and KRT13 were identified as risk factors. CCL22, TMEM130, and CYP2S1 were recognized as protective factors. (e) The qPCR analysis tested the RNA expression level of 8 genes in 1.1B4/PANC-1 pancreatic cancer cell and hTERT-HPNE normal pancreatic cell line. (f) CSRS score, prognosis status, and senescence-related genes in the ICGC cohort. (g) The ROC curve and AUC of CSRS score-based subgroups in the ICGC cohort. (h) The overall survival time curve between high and low CSRS score subgroups in the ICGC cohort. (i, j) The ROC (i) and K-M curves (j) of the high and low CSRS score group in the TCGA-PAAD cohort. (k, l) The ROC (k) and K-M (l) curves of the high and low CSRS score group in the GSE21501 dataset.
Establishment and validation of clinical prognostic models
The cellular senescence-related signature (CSRS) scores of the samples were calculated and normalized (Figure 4(f)). Analysis of the CSRS score distribution of patients in the ICGC cohort of the training set demonstrated that patients with higher CSRS score samples had a poorer prognosis. We used the R software package Time ROC for ROC analysis of the prognosis classification of the CSRS score (Figure 4(g)). We analyzed the classification efficiency of prognosis prediction in 1, 2, and 3 years. Finally, a CSRS score greater than 0 was classified as high-risk, while a CSRS score less than or equal to 0 was classified as low-risk. The results demonstrated a significant difference between the high and low CSRS score subgroups, with 125 samples classified as high CSRS scores and 142 samples as low CSRS scores. Patients with higher CSRS scores exhibited poorer overall survival in the training cohort (Figure 4(h)). To confirm the robustness of the clinical prognostic model, we also tested them in the TCGA-PAAD and GSE21501 cohorts, using the same method to calculate the CSRS score of patients. Similar to the training set, these results suggested that a high CSRS score had a worse prognosis, and a low CSRS score had a better prognosis (Figure 4(i)–(l)).
The clinical-pathological features in different CSRS score-based subtypes
A comparison of the distribution of CSRS scores among groups of clinicopathological features in the ICGC cohort revealed a higher CSRS score in patients with advanced clinical stages. CSRS scores were also significantly different between different grades, with the advanced grades having higher CSRS scores. Additionally, the CSRS score was significantly higher in male than female patients, while C1 had a higher CSRS score than C2 (Supplementary figure 4A). We also examined the prognostic differences between clinicopathological feature groups in the ICGC cohort (Supplementary figure 4B). These results demonstrated the reliability of the CSRS score-based classification prognostic tool.
The immune/pathway characteristics of the two subgroups
To further elucidate the differences in the immune microenvironment of patients in the CSRS score grouping, we compared the relative abundance of 22 immune cell types between the two subgroups. CD8 T cells and CD4 memory T cells were significantly enriched in the CSRS score-low group, while M2 macrophages were significantly enriched in the CSRS score-high group (Figure 5(a)). We used ESTIMATE to assess immune cell infiltration (Figure 5(b)) and analyzed the association between the CSRS score and the 22 immune cell types (Figure 5(c)). Our results revealed a significant correlation between the CSRS score and some immune cell types. To better explore the association between CSRS score and biological functions, we selected the gene expression profile corresponding to pancreatic cancer samples in the ICGC cohort for single-sample GSEA analysis using the R software package. The results include the cell cycle-related pathways Kyoto Encyclopedia of Genes and Genomes (KEGG) P53 signaling pathway, KEGG Mismatch repair, KEGG DNA replication, KEGG Nucleotide excision repair, and KEGG cell cycle. We demonstrated a positive correlation between cell cycle-related pathways and the CSRS score of samples (Figure 5(d)). Immune pathway characteristics between high and low CSRS score groups. (a) The proportion of immune cell components in the ICGC cohort. (b) The proportion of immune cell components calculated by ESTIMATE software in the ICGC dataset. (c) The correlation analysis between 22 immune cell types and CSRS score in the ICGC cohort. (d) The correlation analysis between the enriched KEGG pathways and CSRS score.
CSRS score differences in immunotherapy/chemotherapy between subgroups
We compared the differences in immunotherapy responses between CSRS score subgroups in the ICGC cohort. Most immune checkpoint genes were differentially expressed between the CSRS score subgroups (Figure 6(a)). We then analyzed the differences between the two CSRS score subgroups in immunotherapy using the TIDE software to assess their potential clinical effects. The higher the TIDE prediction score, the greater the possibility of immune escape, suggesting that patients are less likely to benefit from immunotherapy. The results revealed that the CSRS score-high group had a higher TIDE score in the ICGC cohort, suggesting that patients in the CSRS score-high group had a higher possibility of immune escape and were less likely to benefit from immunotherapy (Figure 6(b)). Furthermore, we analyzed the CSRS score in the ICGC cohort to predict the response to traditional chemotherapeutic drugs gemcitabine, cisplatin, erlotinib, and 5-fluorouracil. Our results demonstrated a higher sensitivity to gemcitabine, cisplatin, erlotinib, and 5-fluorouracil in the high CSRS score group (Figure 6(c)). Immune pathway characteristics between high and low CSRS score groups. (a) Differentially expressed immune checkpoints between different subgroups in the ICGC cohort. (b) TIDE analysis uncovered differences between different subgroups in the ICGC dataset. (c) The box plots of the estimated IC50 for gemcitabine, cisplatin, erlotinib, and 5-fluorouracil in the ICGC cohort.
CSRS score combined with clinicopathological features might improve prognostic prediction
Univariate and multivariate Cox regression analysis of CSRS score and clinicopathological features revealed that CSRS score was the most significant prognostic factor (Figure 7(a) and (b)). To quantify the risk assessment and survival probability of patients with pancreatic cancer, we constructed a rosette combining the CSRS score and other clinicopathological features (Figure 7(c)). Furthermore, we used the calibration curve to estimate the prediction accuracy of this aging-related gene-based prognostic model (Figure 7(d)). The results demonstrated that the prediction curve in 1, 2, and 3 years are nearly coincident with the standard curve. These results indicated that the line chart has accurate predictive performance. Additionally, DCA (Decision curve) was used to evaluate the reliability of the model. The CSRS score and Nomogram benefit were significantly higher than the extreme curve. Finally, both Nomogram and CSRS scores exhibited the strongest survival prediction ability compared with other clinicopathological features (Figure 7(e) and (f)). Combined CSRS score with clinicopathological features indicates good survival prediction in PAAD. (a–b) Univariate and multivariate Cox analysis of the CSRS score and clinicopathological features. (c) The line graph model. (d). Calibration curves of the 1, 2, and 3 years of the row diagram. (e) The decision curve of the line graph. (f) The Nomogram exhibited the most potent capacity for survival prediction compared with other clinicopathological features.
Discussion
Pancreatic ductal adenocarcinoma (PAAD) is a leading cause of cancer-related deaths worldwide due to late manifestation and resistance to current therapies. 15 Despite its relatively low tumor mutational burden, PAAD is a quiescent tumor that remains largely resistant to immunotherapeutic interventions. 16 Therefore, there is an urgent need to identify novel cancer mechanisms and develop a personalized diagnosis, treatment, and prognosis prediction strategies for PAAD. Studies have reported that oncogene-induced senescence can functionally constrain tumorigenesis, impeding cancer development. 17 However, studies have revealed a novel oncogene function of senescent cells toward their microenvironment. 15 Therefore, exploring the senescence-related genes and their function in tumor mechanisms might provide novel ways for developing effective cancer therapies.
In this study, we adopted the ConsensusClusterPlus algorithm on aging-related gene profiles of the PAAD cohort and identified three clusters, C1, C2, and C3. In the TCGA-PAAD cohort, C1 had the shortest survival time and highest mortality. The C1 cluster patients had more advanced clinical grades than the C3 cluster in the ICGC-PAAD and were more sensitive to gemcitabine. Chemical therapies like cisplatin and erlotinib were more sensitive than other clusters. We further investigated the clinical-pathological features and immune microenvironment characteristics of these three clusters. The C1 cluster had a shorter overall survival time, advanced clinical grades, lower immune ESTIMATE score, and TIDE score compared with the C3 cluster. The C1 cluster was also enriched in cell cycle activation signaling pathways. Furthermore, we identified 8 hub genes such as CHEK1, CD70, DKK1, KRT6C, KRT13, CCL22, TMEM130, and CYP2S1, which was used to construct the risk model. The high CSRS score subtype had a poor prognosis, advanced clinical grades, M2 macrophage infiltration, high immune checkpoint genes infiltration, and low immunotherapeutic benefits. In malignant melanoma, low aging risk score patients had increased expression of immunosuppressive cytokines and immune checkpoints. 18 Similarly, the high-risk cohort in rectal cancer shows a worse prognosis than the low-risk group. 19 In hepatocellular carcinoma, the risk score model based on the aging-related genes suggests that high-risk scores show a poor prognosis compared with the low-risk score subgroup. 20
Specifically, these risk score model-associated genes play various roles in cancer initiation, progression, and microenvironment formation. Activated CHEK1 phosphorylates key regulators, which play essential roles in cellular proliferation, apoptosis, and DNA repair. 21 We uncovered that CHEK1 was significantly increased in PAAD cells. CD70 is the ligand of T cell costimulatory receptor CD27, a membrane-expressed homotrimeric type II membrane molecule. 22 The CD27–CD70 interaction functions as a key regulator in T cells and B cells expansion and differentiation.22,23 We found that CD70 serves as a risk factor in the aging-associated genes-based model in PAAD. DKK1 is a key regulator for Wnt pathway inhibition, which is linked to various cancers.24,25 We recognized DKK1 as an important gene in PAAD initiation and progression. KRT6C has been shown to be significantly increased in lung adenocarcinoma tumor tissues and related to poor prognosis and malignant capabilities. 26 KRT6C was also validated as a key risk factor in PAAD. KRT13 plays an important role in maintaining the cellular structures. 27 The aberrantly expressed KRT13 might function as a biomarker for differential diagnoses and metastatic status. 28 We also validated that KRT13 is a key risk factor for PAAD. CCL12 is a monocyte chemotactic protein, a chemokine involved in the inflammatory response in damaged areas in aging brain-injured mice 29 ; CCL12 was closely associated with the aging process. This study identified CCL12 as a protective factor for PAAD progression. TMEM130 gene belongs to the transmembrane protein superfamily that inhibits cell proliferation and migration.30,31 We also recognized TMEM130 as a key protective factor for PAAD. CYP2S1 is a member of the cytochrome P450 enzymes superfamily and is widely expressed in the endoplasmic reticulum 32 ; CYP2S1 was a protective factor for PAAD.
This study also has some limitations. The datasets downloaded from the TCGA database have strict scan rates, which might affect this analysis. These eight genes-based models should be tested in a large cohort of patients or independent long-term cohorts. Finally, we only used limited cell lines for validation.
These aging-related genes include both protective and risk factors for PAAD prognosis. Furthermore, we constructed a cellular-associated genes-based clinical model, which exhibited good efficiency in PAAD prognosis and pre-immunotherapy evaluation.
Conclusion
Overall, our study demonstrated that aging-related genes are closely associated with PAAD prognosis. The aging-associated genes-based risk score model efficiently predicts PAAD clinical prognosis and pre-immunotherapy evaluation.
Supplemental Material
Supplemental Material - Construction and evaluation of an aging-associated genes-based model for pancreatic adenocarcinoma prognosis and therapies
Supplemental Material for Construction and evaluation of an aging-associated genes-based model for pancreatic adenocarcinoma prognosis and therapies by Junjie Zhao, Kelei Guan and Jiyuan Xing in International Journal of Immunopathology and Pharmacology
Footnotes
Authors’ contributions
JZ and JX designed the study, JZ, and KG wrote this manuscript and performed the data analysis. JX collected the data and searched the articles and made figures. All authors read and approved the final manuscript.
Declaration of conflicting interests
The author(s) declared no potential conflicts of interest with respect to the research, authorship, and/or publication of this article.
Funding
The author(s) disclosed receipt of the following financial support for the research, authorship, and/or publication of this article: This work was supported by Henan Medical Science and Technology Joint Building Program (LHGJ20200320).
Data availability statement
Data and material availability can be obtained from corresponding author on request.
Supplemental Material
Supplemental material for this article is available online.
References
Supplementary Material
Please find the following supplemental material available below.
For Open Access articles published under a Creative Commons License, all supplemental material carries the same license as the article it is associated with.
For non-Open Access articles published, all supplemental material carries a non-exclusive license, and permission requests for re-use of supplemental material or any part of supplemental material shall be sent directly to the copyright owner as specified in the copyright notice associated with the article.