
Abstract
We studied the subcellular localization of the mitochondrial type of NADP-dependent isocitrate dehydrogenase (ICD1) in rat was immunofluorescence and immunoelectron microscopy and by biochemical methods, including immunoblotting and Nycodenz gradient centrifugation. Antibodies against a 14-amino-acid peptide at the C-terminus of mouse ICD1 was prepared. Immunoblotting analysis of the Triton X-100 extract of heart and kidney showed that the antibodies developed a single band with molecular mass of 45 kD. ICD1 was highly expressed in heart, kidney, and brown fat but only a low level of ICD1 was expressed in other tissues, including liver. Immunofluorescence staining showed that ICD1 was present mainly in mitochondria and, to a much lesser extent, in nuclei. Low but significant levels of activity and antigen of ICD1 were found in nuclei isolated by equilibrium sedimentation. Immunoblotting analysis of subcellular fractions isolated by Nycodenz gradient centrifugation from rat liver revealed that ICD1 signals were exclusively distributed in mitochondrial fractions in which acyl-CoA dehydrogenase was present. Immunofluorescence staining and postembedding electron microscopy demonstrated that ICD1 was confined almost exclusively to mitochondria and nuclei of rat kidney and heart muscle. The results show that ICD1 is expressed in the nuclei in addition to the mitochondria of rat heart and kidney. In the nuclei, the enzyme is associated with heterochromatin. In kidney, ICD1 distributes differentially in the tubule segments.
I

NAD-dependent isocitrate dehydrogenase catalyzes a key step in the tricarboxylic acid cycle, whereas the physiological roles of ICD1 and ICD2 are not clearly understood. Both enzymes have been purified from various sources and their cDNA sequences determined (Macfarlane et al. 1977; Plaut et al. 1983; Haselbeck et al. 1992; Huh et al. 1993; Jennings et al. 1994; Loftus et al. 1994; Yang et al. 1996; Nekrutenko et al. 1998). ICD1 and ICD2 are homodimers encoded in the nuclear genome (Loftus et al. 1994). ICD2 has been regarded as a cytosolic enzyme, although peroxisomal targeting signal 1 (PTS1) is present at the C-terminus of the ICD2 amino acid sequence (Jennings et al. 1994). In many tissues, including liver, most ICD2 has been found in cytosolic fractions after differential centrifugation. However, in a previous study we have shown by immunoelectron microscopic analysis that rat liver ICD2 is localized almost exclusively to peroxisomes (Yoshihara et al. 2001). Most peroxisomes are contained in the light mitochondrial fraction, together with lysosomes, after differential centrifugation of rat liver homogenate (Leighton et al. 1968). Therefore, it is difficult to determine the organelle in which ICD1 is distributed by an assay of ICD activity, because the enzyme assay method cannot distinguish between ICD1 and ICD2.
The amino acid sequence of ICD1 has been determined in several animals, plants, and yeasts (Haselbeck and McAlister-Henn 1991; Udvardi et al. 1993; Jennings et al. 1994; Loftus et al. 1994; Gálvez et al. 1996; Yang et al, 1996; Nekrutenko et al. 1998). Many peroxisome matrix proteins have two types of peroxisome targeting signals; a tripeptide signal (A/SKL) at the C-terminus (PTS1), and a nonapeptide (R/K)(L/V/I)X5(H/Q)(L/A) at the N-terminus (PTS2) (Subramani 1993). No such signals are found in ICD1. Mitochondrial targeting signals do not show extensive sequence homology. It was pointed out that pre-sequences of mitochondrial matrix/inner membrane proteins are usually rich in the positively charged amino acids arginine and lysine, as well as the hydroxylated amino acids serine and threonine (Hurt and van Loon 1986). Four positively charged amino acids and three serines are contained in the 30 amino acids composing the N-terminus of mouse ICD1. It is unclear whether this amino acid sequence functions as the mitochondrial targeting signal. However, in the biochemical data obtained thus far ICD1 has always been identified as synonymous with mitochondrial NADP-dependent isocitrate dehydrogenase. In this work we studied the localization of ICD1 in kidney and heart muscle using light and electron microscopic immunocytochemical techniques and biochemical methods. The results showed that ICD1 was present in the nuclei and mitochondria but not in peroxisomes.
Materials and Methods
Animals
Male Wistar rats weighing 180–200 g and Japanese White rabbits weighing 3–4 kg were fed on standard diets for each animal and water ad libitum until use. The animal experiments were performed in accordance with the Guidance for Animal Experiments, Yamanashi Medical University.
Antibodies
Anti-ICD1 peptide antibody was prepared as follows. A peptide consisting of 14 amino acids (DTIKSNLDRALGKQ) at the C-terminus of mouse ICD1 was synthesized and cysteine was added at the N-terminus. One milligram of synthetic peptide was conjugated to 1.6 mg of keyhole limpet hemocyanin (Sigma; St Louis, MO) with MBS. Two milliliters of conjugate containing 300 μg of peptide was emulsified with the same volume of complete Freund adjuvant and the emulsion was injected into the back of two Japanese White rabbits. Every 2 weeks each rabbit was immunized with 150 μg of peptide and after 8 weeks blood was collected from an ear vein. Reactivity was tested by dot-blotting using peptide-conjugated BSA. Rabbit and guinea pig anti-rat liver catalase antibodies were prepared as described previously (Yokota 1993). The rabbit antibody to rat liver ICD2 antibody was the same lot prepared previously (Yoshihara et al. 2001). HRP-labeled goat anti-rabbit IgG antibody was also described previously (Yokota 1993). The rabbit antibodies to rat liver 3-keto-acyl-CoA thiolase and acyl-CoA dehydrogenase were obtained from Dr. Hashimoto (Shinshu University School of Medicine, Matsumoto, Japan). Alexa 549-conjugated goat anti-rabbit IgG was purchased from Molecular Probes (Eugene, OR).
Reactivity Test of Anti-ICD1 Peptide Antibody
ICD Activity in Heart Extract After Incubation with Anti-ICD1 Peptide Antibody-absorbing PVDF Membrane. Specific antibody to ICD1 peptide was isolated as follows. PVDF membrane was incubated in a solution of ICD1 peptide-conjugated BSA (1 mg peptide/ml). Having absorbed 0.672 mg of peptide, it was then incubated with anti-ICD1 anti-sera for 2 hr at room temperature (RT). Specific antibody binding to peptide-BSA was eluted with 0.1 M glycine-HCl buffer (pH 2.3) containing 0.5 M NaCl at 0C and the eluate was quickly neutralized with 1 M Tris. The absorption and elution were repeated and the eluates were pooled. Specific antibody was absorbed by a new PVDF membrane (4 cm2). The membrane that had absorbed specific ICD1 peptide antibody was soaked in 0.5% gelatin-PBS and cut into pieces of 5 mm X 5 mm. Ten percent rat heart homogenate was extracted with the same volume of 2% Triton X-100 in 50 mM potassium phosphate buffer (pH 7.4) and the extract was diluted fivefold. Each 100 μl of extract was incubated with 0, 1, 2, 4, and 6 pieces of antibody-PVDF membrane, respectively, for 3 hr at 4C. For the control experiment, a number of PVDF membrane pieces absorbing IgG from pre-immune serum were incubated with the heart extract. Then the ICD1 activity of the extracts was assayed by the method of Ellis and Goldberg (1971) at 37C.
Western Blotting Analysis of Anti-ICD1 Antibody. Heart and kidney of rat and mouse were homogenized in a solution consisting of 0.1 μM potassium phosphate buffer (pH 7.4), 0.1% Triton X-100, 10 μM PMSF, 4 μM leupeptin, 4 μM chymostatin, 4 μM antipain, and 4 μM pepstatin using a HG30 homogenizer (Hitachi; Tokyo, Japan). The homogenates were centrifuged at 100,000 X g for 1 h using a 60Ti rotor (Beckman Japan; Tokyo, Japan). The resulting supernatants were used for SDS electrophoresis (Laemmli 1970). After electrophoresis, proteins were transferred to PVDF membrane and the membrane was incubated with anti-ICD1 antibody overnight at 4C. Proteins reacting with the anti-ICD1 antibody were visualized with a combination of peroxidase-conjugated goat anti-rabbit IgG and diaminobenzidine (DAB). ICD1 peptide conjugated with BSA was used to test the reactivity of anti-ICD1 peptide. Molecular marker proteins were transferred to PVDF membrane and stained with Coomassie Brilliant Blue R-250.
Immunoblotting Analysis of Tissue Homogenates
Anesthetized rats were decapitated and the submandibular gland, heart, lung, liver, small intestine, colon, diaphragm, spleen, adrenal gland, kidney, testis, epididymis, cerebrum, cerebellum, and brown fat were dissected. Each organ was homogenized in a homogenizing medium containing 50 mM potassium phosphate buffer (pH 7.4), 1% Triton X-100, 10 μM PMSF, 4 μM leupeptin, 4 μM chymostatin, 4 μM anti-pain, and 4 μM pepstatin. The concentration of protein was adjusted to 1 mg/ml. Homogenates were mixed with the same volume of sample buffer for SDS-PAGE and heated in boiling water for 2 min. Five micrograms of sample were loaded on the gels and electrophoresis was carried out. After electrophoresis, proteins were transferred onto PVDF membranes (Millipore; Bedford, MA) and stained with a combination of HRP-labeled goat anti-rabbit IgG and DAB.
Nycodenz Gradient Centrifugation
A light mitochondrial fraction was prepared from rat liver homogenate as described above. According to the method described by Osmundsen (1983), the fraction (1 ml) was loaded onto 22 ml of pre-centrifuged Nycodenz (Sigma/Aldrich Japan; Tokyo, Japan) gradient + 1 ml of 60% sucrose cushion and centrifuged at 63,000 X g for 30 min with a Hitachi ultracentrifuge using an RP50 rotor. The gradient was separated into 24 fractions in test tubes by siphoning from the bottom of the centrifuge tube and the fractions were stored at −70C until use. The fractions were analyzed by Western blotting using anti-catalase, anti-acyl-CoA dehydrogenase and anti-ICD1 antibodies.
Isolation of Cell Nuclei
The method described by Tata (1974) was used. Rat kidney, liver, and heart were chopped in 0.32 M sucrose–3 mM MgCl2 and homogenized in a Potter-Elvehjem homogenizer with a Teflon pestle. The homogenates were filtered through two layers of nylon bolting cloth (100-mesh) and diluted with 0.6 volumes of 0.32 M sucrose–3 mM MgCl2 and 0.22 volumes of distilled water, and centrifuged at 700 X g for 10 min. The pellets were suspended in 2.4 M sucrose–1 mM MgCl2 and centrifuged at 50,000 X g for 1 hr with a Hitachi ultracentrifuge (Hitachi; Tokyo, Japan) using an RP50 rotor. Nuclei were collected into pellets and suspended in 0.25 M sucrose–1 mM MgCl2. The ICD activity and protein concentration of the isolated nuclei were assayed. Some of the nuclei were smeared on polylysine-coated glass slides for immunofluorescence staining and stored at −70C until use.
Other Analytical Procedures
SDS-PAGE was carried out according to Laemmli (1970). The protein concentration was determined by the bicinchoninic acid method (Redinbaugh and Turley 1986) (Pierce Chemical; Chicago, IL) with BSA as standard.
Immunocytochemical Procedures
Immunofluorescence Microscopy. Rats were anesthetized with ether. The heart, liver, and kidneys were fixed by perfusion through the left ventricle, portal vein, and abdominal aorta, respectively, for 10 min at RT. The fixative consisted of 4% paraformaldehyde, 0.2% glutaraldehyde, and 0.2 M HEPES-KOH buffer (pH 7.4). Small tissue blocks were further fixed in 1% glutaraldehyde buffered with 0.1 M HEPES-KOH (pH 7.4) for 1 hr at 4C. After being washed in PBS, tissue blocks were dehydrated in graded ethanol and embedded in Epon. Polymerization of Epon was performed overnight at 60C. The staining method used has been described previously (Haraguchi and Yokota 2002). Briefly, semithin sections (200 nm thick) and serial sections (100 nm thick) were cut with a histodiamond knife using a Reichert Ultracut R (Leica; Hamburg Germany) and mounted on clean glass slides. Epoxy resin of the sections was removed by 1hr incubation in 10% sodium ethoxide (Litwin et al. 1984). The sections were then treated with 0.1 M lysine + 0.1 M Tris-HCl buffer (pH 7.4) for 10 min to block nonspecific absorption to the sections. Next, the sections were treated with 0.05% trypsin in PBS for 2 min (for 100-nm-thick sections) or 5 min (for 200-nm-thick sections) at 37C and then treated three times with 0.05% sodium borohydride for 4 min each to eliminate the autofluorescence of the glutaraldehyde used for fixation. Afterwards, the sections were incubated with rabbit anti-ICD1 peptide antibody or with anti-rat liver catalase antibody, followed by Alexa 549-conjugated goat anti-rabbit IgG. For the control experiment, pre-immune serum was used instead of primary specific antibodies, followed by the fluorescent labeled secondary probe. The sections were mounted with mounting medium consisting of 0.1% para-phenylenediamine, 10% PBS and 90% glycerol (Beltz and Burd 1989) and examined with a Zeiss Axioplan fluorescence microscope.
Postembedding Immunoelectron Microscopy
Preparation of Protein A-Gold and IgG-Gold Probes. Two kinds of colloidal gold (15 nm and 8.5 nm in diameter) were prepared by the method of de Roe et al. (1987). Protein A (Amersham Pharmacia Biotech; Little Chalfont, UK) was conjugated with 15-nm colloidal gold and affinity-purified rabbit anti-mouse IgG was conjugated with 8.5-nm colloidal gold (Slot and Geuze 1984). The colloidal gold probes were finally mixed with 40% glycerol-PBS and stored at −20C.
Tissue Preparation and Immunostaining. Small tissue slices of rat heart, liver, and kidney fixed by perfusion with 4% paraformaldehyde + 0.2% glutaraldehyde were dehydrated with graded ethanol at −20C and embedded in Lowicryl K4M or LR White. Polymerization of the resins was performed under UV light overnight at −20C. Ultrathin sections were cut with a diamond knife using a Reichert Ultracut R and mounted on nickel grids. The sections were incubated with 500-fold diluted anti-ICD1 antibody overnight at 4C, followed by a 30-min incubation with protein A-gold probe (15 nm). Some sections were stained doubly by a combination of anti-ICD1 and anti-rat liver catalase with 8-nm or 15-nm protein A-gold probes. The sections were electron stained with uranyl acetate for 10 min and with lead citrate for 30 sec. All thin sections were examined with a Hitachi H7500 electron microscope at an accelerating voltage of 80 kV.
Quantitative Analysis of Gold Labeling. Ten digital micrographs were taken from postembedding immunoelectron microscopic sections at a magnification of X15,000 and printed out by a laser printer. Areas of mitochondria, peroxisomes, nuclei, and cytoplasm were determined by a digitizer equipped with a computer and the gold particles present in each area were counted. Labeling density was expressed as gold particles/μm2.
Results
Reactivity of Anti-ICD1 Peptide Antibody with Peptide
ICD Activity in Heart Extract After Incubation with PVDF Membrane Absorbing Anti-ICD1 Peptide Antibody. We tested whether the antibody can remove ICD activity from tissue extract using small pieces of antibody-absorbing PVDF membrane. When a fixed amount of rat heart extract was incubated with a number of membrane pieces, the ICD activity in the extract was found to decrease as the number of membrane pieces increased (Figure 1, open circles). However, PVDF membrane absorbing IgG from pre-immune serum did not change the ICD activity in the extract (Figure 1, closed circles). The results clearly showed that our antibody to the 14-amino-acid peptide of the mouse ICD1 C-terminus could bind to rat heart ICD1.
Immunoblotting Analysis of Anti-ICD1 Antibody. The present antibodies were raised in two rabbits immunized with 14 amino acids at the C-terminus of mouse ICD1. The amino acid sequence at the C-terminus of rat ICD1 has not yet been determined. Then we tested whether the anti-ICD1 peptide antibody could react with heart and kidney extracts of rat by Western blotting. Both antibodies recognized a single apparently identical band in the rat heart and kidney extracts (Figure 2). The reactivity of both antibodies was very similar, and we used them in subsequent experiments. The molecular mass of the band was calculated to be approximately 45 kD.
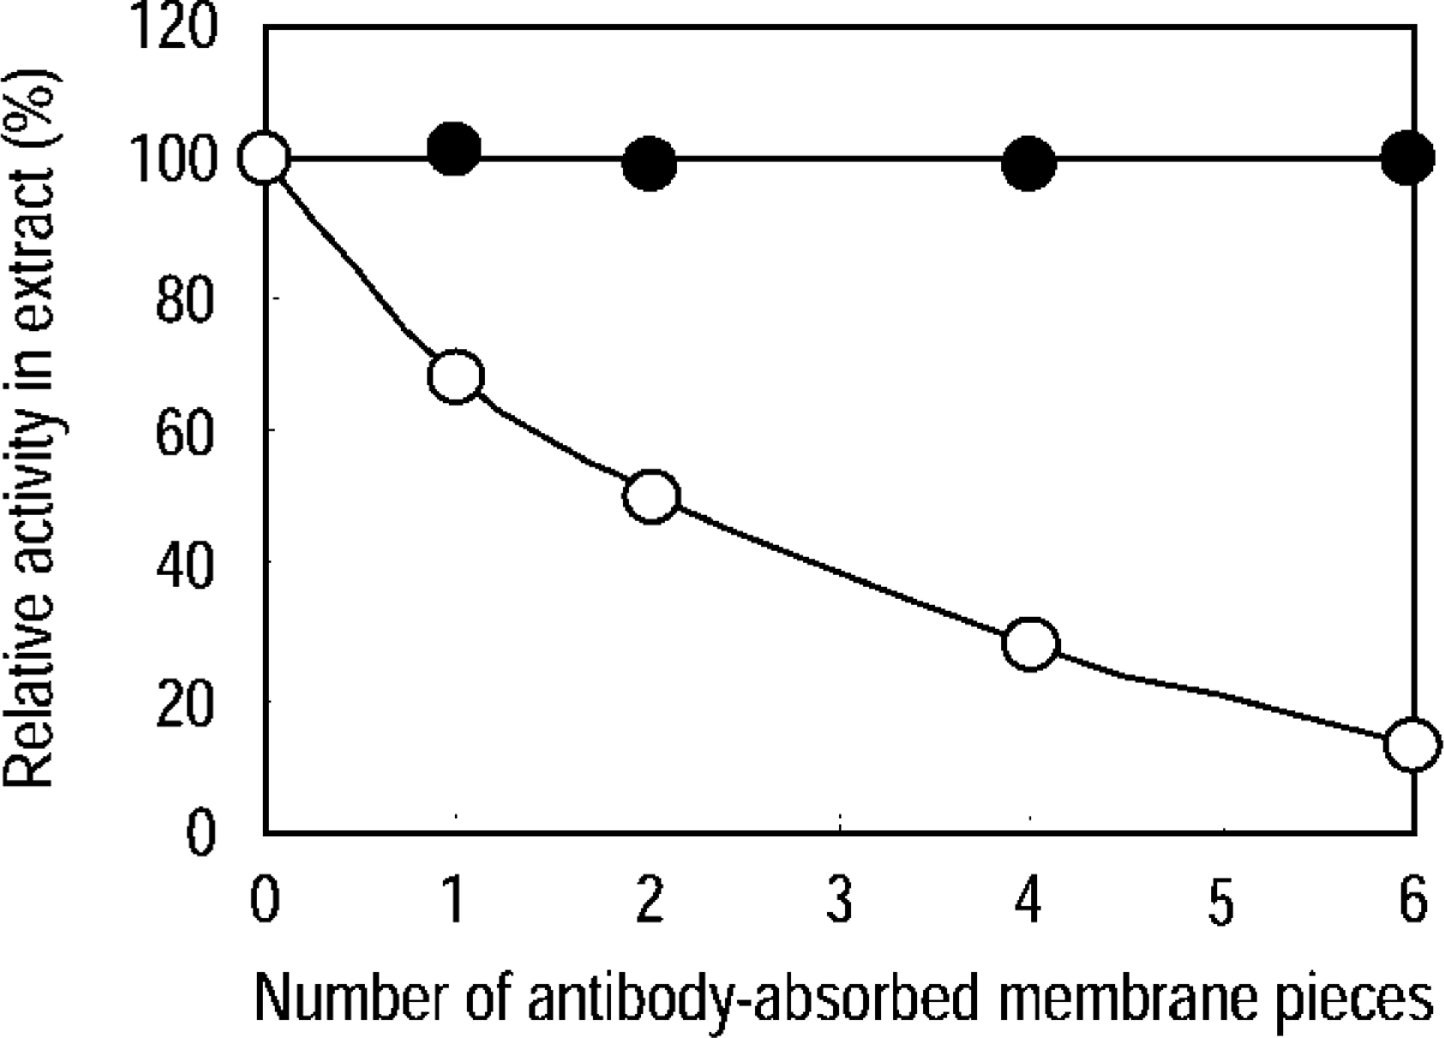
Absorption of ICD activity with antibody-PVDF membranes from rat heart mitochondrial extract. As the number of pieces of PVDF membrane soaked with anti-ICD1 peptide antibody increased, the ICD activity in the extract decreased (open circles). However, PVDF membranes soaked with the IgG fraction from pre-immune serum did not show decrease in activity (closed circles).
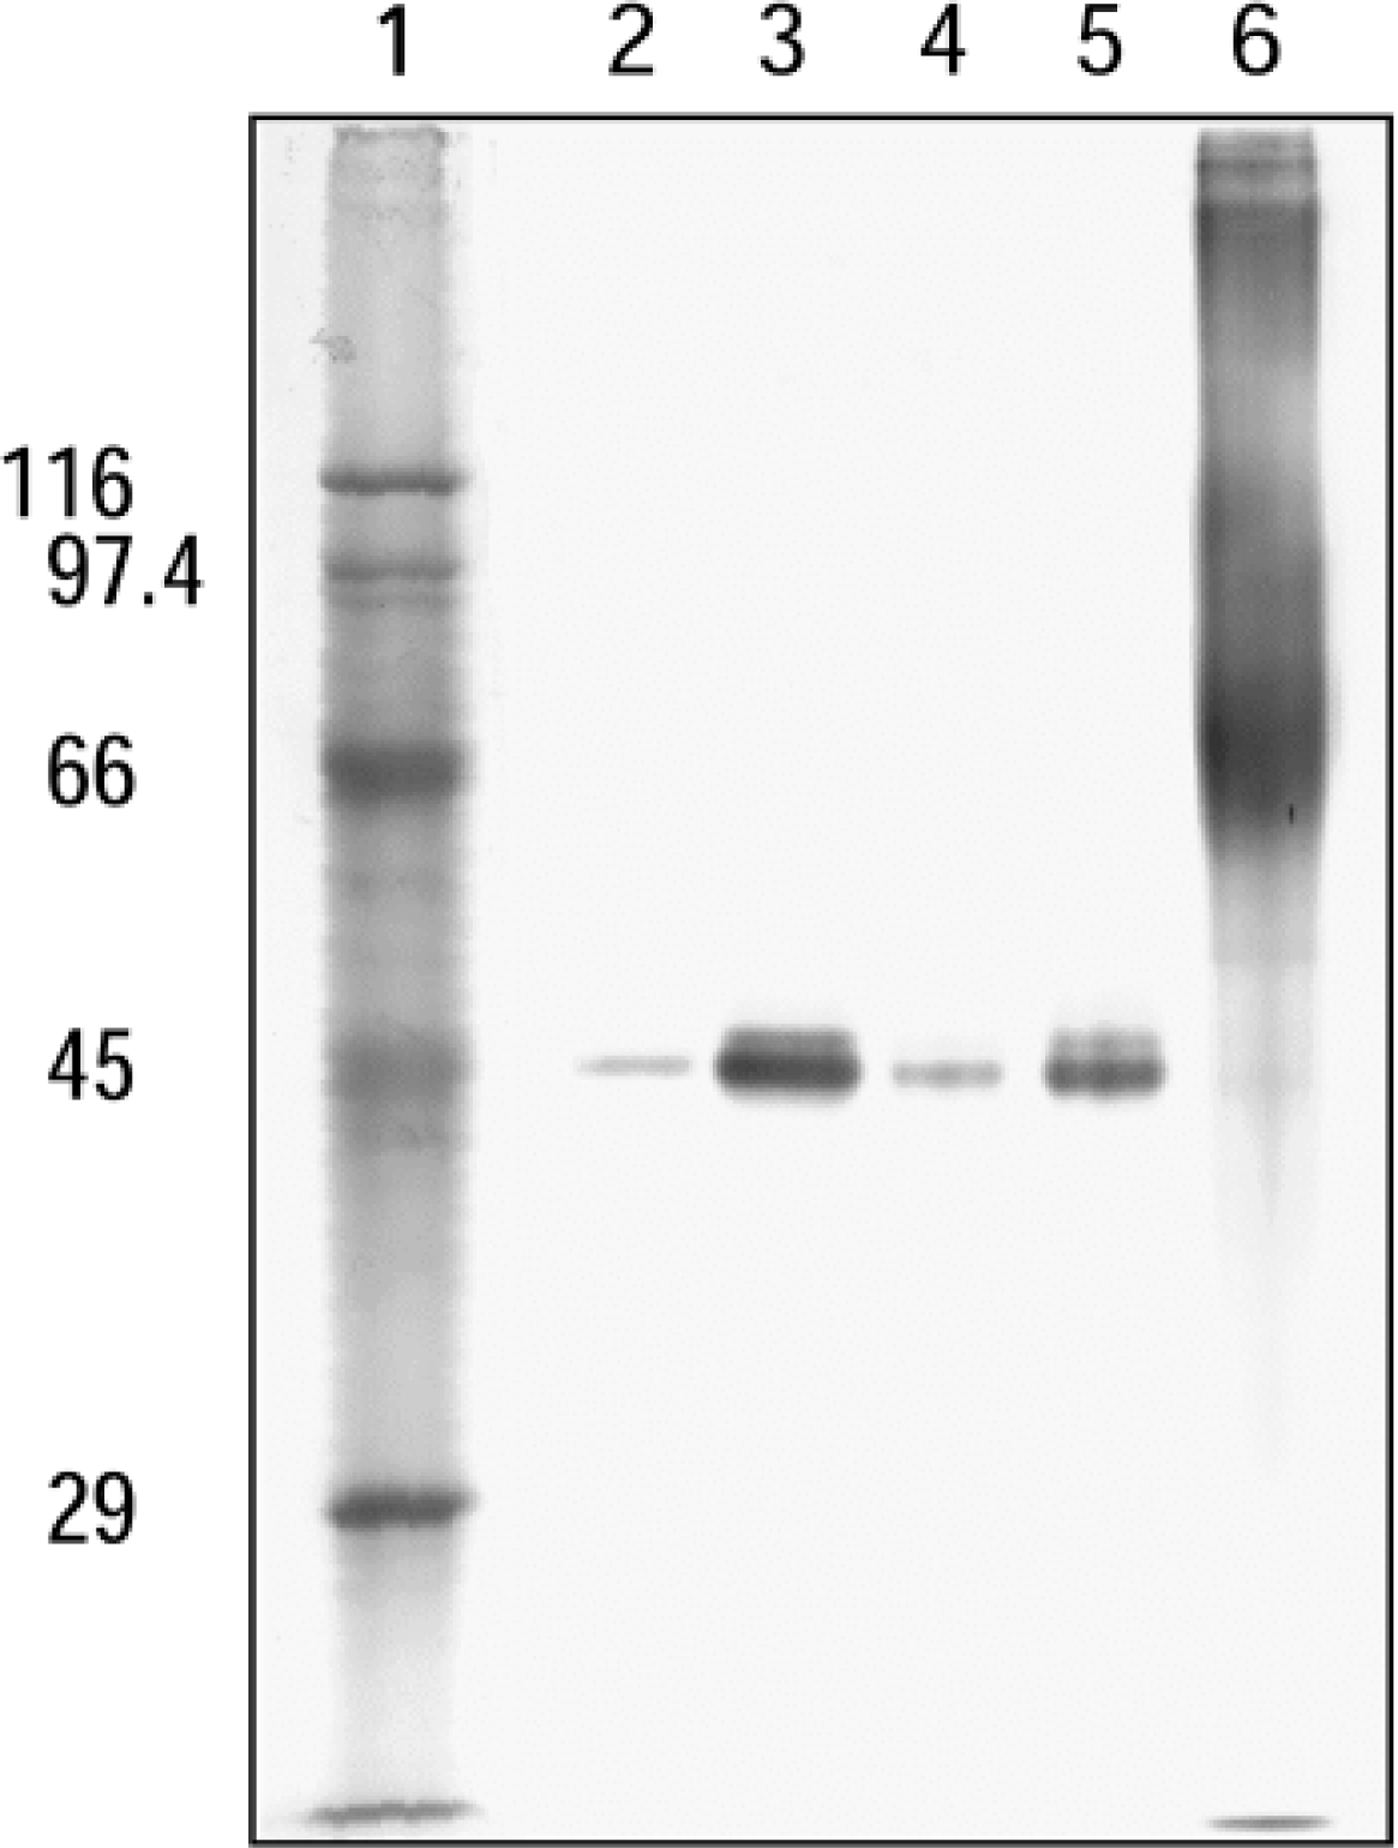
Western blotting analysis of ICD1 in heart and kidney of rat and mouse. Tissue homogenates were treated with 0.1% Triton X-100 and centrifuged at 100,000 X g for 1 hr. The resulting supernatants (5 μg) were analyzed. Lane 1, molecular markers; Lane 2, rat kidney; Lane 3, rat heart; Lane 4, mouse kidney; Lane 5, mouse heart; Lane 6, ICD1 peptide-conjugated BSA (1 μg of peptide).
Immunoblot Analysis of Expression of ICD1 in Various Tissues
We analyzed 15 different tissues, i.e., salivary gland, liver, small intestine, colon, spleen, heart, diaphragm, adrenal gland, kidney, testis, epididymis, lung, cerebrum, cerebellum, and brown fat, from male Wistar rats. Among these samples, the highest level of ICD1 was expressed in heart muscle, followed by kidney and brown fat (Figure 3). In other tissues, a low level of ICD1 was expressed. No signals were detected in testis at the protein concentration (1 mg/ml) used. In most tissues examined, a single band was observed and the molecular mass was calculated to be approximately 45 kD. In cerebrum, a minor band of 45 kD and major band of 90 kD, which seemed to be a dimer of the 45-kD subunit, were detected (not shown).
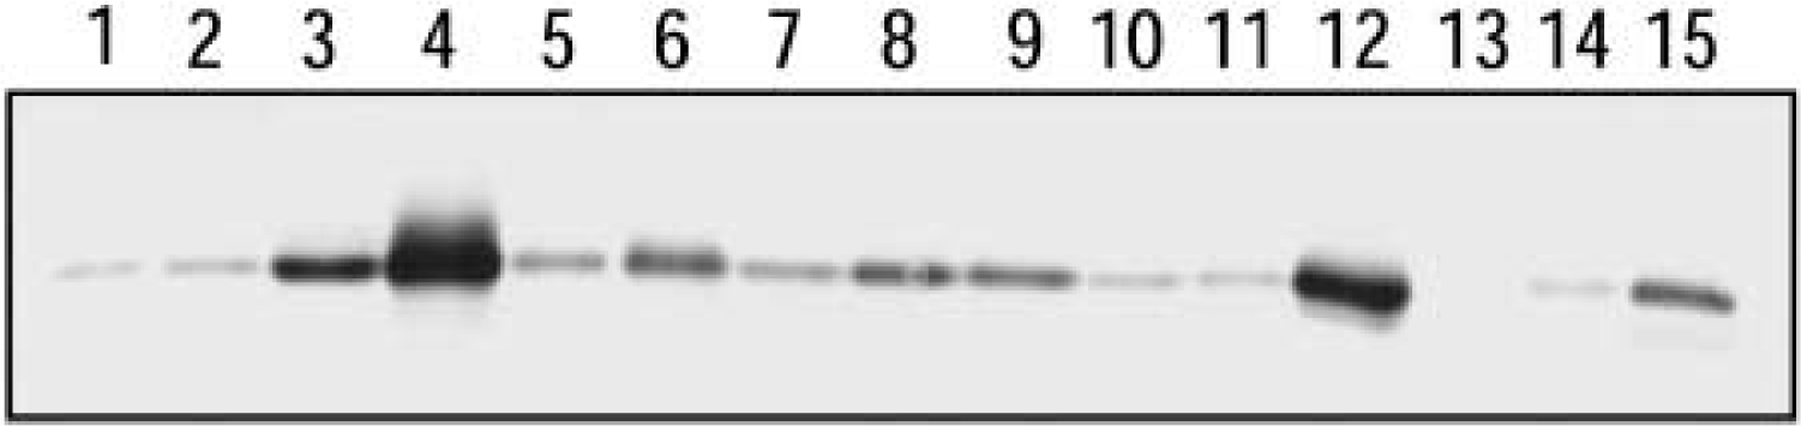
Western blotting analysis of ICD1 expression in various rat tissues. In each lane, 8 μg of protein was loaded. Lane 1, cerebrum; Lane 2, cerebellum; Lane 3, submandibular gland; Lane 4, heart; Lane 5, lung; Lane 6, brown fat; Lane 7, liver; Lane 8, colon; Lane 9, intestine; Lane 10, spleen; Lane 11, adrenal gland; Lane 12, kidney; Lane 13, testis; Lane 14, epididymis; Lane 15, diaphragm.
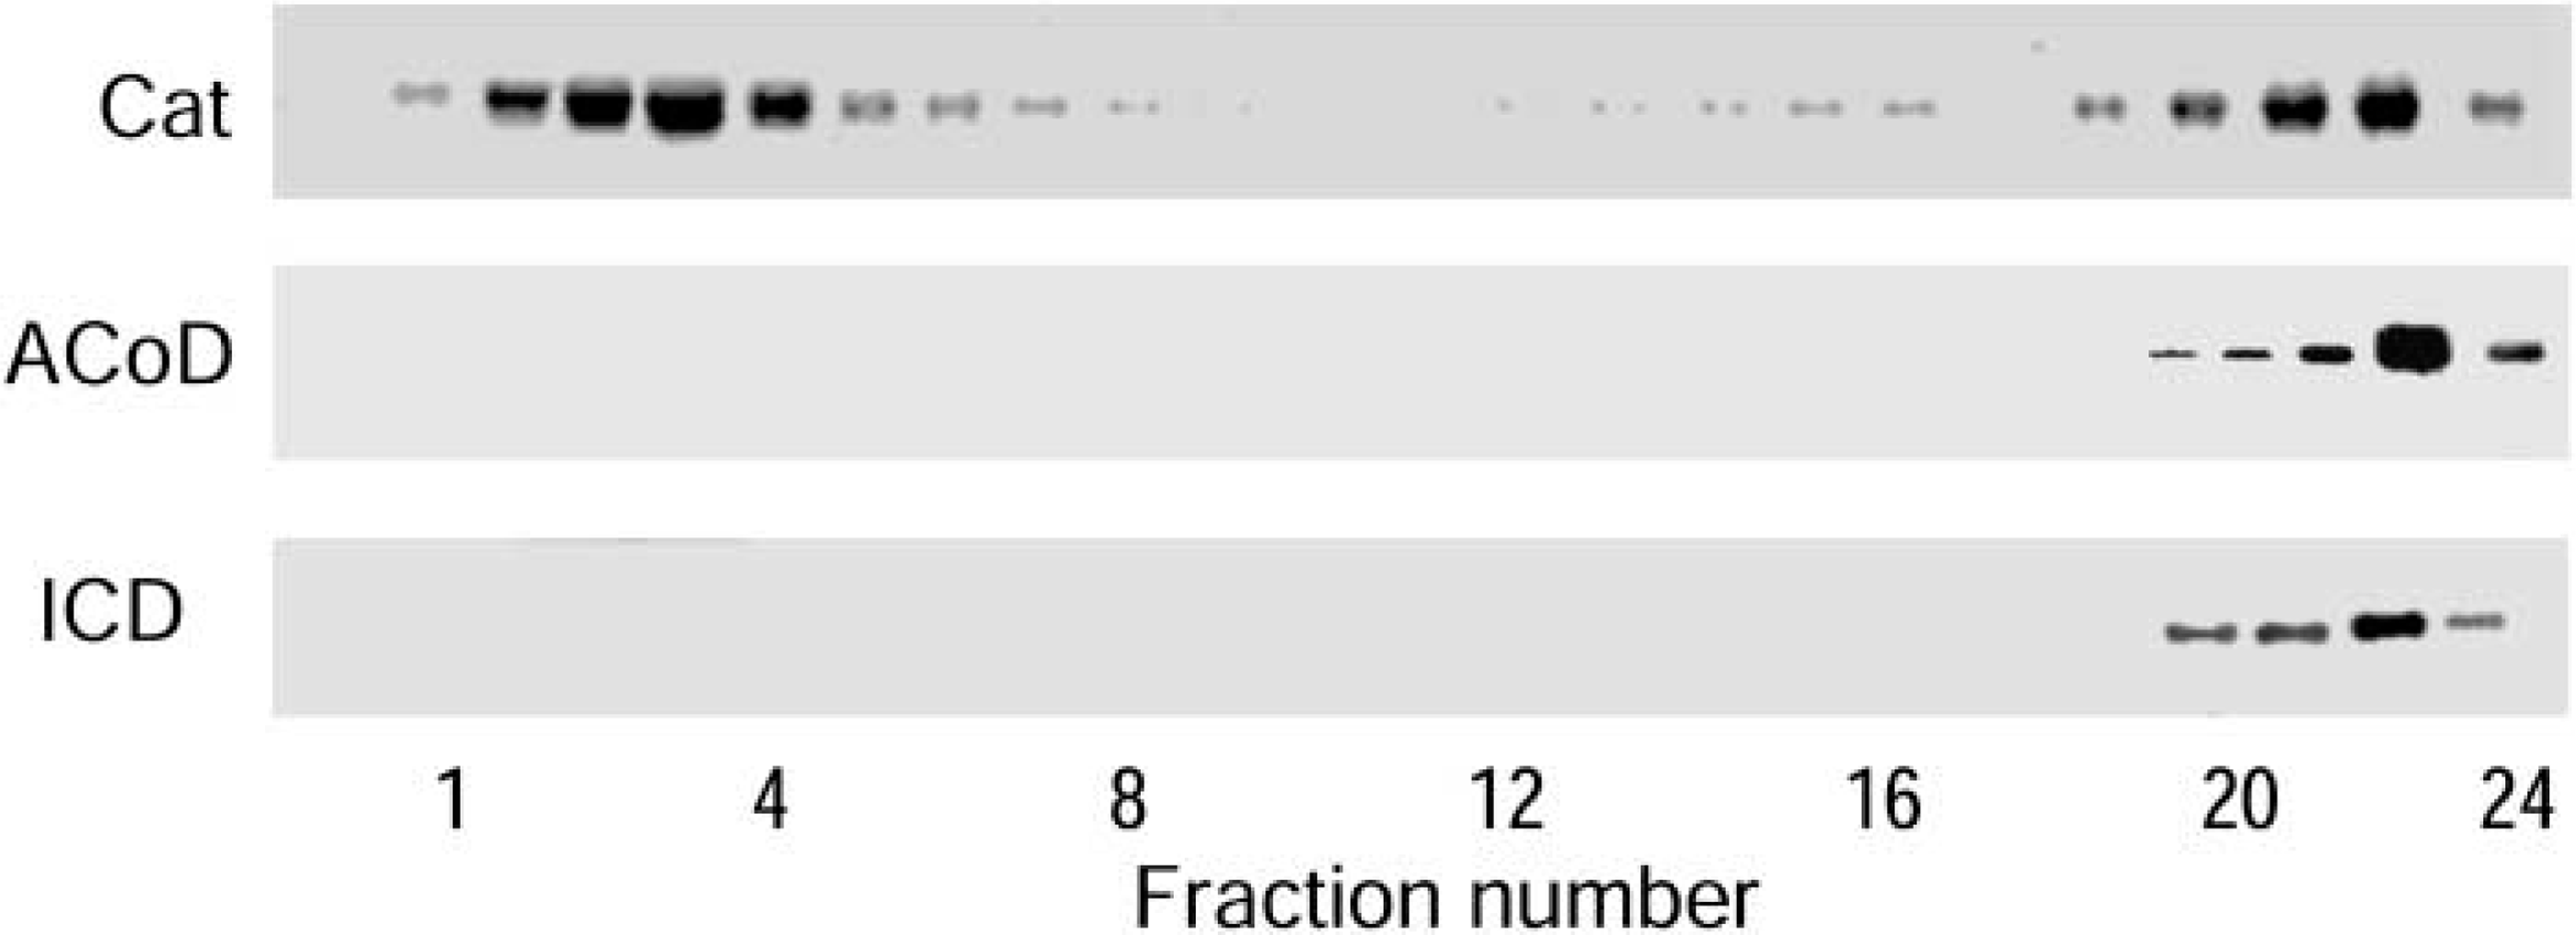
Distribution of ICD1, acyl-CoA dehydrogenase (ACoD), and catalase (Cat) antigens in subcellular fractions of rat liver light mitochondria isolated by Nycodenz gradient centrifugation. Note that the pattern of distribution of ICD1 was quite similar to that of ACoD, a mitochondrial marker.
Localization of ICD1 in Rat Liver After Nycodenz Gradient Centrifugation
We subjected the light mitochondrial fractions of rat liver to Nycodenz gradient centrifugation. The results are shown in Figure 4. The ICD1 antigen, which had the same molecular weight as that shown in Figure 2, was detected in fraction numbers 20–24, in which a mitochondrial marker antigen, acy-CoA dehydrogenase, was also detected. In peroxisomal fractions (fraction numbers 3–5), catalase antigen was detected, whereas ICD1 antigen was not. The results clearly showed that, in rat liver, ICD1 was exclusively distributed in the mitochondria. We have tried to isolate peroxisomes from the light mitochondrial fraction of rat kidney and heart by the same technique, but we could not recover intact peroxisomes from the fractions.
Immunolocalization of ICD1 in Rat Heart and Kidney
Immunofluorescence Staining of ICD1
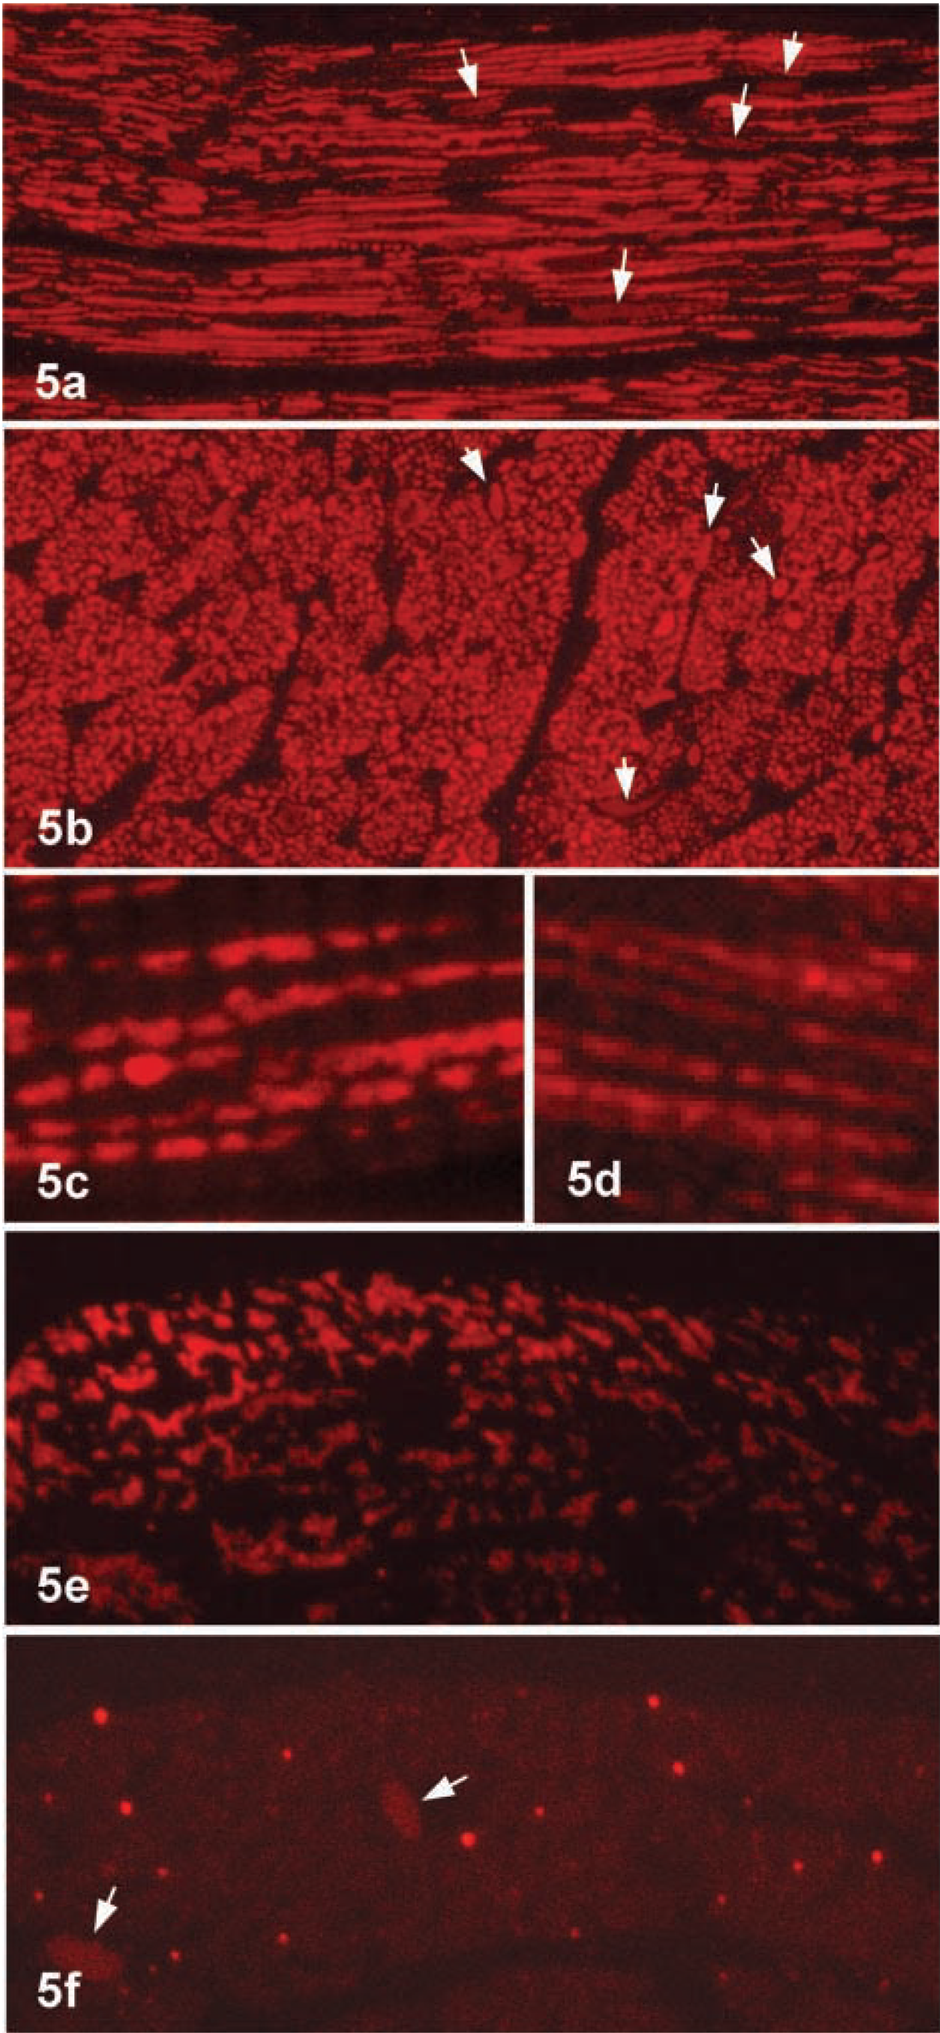
Heart. We used deplasticized semithin sections of Epon-embedded tissues for immunofluorescence staining (Haraguchi and Yokota 2002). It has been shown that many antigens can be stained by using a combination of deplasticized sections with an immunoenzyme technique (Litwin et al. 1984). In rat heart, specific immunofluorescence for ICD1 was observed in the cytoplasmic granules, which appeared as long thick filaments in longitudinal sections and as polymorphic dots in cross-sections of muscle fibers (Figures 5a and 5b). In high-power views of longitudinal sections, the rod-like staining was interrupted by unstained areas that were associated with the cross-striation of myofibrils (Figure 5c). The same staining pattern was observed in sections stained for 3-ketoacyl-CoA thiolase, a mitochondrial enzyme (Figure 5d), strongly suggesting that ICD1 was present in mitochondria. Cell nuclei of cardiac muscle cells and endothelial cells of capillaries and fibroblasts in connective tissue were weakly stained (Figures 5a and b, arrows). Two serial cross-sections 100 nm thick were cut and immunostained for ICD1 and catalase, respectively. The results are shown in Figures 5e and 5f. ICD1 was stained in polymorphic granules and catalase in small cytoplasmic granules that were much fewer than ICD1-positive granules.
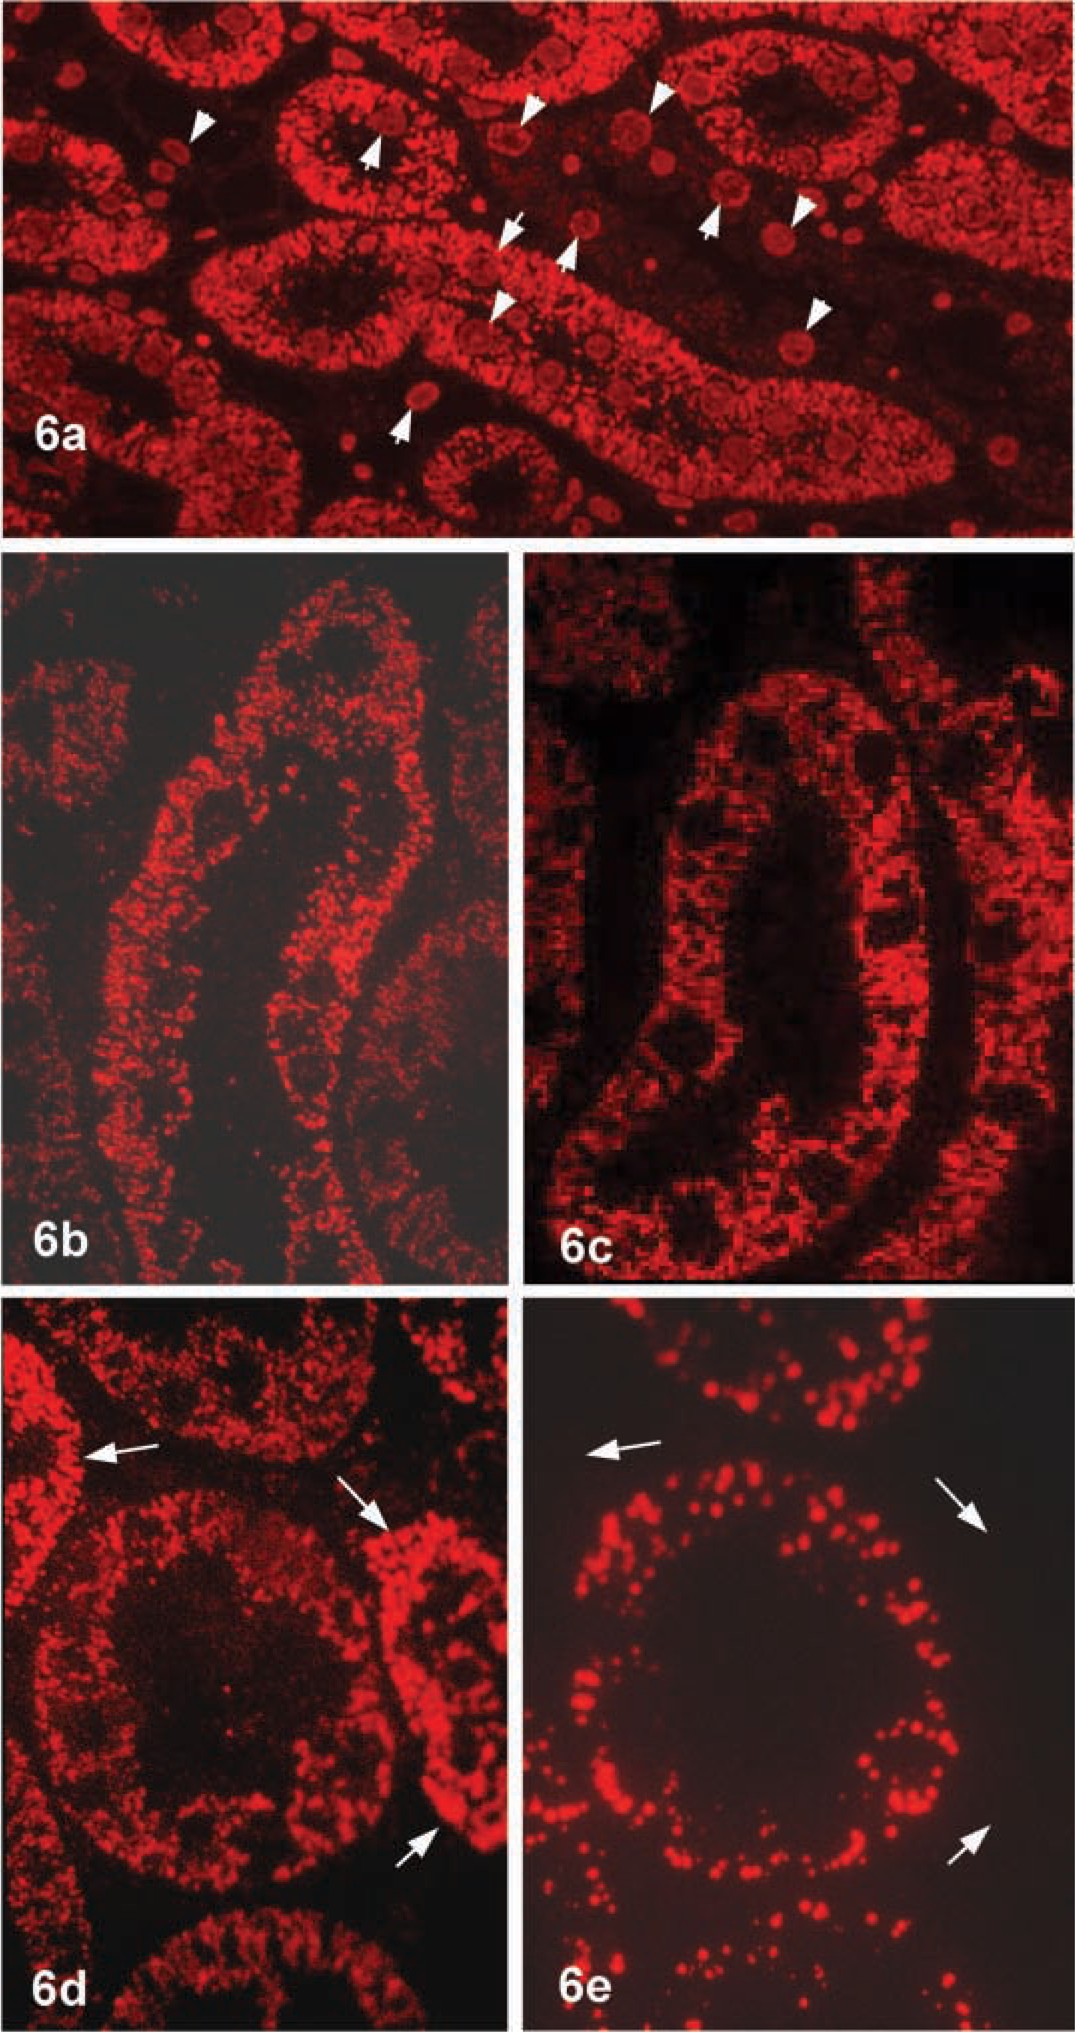
Kidney. Next we stained Epon sections of rat kidney after removal of epoxy resin. Cytoplasmic granules were stained with variable intensity and nuclei of tubule epithelial cells and connective tissue were also weakly stained (Figure 6a). At higher magnification, the stained granules exhibited a typical mitochondrial profile (Figure 6b), which was proved by staining of a mitochondrial marker enzyme, 3-keto-acyl-CoA thiolase (Figure 6c). In the segments of renal tubules, there were two types. One essentially contained a few mitochondria and the other involved many mitochondria that were weakly stained or almost negative. Next, we stained serial sections for ICD1 and catalase to clarify whether ICD1 was localized in peroxisomes. The staining pattern for ICD1 was quite different from that for catalase (Figures 6d and 6e). It appear that the same granules were not positive for both antigens. In some segments, mitochondria were heavily stained for ICD1 but did not appear to be stained for catalase (Figures 6d and 6e). Cell nuclei in renal tubules as well as connective tissue were stained (Figure 6a). The staining intensity of nuclei was essentially lower than that of mitochondria. Therefore, when sections became thinner than 100 nm, the nuclear staining was indistinguishable (Figures 6d and 6e).
Immunoelectron Microscopy. Gold labeling for ICD1 was stronger in Lowicryl K4M-embedded than in LR White-embedded materials. The immunoelectron microscopic data shown here were all obtained from the materials embedded in Lowicryl K4M.
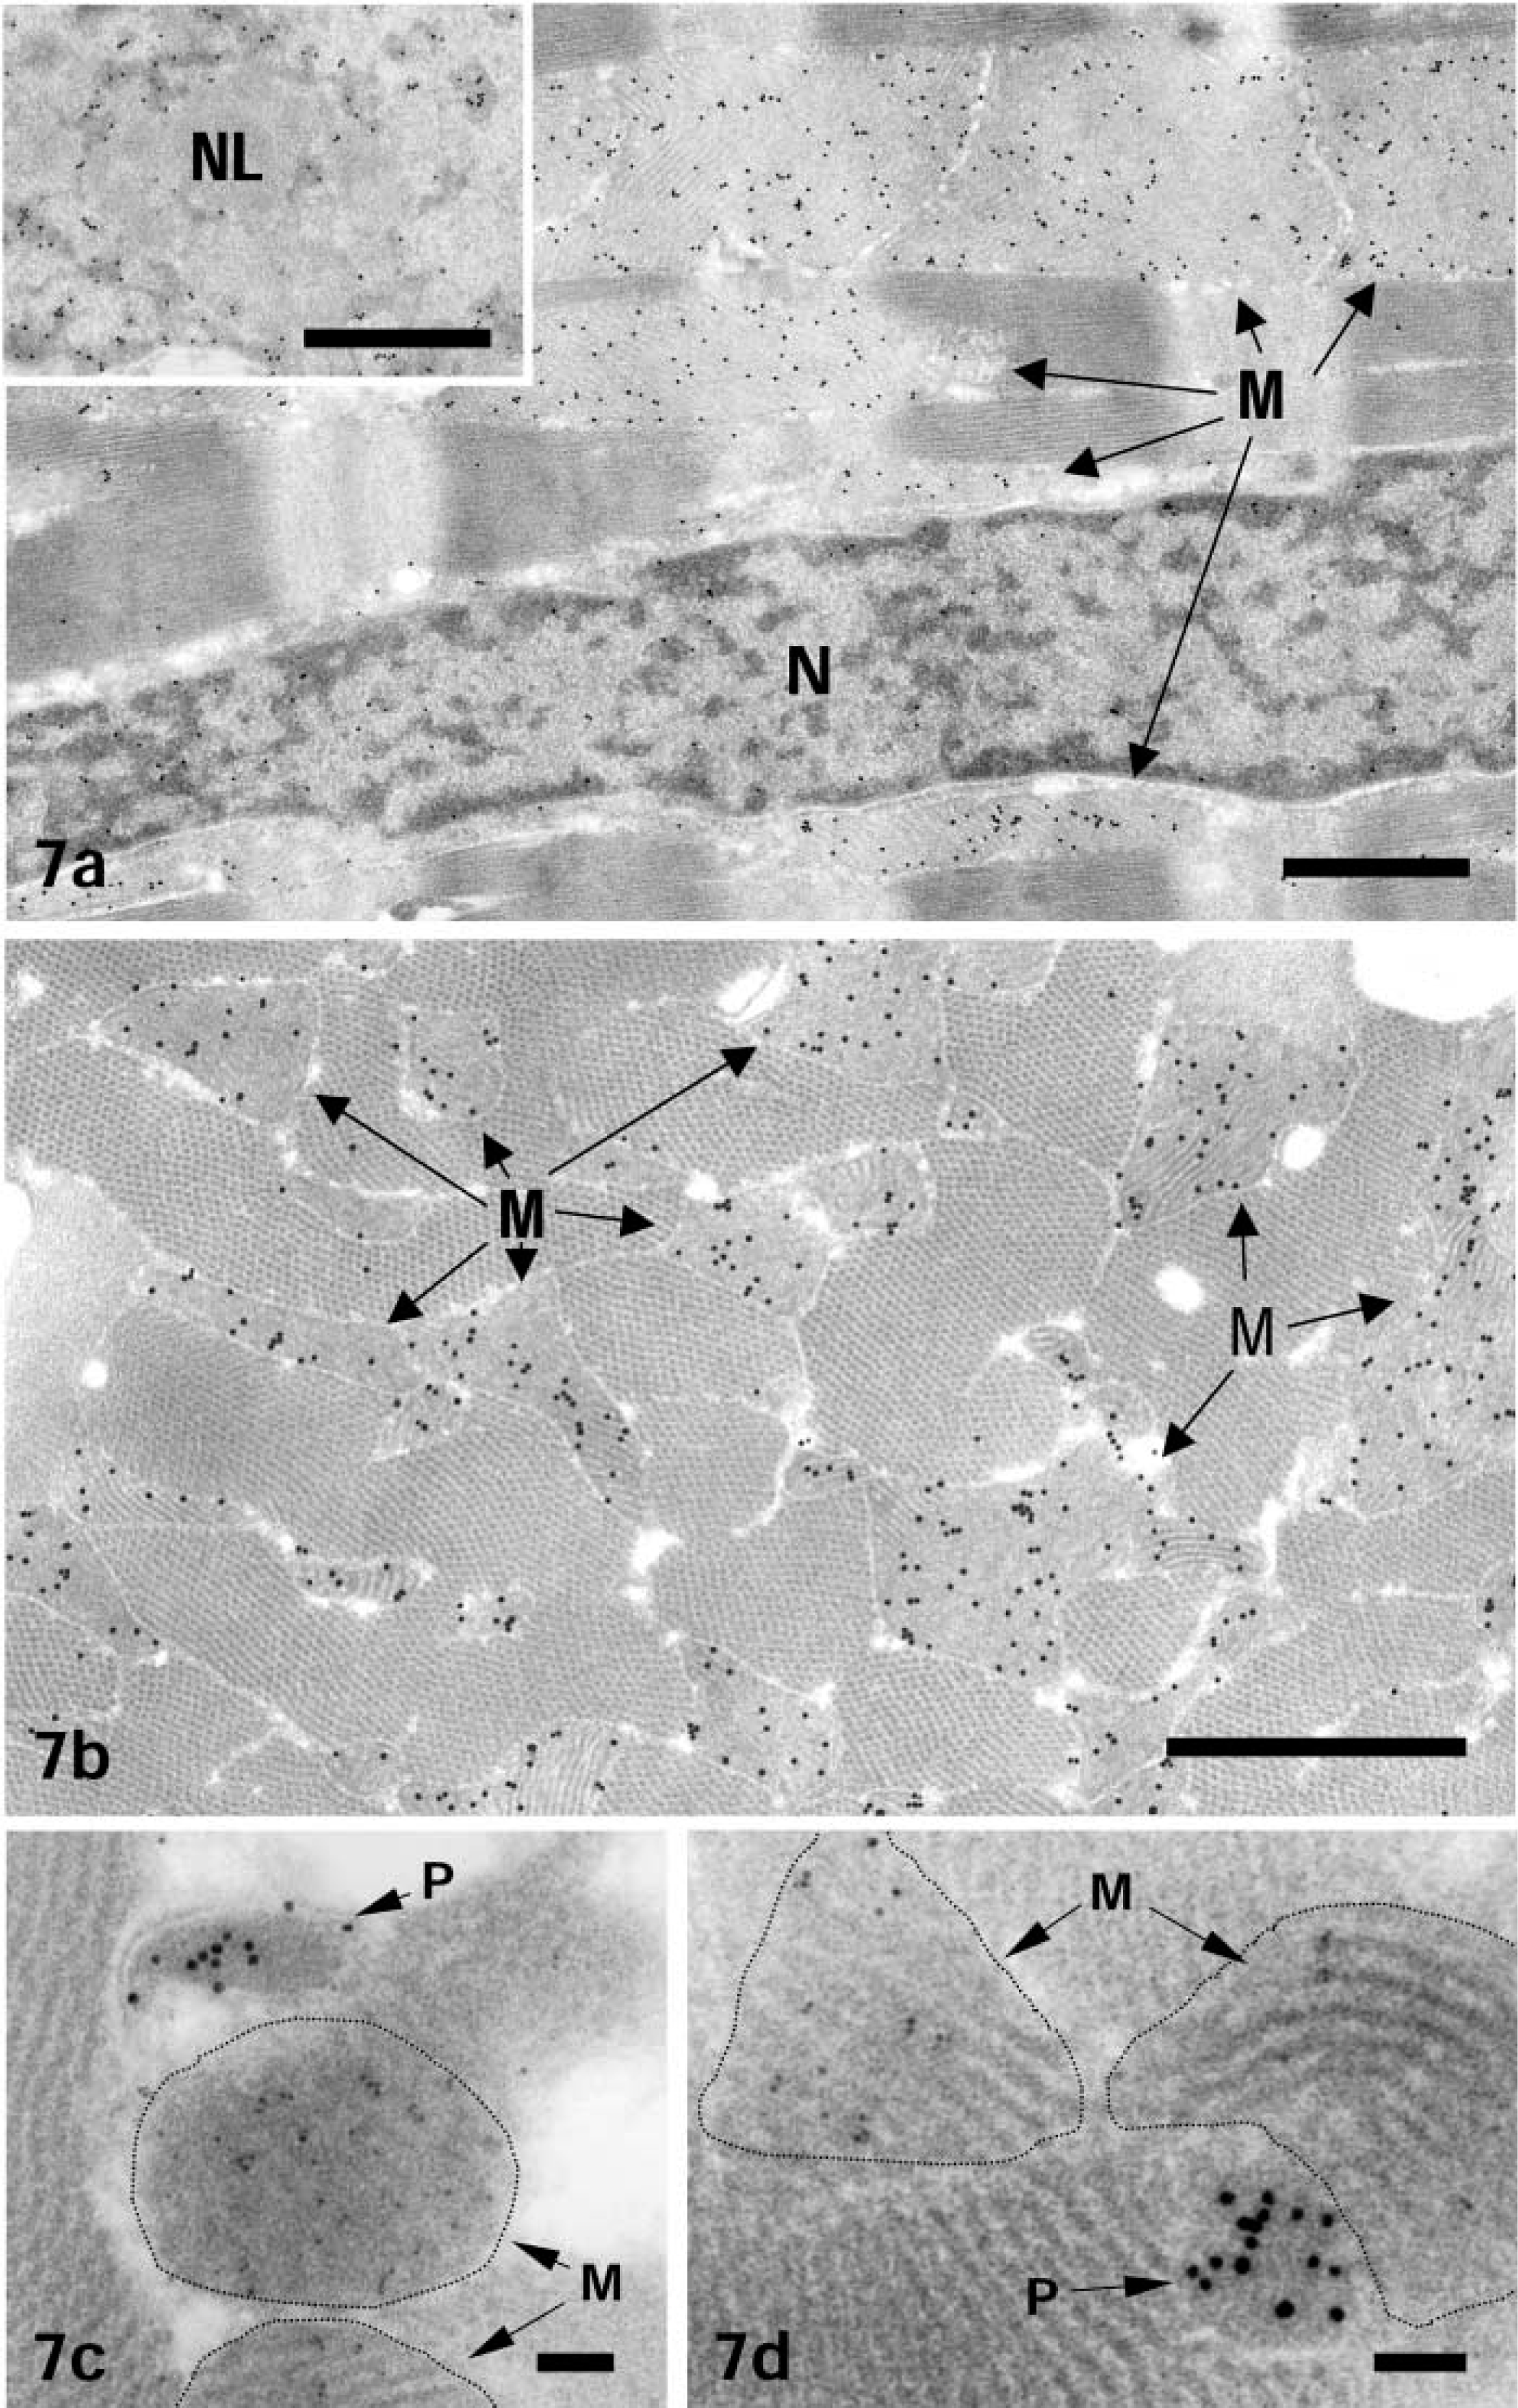
Heart. Gold particles showing subcellular sites of ICD1 were almost exclusively confined to mitochondria and cell nuclei, being absent from sarcoplasmic reticulum and myofibrils (Figures 7a and 7b). In the nuclei, gold particles were closely associated with heterochromatin and nucleolus (Figure 7a and inset). When sections were stained doubly for ICD1 and catalase using different-sized gold probes, ICD1 antigenic sites visualized with a small gold probe (8.5 nm in diameter) were found in the mitochondria, whereas catalase shown by a large gold probe (15 nm in diameter) was found exclusively in peroxisomes (Figures 7c and 7d). In control sections incubated with pre-immune serum instead of anti-ICD1 peptide antibody, followed by protein A-gold probe, no specific labeling in mitochondria was noted (data not shown).
Immunofluorescence staining of rat heart. (
Immunofluorescence staining of rat kidney. (
Immunoelectron microscopic staining of myocardium. (
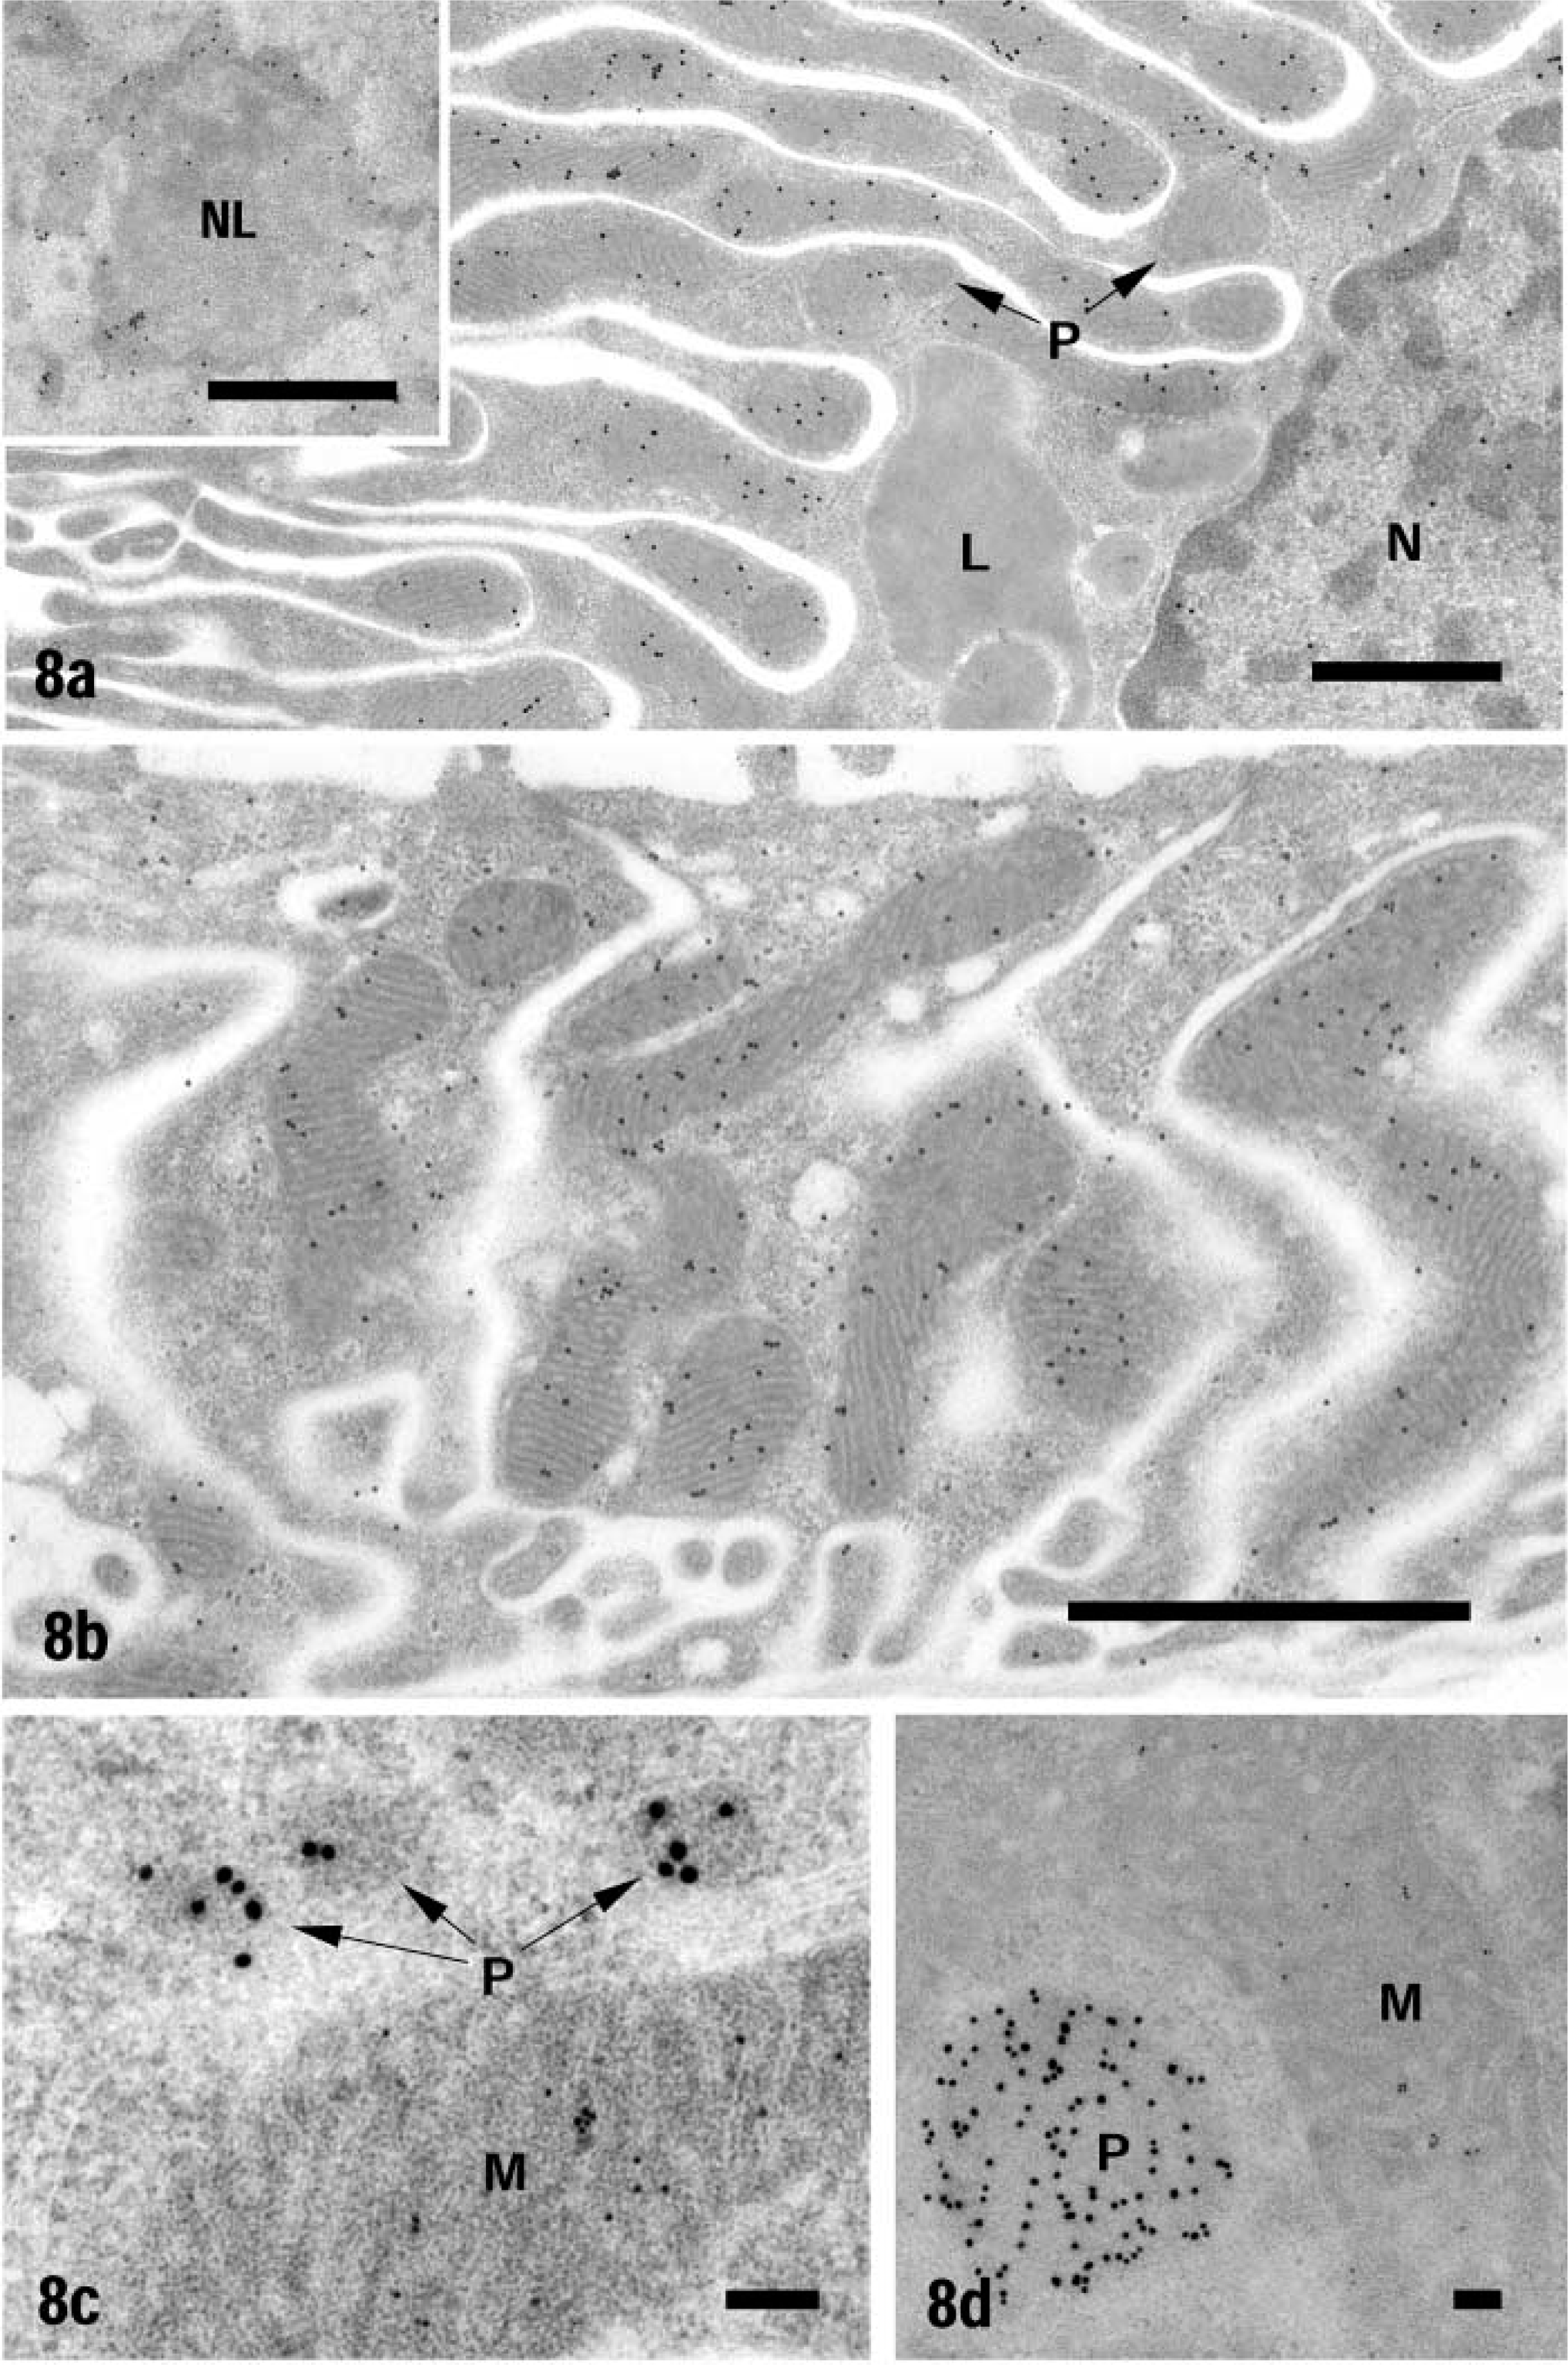
Kidney. Signals of ICD1 were observed in mitochondria and cell nuclei but not in peroxisomes and other organelles (Figures 8a and 8b). The staining was much weaker in the nucleus than in mitochondria. In the nucleus, most gold particles were associated with heterochromatin and nucleolus (Figure 8a and inset). As shown by immunofluorescence staining, the staining intensity varied among the segments of renal tubules. The highest staining intensity was noted in particular segments of distal tubules, in which only a few peroxisomes were present (Figure 8b). Except for the S3 segment, mitochondria of proximal tubules and collecting tubules generally exhibited very low staining intensity. The labeling intensity was essentially lower than that in heart muscle mitochondria. After the double labeling of ICD1 and catalase with protein A-gold probes of different sizes, no ICD1 was detected in peroxisomes (Figures 8c and 8d). In immunocytochemical control sections, no specific labeling was noted in mitochondria and nuclei (data not shown).
Immunoelectron microscopic localization of ICD1 in renal tubules of rat kidney. (
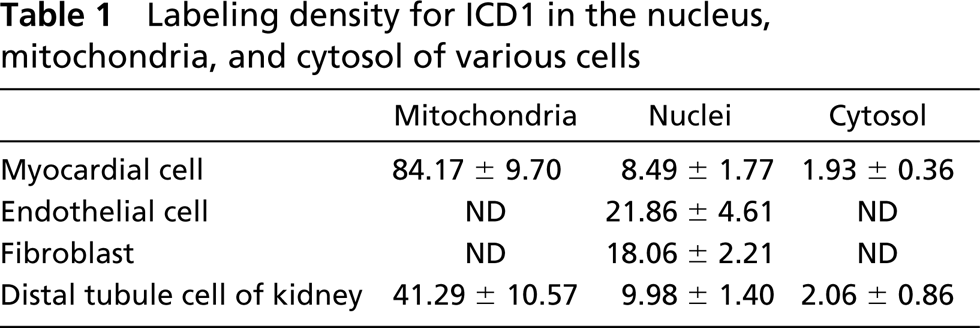
Quantitative Analysis of the Gold Labeling. Next, we analyzed the labeling density in heart muscle and kidney. The results are shown in Table 1. In both tissues, the labeling density of mitochondria and nuclei was significantly higher than that of cytoplasm. The labeling density of nuclei was approximately half the mitochondrial labeling density in the heart and kidney. The cytoplasmic labeling was similar to that obtained in immunocytochemical control experiments. The labeling density of heart muscle mitochondria and nuclei was approximately double that of kidney mitochondria and nuclei, respectively.
Labeling density for ICD1 in the nucleus, mitochondria, and cytosol of various cells
Nuclear Localization of ICD1
Immunocytochemical staining showed that ICD1 is localized in cell nuclei. However, the nuclear fractions isolated from heart and kidney by differential centrifugation contained very low levels of ICD activity (data not shown). Then we isolated highly pure nuclei from rat kidney and liver by equilibrium sedimentation (Tata 1974) and performed an enzyme assay of ICD, immunoblotting, immunocytochemistry, and routine electron microscopy. The isolated nuclei were confirmed to be highly pure by light and electron microscopy (data not shown). The specific ICD activity in nuclei isolated from heart, kidney, and liver was 8.4%, 5.5%, and 2% of that in the rat heart mitochondrial fraction, respectively (data not shown). By immunoblotting, weak but significant signals of ICD1 were detected in the isolated nuclei from heart, kidney, and liver (Figure 9). In a smear preparation of nuclei isolated from heart and kidney, the nuclei were positively stained for ICD1 by the immunofluorescence technique (data not shown). By immunoelectron microscopy, nuclei of capillary endothelial cells, fibroblasts, and renal tubule epithelial cells were labeled with gold particles (Figure 10). In nuclei, gold signals were localized in heterochromatin and the nucleolus. No gold particles were noted in the immunoelectron microscopic control sections incubated with pre-immune serum followed by protein A-gold probe (data not shown).
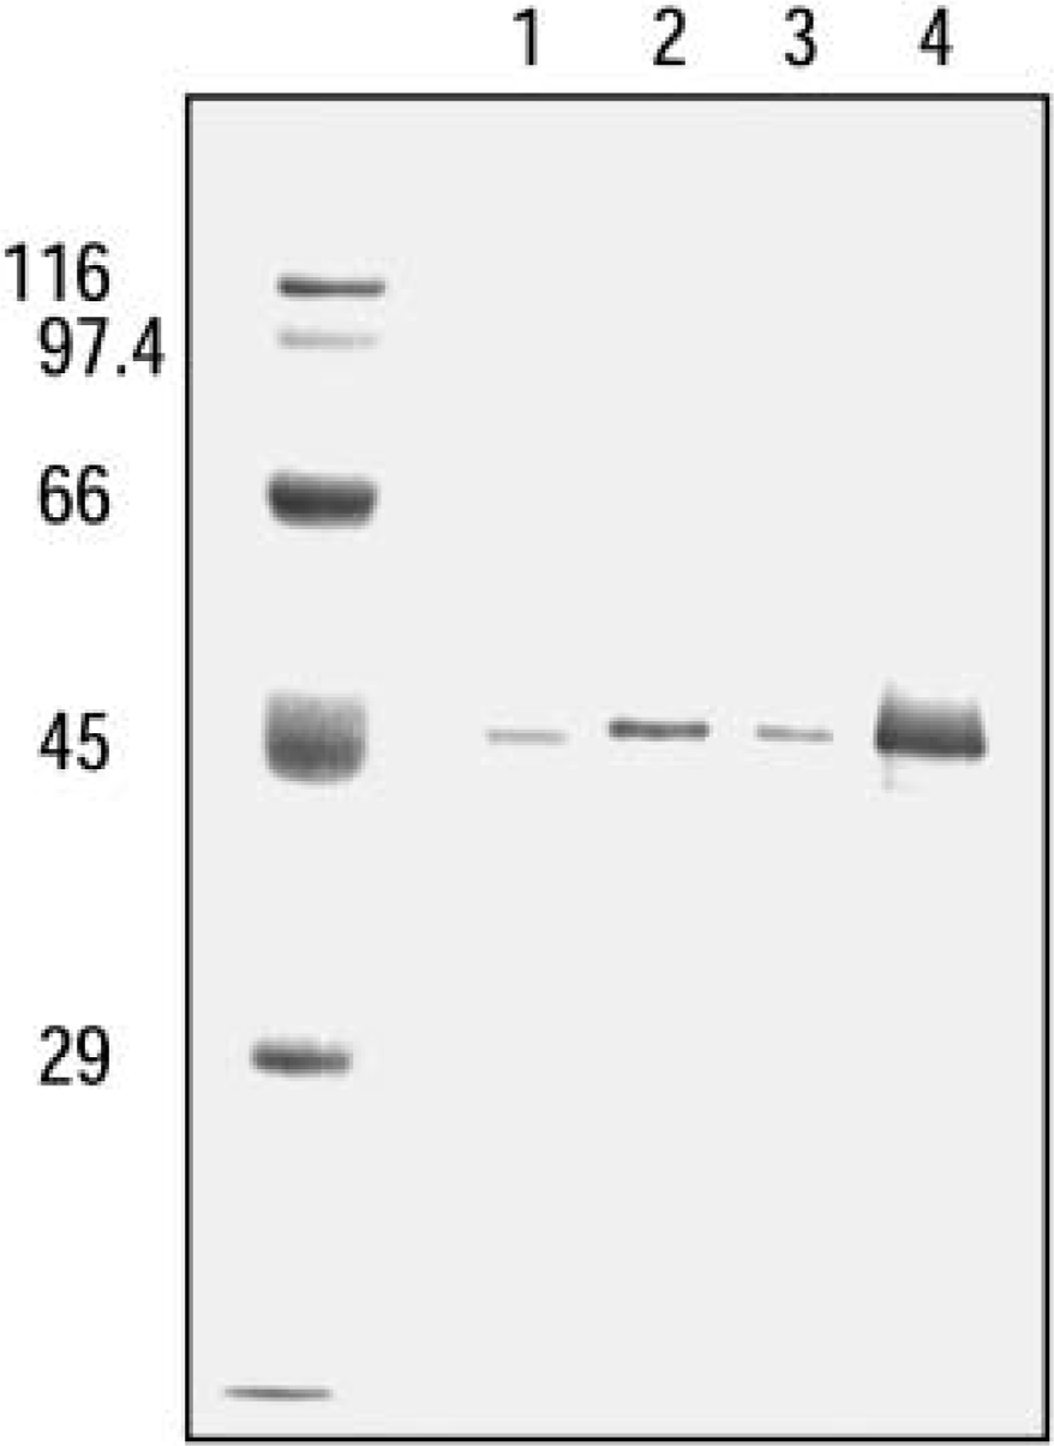
Western blotting analysis of ICD1 in isolated nuclei. Lane 1, liver nuclei (12 μg); Lane 2, kidney nuclei (12 μg); Lane 3, heart nuclei (12 μg); Lane 4, heart mitochondria (3 μg). Note that loaded protein of nuclei was threefold that of heart mitochondria. Numbers at left are molecular weights of standard markers.
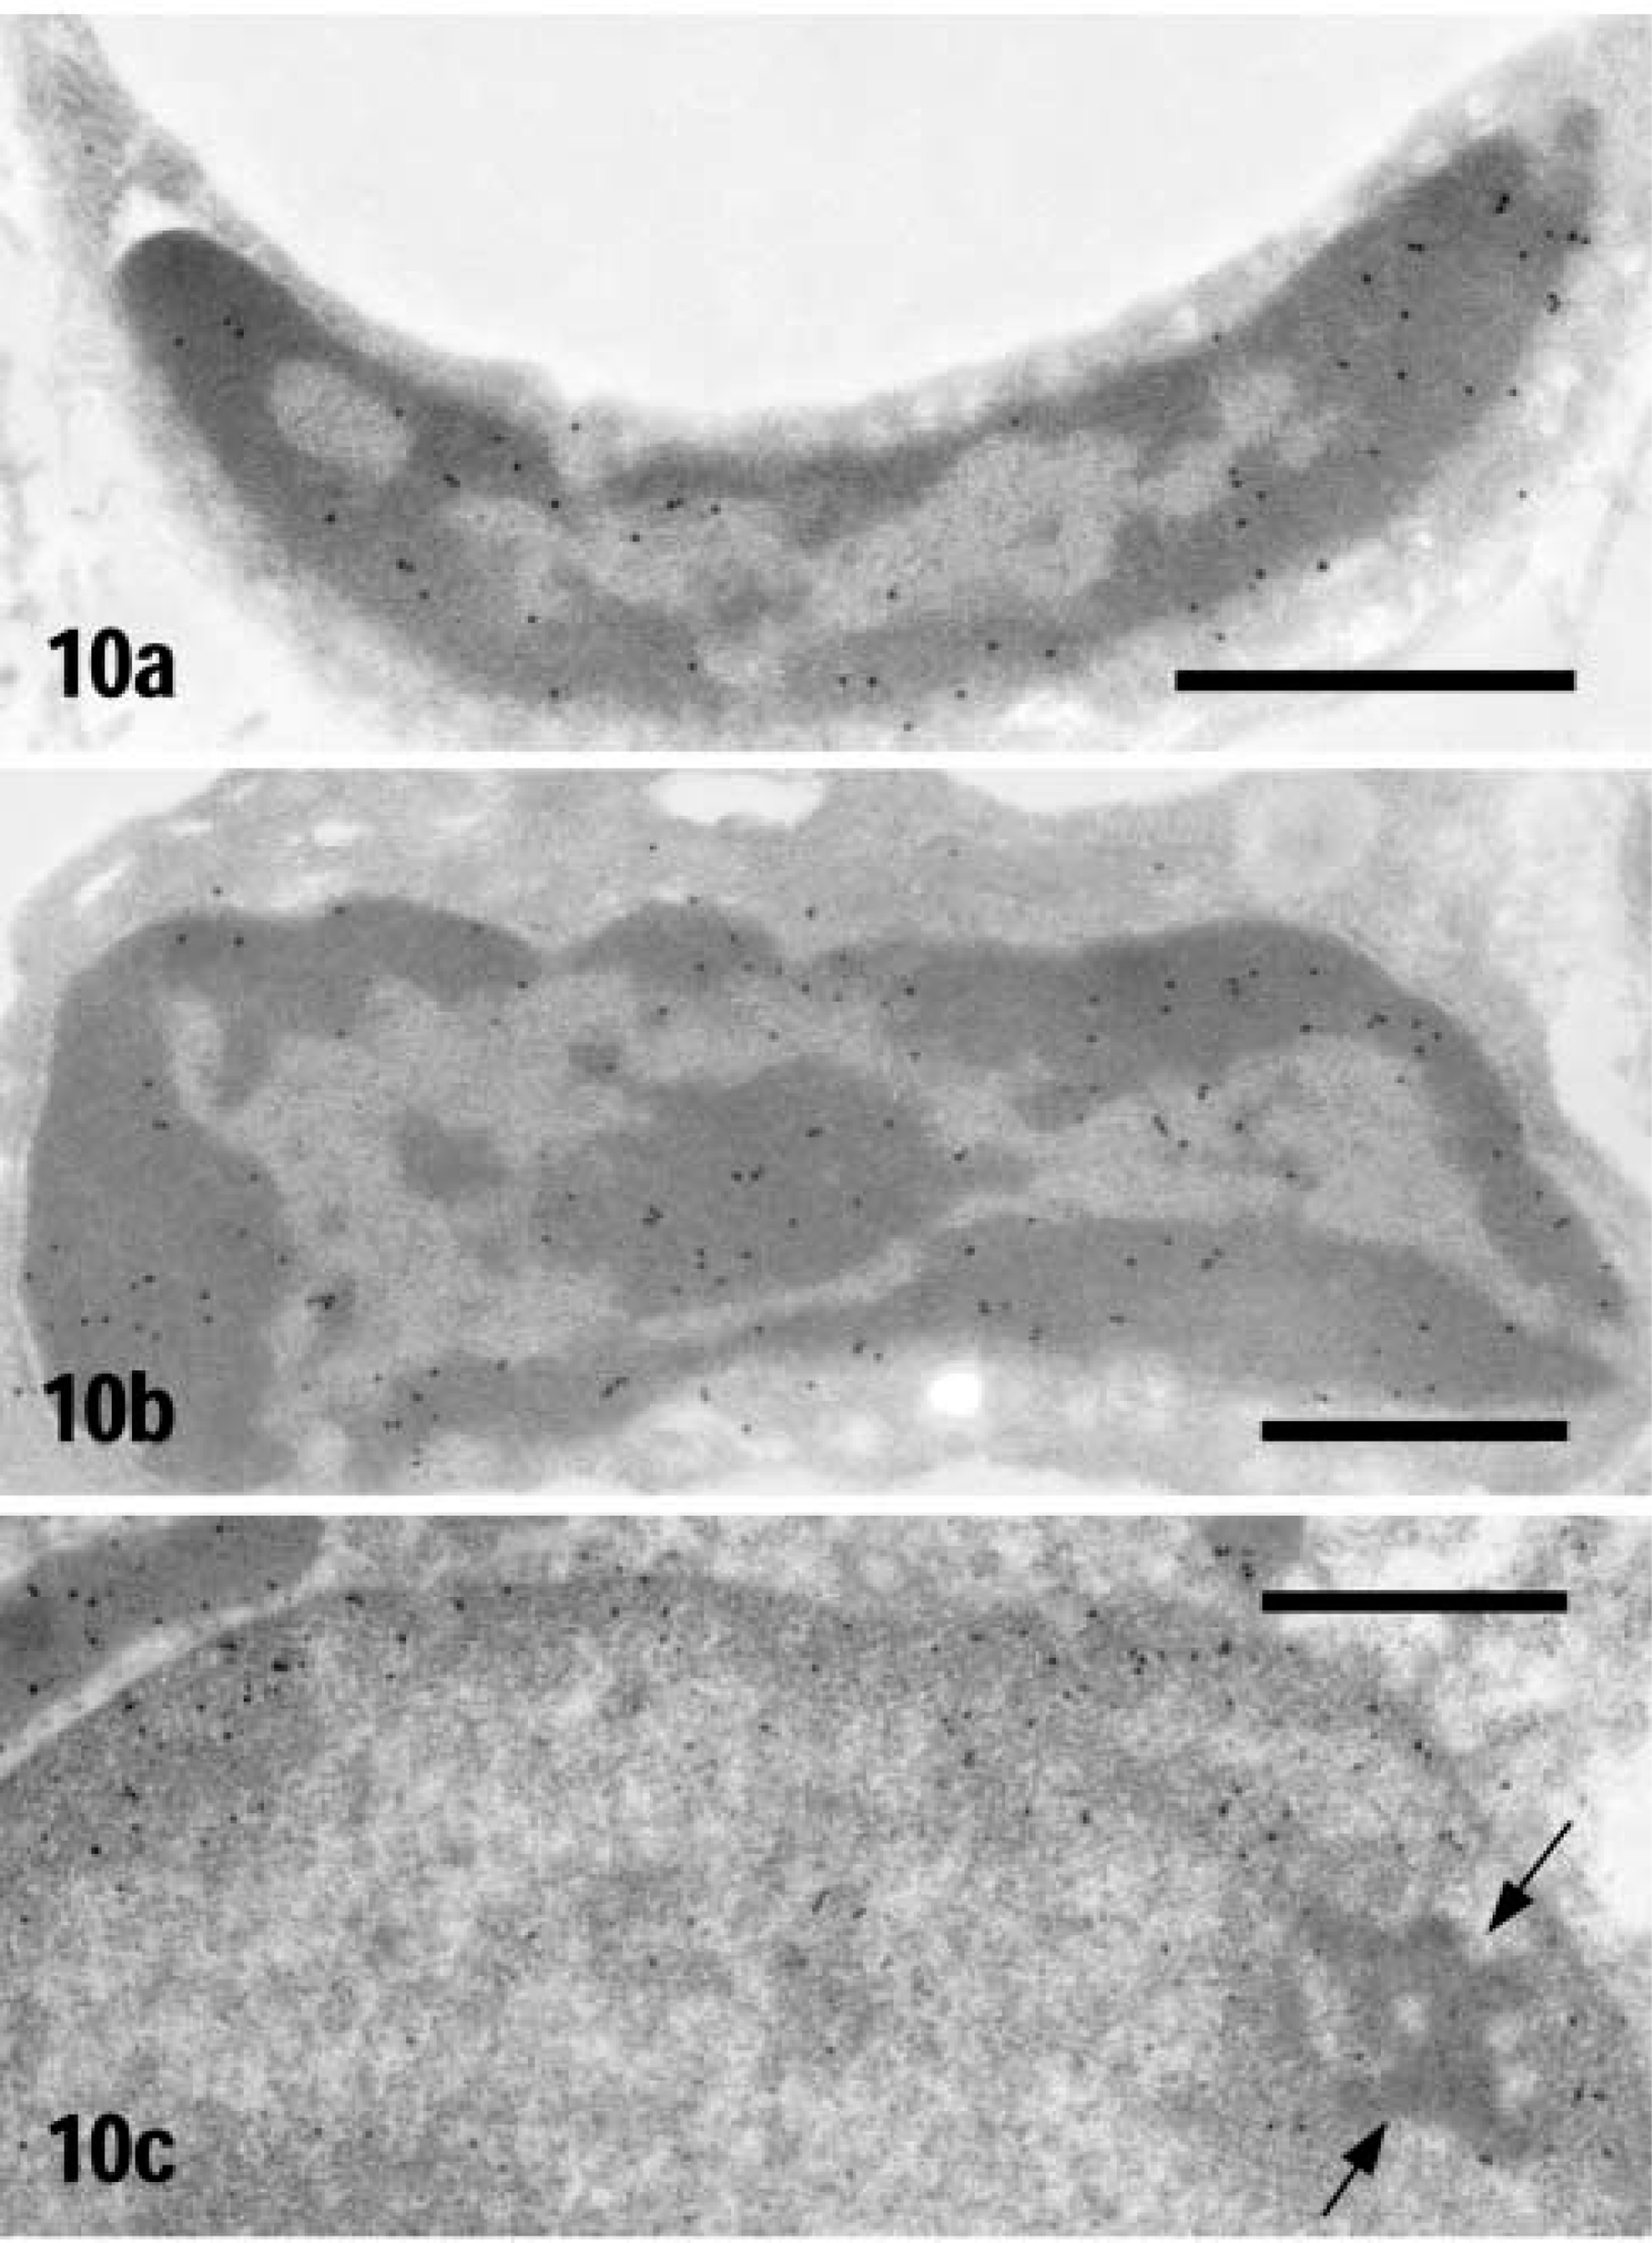
ICD1 immunogold staining of nuclei in rat heart and kidney. (
Discussion
Specificity of Antibody
Rabbit antibody to a peptide of 14 amino acids at the C-terminus of mouse ICD1 was demonstrated to react with the peptide conjugated with BSA by dot-blotting analysis. Experiments using antibody-absorbing PVDF membranes showed that the anti-ICD1 peptide antibody could react with ICD1 to reduce the enzymatic activity in heart extract. Furthermore, Western blotting analysis showed that the anti-peptide antibody reacted with a single protein band with a molecular mass of 45 kD, which was considerably smaller than the unprocessed precursor form that had been predicted from DNA sequences so far: bovine, 50,824 (Huh et al. 1993); human, 50,948 (Huh et al. 1993); mouse, 58,749 (Yang et al. 1996); pig, 47,526 (Haselbeck et al. 1992); and yeast, 48,009 (Imajo et al. 1997). These precursor forms of ICD1 seem to be imported into mitochondria and the signal sequence is cut off to form the mature enzyme. The complete amino acid sequence of rat ICD1 has yet to be determined. It appears that ICD1 is produced as a large precursor, depending on the species.
Localization of ICD1 in Rat Liver After Nycodenz Gradient Centrifugation
We have tried to purify peroxisomes from the light mitochondrial fraction of rat kidney and heart by Nycodenz gradient centrifugation but we could not recover intact peroxisomes. Therefore, in the present study we subjected the light mitochondrial fractions of rat liver to Nycodenz gradient centrifugation. ICD1 was distributed in mitochondrial fractions where acyl-CoA dehydrogenase existed but not in peroxisomal fractions where catalase was detected. The results clearly show that ICD1 is a mitochondrial enzyme in the liver. The mitochondrial localization of ICD1 in heart and kidney was confirmed by immunocytochemical staining.
Localization of ICD1 in Heart and Kidney of Rat
Immunofluorescence microscopy of ICD1 showed that staining patterns were consistent with typical mitochondrial patterns seen in heart muscle and renal tubules. In heart muscles, staining of serial sections for ICD1 and catalase indicated that both enzymes were present in different cytoplasmic granules. In kidney, immunofluorescence for ICD1 varied in intensity among renal tubule segments. Strong staining was noted in mitochondria of the distal convoluted tubules, followed by the proximal tubules. Collecting tubules and the thin limb of the loop of Henle were stained only very weakly or not at all. We stained serial sections 100 nm thick for ICD1 and catalase. The results clearly showed that renal tubule segments heavily stained for ICD1 were hardly stained at all for catalase, whereas the segments moderately stained for ICD1 were strongly stained for catalase. It has been shown that in the kidneys most peroxisomes are located in the proximal but not the distal tubules (Barrett and Heidger 1975). Therefore, our results demonstrate that the mitochondria of the distal tubules contain much more ICD1 than those of the proximal tubules. The mitochondrial localization of ICD1 was confirmed by postembedding immunoelectron microscopy. In heart and kidney, gold particles showing the antigenic sites for ICD1 were associated with mitochondria but not other organelles, including lysosomes and peroxisomes, except for nuclei. Double labeling of thin sections with ICD1 and catalase revealed that ICD1 was not found in peroxisomes in heart and kidney. All these results are consistent with the biochemical data reported thus far (Henderson 1968; Uhr et al. 1974; Fox and Crockett 1977; Kelly and Plaut 1981; Plaut et al. 1983).
Nuclear Localization of ICD1
In the present study, cell nuclei of heart and kidney were stained by both immunofluorescence and immunogold techniques. However, staining intensity of the nuclei was significantly weaker than that of mitochondria. Furthermore, the staining was not observed in the immunocytochemical control sections treated with pre-immune serum (data not shown). Immunogold staining showed similar results. The labeling density of mitochondria was approximately 10-fold that of nuclei in heart and about five-fold that in kidney. Biochemical assays of ICD activity in isolated nuclei also showed the presence of ICD1 in the nuclei, although the activity per mg of protein was essentially lower than in mitochondria. All together, the present results strongly suggest that ICD1 is present in cell nuclei of heart and kidney, including those of connective tissue and capillaries. It has been reported that no ICD activity was detected in nuclei isolated from rat liver and Zaidel's hepatoma by an enzyme cytochemical method (Anders and Bukhvalov 1972). However, biochemical study showed that 3% and 10% of total ICD activity was present in nuclei fraction of rat liver and heart, respectively (Bell and Baron 1968). In single dorsal root ganglion cells of rabbits, the nuclear ICD activity was found to be 1.45-fold higher than the cytoplasmic activity (Kato and Lowry 1973). The nucleus of rat fibroblast-like cells cultured for 6 days seems to be stained in part by an enzyme cytochemical technique (Grzycki and Kifer 1974). Glutamate dehydrogenase, which was regarded as one of the mitochondrial marker enzymes (Hogeboom and Schneider 1953), was also detected in the nuclear fraction of rat liver and dorsal root ganglia and mouse brain (Loverde and Lehrer 1973; Lai et al. 1986). Therefore, it is likely that some mitochondrial enzymes, including ICD, are also present in the cell nucleus. The present results support these reports. However, when cDNA encoding a non-cytosolic ICD with a construct containing the entire targeting signal and green fluorescent protein (GFP) gene was transfected into tobacco cells, GFP was detected exclusively in mitochondria (Gálvez et al. 1998). This type of experiment should be tried in mammalian cells to confirm where GFP-ICD1 is localized.
In the present study, no apparent difference in molecular size was seen between mitochondrial and nuclear ICD1. This could be explained as follows. Newly synthesized ICD1 is imported to mitochondria, where its signal sequence is cut off, and then the mature ICD1 is exported to the cytoplasm. Finally, it is transported into the nucleus through an unknown mechanism. Recently, it has been reported that mitochondrion-resident proteins display function different from their original activity in the outside of mitochondria (Soltys and Gupta 1999; Valgardsdottir et al. 2001). This idea might not be so preposterous. Otherwise, we could speculate that there are nuclear type and mitochondrial type ICD1(s) with the same molecular weight. In this case, the ICD1-encoding genes are presumed to be mitochondrial type and nuclear type, or a single gene is transcribed through alternative splicing, or the transcription begins at different start sites to produce two types of ICD1. To solve these problems, it is necessary to know the amino acid sequence at the N-terminus of nuclear-type ICD1.
Physiological Function of ICD1 in Mitochondria and Nuclei
In the present study we have shown that the mitochondrial isoenzyme of ICD1 is localized in mitochondria as well as nuclei. In mitochondria there are two types of ICDs, NAD-specific and NADP-specific. Both enzymes catalyze oxidative decarboxylation of isocitrate to 2-oxoglutarate and require either NAD or NADP, producing NADH or NADPH, respectively. It has been shown that, in the yeast Saccharomyces cerevisiae, NAD-specific ICD significantly contributes to the tricarboxylic acid (TCA) cycle (Keys and McAlister-Henn 1990; Cupp and McAlister-Henn 1991). Although the yeast mitochondrial NADP-specific ICD has been proposed to provide alternative TCA activity (Machado et al. 1975), its actual contribution to the TCA cycle or other cell processes remains unclear. A study using a potent specific inhibitor of NADP-specific ICD showed that, in rat liver, more than 80% of the intramitochondrial isocitrate generated from pyruvate and malate was oxidized by NAD-specific ICD. In the absence of the inhibitor, NADPH was produced by ICD1 in rat liver and negatively modulated NAD-specific ICD (Plaut and Gabriel 1983). Although many biochemical and kinetic studies have characterized ICD1, its structure and relationship to other isoenzymes of ICD, especially in mammalian systems, have not been addressed. Recently, it was suggested that ICD1 is a major NADPH producer in the mitochondria and plays a key role in cellular defense against oxidative stress-induced damage (Jo et al. 2001).
The present study has shown that ICD1 is present in the nuclei of various cell types, including epithelial cells of renal tubules, fibroblasts of connective tissues, endothelial cells of capillaries, and myocardial cells. The nuclei of some cells contained little or no stain. In the nuclei, immunofluorescence staining for ICD1 was dotted and appeared to be associated with chromatin. By IEM, gold particles were found predominantly attached to heterochromatin. These results suggest that nuclear ICD1 associates with heterochromatin but is not homogeneously scattered in the nucleoplasm. The biochemical role of nuclear ICD1 is not understood any better than that of mitochondrial ICD1. It is likely that nuclear ICD1 provides NADPH by its enzymatic oxidation of isocitrate or NADP by reduction of 2-oxoglutarate. NADP and NADPH are used as co-factors in various biochemical reactions. The nuclear metabolism of tirapazamine, a bioreductive drug now in clinical trials, is carried out by unknown reductases and is supported by NADPH or NADH (Delahoussaye et al. 2001). The association of ICD1 with heterochromatin suggests that one of the functions of ICD1 is related to heterochromatin.
In conclusion, we have demonstrated immunocytochemically that the major subcellular site for mitochondrial NADP-specific isocitrate dehydrogenase (ICD1) is in fact the mitochondria, and a minor site is nuclei in rat kidney and heart. In kidney, the mitochondrial content of ICD1 differs among the tubule segments, whereas in heart it is homogeneous. The nuclei of several cells and tissues contain ICD1, which is associated with heterochromatin.