
Abstract
Neural stem cells proliferate in liquid culture as cell clusters (neurospheres). This study was undertaken to characterize the epidermal growth factor (EGF)-expanded free-floating neurospheres derived from rat fetal striatum. We examined the ultrastructural and antigenic characteristics of these spheres. They consisted of two cell types, electron-dense and electron-lucent cells. Lucent cells were immunopositive to actin, vimentin, and nestin, whereas dense cells were immunopositive to actin, weakly positive to vimentin, and nestin-negative. Neurospheres contained healthy, apoptotic, and necrotic cells. Healthy cells were attached to each other by adherens junctions. They showed many pseudopodia and occasionally a single cilium. Sphere cells showed phagocytic capability because healthy cells phagocytosed the cell debris derived from dead cells in a particular process that involves the engulfment of dying cells by cell processes from healthy cells. Sphere cells showed a cytoplasmic and a nuclear pool of fibroblast growth factor (FGF) receptors. They expressed E- and N-cadherin, α- and β-catenin, EGF receptor, and a specific subset of FGF receptors. Because sphere cells expressed this factor in the absence of exogenous FGF-2, we propose that they are able to synthesize FGF-2.
A
Materials and Methods
Primary Antisera
Polyclonal antibodies against EGFR, FGFR-1, −2, −3, FGF-2, TGF-β, TNF-α, E (epithelial)-, N (neural)-, and P (placental)-cadherin, α-, β-, and γ-catenin (also termed plakoglobin) were purchased from Santa Cruz Biotechnology (Santa Cruz, CA) and the polyclonal anti-GABA antibody was obtained from Chemicon International (Temecula, CA). The monoclonal antibodies used here were anti-nestin (clone rat 401; Developmental Studies Hybridoma Bank, University of Iowa, Iowa City, IA), β-tubulin isotype III and smooth muscle α-actin (both from Sigma; St Louis, MO), actin and vimentin (both from Amersham; Poole, UK), desmin and tyrosine hydroxylase (both from Boehringer-Mannheim; Mannheim, Germany), GFAP (Dako; Glostrup, Denmark), TGF-α (Santa Cruz Biotechnology), NeuN (Chemicon), and A2B5 from hybridoma supernatant. These antibodies have previously been utilized for immunocytochemical and immunoblotting studies and have been extensively characterized to confirm their specificity (Arenas et al. 1997,2000; Handler et al. 2000; Tannheimer et al. 2000; Reimers et al. 2001).
Cell Cultures
Striata from E15 Sprague-Dawley rat fetuses were dissected and mechanically dissociated. Cell suspensions were cultured as previously described (Bazán et al. 1996,1998; Reimers et al. 2001) in a defined medium (DF12) composed of Dulbecco's modified Eagle's medium and Ham's F-12 (1:1), 2 mM
Light Microscopy
After six passages, neurosphere cells were plated at a density of 20,000–30,000 cells/cm2 on poly-
Electron Microscopy
The cells used for electron microscopic analysis were EGF-expanded over six passages. Free-floating neurospheres were fixed in situ with 2.5% paraformaldehyde–0.5% glutaraldehyde in PBS for 2 hr at 4C. After rinsing in PBS, some cells were postfixed for 30 min with 1% osmium tetroxide in PBS, dehydrated through graded ethanol series, en bloc-stained during dehydration with a saturated solution of uranyl acetate in 70% ethanol, and embedded in Araldite for the ultrastructural study of cells. For immunocytochemical studies, cells were fixed as described above, dehydrated through graded ethanol series and embedded in Lowicryl K4M. Semithin sections (1 μM thick) were stained with 1% toluidine blue and examined under a light microscope. Immunogold assays were performed as previously described (Lobo et al. 1997). Briefly, serial ultrathin sections were cut with a diamond knife and collected on nickel grids. They were incubated in 3% normal goat serum with 0.05% Triton X-100 in Tris-buffered saline (TBS) for 30 min at room temperature (RT). Sections were then incubated overnight at 4C with the primary antibodies diluted in TBS: polyclonal anti-FGFR-1, −2 and −3 1:50, and monoclonal anti-actin 1:200, vimentin 1:50, nestin 1:100, GFAP 1:100, A2B5 1:10, NeuN 1:100, and β-tubulin III 1:100. Afterwards the sections were rinsed in TBS and incubated for 2 hr at RT in 15-nm gold-conjugated secondary antibodies, goat anti-rabbit or goat anti-mouse IgG (British Biocell International; Cardiff, UK) diluted 1:40 in TBS. Once rinsed in TBS, the sections were fixed in 1% glutaraldehyde at RT for 10 min and washed in distilled water. Sections were stained with lead citrate and uranyl acetate and examined under a Zeiss EM10 electron microscope. The specificity of the light and electron microscopic immunocytochemical procedures was tested by omitting the primary antibodies, using non-immune serum instead of the primary antibodies, and incubating with an inappropriate secondary antibody after the incubation with the primary antibodies at optimal titers.
Western Blotting Protein Analysis
Additional cell cultures (sixth passage floating neurospheres and cultures at 3 dpp) were homogenized in 0.5 M Tris-HCl buffer (pH 7.4) containing 1 mM EDTA, 12 mM 2-mercaptoethanol, 1 mM benzamidine, 0.5% NP-40, and 1 mM phenylmethylsulfonyl fluoride. Homogenates were centrifuged at 10,000 X g for 30 min. Aliquots of 20 μg protein were separated by electrophoresis in 6%, 9%, or 15% SDS-polyacrylamide minigels and transferred to nitrocellulose filters. The filters were soaked in blocking solution (5% Blotto–0.05% Tween-20 in TBS, pH 7.4) for 2 hr at 37C and then incubated with the primary antibodies diluted in the same blocking solution: anti-E-, N-, and P-cadherin, α-, β-, and γ-catenin, FGFR-1, −2, −3, EGFR, FGF-2, TGF-α and -β, TNF-α, actin, smooth muscle α-actin, vimentin, desmin, nestin, GFAP, and NeuN. After extensive washing with TBS-Tween 20, the filters were incubated with the peroxidase-labeled second antibodies (Chemicon) diluted 1:5000 in blocking solution. The filters were developed with an enhanced chemiluminescence (ECL) Western blotting analysis, following the procedure described by the manufacturer (Amersham). Three different Western blot analyses per sample and primary antibody were carried out.
Free-floating neurospheres (
Cells of floating spheres. (
Results
Sphere Cell Differentiation
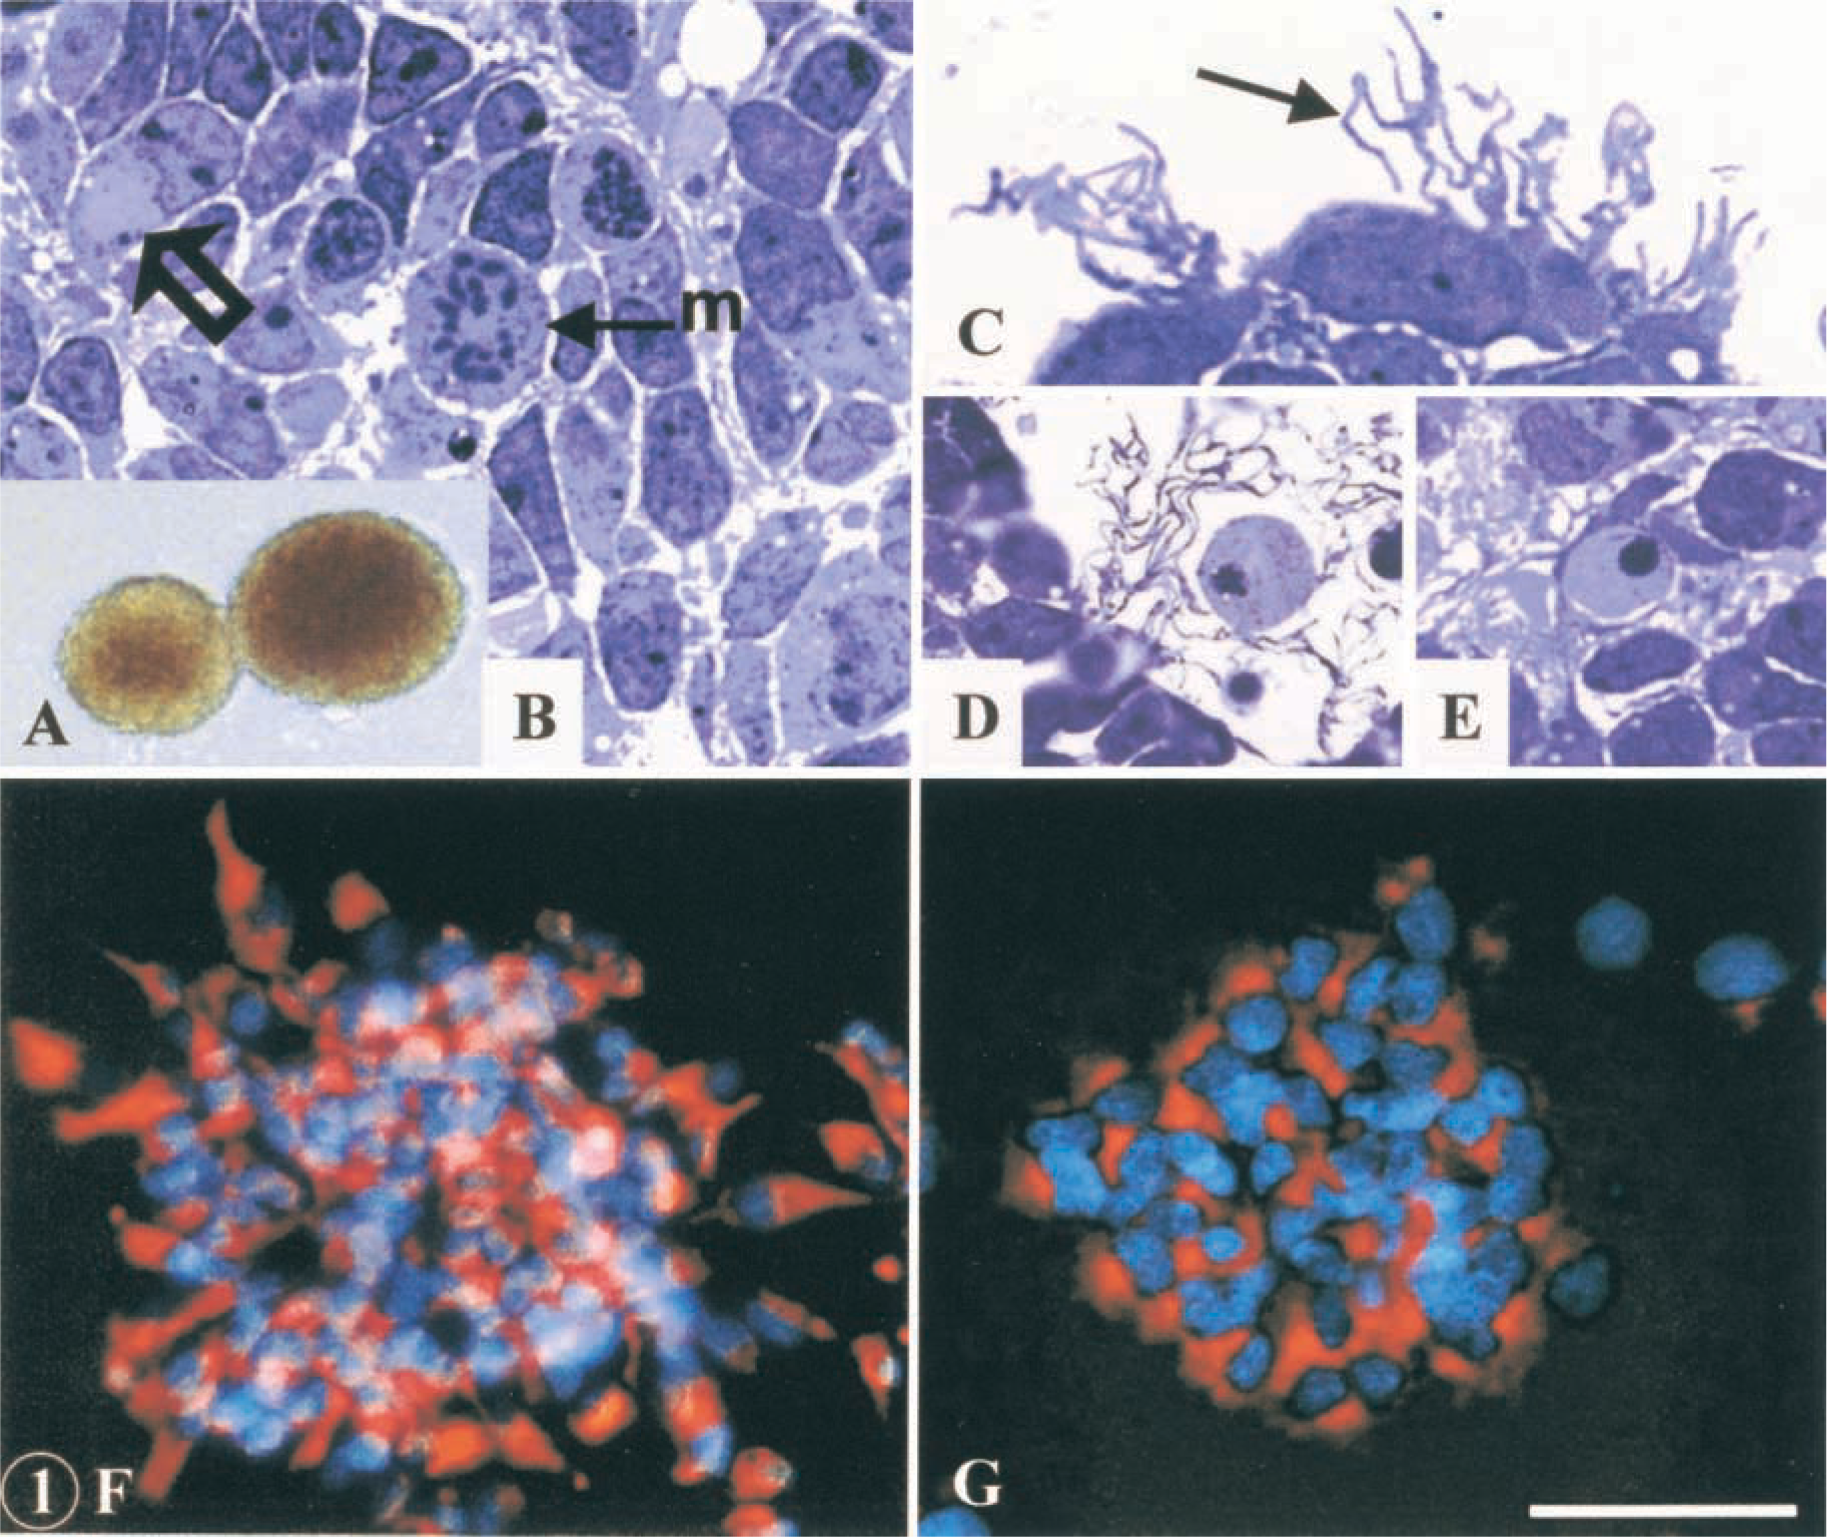
Cells were isolated from rat fetal striatum and propagated in vitro. After six passages, floating neurospheres (Figures 1A–1E) were seeded onto adherent substrate and treated with EGF for 3 more days to enhance proliferation of cells. Afterwards the mitogen was withdrawn and cells grew in a defined medium, which promoted the differentiation process. At 2 hr after plating, most cells in undifferentiated spheres were immunopositive to nestin (Figure 1F) and EGFR (Figure 1G) and were shown to incorporate BrdU, indicative of cell division. However, a few neurosphere cells were immunopositive to GFAP (a marker of astrocytes) and A2B5 (a marker of early glial precursors). At 3 dpp, most cells were stained for nestin and a small percentage of cells showed β-tubulin III immunoreactivity and a clear neuronal morphology. Between 6 and 10 dpp, the percentage of nestin-positive cells decreased and the cell population immunopositive to β-tubulin III and GFAP increased, as previously described (Reimers et al. 2001). Of the total neuron population generated in the cultures, 70–80% were immunopositive for GABA and none of them were immunoreactive to tyrosine hydroxylase. These experiments demonstrated that the cells studied here expand in neurosphere cultures and differentiate in vitro to neurons and glial cells, and that the adherent spheres (derived from free-floating neurospheres) express nestin.
Ultrastructural Characterization of Floating Spheres
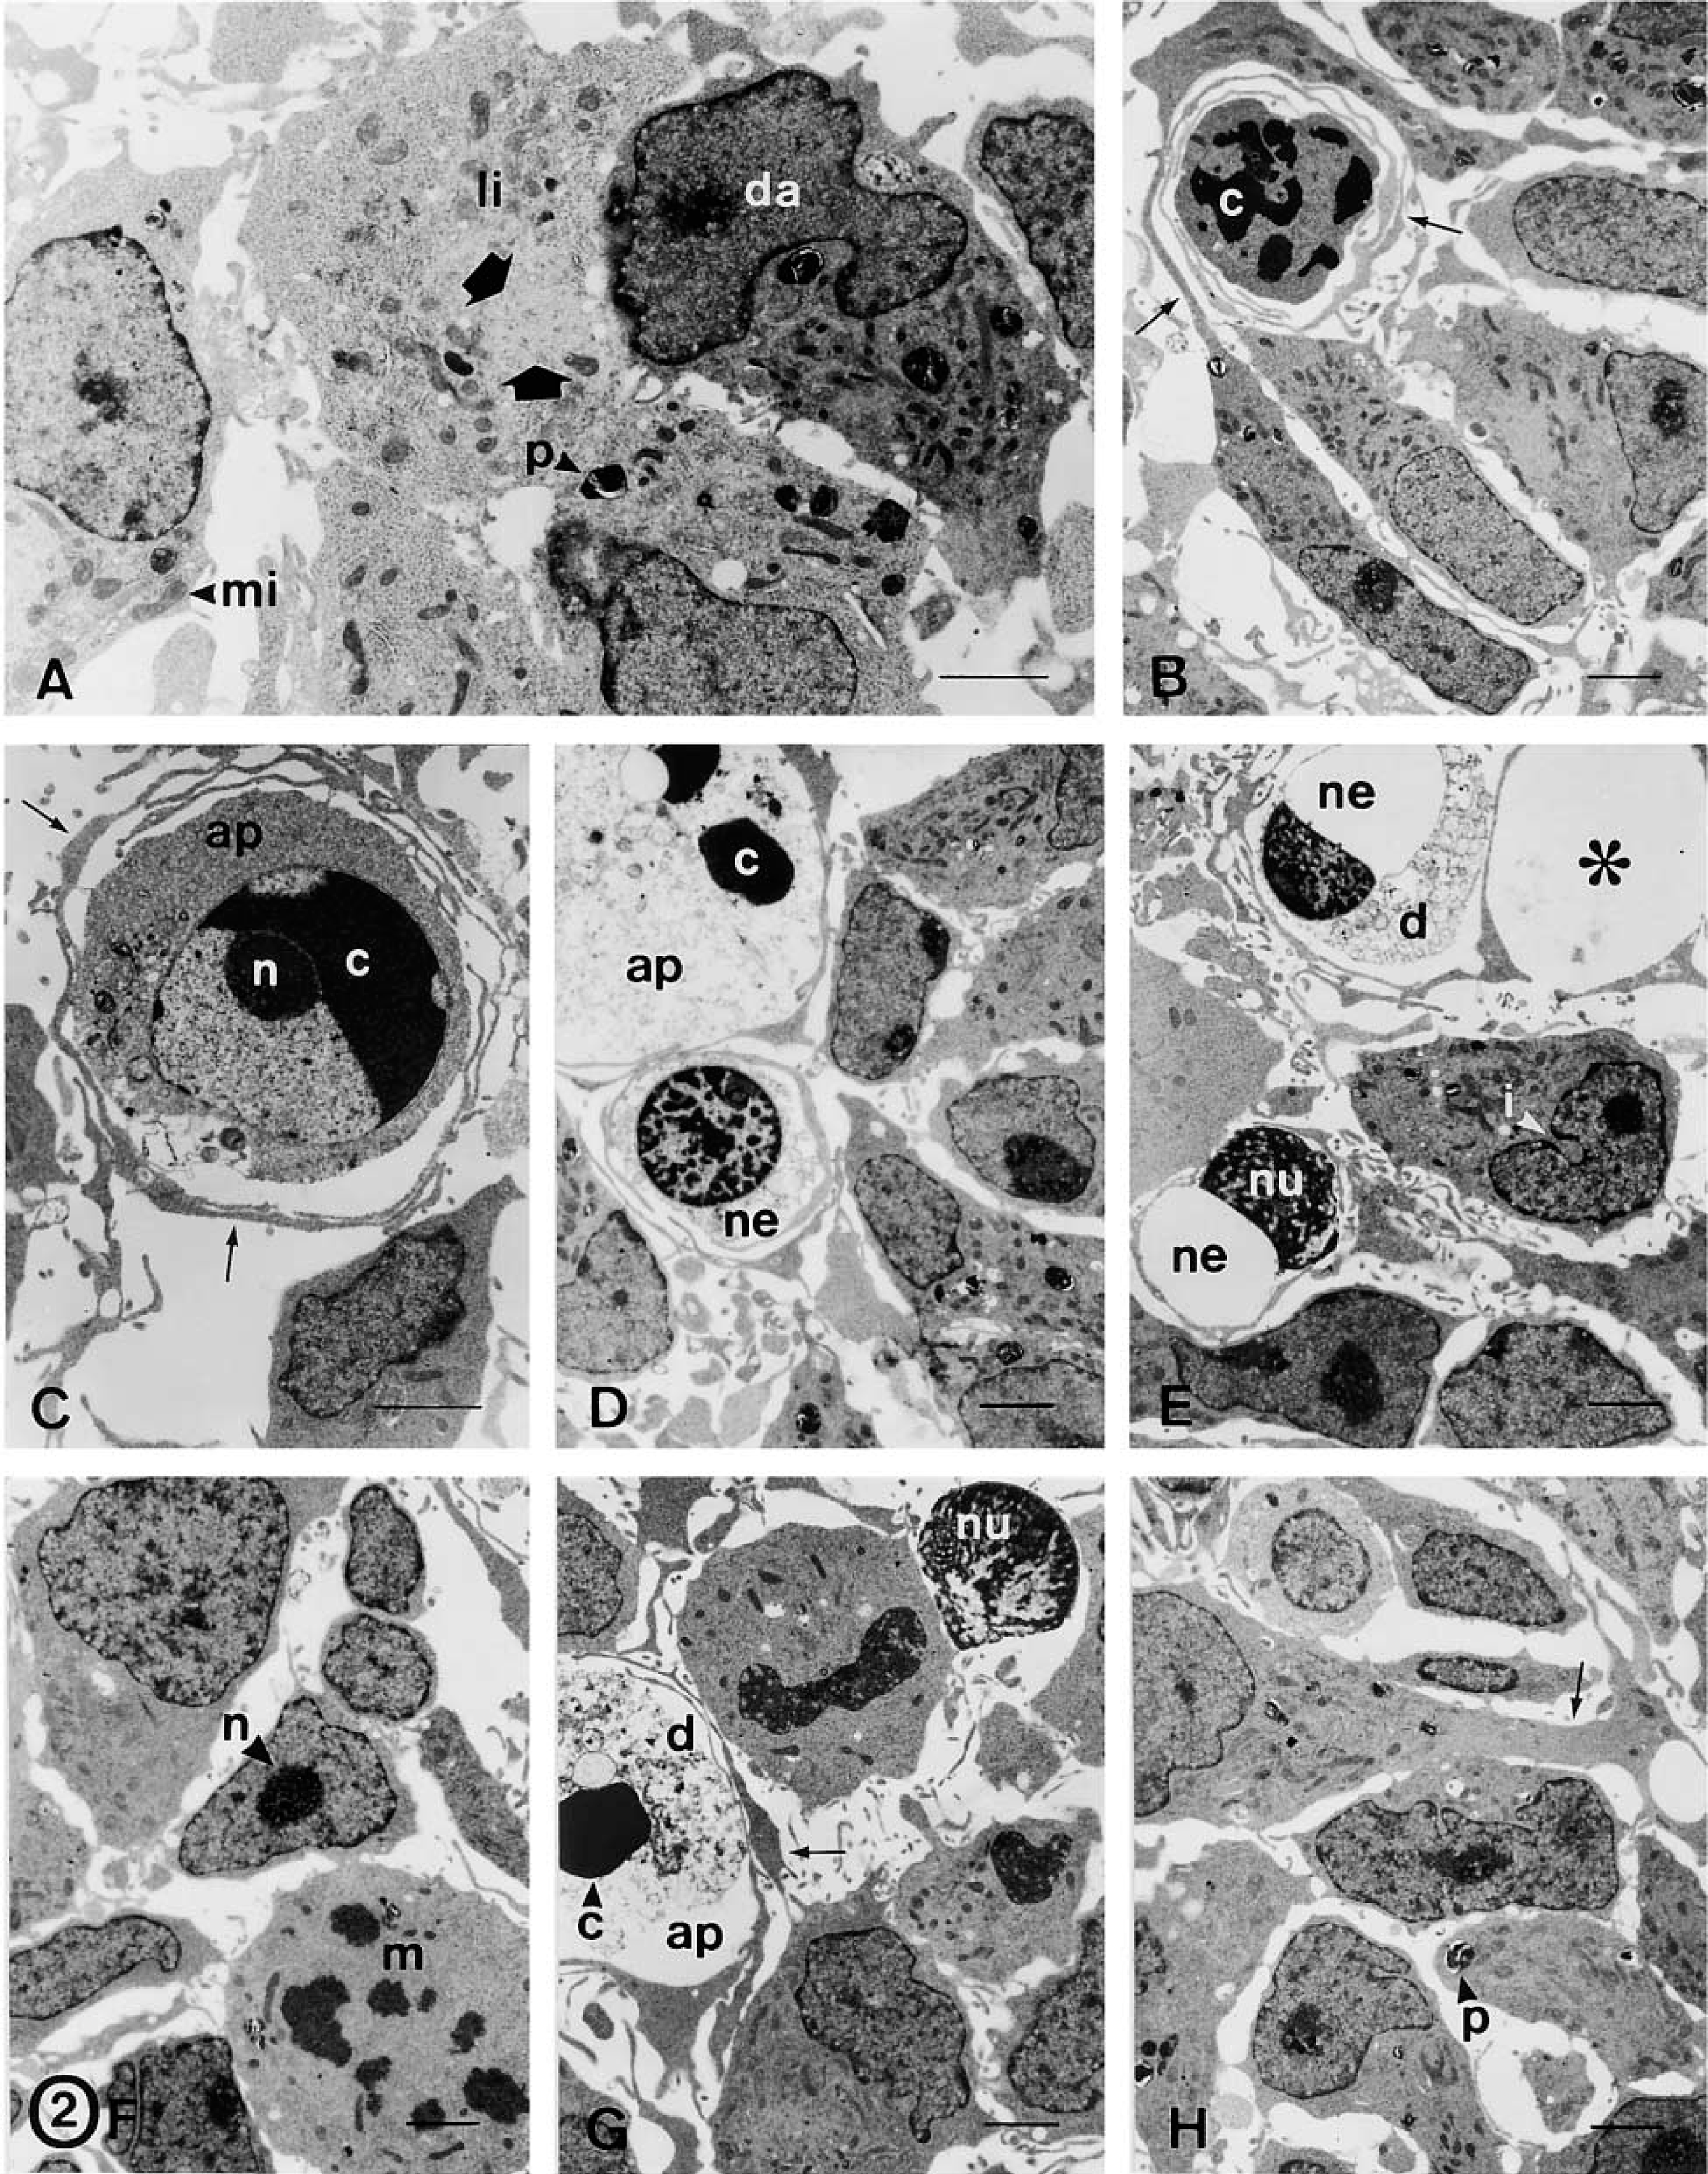
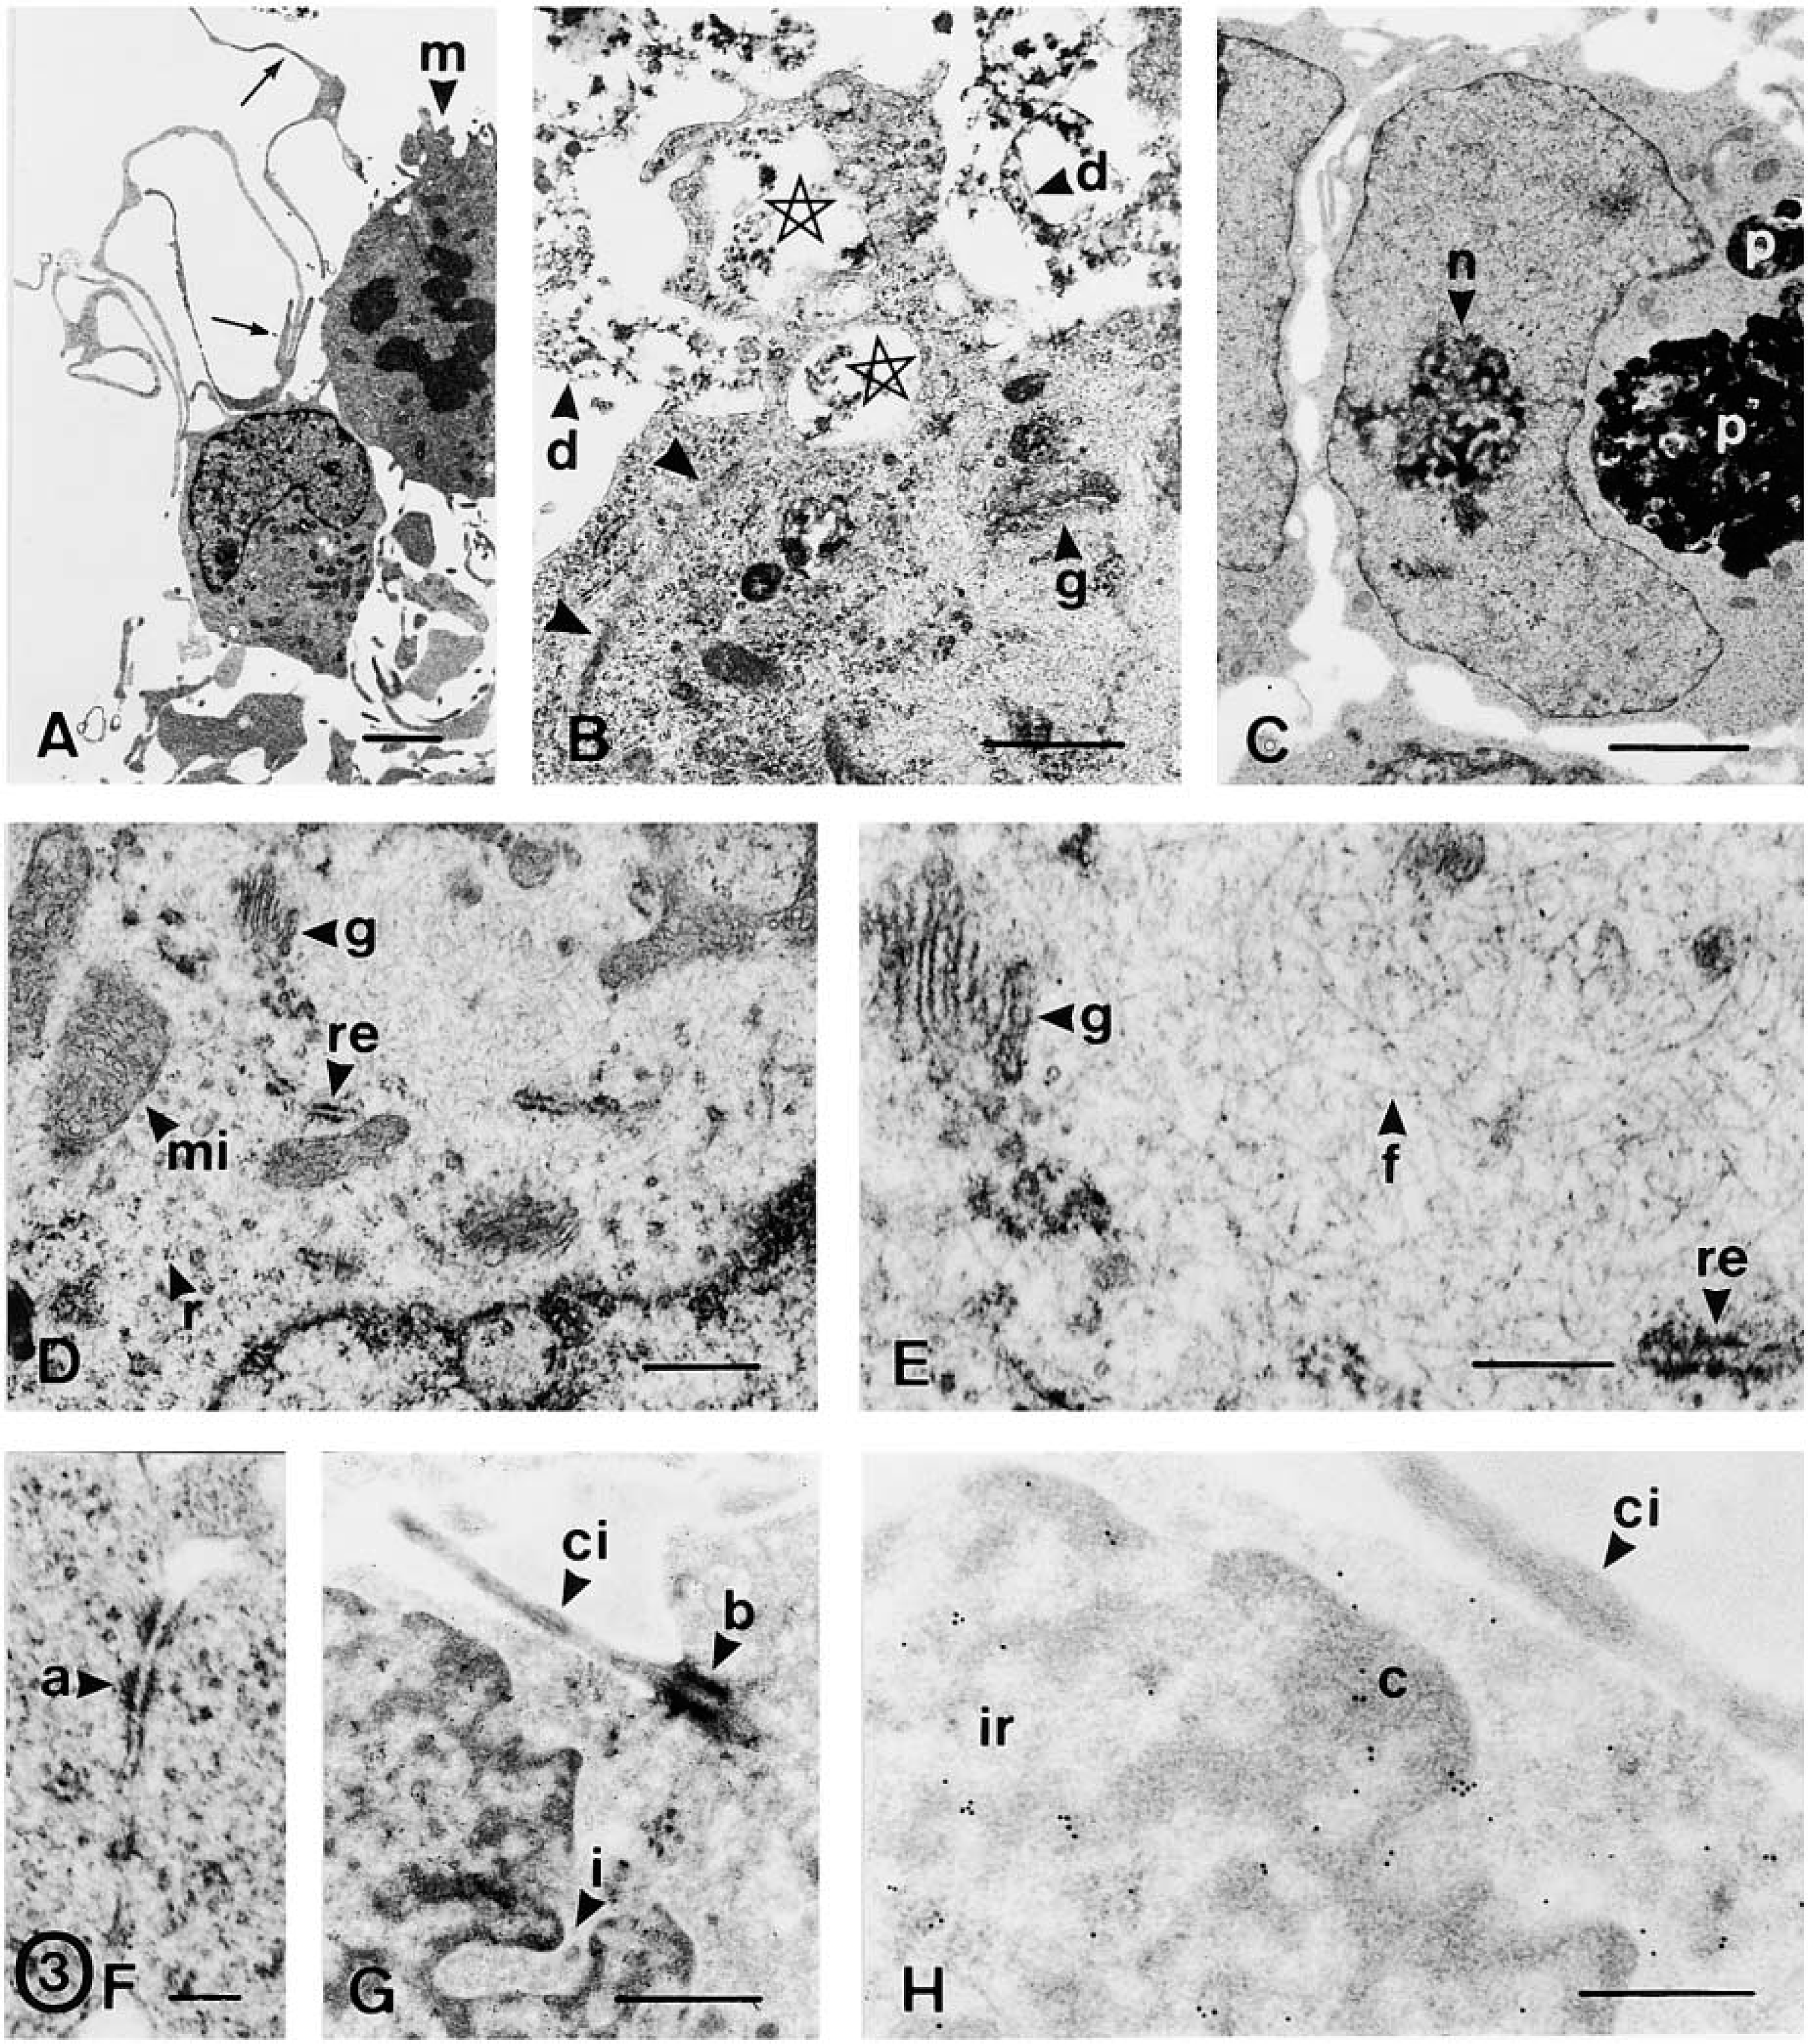
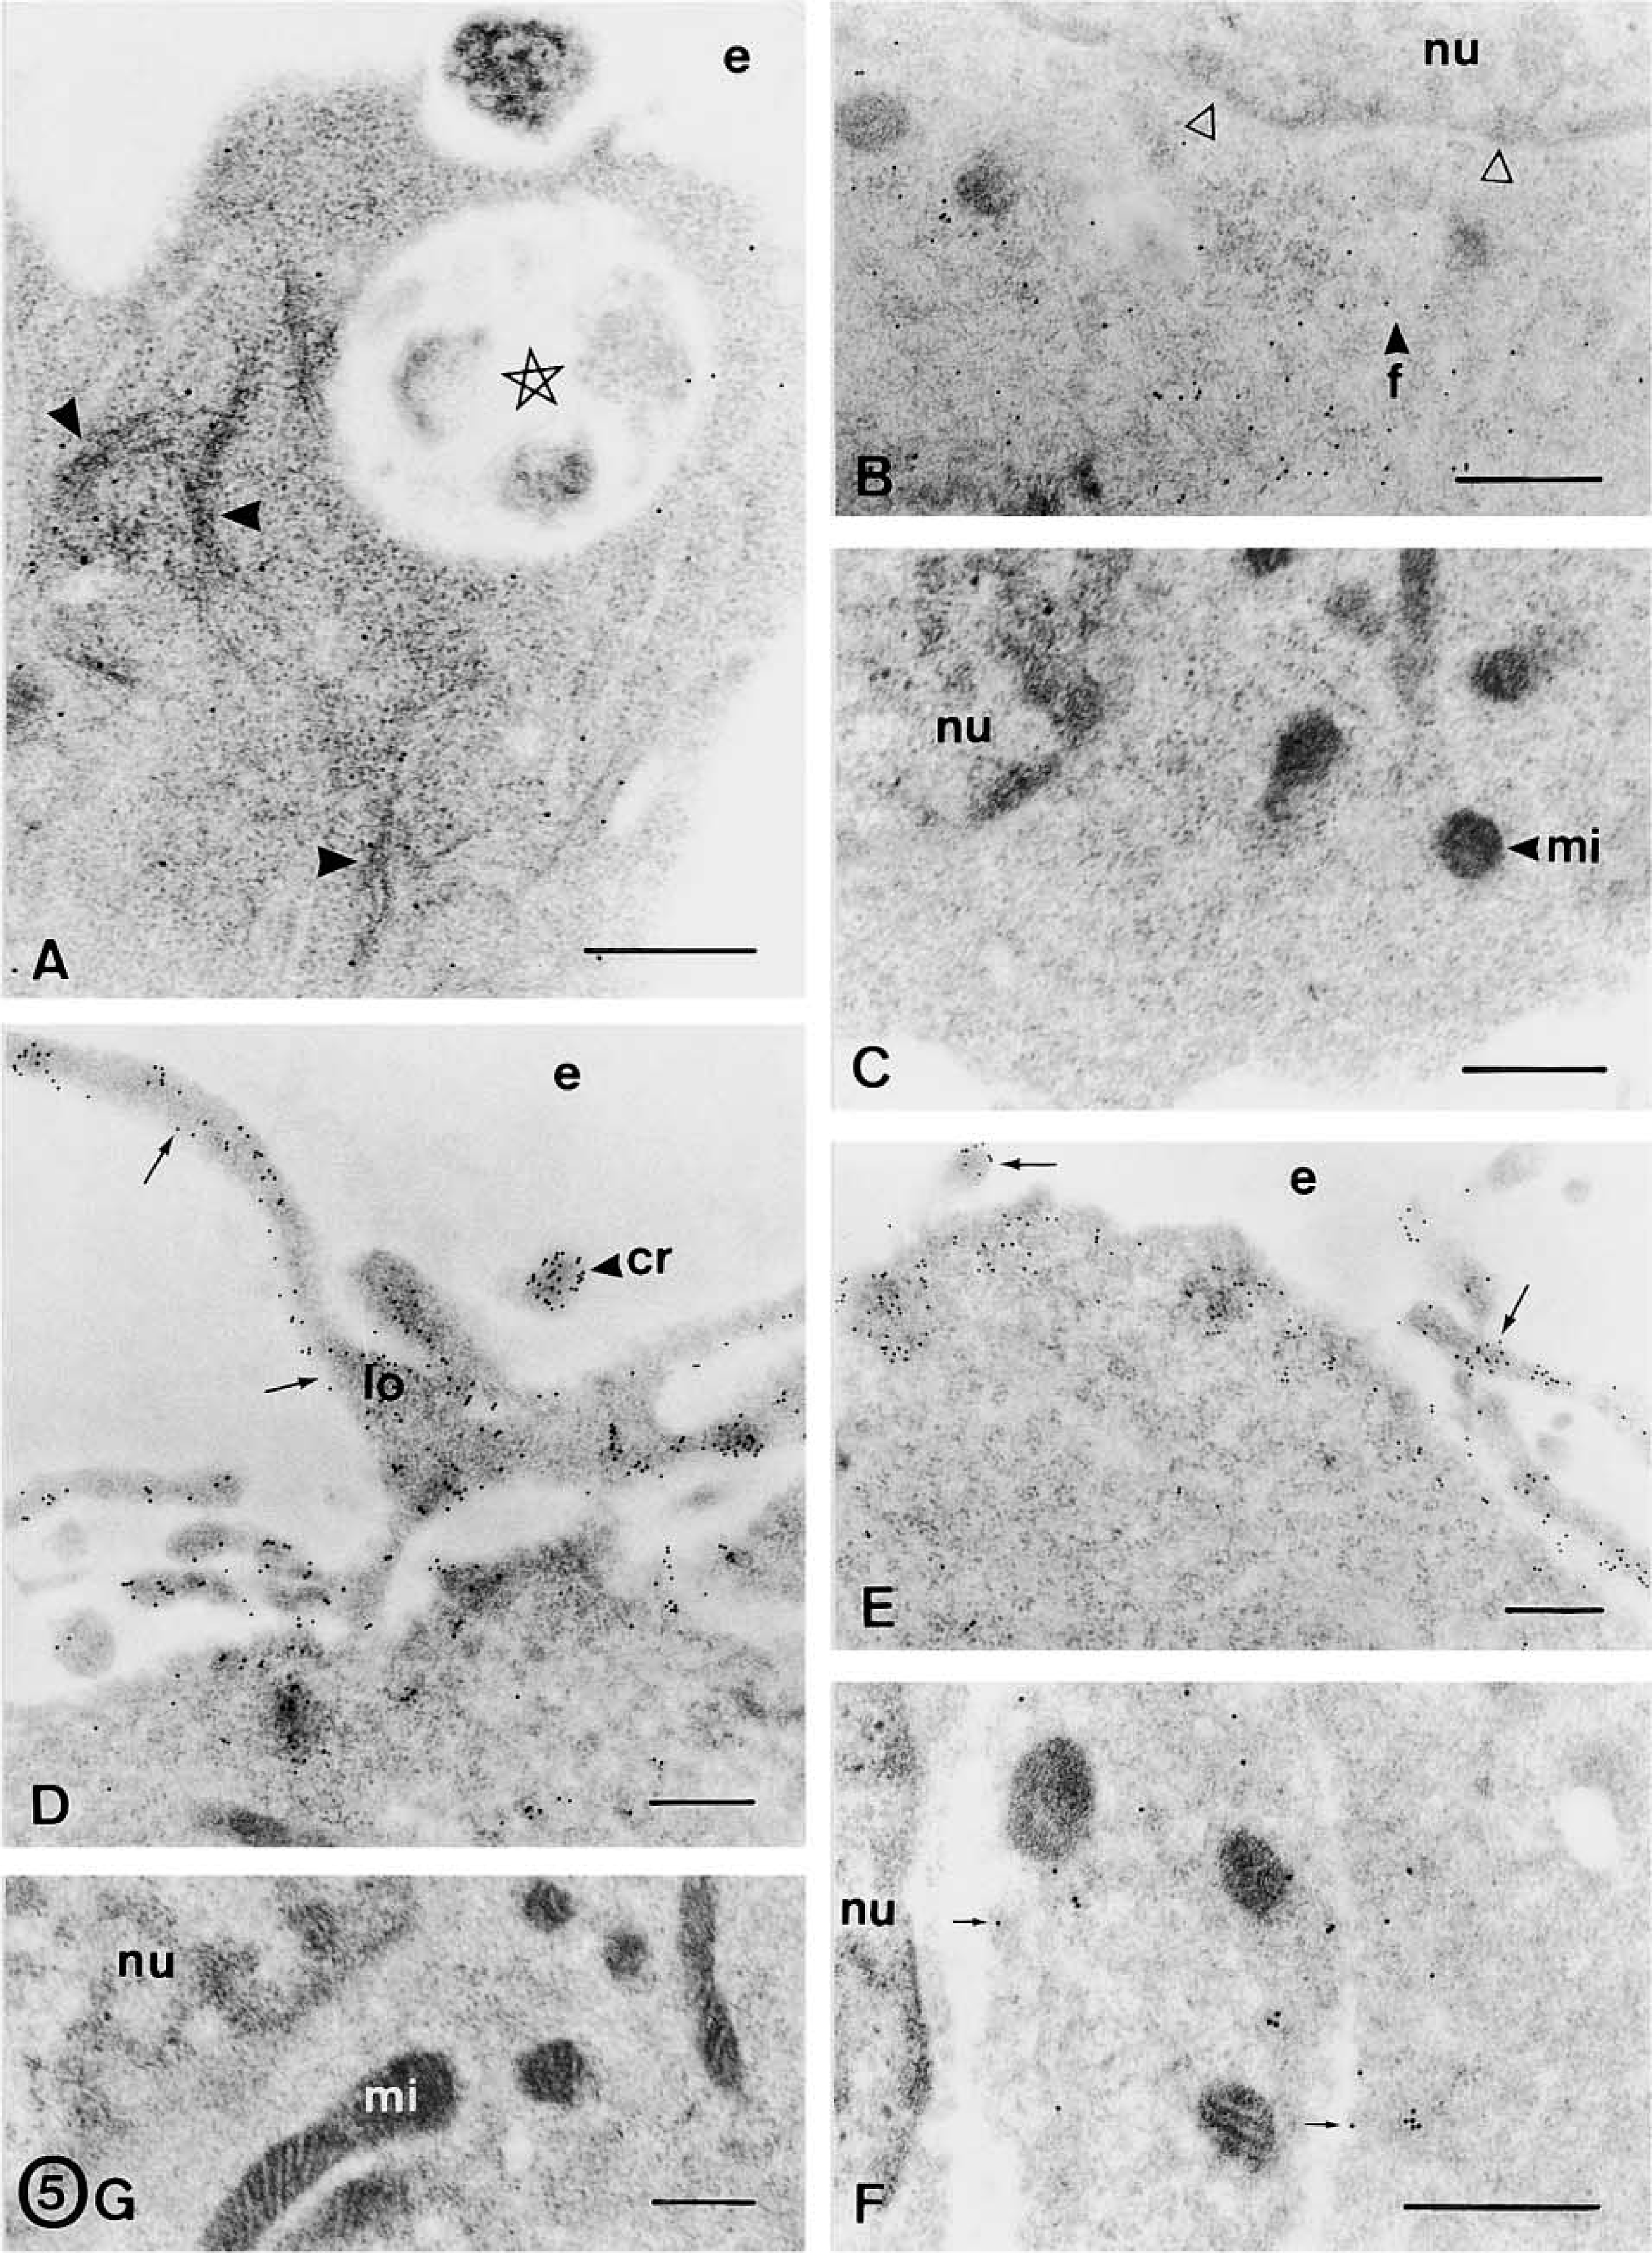
Free-floating spheres were EGF-expanded over six passages and characterized by conventional electron microscopy (Figures 2 and 3A–3F) and immunocytochemical methods (Figures 3G, 3H, 4, and 5). Floating neurospheres showed a round or oval morphology (Figure 1A) and were formed by a variable number of cells (between four or five and several hundred cells). Neurospheres had a noncompact cytoarchitecture with large intercellular spaces (Figures 1B and 2). Cells were randomly distributed within these aggregates, with no apparent organization. None of the cells we studied had ultrastructural features of neurons, glial, or ependymal cells. Although they showed a variable appearance in both morphology and size, two subpopulations of cells were distinguished: dark and light cells (Figure 2A). The proportion of both cell types varied in the different neurospheres. Light cells showed lower electron density and had larger mitochondria than dark cells (Figure 2A). Light cells also showed intermediate filaments (10–12 nm thick) that were randomly distributed (Figures 3D, 3E, and 4E) and arranged in bundles (Figures 3B and 5A), whereas dark cells did not have filament bundles. Light cells also showed cytoplasmic areas without ribosomes where many scattered filaments accumulated. These areas were surrounded by ribosomes, the Golgi complex, rough endoplasmic reticulum, and mitochondria (Figures 3D and 3E). Occasionally, electron-dense cells showed some scattered filaments, in lower amounts than light cells. All other ultrastructural features were similar for both cell types. Moreover, cells in the different stages of mitotic division (Figure 2F), in interphase (Figures 2A and 2H), and in the different phases of the apoptotic and necrotic processes (Figures 2B–2E) were observed. Healthy light and dark cells were irregularly shaped and contained many free ribosomes and mitochondria (Figure 2A). The rough and smooth endoplasmic reticula were moderately developed. The Golgi complex was located next to the nucleus and the Golgi stacks were small and included three to five cisternae (Figures 3D and 3E). Some of these cells showed centrioles and about 1–2% of the cells presented a single cilium (over 870 cells were examined). Each cilium (Figure 3G) consisted of the basal body, the ciliary roots, and the free part (about 2.1 μm long and 0.1–0.2 μm thick). Both coated and uncoated vesicles were often observed in these cells. They had large nuclei that frequently showed deep indentations of the nuclear envelope (Figure 2E). These nuclei exhibited a dispersed chromatin pattern with small aggregates of condensed chromatin masses along the nuclear envelope and in the form of inner patches (Figure 2). Light and dark cells had one or two large nucleoli, with a reticulated structural configuration (Figures 2F and 3C). Healthy cells were attached to each other by adherens junctions 64–120 nm in length (Figure 3F). At the adherens junctions, cell membranes ran parallel and were separated by a gap of 10–20 nm. These junctions showed a characteristic 10-nm-thick, electron-dense reinforcement at the cytoplasmic sides of the apposed plasma membranes (Figure 3F). Desmosomes, gap junctions, and tight junctions were not observed. No cell junctions were found between healthy cells and apoptotic/necrotic cells. With the light microscope and toluidine blue staining, neurosphere cells showed many pseudopodia or cilium-like structures (Figure 1C). With the electron microscope, these structures were identified as cell processes from healthy cells that spread through the intercellular space (Figure 3A). These processes showed a variable morphology both in width and length (compare the cell processes shown in Figures 2H and 3A). They usually contained ribosomes and cytoskeletal filaments. The thicker processes also contained mitochondria and rough endoplasmic reticulum (Figure 2H). Furthermore, apoptotic and necrotic cells were totally engulfed by cell processes of healthy cells (Figures 1D, 1E, and 2B–2E).
(
(
Because ultrastructural characterization remains the most reliable method for identifying apoptosis and necrosis, we analyzed the sequence of ultrastructural changes that accompany cell death in sphere cells (Figure 2). Early apoptosis was characterized by segregation and condensation of the chromatin in sharply delineated masses that abut on the nuclear envelope (Figures 2B and 2C). The increase in cytoplasmic electron density that usually accompanies apoptosis was not evident in apoptotic sphere cells (compare the apoptotic cell shown in Figure 2B with adjacent healthy cells). The later apoptotic phase, characterized by the formation of apoptotic bodies, was occasionally observed. Finally, apoptotic bodies were not phagocytosed by nearby cells. Instead, they underwent degenerative changes similar to those found in necrosis and to those described in apoptotic bodies that escape phagocytosis in tissues and cultures (Kerr et al. 1994). They showed organelle and membrane dissolution that gave rise to unrecognizable masses of cell debris (Figures 2D and 2G). Such degenerated apoptotic bodies were distinguished from cells that had undergone necrosis because some apoptotic-type chromatin masses were still recognizable within them (Figures 2D and 2G). Early necrosis was characterized by the presence of swollen mitochondria, focal disruption of membranes, and clumping of chromatin without marked changes in its distribution. At a later stage, the swollen necrotic cells showed typical organelle and membrane dissolution (Figures 2D and 2E). As described above, early apoptotic and necrotic cells were always surrounded by cell processes of healthy cells, which formed a nest-like structure around each dying cell (Figures 2B and 2C). Therefore, all the ultrastructural changes of apoptotic and necrotic cells occurred within these structures. The cell fragments and cell debris derived from cell death were confined to these structures and phagocytosed by nearby cells. In this sense, phagosomes in the different stages of the phagocytosis process (Figures 3B and 5A), lysosome-like structures, and partly degraded phagocytosed fragments (Figure 3C) were frequently observed in healthy cells. Some empty nests were also observed (Figure 2E), suggesting degradation and/or phagocytosis of the cells that should occupy these structures. Moreover, some free necrotic nuclei were observed outside these nest-like structures (Figure 2G).
Expression of Growth Factors and Their Receptors
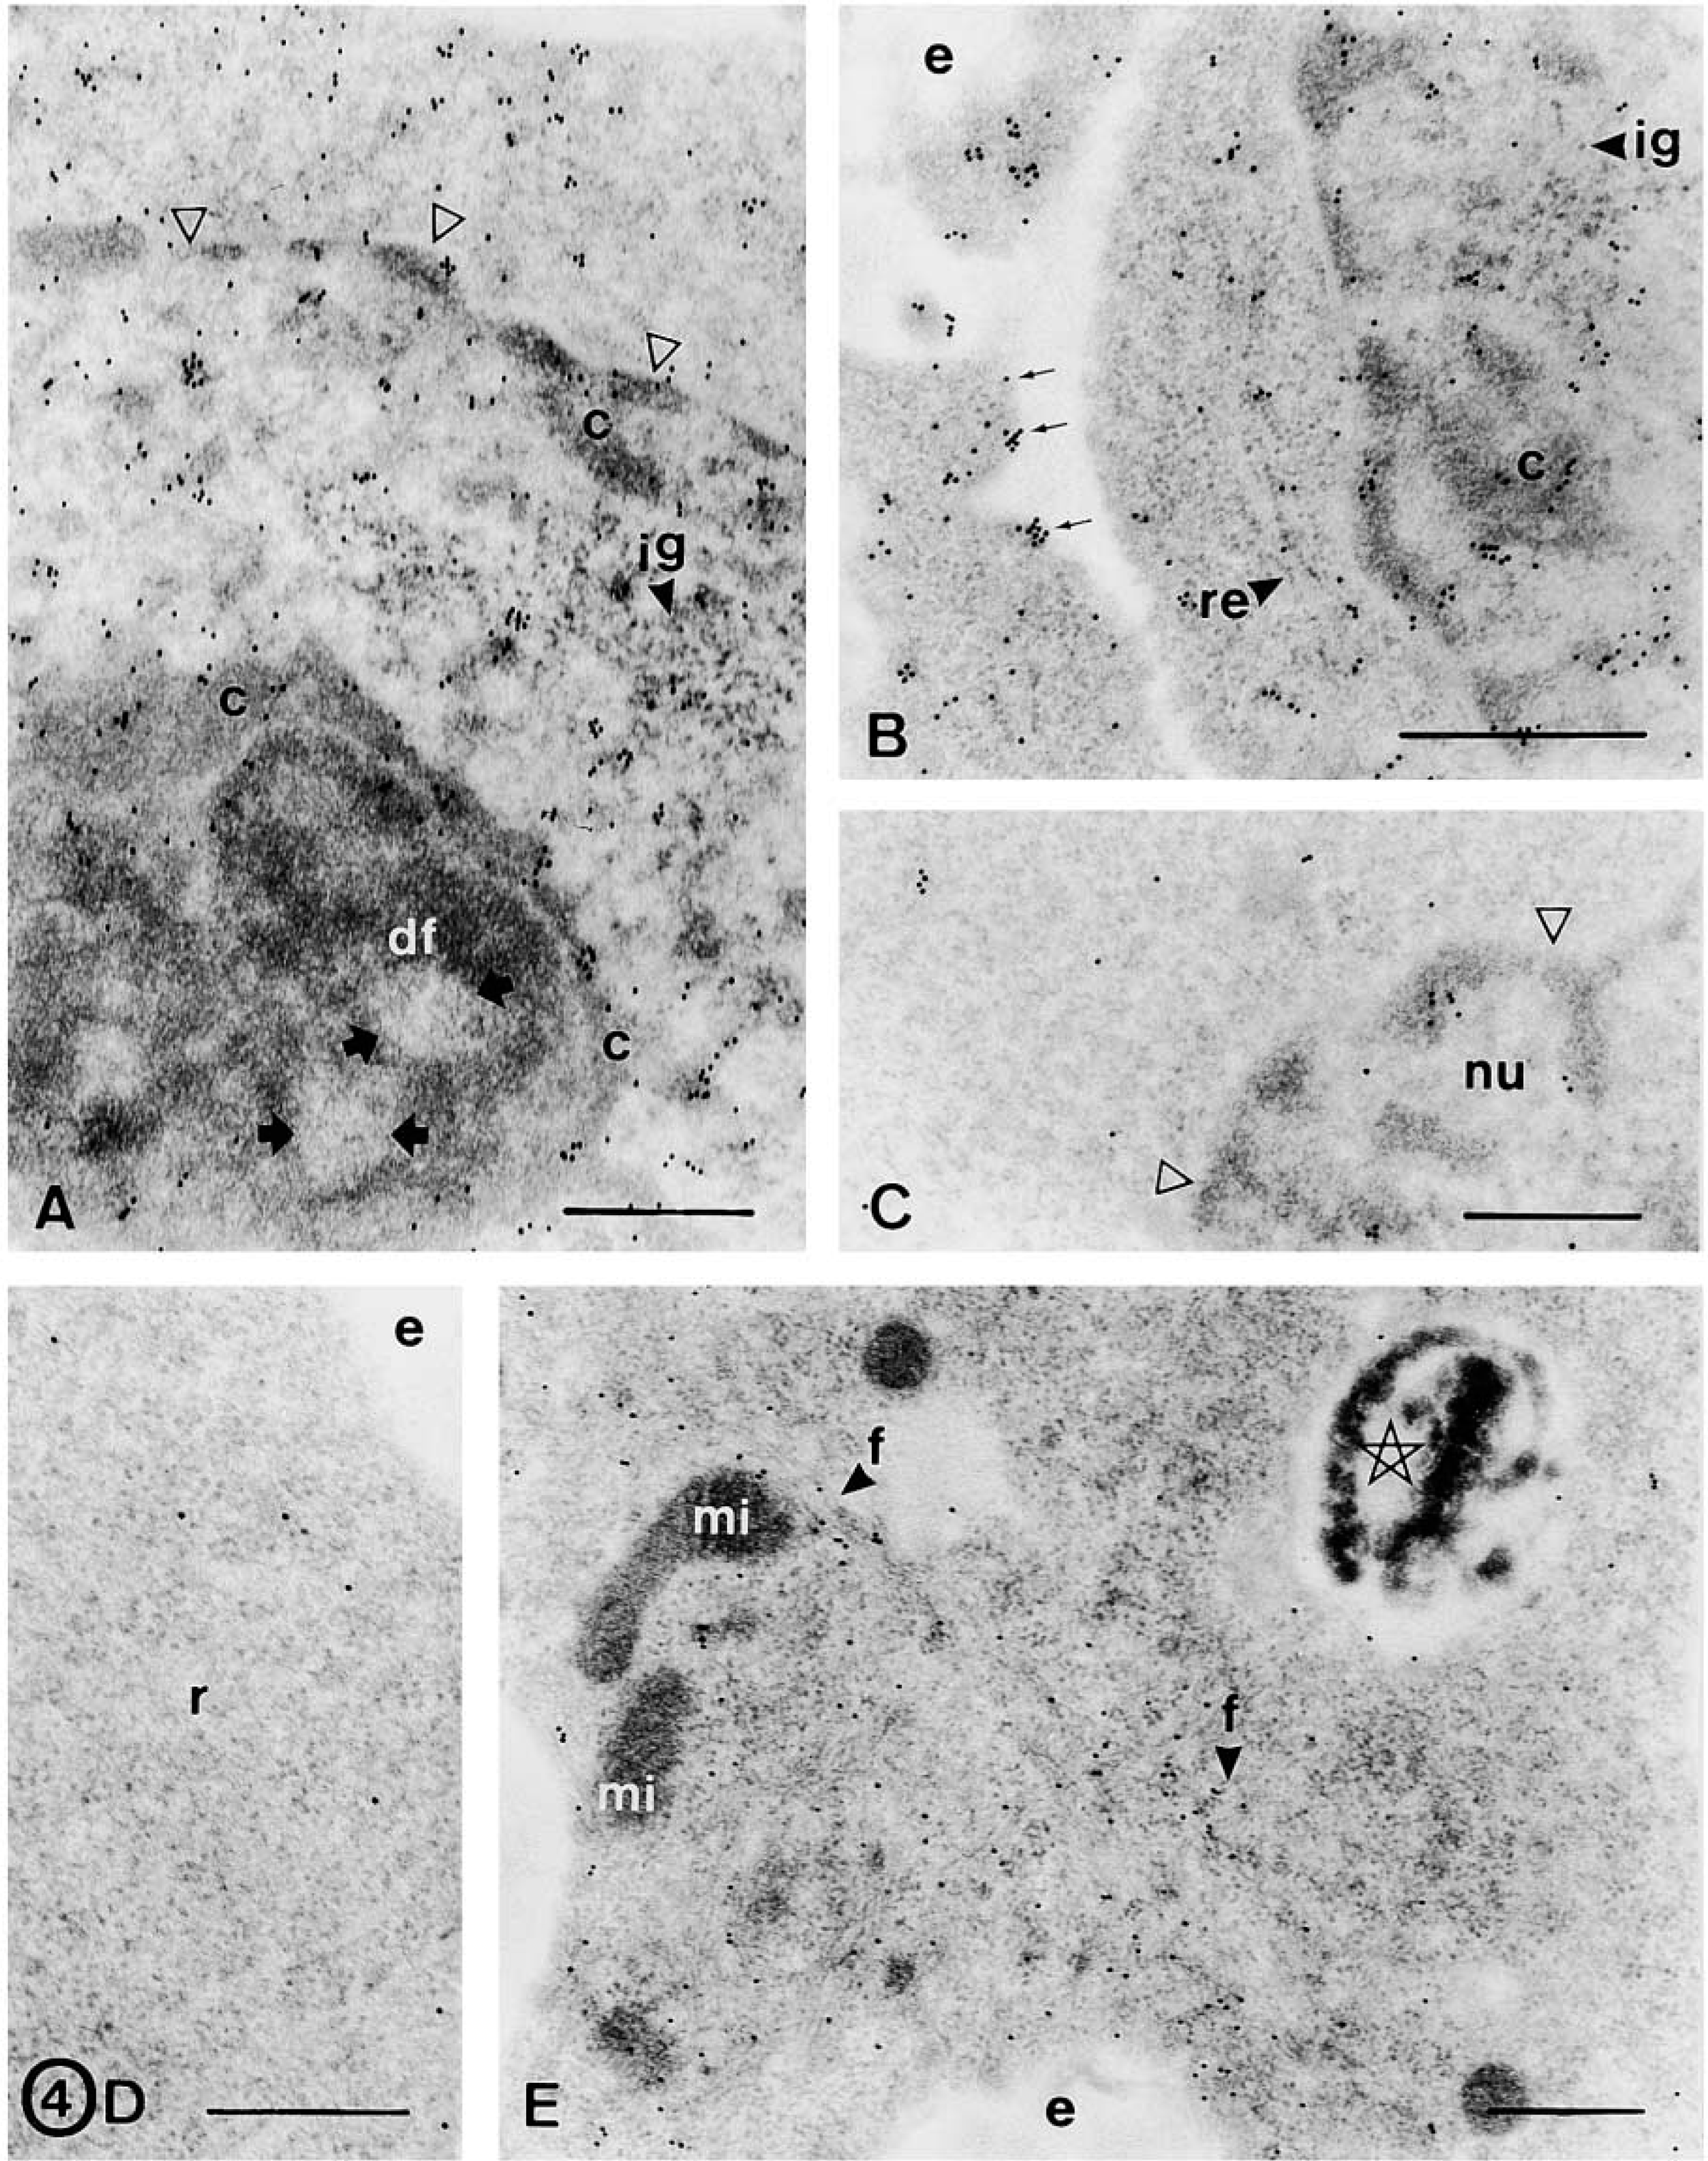
FGF-2 is a heparin-binding polypeptide that exerts mitogenic effects on stem cells and functions through FGFRs with intrinsic tyrosine kinase activity. We have previously studied the expression of FGFR-1, −2, and −3 in the progeny of neural stem cells (Reimers et al. 2001). Here, we studied whether EGF-expanded neurospheres also express these receptors. The results of the immunogold assays showed that sphere cells were intensely immunostained for FGFR-1 (Figures 3G and 3H) and FGFR-2 (Figures 4A and 4B) and weakly immunoreactive for FGFR-3 (Figure 4C). No subpopulations of cells were distinguished using these antibodies. All receptors (FGFR-1, −2, and −3) were localized in the nucleus and cytoplasm of healthy cells. In the nucleus, gold particles were observed in the chromatin masses (mainly in the periphery of the heterochromatin) and in the interchromatin region (Figures 3H and 4A–4C). In the nucleolus, gold particles were found in the nucleolus-associated chromatin, whereas the dense fibrillar component, the granular component, and the fibrillar centers were unstained (Figure 4A). Cytoplasmic receptors were localized adjacent to and over the plasma membrane (both as isolated particles and as clusters of gold particles), in relation to the rough endoplasmic reticulum, and at random in the cytoplasm (Figure 4B). Apoptotic and necrotic cells were weakly stained for these antibodies.
As a consequence of alternative mRNA splicing, a number of FGFR isoforms have been described for FGFR-1, −2, and −3, which are specific for each tissue or cell type (Bernard et al. 1991; Tannheimer et al. 2000). Subsequently, Western blotting experiments were carried out to analyze the forms of these receptors expressed in floating spheres compared with cultures at 3 dpp (Figure 6). The FGFR-1 antiserum recognized two strongly immunostained bands of approximately 140 and 45 kD and a weak band of 40 kD in spheres. This antiserum recognized two predominant bands of approximately 150 and 40 kD and weak bands of 120, 110, 74, 54, and 45 kD in cell cultures at 3 dpp. The anti-FGFR-2 antibody recognized bands with apparent molecular weights of 120, 80, 54, 48, 45, and 38 kD in neurospheres and bands of 120, 80, 60, and 55 kD in cultures at 3 dpp. The FGFR-3 antiserum recognized weak bands of 70 and 55 kD in floating spheres and in cells at 3 dpp. To analyze the results obtained, it should be considered that these antibodies were raised against peptides encoding the carboxy terminus of the precursor forms of human FGFR-1, −2, and −3, that they recognize several bands by immunoblotting, and that the molecular weights obtained were in accordance with those previously reported for individual FGFRs or their variants, such as underglycosylated forms of the receptors (Partanen et al. 1990; Bernard et al. 1991; Keegan et al. 1991; Tannheimer et al. 2000). The anti-EGFR antibody recognized a single band at the corresponding molecular weight of 170 kD in both lysates (Figure 6). Although growth factor receptors are generally believed to carry out their role in signal transduction at the cell surface, many of these proteins translocate to the nucleus after ligand stimulation. Therefore, the high levels of expression of FGFRs and their nuclear localization in sphere cells prompted us to analyze whether EGF-expanded neurospheres express FGF-2. With the anti-FGF-2 antibody, Western blotting analyses revealed a single band of approximately 22–24 kD in floating spheres and in cultures at 3 dpp, but we did not find the 18-kD form of this factor (Figure 6). Moreover, the antibodies to TGF-α and -β, and to TNF-α did not recognize any band in both lysates (not shown).
(
Expression of Cytoskeletal Components and Cell-specific Markers
The electron microscopic study revealed that sphere cells were immunonegative for neuronal (β-tubulin III, NeuN) and astrocyte (GFAP) markers (not shown), and immunopositive for vimentin. However, dark cells differ from light cells in the intensity of the immunoreaction to vimentin and in the distribution of this cytoskeletal protein. In this sense, dark cells showed a weak immunoreaction that was randomly distributed through the cytoplasm (Figure 4D) and light cells showed an intense vimentin immunoreaction that was found in scattered filaments (Figure 4E) and in filament bundles (Figure 5A). Surprisingly, light cells were immunostained for nestin (Figure 5B), whereas dark cells were immunonegative (Figure 5C). In light cells, nestin was mainly found in scattered short filaments and at random in the cytoplasm (Figure 5B). Both cell types were immunoreactive for actin that was mainly distributed in cytoplasmic processes and all along the cell periphery, adjacent to the plasma membrane (Figures 5D and 5E). No dark cell was stained for A2B5, and a small proportion of light cells (about 1–2%) showed a weak immunoreaction to A2B5. In these cells, some isolated gold particles were found in the plasma membrane and in the adjacent cytoplasm (Figure 5F).
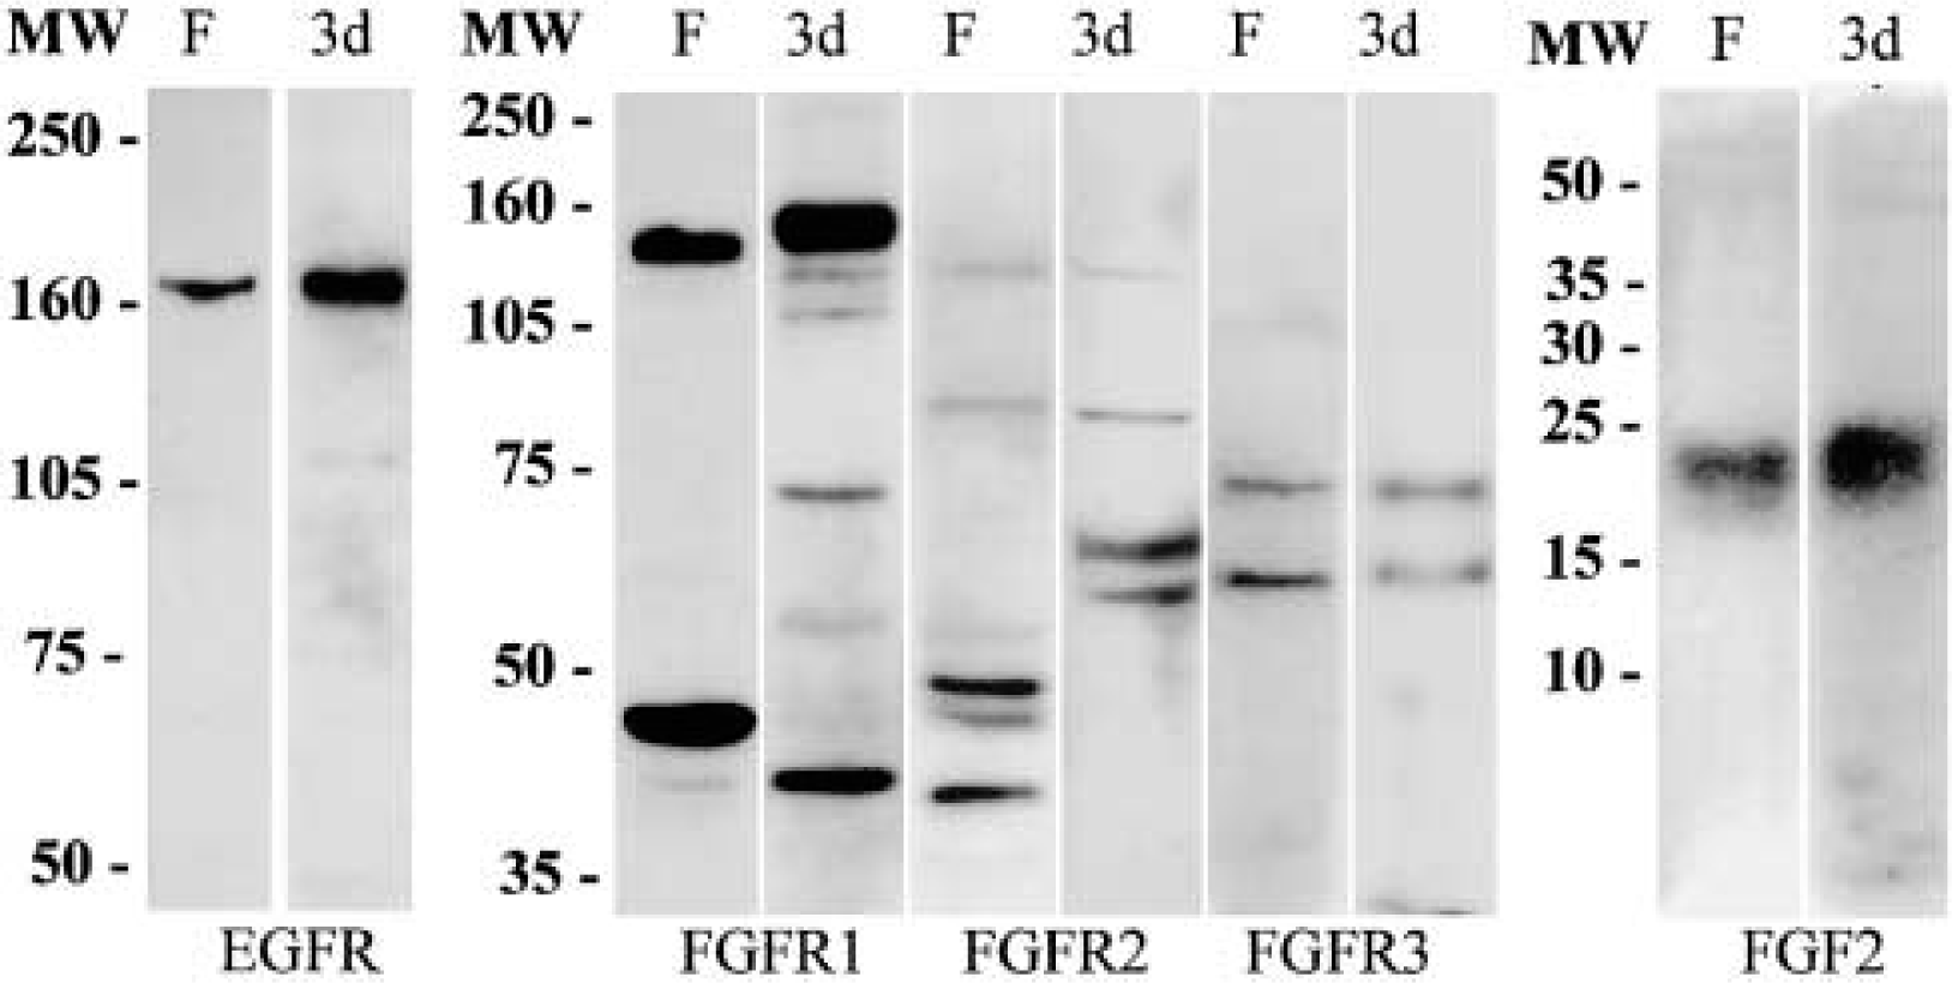
Immunoblotting analysis of EGFR, FGFRs, and FGF-2 in floating neurospheres (F) and in cultures at 3 days post plating (3d) after 6% (for EGFR), 9% (for FGFRs), and 15% (for FGF-2) SDS-polyacrylamide gel electrophoresis. MW, molecular weight.
No immunostaining appeared in negative controls (Figure 5G). For all the antibodies, background staining was very low. Therefore, the labeling density in the resin outside the cell, in mitochondria, and in the cell nuclei for the antibodies against cytoskeletal proteins was extremely low in all cases (Figures 3G, 3H, 4, and 5).
The results of Western blotting analyses (Figure 7) showed a single band at the corresponding molecular weight of 45 kD for actin in both lysates (spheres and cultures at 3 dpp). The anti-vimentin antibody recognized a band of 55 kD in both lysates and a weak band of lower molecular weight in cells at 3 dpp (Figure 7). Immunoblotting analyses were able to detect low levels of GFAP in floating spheres and higher levels in cultures at 3 dpp (Figure 7). These results indicate that GFAP may be present in some neurosphere cells but at low levels that are undetectable by immunocytochemistry. The anti-nestin antibody recognized bands of 240 and 220 kD in neurospheres and in cultures at 3 dpp (Figure 7). The anti-NeuN antibody did not stain any band in neurospheres, but it recognized two bands of approximately 48 and 60 kD in cultures at 3 dpp (Figure 7). No immunoreactive bands for smooth muscle α-actin and desmin were observed in both lysates (not shown).
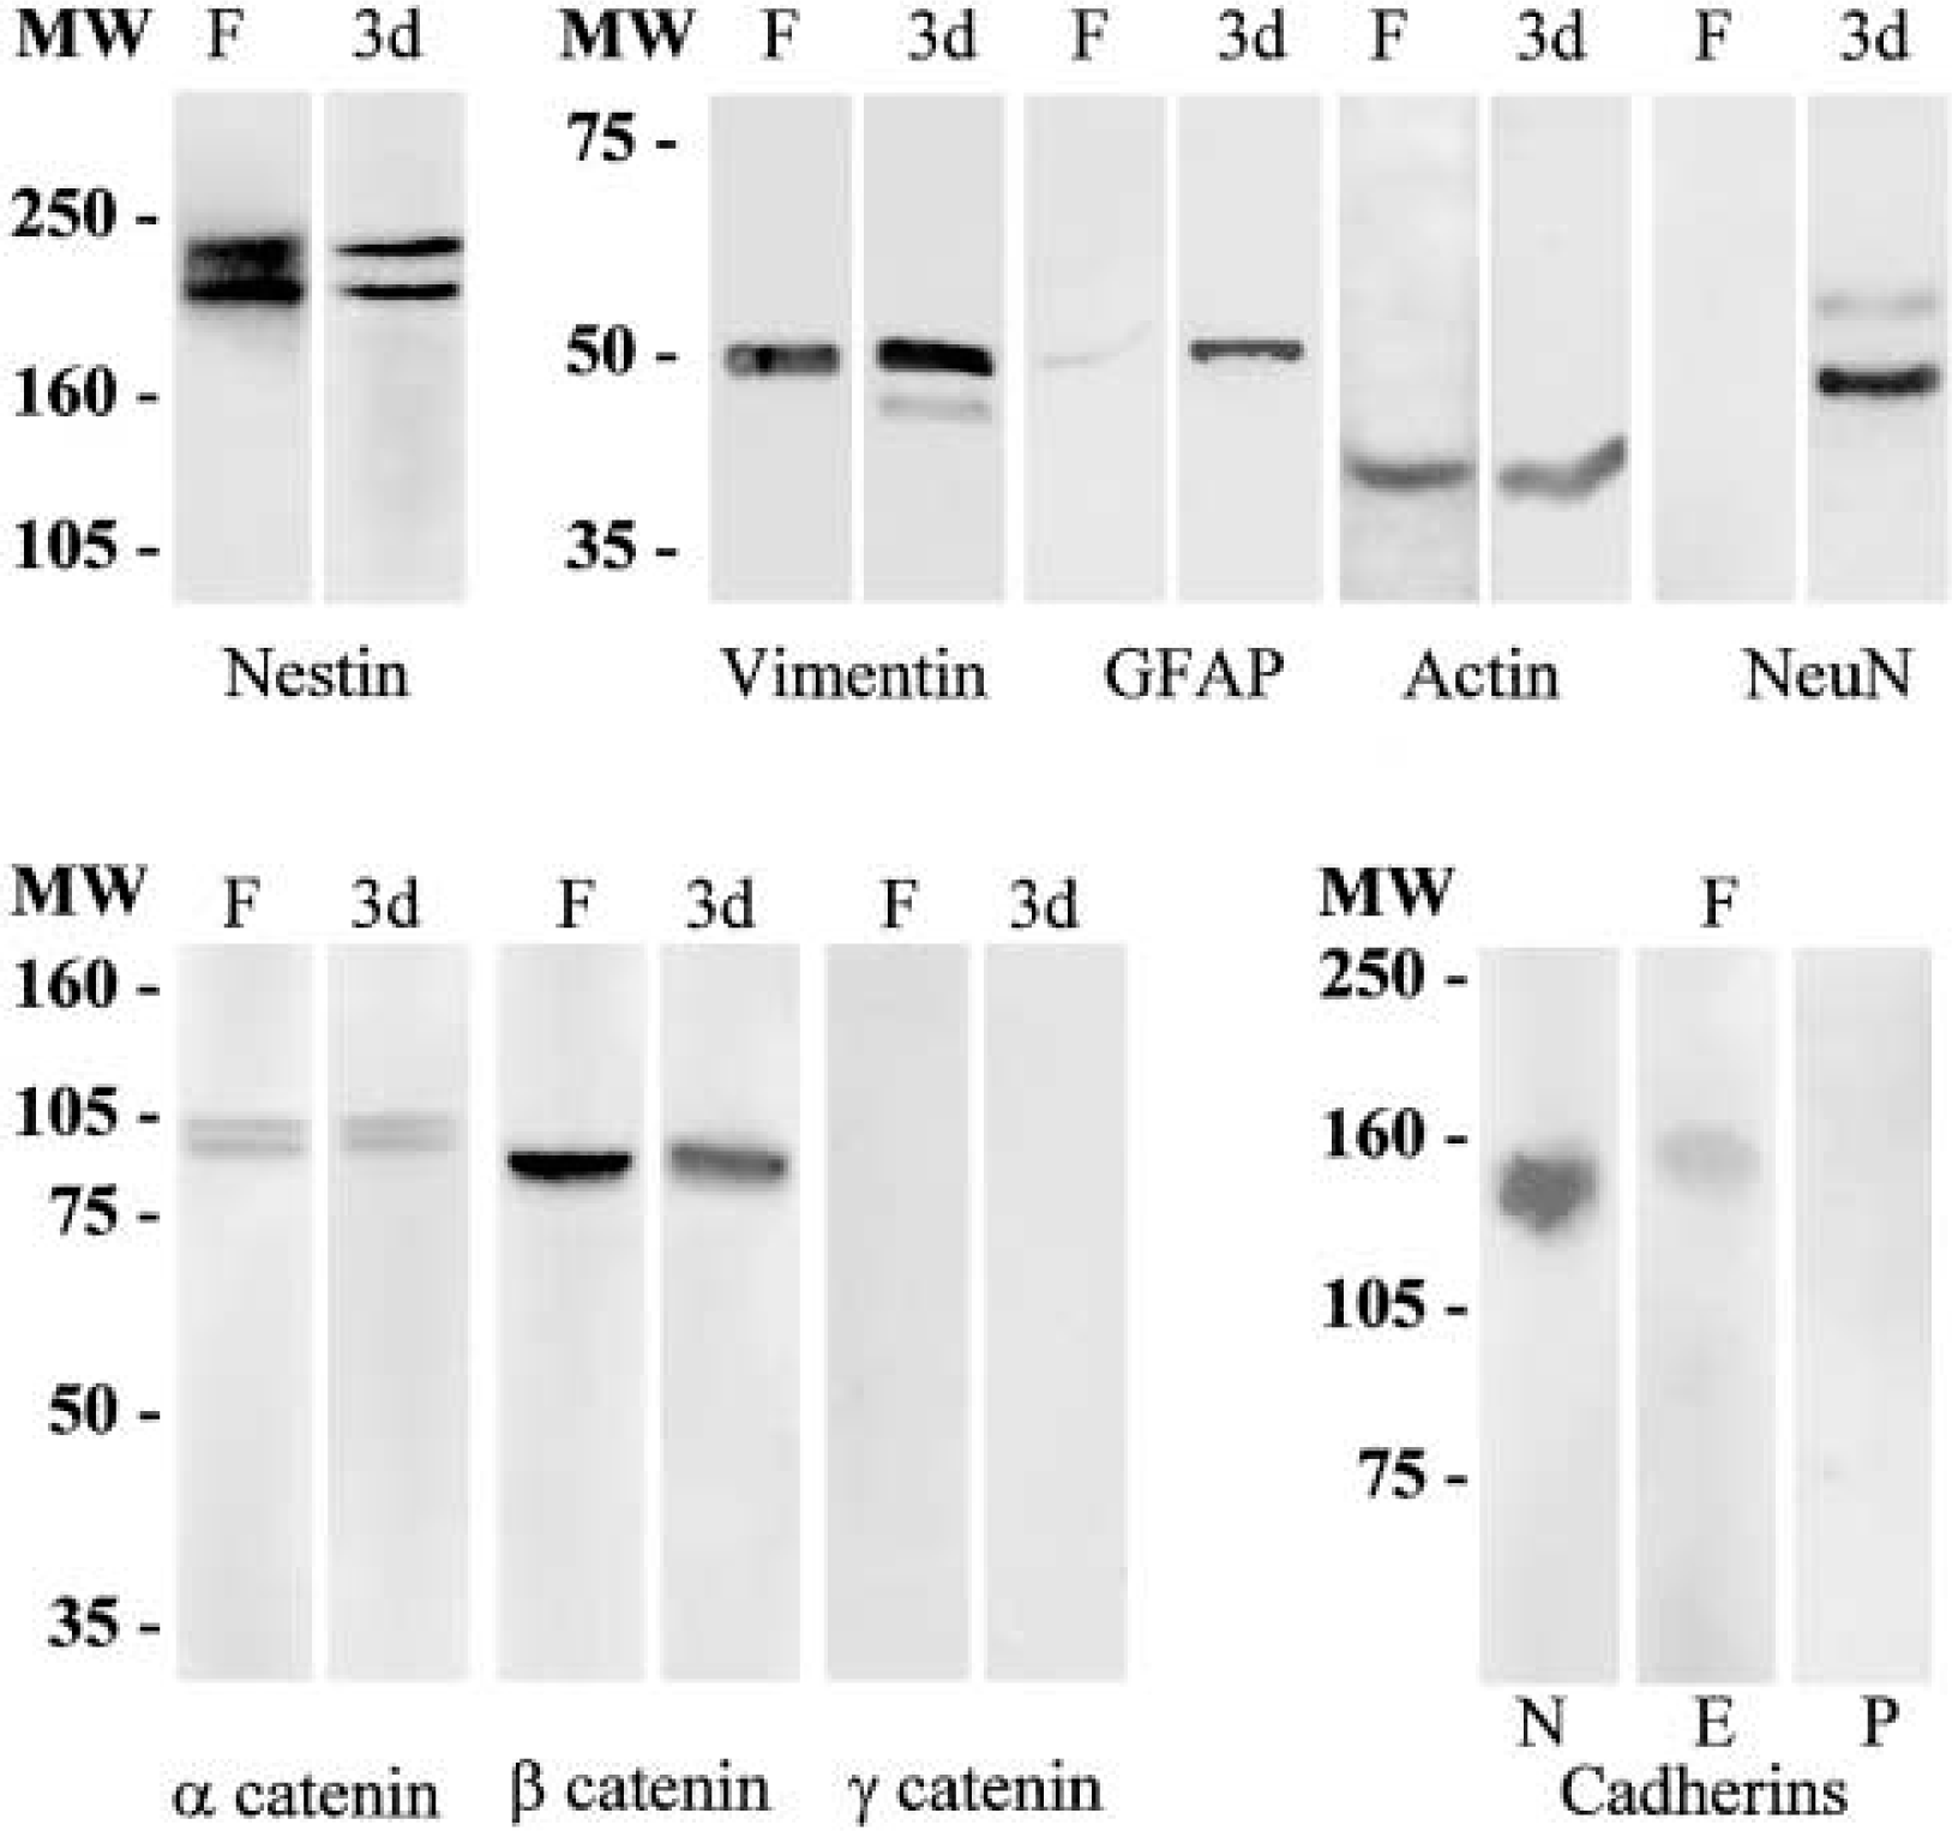
Western blotting analysis of cytoskeletal proteins, cell-specific markers, and adhesion molecules in floating spheres (F) and in cultures at 3 days post plating (3d) after 6% (for nestin and cadherins) and 9% (for vimentin, GFAP, actin, NeuN, and catenins) SDS-polyacrylamide gel electrophoresis. MW, molecular weight.
Expression of Cell Adhesion Molecules
Homotypic cell-cell adhesion molecules (which hold cells of the same type together) can be divided into two main groups: (a) the immunoglobulin superfamily, showing calcium-independent cell-cell adhesion, and (b) the calcium-dependent cadherin superfamily (Edelman and Crossin 1991; Geiger and Ayalon 1992). To address whether Ca2+-dependent or Ca2+-independent adhesion molecules mainly mediate the self-adherent properties of neurosphere cells, some cultures were treated with the Ca2+ chelator EDTA. In all cultures treated with 2 mM EDTA, neurospheres were dispersed into isolated cells. We then examined the possible expression of classical cadherins (which include E-, N-, and P-cadherin) and α-, β, and γ-catenin in floating spheres and in cultures at 3 dpp. Cadherins are transmembrane adhesion receptors localized in specialized cell-to-cell adhesion sites, such as adherens junctions, and catenins are a group of intracellular proteins that link the cadherin molecules to the actin microfilaments. A representative Western blot of adhesion molecules is shown in Figure 7. The antibodies recognized bands at approximately 120, 138, 102, and 92 kD for E- and N-cadherin, α- and β-catenin, respectively, in floating spheres (Figure 7) and in cell cultures at 3 dpp (not shown). No bands were observed for P-cadherin and γ-catenin in both lysates (Figure 7). The results obtained in both lysates (floating spheres and cultures at 3 dpp) demonstrated that the levels of β-catenin were higher than those of α-catenin.
Discussion
The ultrastructural appearance of the cells accurately reflects their physiological state. For example, neurons with a high metabolic activity have large nucleoli with a reticulated structural configuration, whereas neuronal cell types with low protein synthesis activity, such as cerebellar granule cells, show micronucleoli with a ring-shaped configuration (Hadjiolov 1985). Cultured sphere cells are very active in synthesizing proteins, as revealed by their high amount of ribosomes, their dispersed chromatin pattern, and the reticulated structural configuration of their nucleoli. In addition, some sphere cells had a single cilium. Although these cilia have not been previously described in neurosphere cells, such cilia are typical of early neural precursors and their roles are still unknown (Doetsch et al. 1999b). Moreover, it has been suggested that ependymal cells (Johansson et al. 1999) or astrocytes (Doetsch et al. 1999a; Laywell et al. 2000; Seri et al. 2001) are the source of the multipotent adult neural stem cells (reviewed in Gritti et al. 2002). In this context, it has been shown that ependymal cells are capable of forming spherical clones and that some of the cells within these spheres maintain the ependymal phenotype as indicated by extensive ciliation, although they are unipotent and give rise only to cells within the glial cell lineage (Laywell et al. 2000). In the cultures of fetal neurosphere cells, we have not observed this ependymal phenotype characterized by the presence of multiple cilia (40–50 per cell). However, because our study characterizes fetal sphere cells, we cannot enter into a discussion about the origin of adult neural stem cells. It should be considered that although the stem cells isolated from different tissues or species share common features, they also show important differences.
Cell cultures isolated from the adult mouse brain and treated with mercaptoethanol, which inhibits cell-cell contact, yield two types of neurospheres: I and II (Kukekov et al. 1997). Under phase microscopy, type I spheres are phase-dark. Ultrastructurally, they consist of rings of electron-dense, tightly apposed cells that surround a core of flocculent material. Early type I spheres are immunonegative to nestin, GFAP, β-tubulin III, and L1 adhesion molecule. They progress through a phase-dark nestin-negative state and then through a phase-dark nestin-positive state, and finally they become phase-bright type II spheres. Type II spheres are immunopositive for nestin, consist of less electron-dense cells than type I spheres, and give rise to neurons and glia (Kukekov et al. 1997). Thus, Kukekov et al. (1997) concluded that using contact-limiting reagents they identify two types of stem cells: a nestin-negative population that has been overlooked in previous studies, and nestin-positive cells that are similar to those described in other studies (Vescovi et al. 1993; Weiss et al. 1996). Consistent with these data, we found two ultrastructurally and antigenically distinct populations of cells: dark cells that are immunopositive for actin, weakly positive for vimentin, and nestin-negative, and light cells that are immunopositive for actin, vimentin, and nestin. Interestingly previous ultrastructural studies revealed the presence of several cell types in the developing ventricular zone, including light and dark cells (Tennyson and Papas 1962; Stensaas and Gilson 1972; Gould et al. 1990).
Some studies indicate that EGF-expanded stem cells generate two subpopulations of cells responsive to FGF-2, one restricted to neuronal differentiation and the other to a bipotential cell that develops into neurons and astrocytes (Vescovi et al. 1993). However, other studies suggest that cells responding to both EGF and FGF-2 are glia-restricted progenitors, whereas multipotent precursors proliferate in response to FGF-2 only (Kilpatrick and Bartlett 1995). Moreover, it has been proposed that neural stem cells undergo a developmentally programmed switch in growth factor responsiveness, in which FGF-2-responsive stem cells acquire EGF responsiveness and give rise to multipotent precursors responding to both FGF-2 and EGF (Ciccolini and Svendsen 1998; Ciccolini 2001). Other studies support the existence of a single population of neural stem cells whose proliferation is controlled by both EGF and FGF-2 (Gritti et al. 1999) or of two different cell populations: EGF- and FGF-responsive neural stem cells (Tropepe et al. 1999; Martens et al. 2000). Our findings show that floating, EGF-expanded neurosphere cells are intensely stained for FGFR-1 and −2 and are weakly immunoreactive for FGFR-3. This is consistent with the Western blotting analyses and with our earlier studies that identified FGFR-1 and −2 in recently seeded neurospheres at 2 hr post plating (Reimers et al. 2001). Neurospheres also express EGFR, as demonstrated by immunoblotting analysis. Therefore, in agreement with the model of Vescovi et al. (1993), our results suggest that the cells studied here are targets of EGF and putative targets of FGF-2 through specific receptors. Our results also indicate that floating spheres express a specific subset of FGFR isoforms that differ from the pattern of expression found in cultures at 3 dpp (mainly composed of adherent spheres and their progeny). Thus, the unique pattern of expression of FGFRs may serve to distinguish neurosphere cells from their progeny, as previously proposed for neuroepithelial stem cells (Kalyani et al. 1999). In this sense, it has been shown that neuroepithelial stem cells express a specific subset of FGFRs (although they do not express EGFR) and synthesize detectable levels of FGF-1, FGF-2, and EGF (Kalyani et al. 1999). Moreover, it has been proposed that stem cells synthesize and secrete some autocrine/paracrine co-factors (such as a glycosylated form of cystatin C) that are required for the mitogenic activity of FGF-2 on stem cells (Taupin et al. 2000). Here we show that, in the absence of exogenous FGF-2, neurosphere cells express FGF-2. After six passages (renewing the culture medium in each passage), after a total of 12–18 days in liquid culture, and after EGF induction of massive proliferation of the isolated cells it is very unlikely that the detectable levels of FGF-2 found in these spheres come from the extra- or intracellular pools of growth factors that exist in the rat fetal striatum from which the cells were isolated. In this sense, we failed to detect other growth factors in these spheres, such as TGF-α, which exists in the E15 rat fetal brain (Kornblum et al. 1997). Therefore, we propose that neurosphere cells may synthesize FGF-2 that could act as an autocrine/paracrine factor on these cells. Consistent with this hypothesis, it has been proposed that endogenous FGF-2 is released by R1 embryonic stem cells (Tropepe et al. 2001) and neural crest cells (Murphy et al. 1994).
Although it has been shown that migrating neuroblasts (Rousselot et al. 1995; Doetsch et al. 1999b), oligodendrocyte preprogenitors (Decker et al. 2000), and stem cells (Vitry et al. 2001) express polysialylated neural cell adhesion molecule, the expression of other adhesion molecules in stem cells has not been previously studied. These molecules could play important roles in the clustering of migrating stem cells into chains and in the grouping of cells into neurospheres (stem cell condensation). Cell condensation or compaction is the morphogenetic process whereby loosely organized cells become adherent to each other and condense together, forming cell-cell junctions (reviewed in Gumbiner 1996). Compaction occurs in many developing tissues and is mediated by the cadherin/catenin/cytoskeleton complex, which induces the spreading of cells against one another. This process has been compared to the integrin-mediated spreading of fibroblasts on the extracellular matrix because both involve forces generated by the actin cytoskeleton and the assembly of analogous cell junctions, adherens junctions, and focal adhesions (Gumbiner 1996). Cadherins can also mediate looser noncompacted adhesions between cells, such as the loose clustering of migrating neural crest cells (Nakagawa and Takeichi 1995). In neurosphere cultures, the process whereby clonally derived cells aggregate into spherical clusters could be considered a form of cell compaction. It is not clear how this process takes place, but taking into account that (a) adherens junctions are the only type of cell junction found among sphere cells, (b) neurospheres can be dispersed by removing Ca2+ with EDTA, and (c) these cells express E- and N-cadherin (Ca2+-dependent adhesion receptors) and α- and β-catenin leads us to suggest that sphere cell compaction could be mediated by adherens junctions through specific cadherin/catenin/cytoskeleton complexes. Moreover, during chain migration, neural precursors move as chains of closely apposed cells connected by adherens junctions (Lois et al. 1996). Therefore, adherens junction could play an important role in the aggregation of cells into neurospheres and in their migration. It has been shown that the cytoplasmic domain of cadherins forms complexes with either β-catenin or γ-catenin, which associate with α-catenin, and that α-catenin binds this ternary complex to the actin cytoskeleton (reviewed in Tucker and Pignatelli 2000). Because we found α- and β-catenin but not γ-catenin in neurosphere cells, the complex expressed in these cells should be cadherin/β/α-catenin/actin. In addition we found higher levels of β-catenin than those required to bind α-catenin on a 1:1 molar ratio. This suggests that β-catenin could have other roles in sphere cells in addition to its function in cell adhesion. In this sense, it has been shown that β-catenin plays a central role in the regulation of gene expression via the wingless-Wnt pathway that affects the embryonic axis specification (reviewed in Gumbiner 1996; Tucker and Pignatelli 2000). Moreover, in the Drosophila neuroectoderm from which neural stem cells develop, the segmentation gene wingless is regionally expressed and is required for neuroblast determination and formation (Chu-LaGraff and Doe 1993). Therefore, β-catenin could have a dual role in sphere cells: one in cell-adhesion and the other in the regulation of the wingless-Wnt pathway that mediates cell fate determination.
Apoptosis is an active mode of programmed cell death characterized by calcium influx, endonuclease activation, oligonucleosomal DNA fragmentation, chromatin condensation, and rearrangement of the plasma membrane with exposure of phosphatidylserine residues at the extracellular face. Within tissues, residual bodies of apoptotic cells are rapidly phagocytosed by macrophages, microglia, or other nearby cells (reviewed in Kerr et al. 1994; Jacobson et al. 1997). It has been shown that a subpopulation of EGF-responsive neurosphere cells subplated with substrate coating undergo apoptosis, as demonstrated by the cell morphology and TUNEL staining, and in these cells the levels of APE/ref-1 (the major base excision DNA repair enzyme) are reduced or missing compared with healthy progenitor cells (Zhou et al. 2000). We demonstrate here that a subpopulation of floating neurosphere cells undergo apoptosis. The significance of this cell population remains unknown. However, because the proliferation and differentiation processes of neurosphere cells appear to recapitulate the early events of neural/glial development in the brain, these apoptotic cells could have the same significance as those found in the developing brain. Therefore, apoptosis might represent a mechanism to select from among overproduced cells. Because survival is probable for cells that receive adequate amounts of trophic factors and the lack of these factors provided by neighboring cells is the most likely mechanism of apoptotic cell death, apoptosis has been considered a form of social control in the developing nervous system (for review see Raff 1992) and it could have the same significance in neurosphere cultures. We also observed that healthy cells phagocytosed the cell debris derived from apoptotic and necrotic cells. This is the first reported evidence supporting a phagocytic capability for neurosphere cells, and it might be important in considering their possible role as scavengers during cell development and as mediators of injury signals. This particular phagocytosis process involves the engulfment of dying cells by cell processes from healthy cells, which could prevent the loss of any fragments via the flushing effect of a liquid environment. As soon as the cells show the ultrastructural characteristics of early apoptosis and necrosis, cell processes from healthy cells already surround them. Therefore, some unknown mechanism(s) for the early recognition of apoptotic and necrotic cells should exist in sphere cells that allows the identification of these cells when they are committed to dying. In summary, the phagocytosis process observed in neurospheres involves the following stages: (a) the early recognition of dying cells; (b) the engulfment of dying cells by cell processes; (c) the phases of apoptosis and necrosis that occur within these nests of cell processes; and finally (d) phagocytosis of the cell fragments and cell debris by nearby cells.
This study is the first to demonstrate the ultrastructural characteristics of EGF-expanded free-floating neurospheres derived from rat fetal striatum, the presence of two types of cells in these neurospheres, the phagocytic capability of sphere cells, and the expression by these cells of actin, vimentin, EGFR, a specific subset of cadherins, catenins, and FGFR isoforms. Moreover, we propose that neurosphere cells synthesize detectable levels of FGF-2. However, this study raises new research problems dealing with several aspects of neurosphere cells’ structure and function, such as the roles of β-catenin and endogenous FGF-2 in these cells and the molecular mechanisms underlying the recognition of dying cells and the phagocytotic processes.
Footnotes
Acknowledgements
Supported in part by grants from the Fondo de Investigaciones Sanitarias (FIS 97/269 to E. Bazán and FIS 97/254 to C.L. Paíno) and Comunidad Autonoma de Madrid (CAM 8.5/4.1/99 to E. Bazán). Drs Lobo and Caso are recipients of postdoctoral fellowships from the Comunidad Autonoma de Madrid (CAM 8.5/4.1/99) and FIO foundation (Fundación para la Investigación en Oncología) respectively.
The two first authors have participated equally in this work.