
Abstract
Increased intrarenal atrial natriuretic peptide (ANP) mRNA expression has been reported in several disorders. To further investigate the action of renal ANP, we need to elucidate the exact site of its alteration in diseased kidneys. ANP mRNA and ANP were detected by in situ hybridization and immunohistochemistry in the kidneys from five normal and five diabetic rats. Renal ANP mRNA in eight normal and nine diabetic rats was measured by RT-PCR with Southern blot hybridization. In normal and diabetic rats, the distribution of ANP mRNA and ANP-like peptide was mainly located in proximal, distal, and collecting tubules. However, diabetic rats had significant enhancement of ANP mRNA and ANP-immunoreactive staining in the proximal straight tubules, medullary thick ascending limbs, and medullary collecting ducts. ANP mRNA in the outer and inner medulla of nine diabetic rats increased 5.5-fold and 3.5-fold, but only 1.8-fold in the renal cortex. This preliminary study showed that ANP mRNA and ANP immunoreactivity in proximal straight tubules, medullary thick ascending limb, and medullary collecting ducts apparently increased in diabetic kidneys. These findings imply that ANP synthesis in these nephrons may involve in adaptations of renal function in diabetes.
Keywords
A
In addition to prostaglandin (Craven et al. 1987), kinin (Jaffa et al. 1992), and nitric oxide synthase (Shin et al. 2000), marked enhancement of ANP mRNA was also found in whole kidneys of diabetic rats (Shin et al. 1997). Therefore, diabetes could be a good disease model with which to study the change of cellular distribution for ANP mRNA and ANP-like peptide. In this study we detected the local distribution of ANP mRNA and ANP-like substance by highly sensitive in situ hybridization and immunohistochemistry with microwave treatment to investigate in which part the renal ANP synthesis may be influenced under conditions of severe hyperglycemia and hyperosmolality in diabetic rats.
Materials and Methods
Animal Experiments
Male Wistar rats (purchased from the animal center of National Cheng Kung University, Taiwan) weighing 230–260 g were individually housed in metabolic cages. Diabetes was induced by a single peritoneal injection of 55 mg/kg streptozotocin (Sigma Chemical; St Louis, MO). Twenty-four hours later, induction of diabetes was confirmed by measuring their tail blood glucose levels (Accutrend Glucose; Boehringer Mannheim, Indianapolis, IN). Rats with blood glucose levels >19.4 mmol/liter were included. Diabetic rats received ultralente insulin (Novo-Nordisk; Copenhagen, Denmark) designed to achieve blood glucose levels between 19.4 and 33.3 mmol/liter. Thirteen body weight- and age-matched rats were studied as normal controls. In experiment 1, five normal and five diabetic rats on day 42 of the study were anesthetized with sodium pentobarbital (Abbott Laboratories; Chicago, IL) and infused with normal saline via the left cardiac ventricle, and then with phosphate buffer solution (pH 7.4) containing 4% paraformaldehyde for 15 min. Kidneys were removed and immersed in 4% paraformaldehyde for 2 hr. Thin kidney slices containing cortex, outer medulla, and inner medulla of normal and diabetic rats were embedded in the same paraffin block and cut into 4-μm sections for in situ mRNA hybridization and immunohistochemical study. In experiment 2, eight normal and nine diabetic rats were sacrificed to collect blood to measure plasma ANP, angiotensin II (Ang II), arginine vasopressin, sodium, and osmolality on day 42 after streptozotocin or citric buffer injection. Kidneys were immediately removed and separated into cortex, outer medulla, and inner medulla for ANP and β-actin mRNA analysis. Urine ANP, sodium, glucose, and osmolality were measured on day 42. This study was approved by the Animal Care and Treatment Committee of Kaohsiung Medical University.
In Situ Hybridization
Sections were pretreated with microwave heating as described in our previous study (Lai et al. 2000). Briefly, after deparaffinization and rehydration, sections were placed in a universal slide kit filled with 0.01 M sodium citrated buffer (300 ml, pH 6.0). Slides were heated twice for periods of 5 min at the maximal power setting (720 W) of the microwave oven with 140–145 sec of boiling time. After microwave pretreatment, sections were washed in 2 X SSC twice for 5 min each time and then prehybridized with 200 μl hybridization buffer containing 50% deionized formanide, 4 X SSC, 2 X Denhardt's solution, 1 mg/ml salmon sperm DNA (Roche Molecular Biochemical; Mannheim, Germany), and 1 mg/ml yeast transfer RNA for 1 hr at 42C. After washing in 2 X SSC, sections were incubated with 200 μl of the hybridization buffer containing 300–800 ng/ml denatured digoxigenin-labeled antisense or sense ANP cRNA probe for 3 hr at 42C as used in our previous study (Lai et al. 2000). After hybridization the sections were washed twice with 2 X SSC for 5 min at RT, followed by 0.1 X SSC for 30 min at 42C.
Digoxigenin-labeled RNA hybrids were detected using an ELISA kit (Roche Molecular Biochemicals). After immersion in 1.5% blocking solution, the slides were exposed to antidigoxigenin-alkaline phosphatase conjugate diluted 1:1000 for 30 min. The hybrids were visualized as purple/black precipitates by subsequent alkaline phosphatase-chloro-3-indolyl phosphate and nitroblue tetrazolium. We compared the relative intensity of ANP mRNA in normal and diabetic rats on the same slide to avoid discrepancies due to varying thickness and different processing times. The ANP mRNA staining intensities were graded according to the following scale: 0 = very weak staining, 1 = weak staining, 2 = moderate staining, and 3 = strong staining. The intensity was determined in 10 glomeruli and 10 tubule segments per animal and was expressed as the average intensity per tubules and glomeruli. The intensity and distribution of ANP mRNA were evaluated by two nephrologists without prior knowledge of the source of the sections.
Immunohistochemistry
Sections were pretreated with microwave heating as described above. After microwave treatment, sections were washed in PBS and incubated with 1% bovine serum albumin for 30 min to block nonspecific staining. Sections were drained and incubated for 3 h at RT in a humidity chamber with the respective rabbit anti-rat primary antibody (Phoenix Pharmaceuticals; Belmont, CA) for αANP (1:1000) diluted with antibody diluent (DAKO; Glostrup, Denmark). After washing in PBS, endogenous peroxidase activity was blocked by incubation in 0.3% H2O2 in methanol for 20 min, followed by sequential 10-min incubations with bio-tinylated link antibody and peroxidase-labeled streptavidin (DAKO). Staining was completed after incubation with Vector VIP substrate-chromogen solution, then counterstaining with methyl green (Vector Laboratories; Burlingame, CA), and then mounted in aqueous mounting medium. Negative control studies were performed with primary antibody being replaced by normal rabbit serum and counterstaining with hematoxylin. The ANP immunostaining intensities were graded according to the following scale: 0 = very weak staining, 1 = weak staining, 2 = moderate staining, and 3 = strong staining.
RNA Isolation and Reverse Transcription
Total RNA was extracted from the renal cortex, outer medulla, and inner medulla using a modified guanidium isothiocyanate method. The integrity of the RNA was assessed by formaldehyde-agarose gel electrophoresis followed by ethidium bromide staining, and the quality was determined by absorbance at 260 nm. Two micrograms of total RNA from renal cortex, outer medulla, and inner medulla were reverse-transcribed by incubation with 20 μl reverse transcription mixture containing 20 pmole oligo (dT)18 primer, 50 mM Tris-HCl (pH 8.3), 75 mM KCl, 3 mM MgCl2, 30 U RNase inhibitor, 0.5 mM dNTPs, and 50 U MMLV reverse transcriptase (Stratagene Laboratories; Palo Alto, CA) at 37C for 2 h. The reverse transcriptase was inactivated by heating for 5 min at 94C.
Polymerase Chain Reaction Amplification and Southern Blot Hybridization
PCR reaction was performed at a final concentration of 1 X PCR buffer (10 mM Tris-HCl, pH 8.3, 50 mM KCl, 1.5 mM MgCl2), 0.2 mM dNTPs, 0.4 μM sense and antisense oligos, 2.0 U Taq DNA polymerase (Boehringer Mannheim) to a total volume of 50 μl. The amplifications were performed for 45 sec at 94C, 45 sec at 60C, and 90 sec at 72C in a Perkin-Elmer Cetus 9600 thermocycler (Perkin-Elmer Cetus; Norwalk, CT). Sense primers for ANP were 5′-GGCTCCTTCTCCATCACCAA-3′, corresponding to bp 4–23, and antisense primers were 5′-TGTTATCTTCGGTACCG-3′, corresponding to bp 445–461, which yielded a 458-bp PCR product. Sense primers for β-actin were 5′-CGTAAAGACCTCTATGCCAA-3′, corresponding to bp 2748–2767, and antisense were 5′-AGCCATGCCAAATGTCTCAT-3′, corresponding to bp 3201–3222, which yielded a 349-bp PCR product. The amplification cycles of the PCR procedure were evaluated for ANP and β-actin mRNA. The amplification cycles of all following PCR analysis were selected only during the exponential phase. The amplification cycles were repeated 30 and 22 times for ANP and β-actin mRNA, respectively, in the renal cortex, outer medulla, and inner medulla.
From each PCR production, the amplified products were electrophoresed on 1.5% agarose gels and transferred to nylon membranes (Schleicher & Schuell; Dassel, Germany). The blots were hybridized with 32P-labeled, randomly primed rat ANP and β-actin cDNA prepared by PCR cloning for 16 hr at 37 C, according to the standard technique. After each hybridization, the blots were washed twice in a solution containing 0.1% sodium dodecyl sulfate (SDS) and 2 X SSC (0.3 M NaCl, 30 mM sodium citrate) for 15 min at RT and then twice in 0.1% SDS and 0.1 x SSC at 65 C. Blots were exposed to Kodak BIOMAX-MR (Eastman Kodak; Rochester, NY) film at −70C. A radioisotope-labeled probe for β-actin to be used as an internal control was also made using the primer extension method. After autoradiography, the X-ray film was scanned by a laser densitometer (Molecular Dynamics; Sunnyvale, CA) and the data were analyzed by MD ImageQuant software release version 3.22. To determine the relative changes in tissue ANP mRNA expression, the yield of ANP PCR products was normalized to the amount of β-actin cDNA amplified from the same RT cDNA of tissue samples, a method that has been used in our previous studies (Lai et al. 2000). The accuracy of the semiquantitative RT-PCR with Southern blot analysis in this study was tested. Serial dilution (0.4, 0.8, 1.2, 1.6, 2.0 and 2.4 μg) of total RNA was subjected to RT-PCR amplification for ANP and β-actin mRNA. The correlation coefficients between RNA concentrations and corresponding densities for ANP and β-actin mRNA were r = 0.956 and r = 0.952 from the renal cortex, r = 0.953 and r=0.962 from outer medulla, and r = 0.956 and r = 0.951 from inner medulla, respectively. An intra-assay test of RT-PCR followed by Southern blot analysis in 2.0 μg total RNA extracted from renal tissues was done. The variation coefficients of the intra-assay test for ANP and β-actin mRNA were 6.9% and 6.2% from the renal cortex (n = 8), 6.8% and 6.3% from the renal outer medulla (n = 8), and 6.8% and 6.5% from the inner medulla (n = 8) of normal rat renal tissues, respectively.
Assay Methods
Plasma samples were extracted using Sep-Pak C18 cartridges (Water Associates; Milford, MA) that had been pre-wetted with 4 ml of 60% acetonitrile (ACN) in 0.1% trifluoacetic acid (TFA). The cartridges with the absorbed peptides were then washed with 6 ml of 0.1% TFA and eluted with 3 ml of 60% ACN in 0.1% TFA. These elutants were lyophilized and reconstituted for radioimmunoassay. Ang II, vasopressin, and ANP immunoreactivities from samples of plasma were determined by RIA methods after the lyophilisate was resuspended in RIA buffer. Concentrations of plasma and urinary sodium and osmolality were determined in an automatic analyzer (Nova Biochemical; Newton, MA).
Statistical Analysis
The data are expressed as mean ± SEM. To test the difference between the two groups, two-tailed unpaired Student's t-test was performed. A p value <0.05 was considered statistically significant.
Results
Biochemical and physical data of normal and diabetic rats on the 42nd day of experiment 2 are shown in Table 1. In the diabetic group, the mean blood glucose level, the daily water intake, and the urine amount were markedly increased compared to the corresponding values of normal rats. Compared to the normal rats, the diabetic group showed a significant decrease in body weight but a significant increase in mean kidney weight:body weight ratio. In the untreated diabetic rats, plasma ANP, vasopressin, and osmolality levels, as well as urine ANP, sodium, glucose, and osmolality excretion rate, were significantly increased, whereas plasma sodium and Ang II concentrations showed no significant difference.
We determined directly the distribution of ANP mRNA in renal sections from normal and diabetic rats by in situ hybridization using a specific antisense cRNA probe for ANP, as shown in Figure 1. In normal rats, ANP mRNA intensity was moderate in proximal convoluted tubule (PCT), proximal straight tubule (PST), medullary thick ascending limb (MTAL), distal convoluted tubule (DCT), cortical collecting duct (CCD), outer medullary collecting duct (OMCD), and inner medullary collecting duct (IMCD). The glomeruli, blood vessels, and the thin limb of Henle's loop showed weak staining for ANP mRNA. We detected no signal using a sense cRNA probe (Figure 1D and 1H). A similar but significantly increased distribution of ANP mRNA intensity was observed in diabetic rats. The upper panel of Figure 3 shows that the density of ANP mRNA hybridization increased in PST, MTAL, DCT, OMCD, and IMCD of diabetic kidneys compared to those corresponding segments in normal control rats.
Characteristics of normal control (NC) and diabetic (DM) rats on day 42 of the study (mean ± SEM)
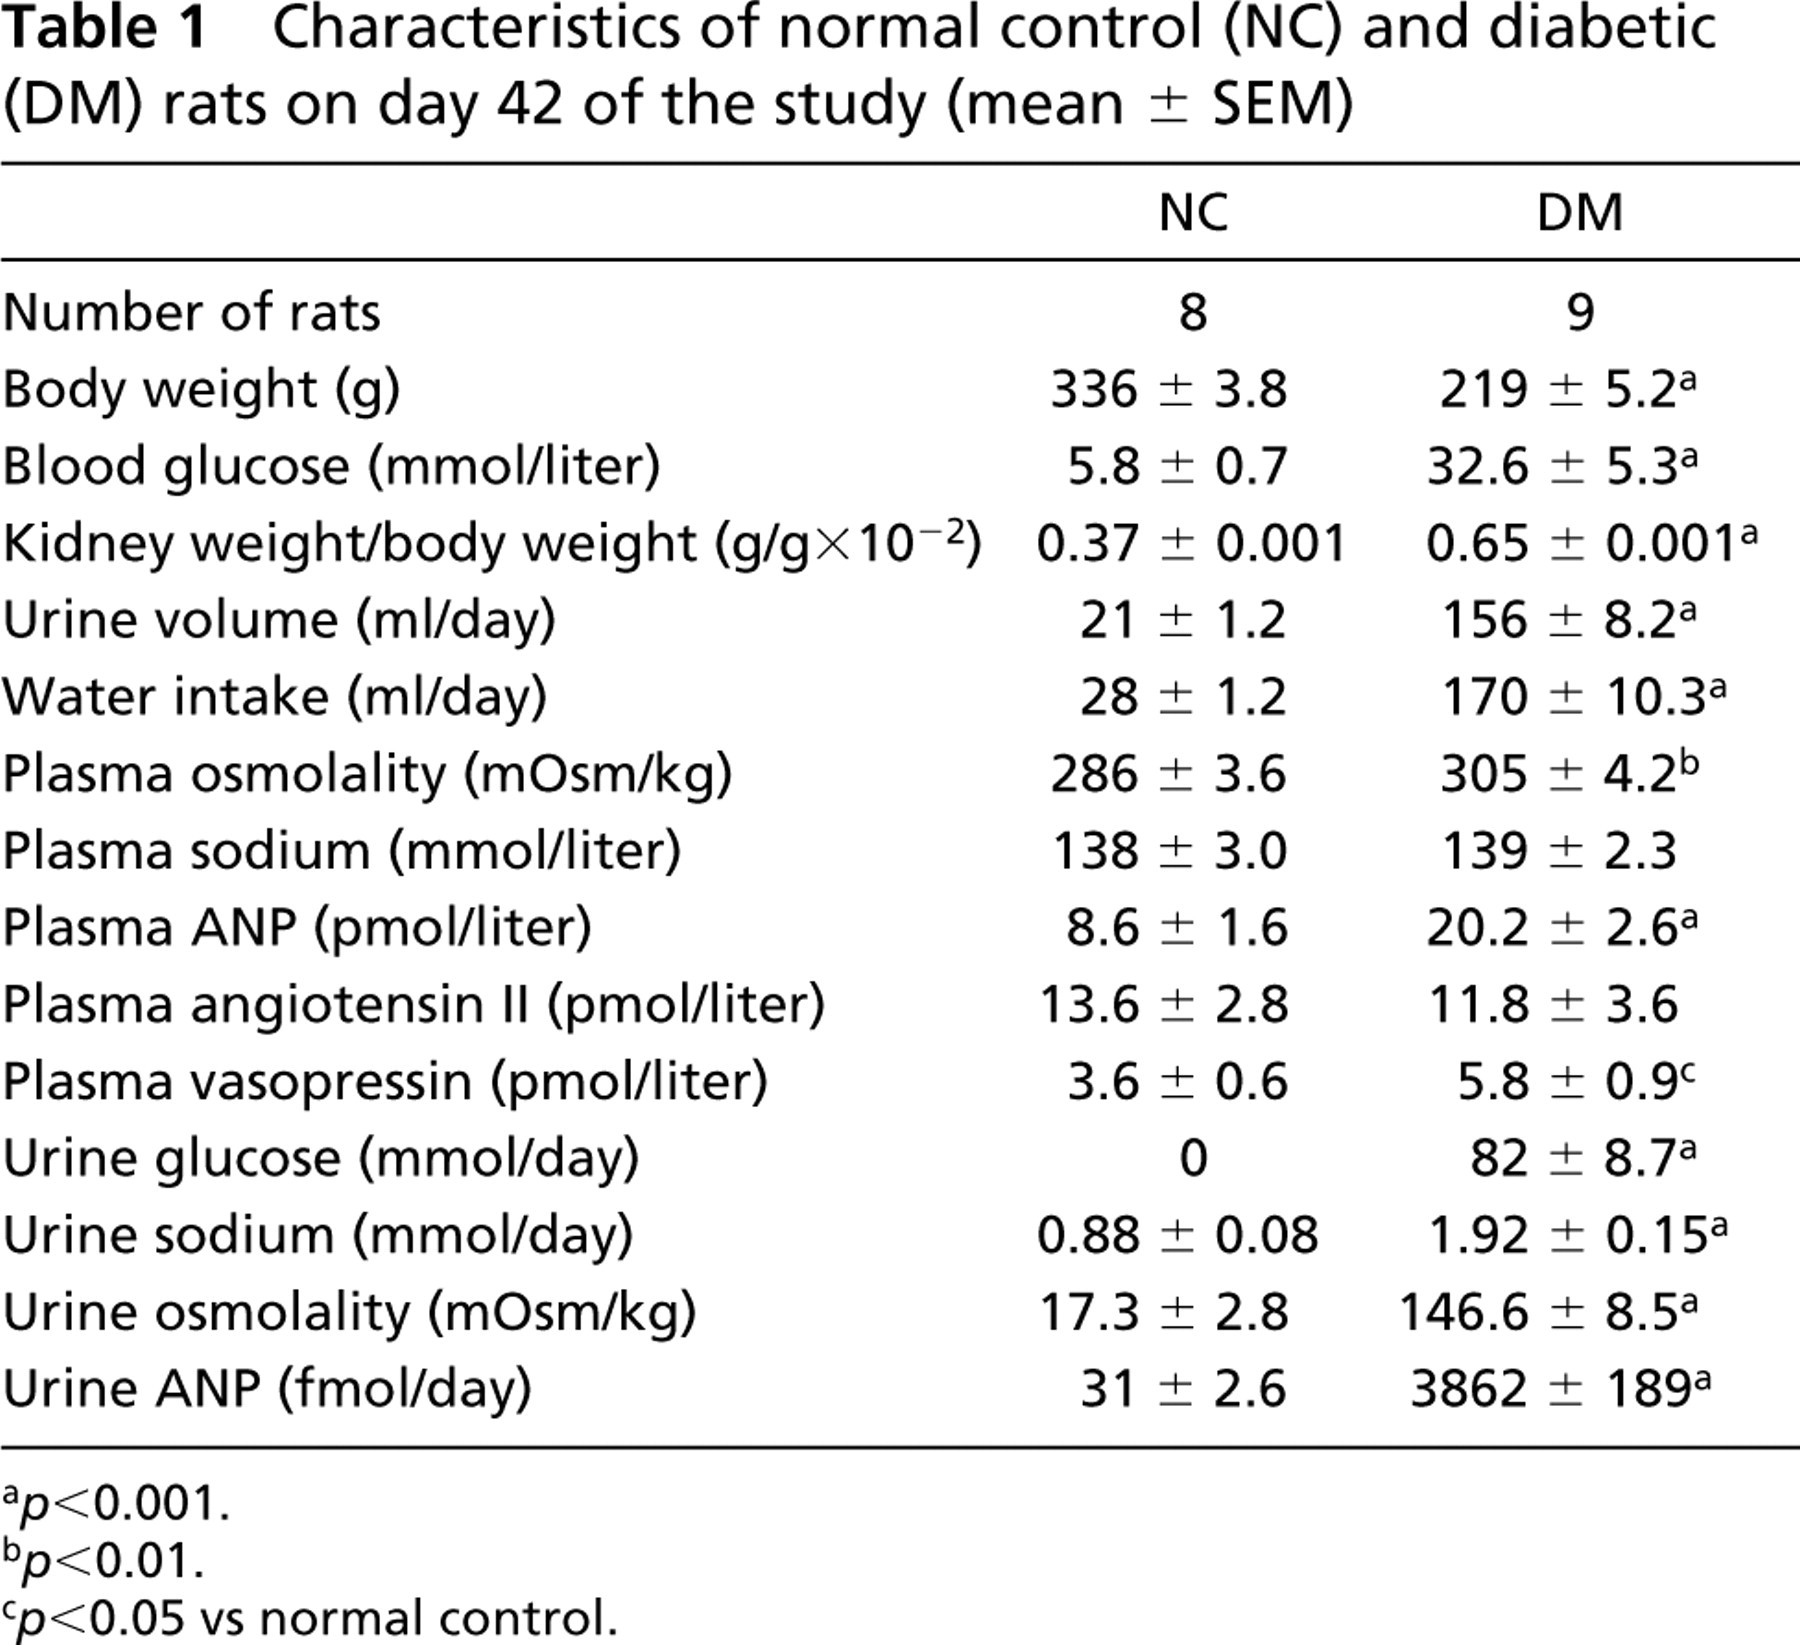
a p<0.001.
b p<0.01.
c p<0.05 vs normal control.
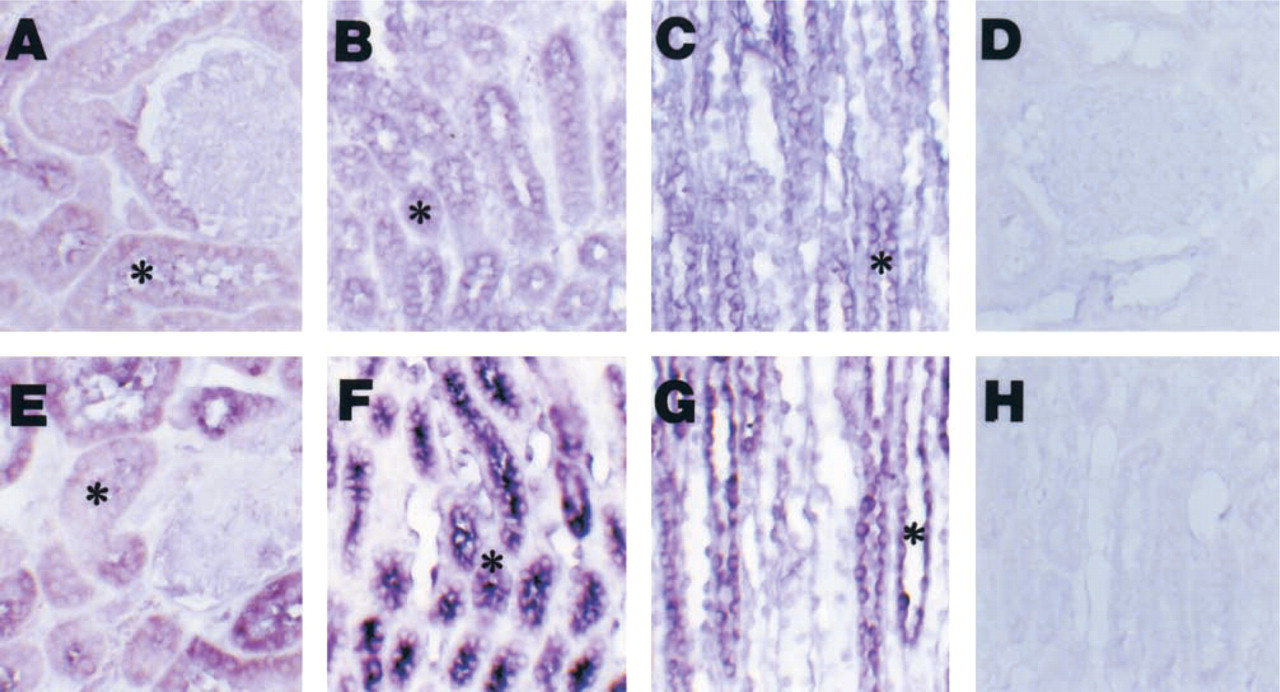
In situ hybridization of ANP mRNA in the same paraffin section of one normal (upper panel) and one diabetic (lower panel) rat. (
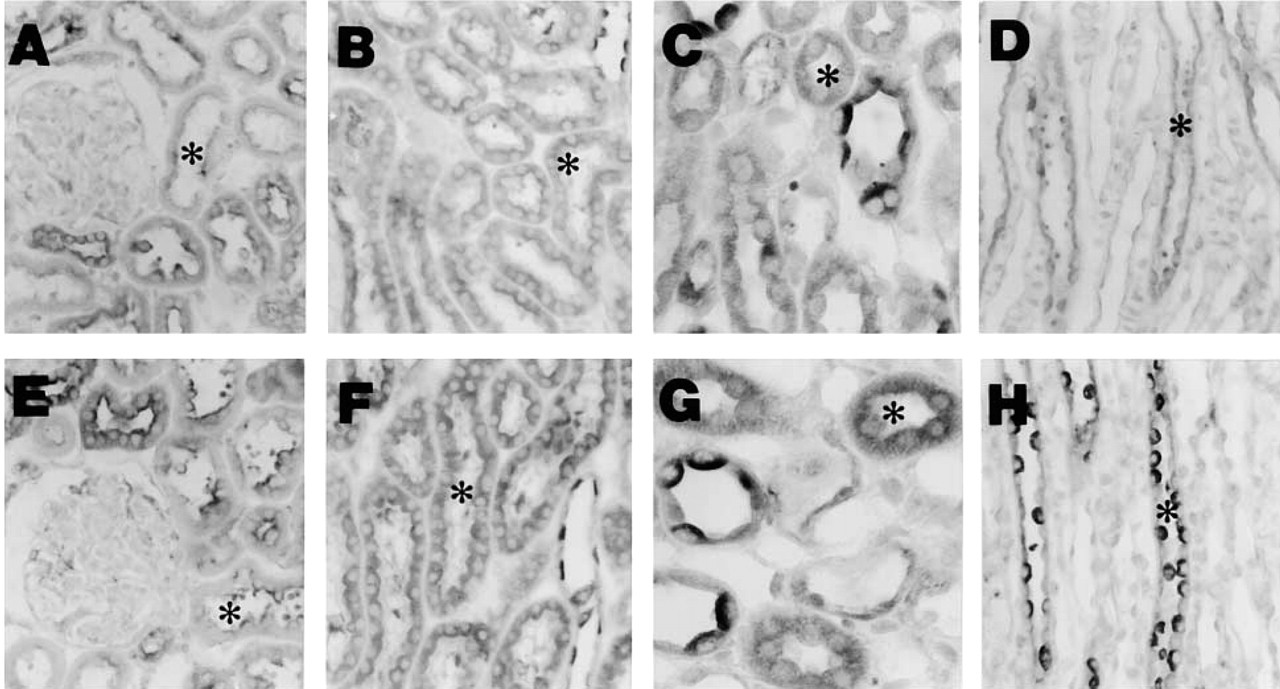
Immunohistochemical ANP staining in the same paraffin section of one normal control rat (upper panel) and one diabetic rat (lower panel). (
Figure 2 shows the results of immunohistochemical studies for ANP-like immunoreactivities in the renal cortex, outer medulla, and inner medulla from one representative normal and one diabetic rat. In normal rats, the signal of ANP-like immunoreactive staining was detected mainly in PCT, PST, MTAL, DCT, CCD, OMCD, and IMCD, although very weak expression was also detected in the glomeruli and thin limb of Henle's loop. Diabetic rats had a similar distribution pattern of ANP immunostaining intensity. There was, however, a considerable increase in intensity of ANP immunostaining in diabetic rats. The lower panel of Figure 3 shows the changes of ANP immunoreactive intensity in diabetic rats. The ANP immunoreactivity clearly increases in PST, MTAL, OMCD, and IMCD of the diabetic rats compared with normal control rats. No immunoreactive labeling was observed when the sections were incubated with pre-absorbed antibody or with rabbit normal serum in the absence of primary antibody (data not shown).
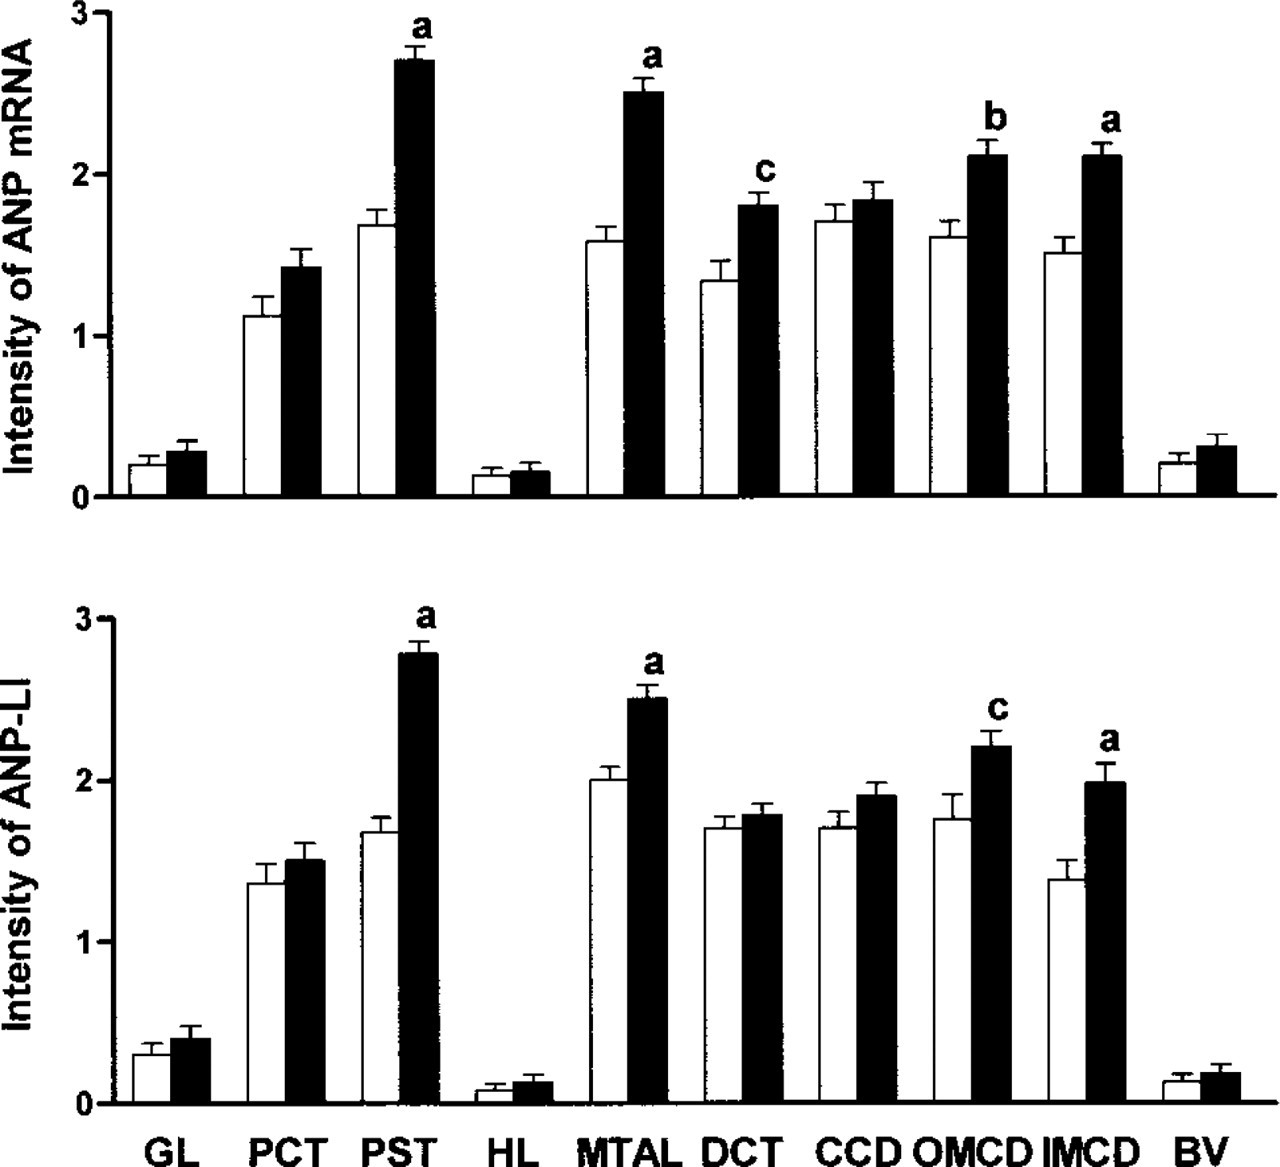
Staining intensity of ANP mRNA (upper panel) and ANP immunoreactivity (lower panel) as determined by in situ hybridization and immunohistochemistry in five normal control rats (□) and five diabetic rats (▪). 0 = no detectable intensity; 1 = weak intensity; 2 = moderate intensity; 3 = strong intensity. a, p<0.001; b, p<0.01 vs normal control (unpaired Student's t-test).
Figure 4 (upper panel) shows the autoradiographs of RT-PCR amplifications of ANP and β-actin mRNA in the renal cortex, outer medulla, and inner medulla from three representative normal and three representative diabetic rats on day 42. The relative ratios of the densitometry measure of PCR products for ANP with those for β-actin mRNA from eight control and nine diabetic rats are shown in the lower panel of Figure 4. The relative ratios of cDNA product for ANP mRNA with β-actin mRNA in the renal cortex, outer medulla, and inner medulla were found to have increased by 1.8-, 5.5-, and 3.5-fold in diabetic rats compared to normal rats.
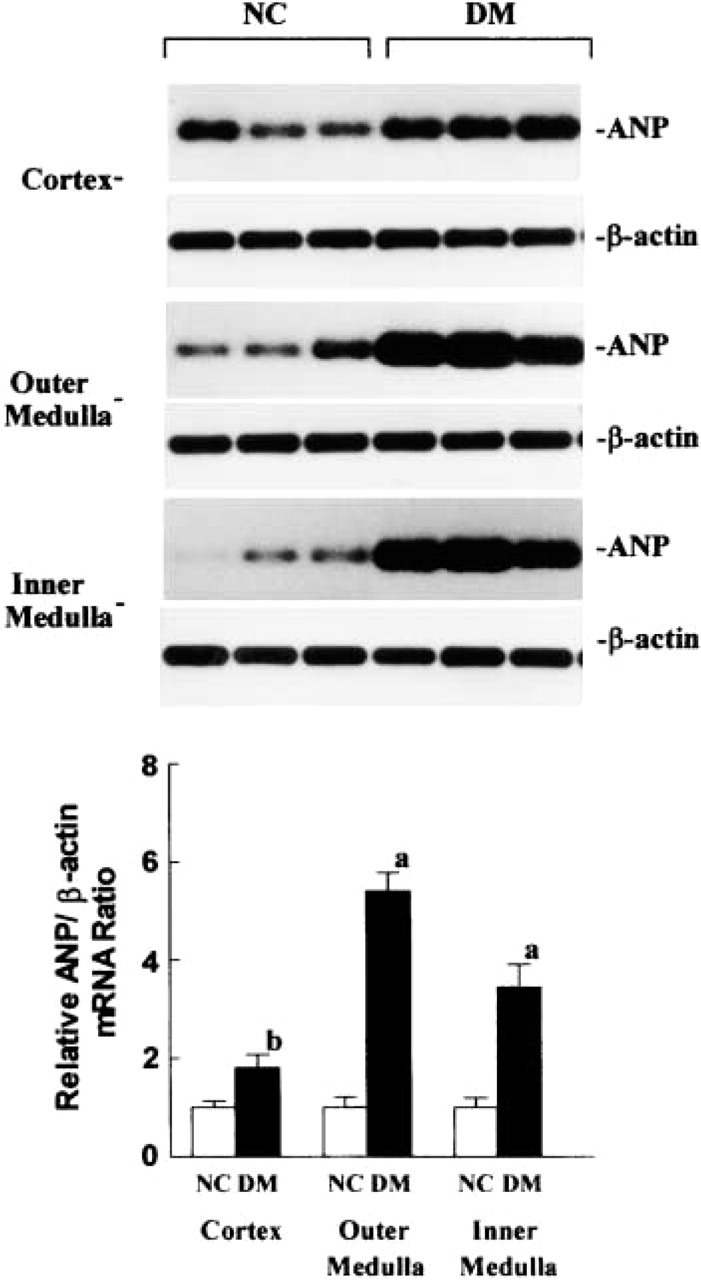
(Upper panel) Autoradiographs of amplification of ANP and β-actin mRNA by RT-PCR followed by Southern blot hybridization in the renal cortex, outer medulla, and inner medulla from three representative normal (NC) and three representative diabetic (DM) rats on day 42 of the study. (Lower panel) Relative ratios (mean ± SEM) of the densitometry readings for RT-PCR between ANP and β-actin mRNA in the renal cortex, outer medulla, and inner medulla from eight normal and nine diabetic rats. a, p<0.001; b, p<0.001 compared to normal rats.
Discussion
The present study demonstrates that ANP synthesis increased predominantly in PST, MTAL, and medullary collecting ducts in diabetic rats. This conclusion is based on the following findings: (a) the intensity of ANP mRNA, detected directly by in situ hybridization, was considerably increased in PST, MTAL, DCT, and MCD of diabetic kidneys; (b) the immunoreactive staining for ANP in PST, MTAL, and MCD of diabetic kidneys was also enhanced; (c) ANP mRNA expression in renal cortex, outer medulla, and inner medulla of diabetic kidneys showed 1.8-, 5.5-, and 3.5-fold increases compared to the corresponding data for normal rats.
The first report demonstrating that ANP prohormone-like peptide could be produced and secreted in the primary cultures of neonatal and adult rat kidney cells was made by Ritter et al. (1991). With immuno-histochemical studies for ANP prohormone immunoreactivity, proANP staining was found to be predominantly detectable in cortical distal tubular cells (Greenwald et al. 1991), with other reports showing additional staining of proANP in proximal tubules and cortical collecting tubules (Ramirez et al. 1992). Using RT-PCR coupled with Southern blot hybridization, several investigations (Lee et al. 1996; Shin et al. 1997; Totsune et al. 1998; Ogawa et al. 1999) have demonstrated the existence of ANP mRNA in normal rat kidneys, although only in low abundance. All the above reports clearly implicated the kidney as an organ of ANP synthesis. However, there was no report showing the cellular distribution of ANP mRNA in the kidney. This preliminary study demonstrates that the signal of renal ANP mRNA was predominantly hybridized in PST, MTAL, DCT, and MCD by use of a sensitive in situ hybridization technique, but was less hybridized in glomeruli, PCT, and CCD. The present study indicates that renal tubules are the dominant sites of ANP mRNA expression in rat kidney.
Using immunohistochemical studies for ANP-like immunoreactivity, several investigations have demonstrated the localization of ANP in the normal kidney. Most of these studies have reported that positive ANP-immunoreactive staining was localized to cortical distal tubule epithelial cells in rat and human kidneys (McKenzie et al. 1985; Figueroa et al. 1990; Greenwald et al. 1991; Totsune et al. 1994), while some others also identified the ANP-like peptide in proximal tubules and cortical collecting ducts (Ramirez et al. 1992). By using paraffin sections with microwave treatment instead of frozen sections without microwave heating (Lai et al. 2000), not only were DCT, PCT, and CCD stained but also ANP was noticeably detectable in PST, MTAL, OMCD, and IMCD in our normal rats. To our knowledge, this study first indicates that the cellular distribution of ANP-like substance could be observed in the tubules of the renal medulla. In addition, the distribution of ANP immunoreactivity was well paralleled with that of renal ANP mRNA by in situ hybridization. This similar distribution of ANP-like immunoreactivity and ANP mRNA reflects the possibility that ANP-like substance is translated from ANP mRNA itself in these nephrons.
Because the kidney is able to synthesize ANP, the alteration of renal-synthesized ANP has also been investigated in several disorders (Lee et al. 1996; Shin et al. 1997,1998; Totsune et al. 1998; Ogawa et al. 1999). Greenwald et al first reported that the ANP prohormone-like immunoreactivity in distal convoluted tubules appeared in puromycin-induced nephrotic rat kidneys (Greenwald et al. 1991), wheras no immunostaining was observed in normal kidneys. In intact kidney, we previously reported that renal ANP mRNA expression was upregulated in deoxycorticosterone acetate (DOCA)-salt-treated rats (Lee et al. 1996). Increased renal ANP mRNA expression has also been shown in remnant kidney of rats with reduced renal mass (Totsune et al. 1998), in rats with suprarenal aortic banding (Ogawa et al. 1999), and in rats with water deprivation and salt restriction (Shin et al. 1998). In the present study, we further showed that the ANP mRNA signal and ANP-like immunore-active staining, as assessed by in situ hybridization and immunohistochemical study, respectively, were strongly increased in PST and medullary CD of diabetic rats compared to those in normal rats. More importantly, Lenz et al. (1999) found a rapid increase of natriuretic peptides in response to the osmotic effect of raising extracellular sodium chloride and various intracellular stimuli, including sodium gluconate and glucamine, in cultured human embryonic kidney (HEK 293) cells. Considered together, the evidence collected from the above studies implies that these nephrons might be the dominant sites of the kidneys to synthesize ANP to modulate the renal functions in several pathophysiologic disorders.
In the kidney, the tubules and vasa recta are arranged in a hairpin pattern to preserve osmotic gradients and enhance urinary concentration (Chou et al. 1990). The cells in the outer medulla have receptors for vasodilators and vasoconstrictors that in concert regulate medullary renal blood flow, electrolytes, and water homeostasis (Brezis and Rosen 1995). Some studies have shown that the renal medulla has a greater capacity to generate NO and NO synthase than the renal cortex (Terada et al. 1992; McKee et al. 1994; Mohaupt et al. 1994; Shin et al. 1999,2000). In addition to NOS, ANP mRNA expression in renal medulla was markedly increased, whereas renal cortical ANP mRNA showed no significance in water-deprived rat kidney compared to that of the normal rats (Shin et al. 1998). In the present study, 5.5-fold and 3.5-fold increases of ANP mRNA in the outer and inner medulla of diabetic rat kidneys were found, whereas only a 1.8-fold increase is found in renal cortex in comparison to the corresponding values of normal rats. By using in situ hybridization, ANP mRNA signal in PST, MTAL, DCT, and medullary collecting ducts of diabetic rats were significantly increased after the induction of diabetes. Our findings that renal medullary ANP synthesis was significantly enhanced in diabetes strongly indicates that ANP synthesis in the renal medulla may play a more important role than renal cortex in the local regulation of renal function under conditions of hyperglycemia and hyperosmolality in diabetes.
In summary, our results demonstrate that the cellular distribution of ANP mRNA and ANP-like immunoreativity in PST, MTAL, and medullary collecting ducts was clearly enhanced in diabetic rat kidneys. This study indicates that increases in ANP synthesis in these nephrons may participate in renal adaptation to hyperglycemia and hyperosmolality in diabetes.
Footnotes
Acknowledgements
Supported by grants NSC-89–2314–B037–157 from the National Science Council and RE86M018C for Dr. Feng-Jie Lai from the National Health Research Institutes in Taiwan.
We are grateful to C.-L. Chen and S.-J. Lee for expert technical assistance.