
Abstract
We studied the immunoreactivity of 12 different region-specific antibodies to the chromogranin A (CgA) molecule in the various neuroendocrine cell types of the human gastrointestinal (GI) tract by using double immunofluorescence techniques. These staining results were compared with others obtained with a commercial monoclonal CgA antibody (LK2H10). G (gastrin)-cells showed immunoreactivity to virtually all region-specific antibodies, but with varying frequency. Most intestinal EC (enterochromaffin)- and L (enteroglucagon)-cells were immunoreactive to the antibodies to the N-terminal and mid-portion of the CgA molecule, whereas the EC-cells in the stomach reacted with fewer region-specific antibodies. D (somatostatin)-cells reacted to the CgA 411–424 antibody and only occasionally showed immunoreactivity to the other CgA antibodies. A larger cytoplasmic area was stained with the antibodies to CgA 17–38 and 176–195 than with the other antibodies tested. These differences in staining pattern may reflect different cleavage of the CgA molecule in different cell types and at different regions of the GI tract.
Keywords
H
Materials and Methods
Tissue specimens from adult human gastric corpus and antrum, proximal duodenum, distal ileum, and sigmoid colon were obtained from surgical samples removed at surgeries for adenocarcinoma. The specimens examined were taken from macroscopically normal mucosa at least 3–5 cm from the neoplasm; all showed normal microscopic structure.
The tissue specimens were fixed in 10% buffered neutral formalin for 18–20 hr at RT, followed by routine processing to paraffin. Sections 5 μm thick were cut and attached to poly-
The sections were stained with hematoxylin–eosin or immunostained to demonstrate the presence of various parts of the CgA molecule. The streptavidin–biotin complex (ABC) technique (Hsu et al. 1981), with diaminobenzidine as chromogen, was applied as a single immunostain mainly to reveal the distribution pattern of NE cells in the respective GI regions and to perform the control stainings specified below.
Co-localization studies were performed with the present CgA region-specific antibodies and either antibodies to various secretory granule hormones or a commercial MAb CgA. In these co-localization studies, immunofluorescence methods were used. For double immunofluorescence staining, the sections were incubated with a cocktail of two antibodies, either one MAb and one polyclonal antibody or two polyclonal antibodies (anti-rabbit and/or anti-guinea pig), overnight at RT, followed by incubations in biotinylated swine anti-rabbit IgG, 30 min at RT, and a mixture of streptavidin-Texas Red and fluorescein isothiocyanate (FITC)-conjugated goat anti-mouse or anti-guinea pig IgG. Before application of the respective primary antibodies, the sections were incubated with non-immune serum from the animal species producing the secondary antibodies, at a dilution of 1:10.
The CgA region-specific antibodies used are characterized in Table 1. The selected sequences for the respective peptides are shown in Figure 1. For details of the production and characterization of the CgA region-specific antibodies see Portela-Gomes and Stridsberg (2001). The other primary antibodies were mouse MAbs against human chromogranin A (Boehringer-Mannheim; Mannheim, Germany, clone LK2H10), glucagon/glicentin and somatostatin (Novo Nordisk, Bagsvaerd, Denmark; clones Glu-001 and Som-018, respectively), and serotonin (Medicorp, Montreal, PQ, Canada; clone YC5/45), and polyclonal guinea pig antibodies against human gastrin (EuroDiagnostica, Malmö, Sweden; code no. B-GP360-1). The working dilutions for immunofluorescence were 1:20, 1:20, 1:80, 1:20, and 1:240, respectively.
The labeled secondary antisera were biotinylated swine anti-rabbit IgG (DAKO; Glostrup, Denmark), Texas Red-labeled streptavidin (Vector Laboratories; Burlingame, CA), and FITC-conjugated goat anti-mouse and anti-guinea pig IgG (Sigma Chemical; St Louis, MO).
Chromogranin A region-specific antibodies used; all antibodies were raised in rabbit
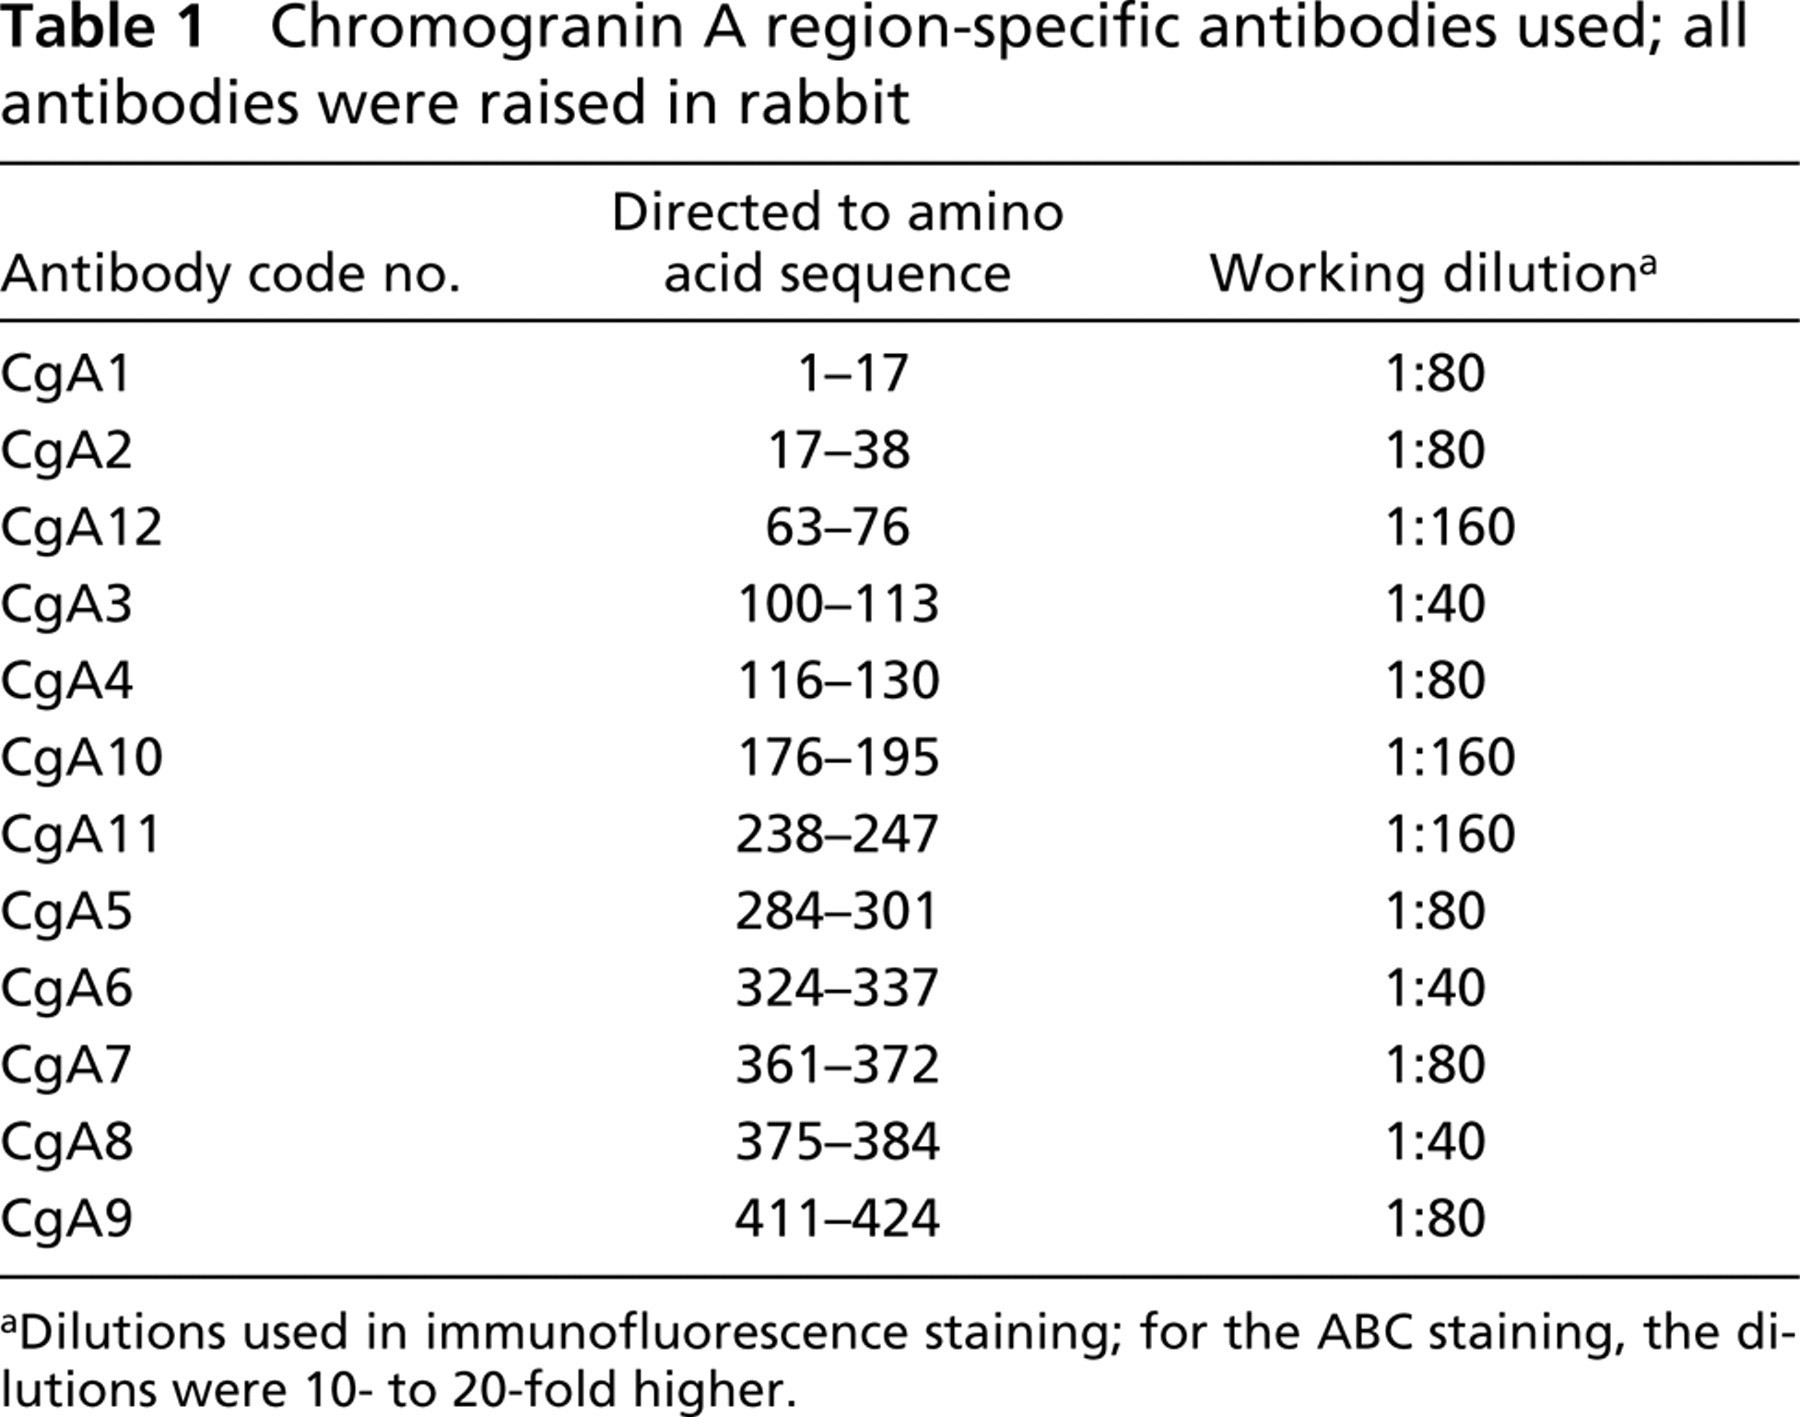
aDilutions used in immunofluorescence staining; for the ABC staining, the dilutions were 10- to 20-fold higher.
The control stainings included (a) omission of the primary antiserum, (b) replacement of the first layer of antibody by non-immune serum 1:10 and by the diluent alone, and (c) pre-incubation (24 hr) of primary antiserum with the relevant antigen (10 nmol per ml diluted antibody solution) before application to the sections. The secondary antibodies were tested in relation to the specificity of the species in which the primary antibodies had been raised, the secondary antibody in question being replaced by secondary antibodies from different animal species. These control tests were performed with ABC (single staining) and immunofluorescence techniques (co-localization studies).
For co-localization studies, the sections were examined in a Vanox AHBS3 fluorescence microscope (Olympus; Tokyo, Japan) equipped with filters (Olympus) giving excitation at wavelengths of 475–555 nm for Texas Red (filter no. 32821, dichroic mirror BH2-DMG), and 453–488 nm for FITC (no. 32822, BH2-DMIB), and a double-band filter set (no. 39538, BH2-DFC5) for simultaneous visualization of Texas Red and FITC-labeled cells was also used (excitation at 550–570 nm and 480–495 nm, respectively). Photographs were taken with Fujicolor 400 film.
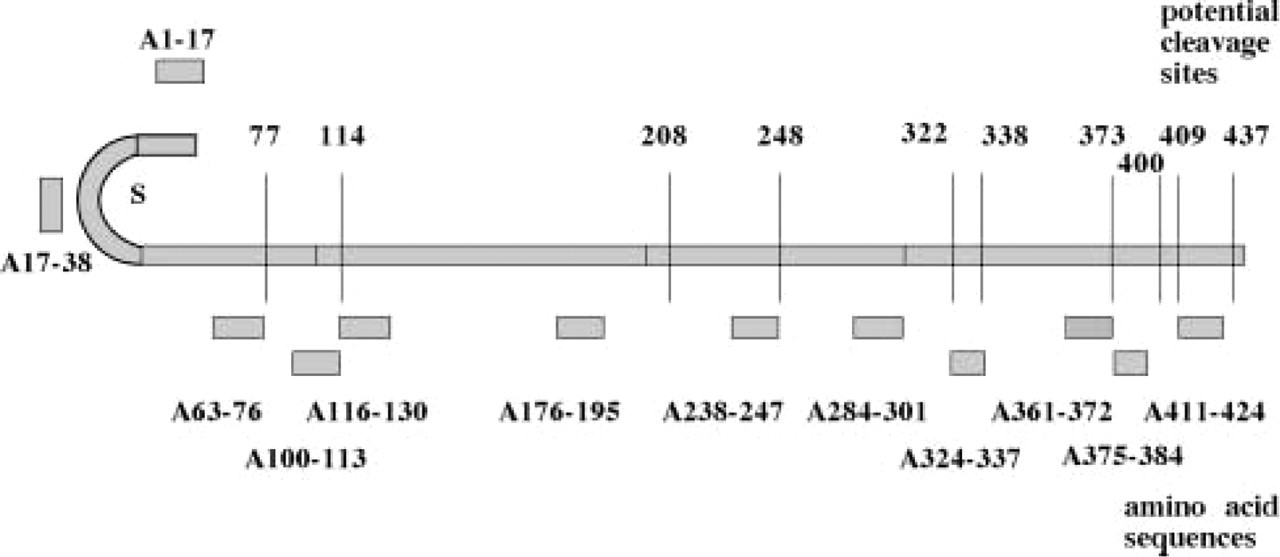
Schematic representation of the human chromogranin A molecule, with the amino acid sequences of the twelve peptides used for raising antibodies placed in the appropriate positions (A1–17 to A411–424). The disulfide bridge (S) is shown on the N-terminal. The 10 potential cleavage sites (first amino acid of the dibasic pair) are indicated by vertical lines (figures indicate positions 77–437). From Portela-Gomes and Stridsberg, 2001, with permission.
Results
The antibodies to the different CgA antigens gave rise to various staining patterns in the GI tract. The intensity of the immunoreactivity was strong with antibodies to CgA 17–38, 176–195, and 238–247, and weak to moderate with the others. Furthermore, a larger cytoplasmic area was stained with the antibodies corresponding to the sequences 17–38 and 238–247 in the antrum and to 176–195 in most cells at all GI levels, compared with the other region-specific antibodies, which immunostained mainly the infranuclear region. This difference was most apparent with the antibody to 176–195 in the serotonin (enterochromaffin, EC) cells of the antrum and duodenum. The staining intensity with the region-specific antibodies was enhanced by microwave pretreatment but the frequency was not affected except for the CgA 361–372 antibody. The latter visualized few or no cells without this pretreatment but a moderate number afterwards.
Immunoreactivity of the Different CgA Region-specific Antibodies in the Different Endocrine Cell Types (Table 2)
G-cells. The frequency of the antral G-cells displaying immunoreactivity to the different region-specific antibodies varied. The two N-terminal and the two C-terminal antibodies, as well as two mid-portion antibodies (CgA 176–195 and 238–247) stained a majority of G-cells (Figure 2), whereas the remaining antibodies stained either few or no cells.
EC-cells. The serotonin-producing EC-cells also showed a varying immunoreactive pattern with the region-specific antibodies. In the corpus, virtually all EC-cells displayed immunoreactivity to CgA 100–113 and 176–195. In the antrum, only six antigens were detected, i.e., CgA 1–17, 17–38, 100–113, 176–195, 284–301, and 324–337 (Figure 3). The CgA 17–38 antibody was detected in virtually all EC-cells, the others only in a few to a moderate number of cells. In the duodenum, ileum, and colon, vitually all EC-cells were immunoreactive to the N-terminal and mid-portion antibodies. However, no immunoreactive cells were observed at any GI region with the region-specific antibodies to CgA 361 to the C-terminus, with one exception—a few cells in the corpus showed immunostaining with the antibody to 375–384.
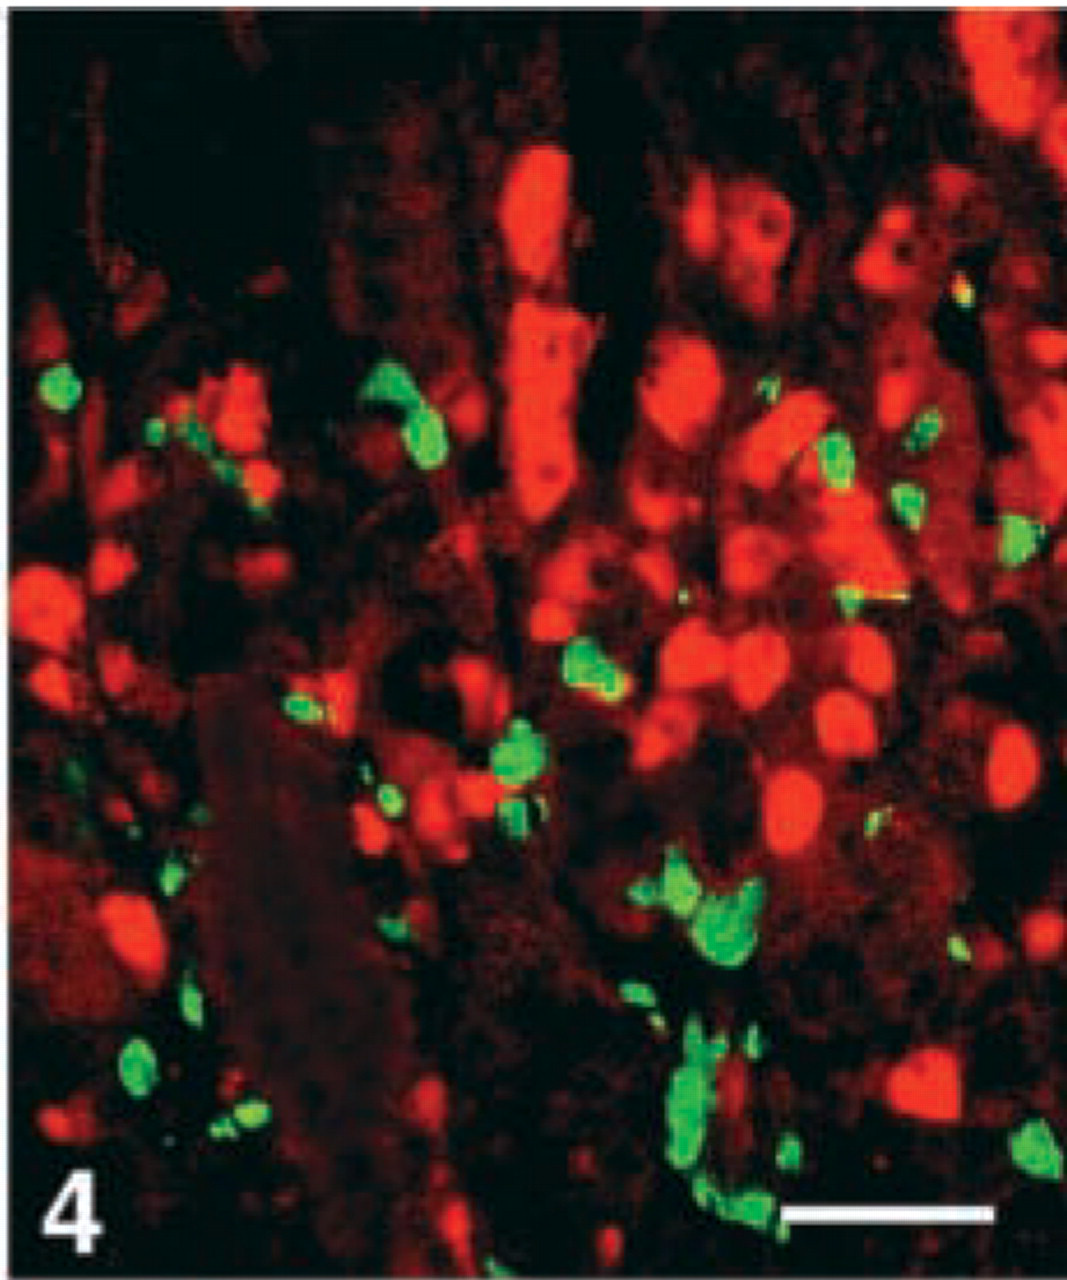
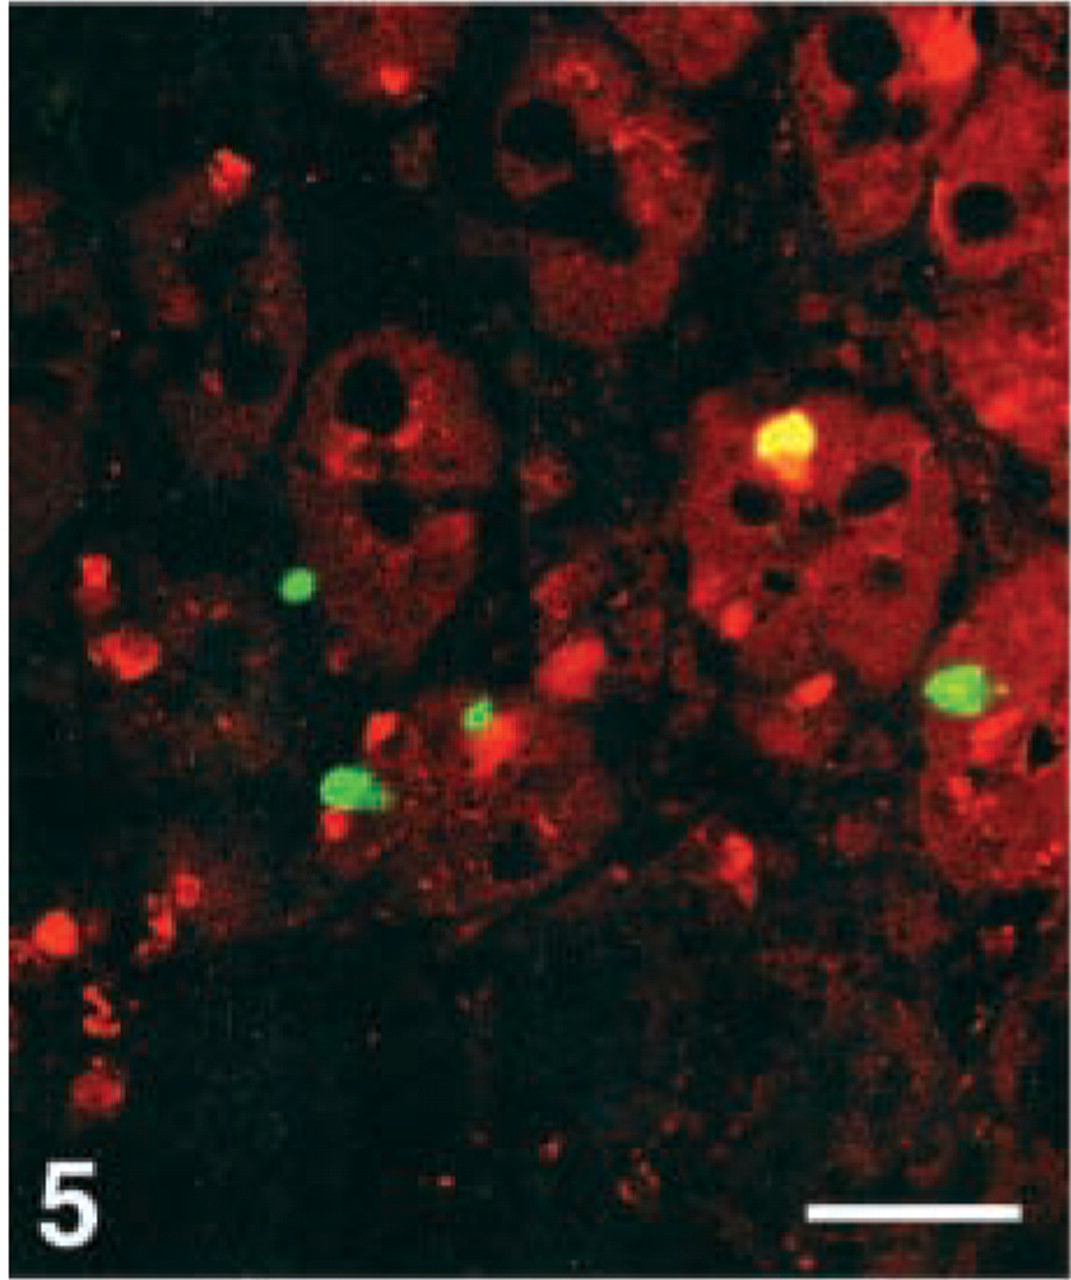
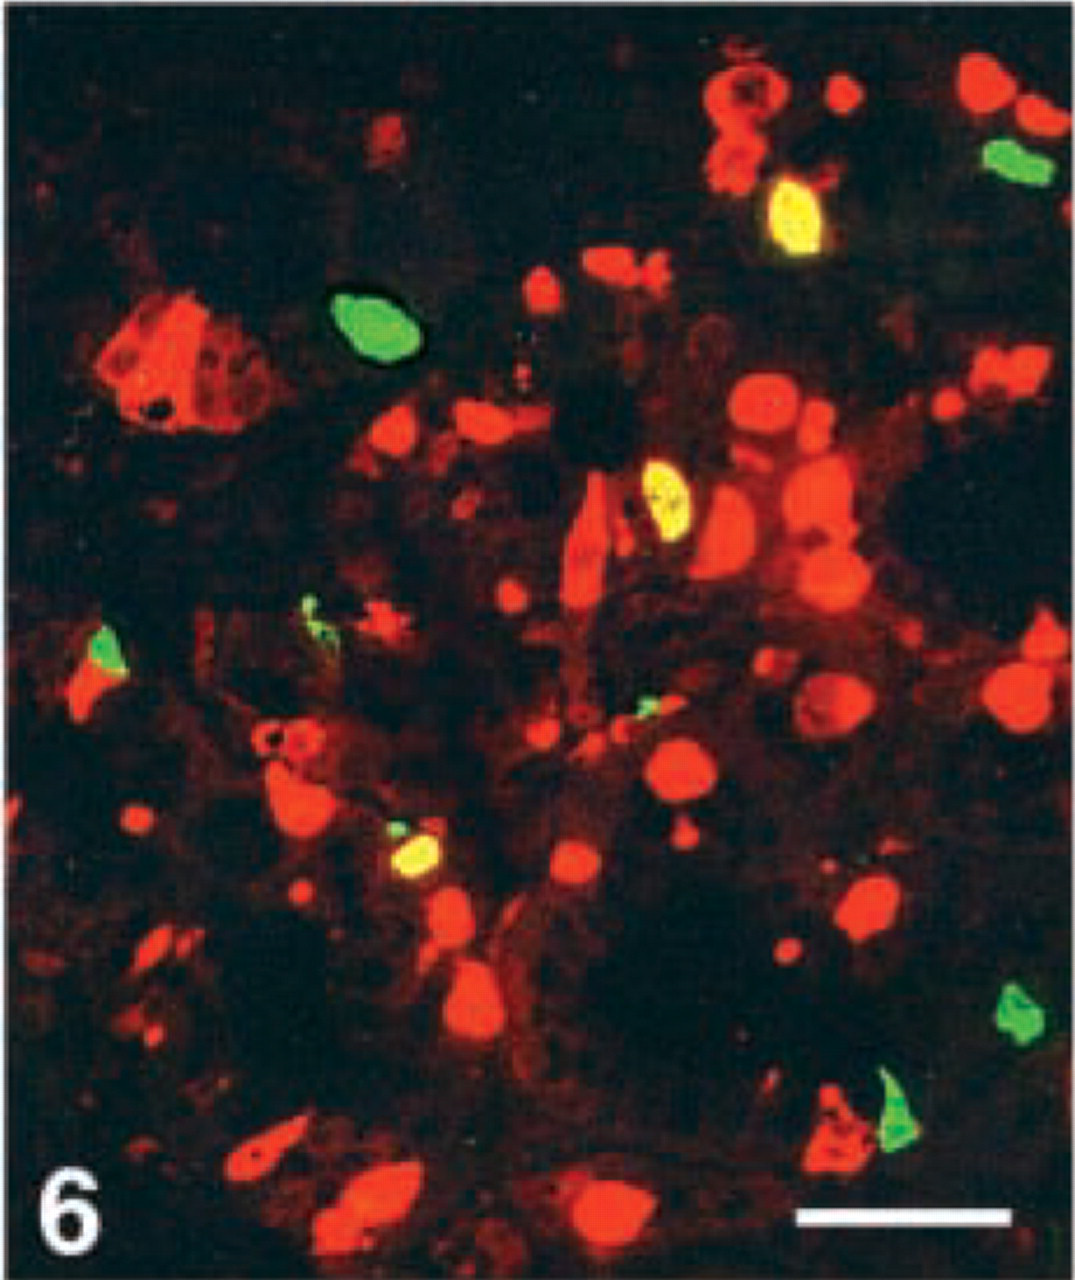
D-cells. Virtually all D-cells in the corpus, a moderate number in the duodenum, but very few at the remaining GI levels, were stained with the CgA 411–424 antibody. Few D-cells in the duodenum displayed immunoreactivity with four antibodies, i.e., CgA 17–38, 100–113, 176–195, and 324–337, whereas this cell type was virtually nonreactive to all the other region-specific antibodies in the GI tract (Figures 4–7).
Co-localization of chromogranin A-related peptides in the human gastrointestinal neuroendocrine cells, using region-specific antibodies a
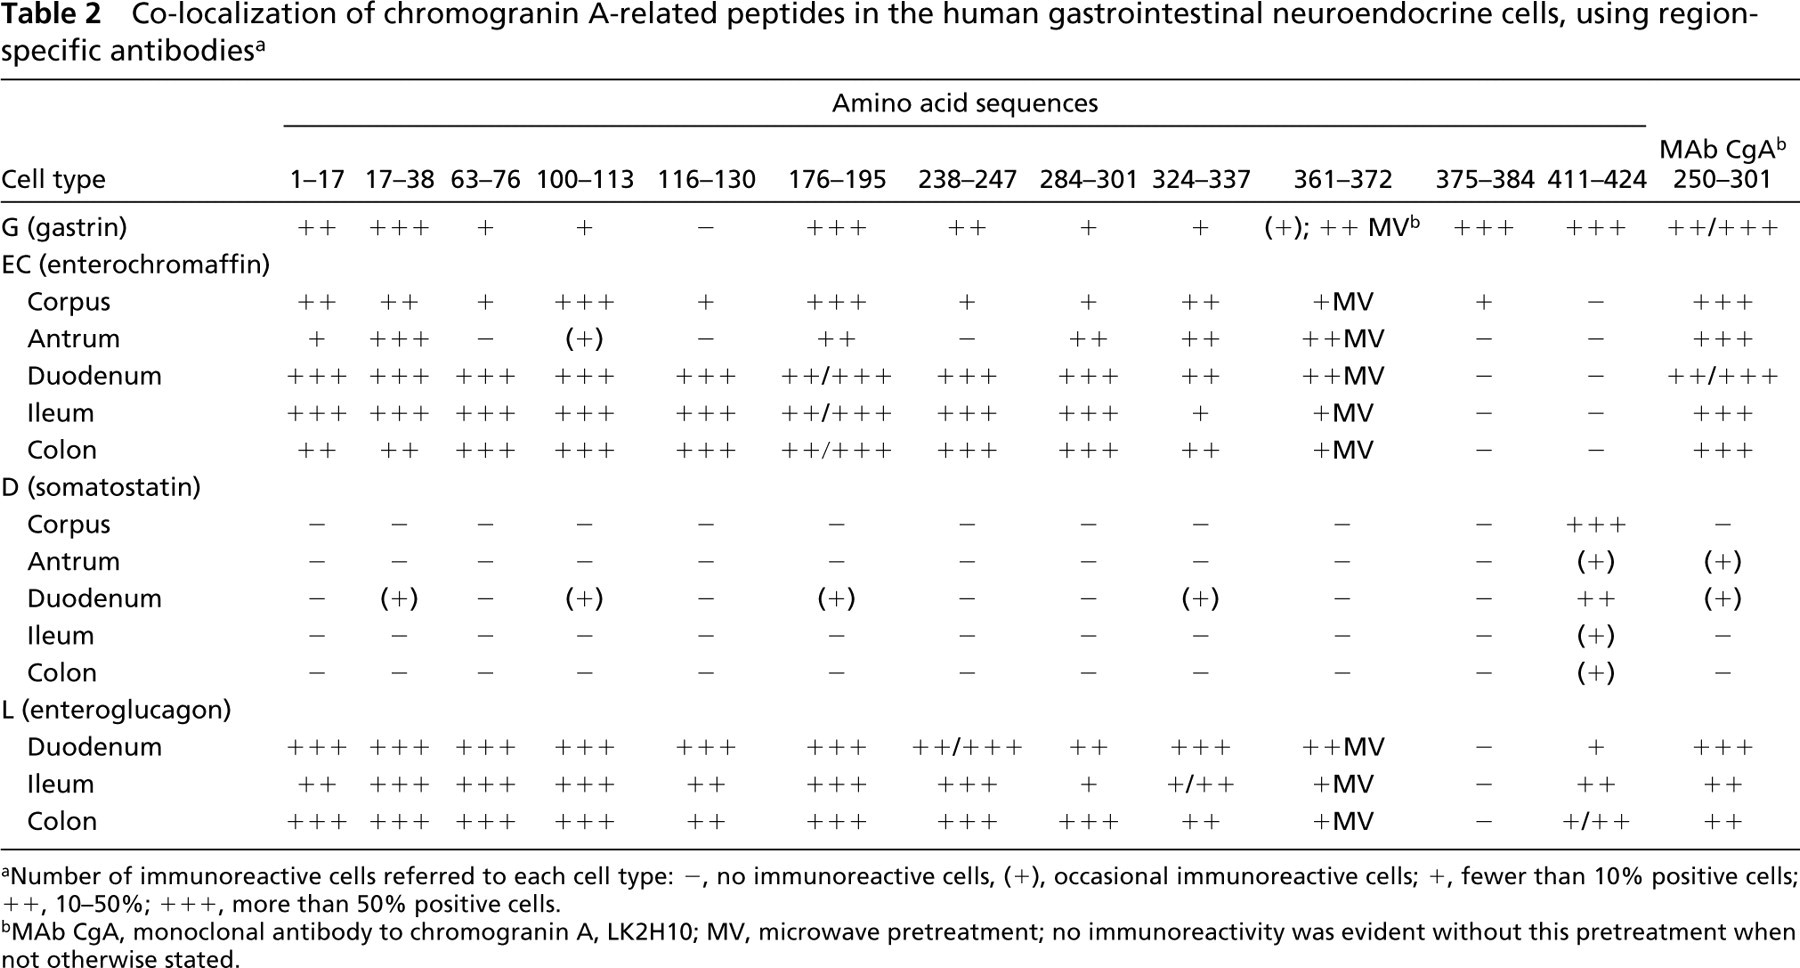
aNumber of immunoreactive cells referred to each cell type: -, no immunoreactive cells, (+), occasional immunoreactive cells; +, fewer than 10% positive cells; ++, 10–50%; +++, more than 50% positive cells.
bMAb CgA, monoclonal antibody to chromogranin A, LK2H10; MV, microwave pretreatment; no immunoreactivity was evident without this pretreatment when not otherwise stated.
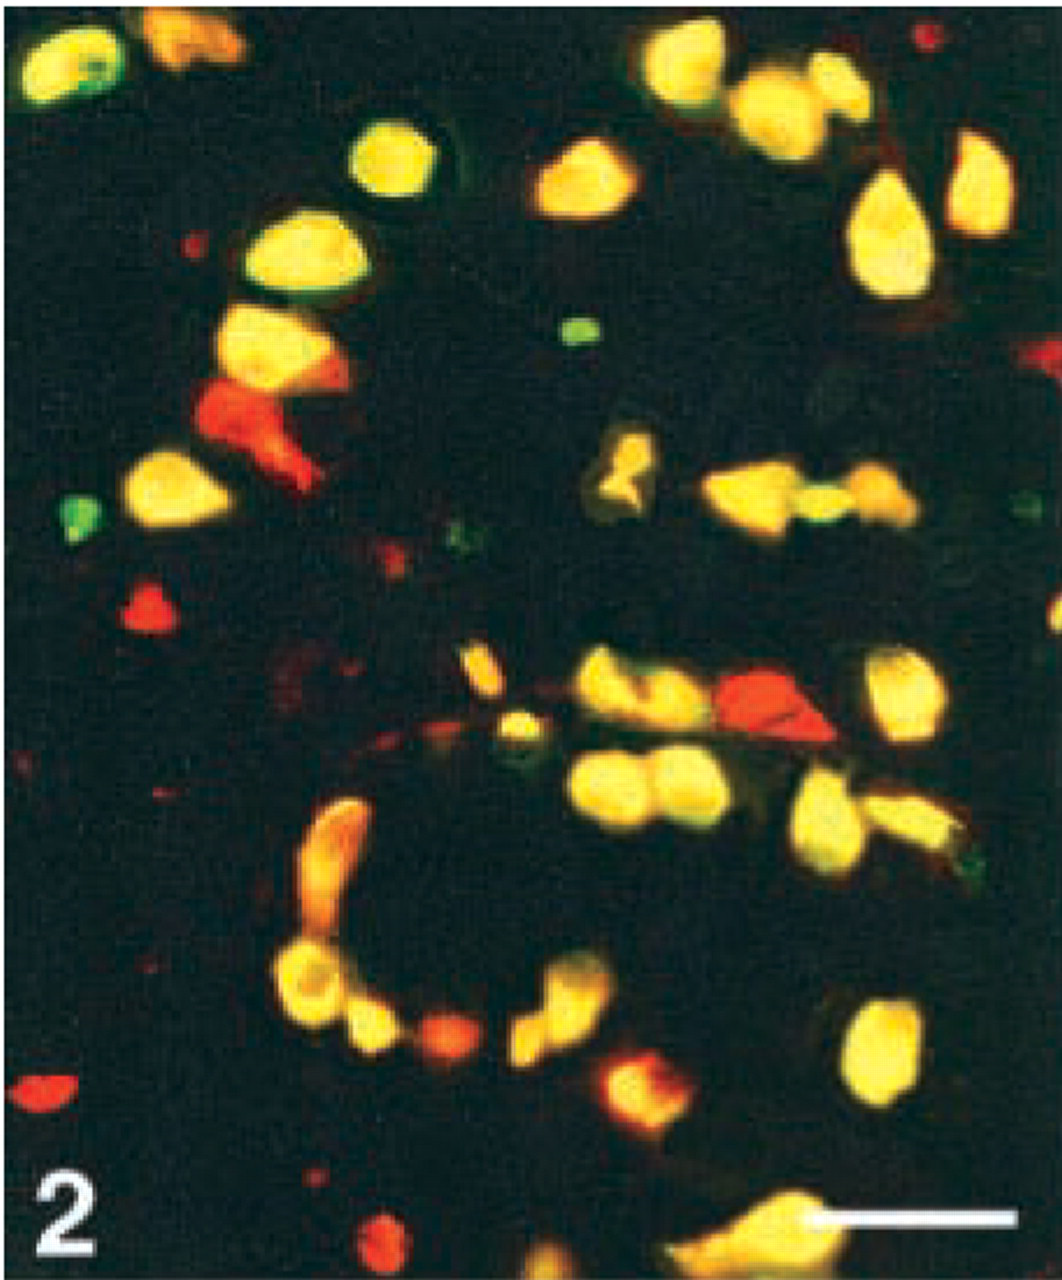
Human antrum, double immunostained for gastrin (FITC) and CgA 176–195 (Texas Red). Co-localization, illustrated by the yellow color (double-band filter set), shows immunoreactivity to this CgA antigen in all gastrin cells. Bar = 80 μm.
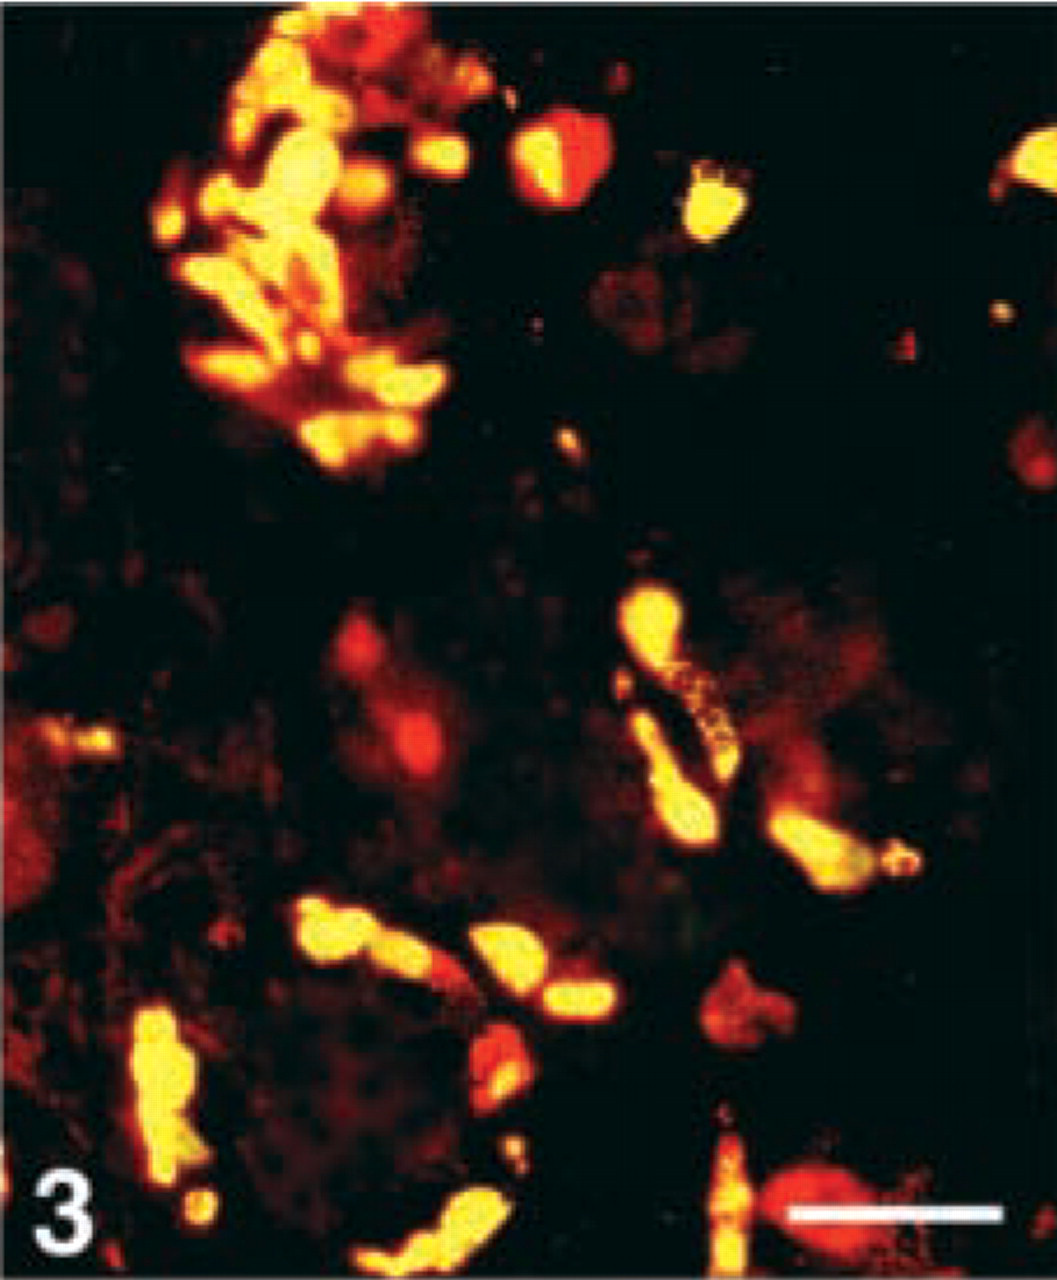
Human antrum, double immunostained for serotonin (FITC) and CgA 176–195 (Texas Red). Yellow color reflects co-localization of this CgA antigen in the serotonin-producing enterochromaffin cells. Bar = 80 μm.
Human antrum, double immunostained for somatostatin (FITC) and CgA 116–130 (Texas Red), showing that somatostatin and this CgA antigen appear in different cells. Bar = 100 μm.
Human duodenum, double immunostained for somatostatin (FITC) and CgA 17–38 (Texas Red), showing co-localization of these two peptides in only one cell (yellow). Bar = 100 μm.
Human duodenum, double immunostained for somatostatin (FITC) and CgA 176–195 (Texas Red). This CgA antigen is demonstrated in three somatostatin cells (yellow). Bar = 80 μm.
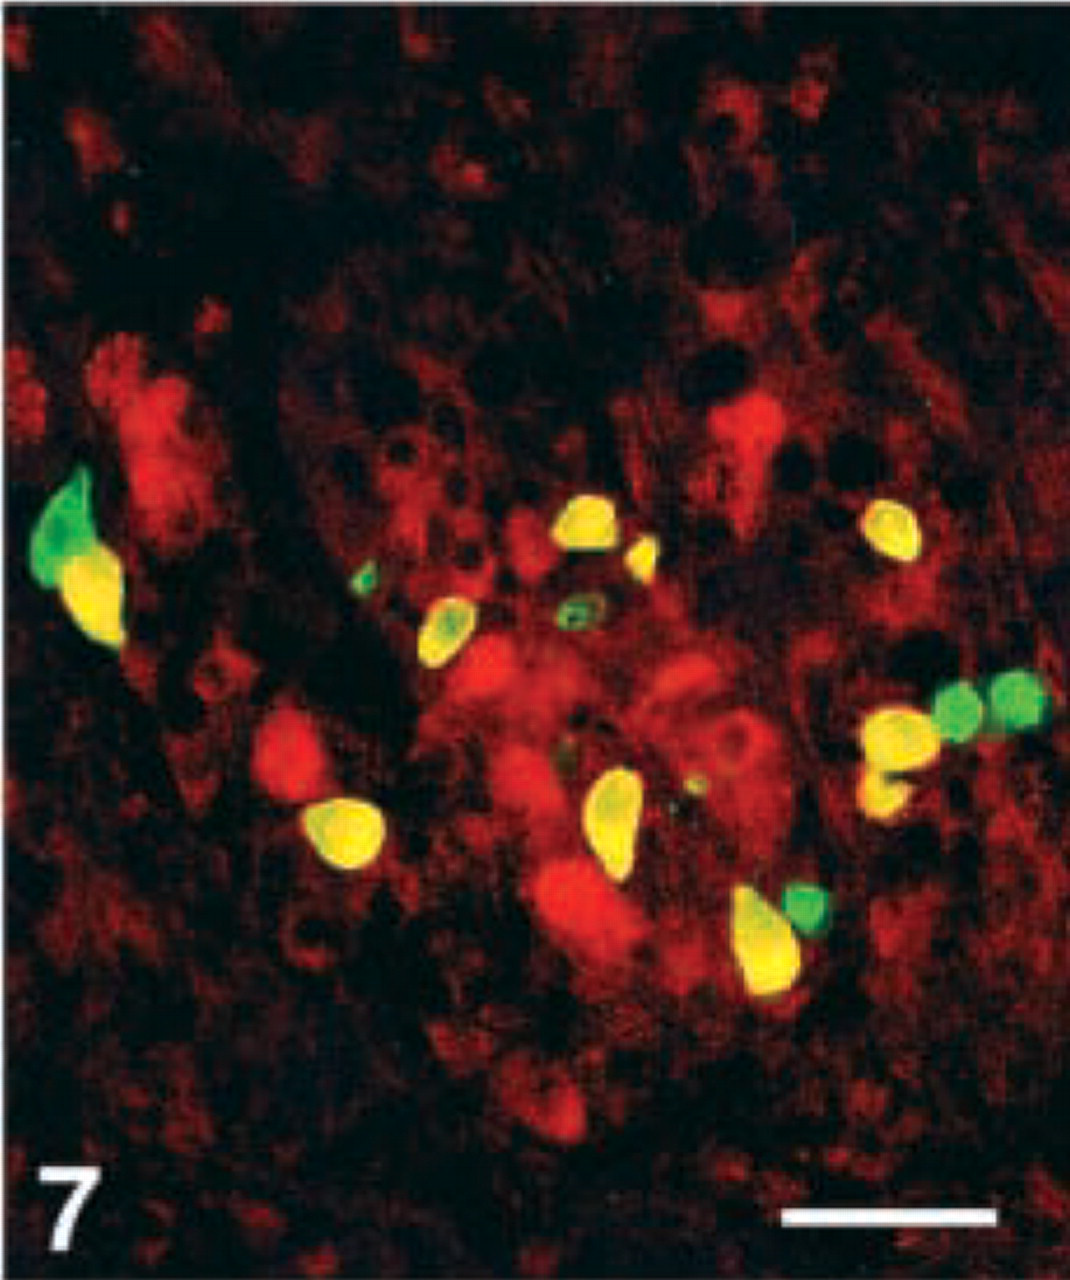
Human corpus, double immunostained for somatostatin (FITC) and CgA 411–424, showing that most somatostatin cells are immunoreactive for this CgA antigen (yellow). Bar = 80 μm.
Human antrum, double immunostained for (
L-cells. L-cells in all regions of the intestinal tract were immunoreactive to all region-specific antibodies except two, whose epitopes are localized between the sequence 361–384. The C-terminal antibody stained fewer cells compared with the other antibodies.
Immunoreactivity to MAb CgA
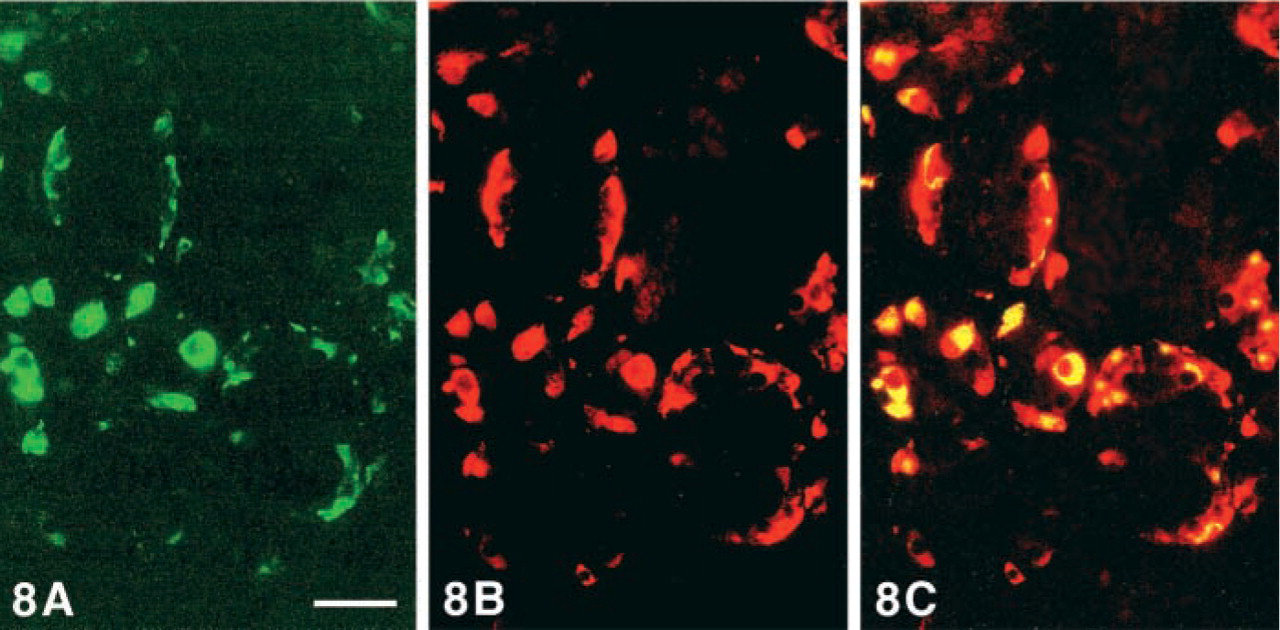
MAb CgA immunostained G-, EC-, and L-cells but only exceptionally D-cells (Figure 8).
Discussion
The human GI tract contains several NE cell types, most of which display CgA immunoreactivity with the commercial MAb CgA (LK2H10; Portela-Gomes et al. 1977). The present study is the first investigation of the human GI tract regarding the expression of various regions of the CgA molecule related to the different NE cell types.
The immunoreactive patterns varied markedly in the different NE cell types. A similar variation with our region-specific antibodies had also been found in the human endocrine pancreas (Portela-Gomes and Stridsberg 2001). Norlén et al. (2001) also reported a variation in immunoreactivity with their region-specific antibodies in the NE cells of the rat stomach. These authors found two fragments specifically related to a particular cell type: CgA 316–329 (WE-14) only in G-cells and CgA 291–319 only in D-cells. In our study, however, none of the antibodies was exclusively related to any particular cell type, although selectivity was observed with the antibody to 375–384, which stained virtually all antral G-cells and a few EC-cells in the corpus, but no other cell in the GI tract. None of our region-specific antibodies immunostained all NE cell types. On the whole, the antibodies to CgA 176–195 (chromacins) and 17–38 (C-terminal vasostatins) visualized more NE cells at all GI regions than did the other antibodies. The commercial MAb CgA (LK2H10), whose epitope was localized in the N-terminal pancreastatin sequence 250–284 (Portela-Gomes and Stridsberg 2001), stained roughly as many cells as the antibodies to CgA 176–195 and 17–38. These two antibodies were more immunoreactive and also stained a larger cytoplasmic area than the other antibodies tested. Recently, antibacterial and anti-fungal effects for both vasostatins and chromacins have been reported (Strub et al. 1996; Lugardon et al. 2000). These peptides may therefore have an antibacterial function in the GI tract. The finding in the present study may be related to the antibacterial role of these two CgA regions.
The G-cell type displayed immunoreactivity to all but one of the CgA region-specific antibodies (116–130), but the frequency of the immunostained cells with the various region-specific antibodies varied from virtually all to very few. It is unknown whether these variations may be related to different molecular forms of gastrin or to different functional states of the cell. However, these variations may reflect a different expression of PCs. PC2 is responsible for the generation of gastrin-17, but the cleavage specificities of PC1/3 and PC5, also found in G-cells, are not known (Scopsi et al. 1995; Macro et al. 1997).
D-cells expressing CgA 411–424 occurred at all regions of the human GI tract, but the immunoreactive cell fraction varied; this cell type was mostly unreactive with the other antibodies. These results differed from those reported by Norlén et al. (2001), who found most CgA antigens in this cell type in the rat stomach. This disparity can be attributed to species differences in the expression of CgA or somatostatin. Our earlier results concerning the detection of this CgA antigen in human pancreatic islets (Portela-Gomes and Stridsberg 2001) are consistent with the findings in the GI tract. Smaller somatostatin molecular forms, which are generated by PC2, PC1/3, and PACE4, predominate in antral and pancreatic D-cells, whereas higher molecular forms, generated by PACE4 and furin, occur in intestinal D-cells (Skak-Nielsen et al. 1987; Francis et al. 1990; Brakch et al. 1995). The similarities found between the processing of CgA in pancreas and in the GI tract, unrelated to the molecular forms of somatostatin that occur in different GI regions, may indicate a physiological importance of CgA 411–424.
EC-cells displayed a different staining pattern in the stomach and intestine, with the stomach expressing fewer CgA antigens than the intestine. Most EC-cells in the corpus were immunostained by only two antigens (100–113 and 176–195) and in the antrum by one (17–38). In the intestine, most EC-cells were stained with the N-terminal and mid-portion antibodies, whereas the C-terminal antibodies did not give rise to any immunoreactivity.
The intestinal L-cells showed a pattern similar to the EC-cells at the same level of the intestinal tract. However, the expression of CgA epitopes in the L-cells did not exactly match the CgA expression in pancreatic glucagon (A)-cells (Portela-Gomes and Stridsberg 2001). The genes encoding for enteroglucagon in intestinal L-cells and glucagon in pancreatic A-cells are identical, and the translated pre-pro-glucagon molecule is identical in both cell types (Bell et al. 1983). However, the processing differs in the two cell types, which gives mainly glicentin and GLP-1 in the L-cells and glucagon in the A-cells. This difference in post-translational processing is probably mediated by different expression of PCs, and it has been shown that PC1/3 is important for the generation of GLP-1 and that PC2 is essential for generation of glucagon (Creemers et al. 1998). Because these enzymes also can act on CgA, a different expression of the CgA peptides could be expected. Compared to our previous study of expression of CgA epitopes in human pancreatic islets (Portela-Gomes and Stridsberg 2001), we found that the CgA sequences 116–130 and 238–247 were strongly expressed in L-cells but absent in pancreatic A-cells and, conversely, the CgA sequence 375–384 is expressed in A-cells but absent in L-cells. These differences are probably the result of different expression of PCs in the different cell types.
ECL (enterochromaffin-like)-cells are a type predominating in the corpus, not specifically identified in the present study. However, the immunoreactive cells that were visualized by the region-specific antibodies and nonreactive to the serotonin antibodies were most likely ECL-cells. On the whole, the frequency of CgA-immunoreactive cells not showing serotonin immunoreactivity parallels that of EC-cells.
The variations, both in number of immunoreactive cells and in intensity of immunoreactivity, reflect the available epitopes and raise the possibility that the pattern of CgA epitopes might be the result of cell function. The negative or weak immunoreaction may indicate that the CgA antigens were too few to be detected or that the epitopes were masked either by other granule-related proteins or by the histological processing. A certain masking effect was apparent, because microwave pretreatment increased the staining intensity but did not influence the quantitative results except for CgA 361–372. Staining with the latter antibody appeared positive only after this pretreatment. A further explanation for the various staining patterns could be that the CgA molecule is cleaved by different processing enzymes, particularly prohormone convertases (PC2, 1/3), but also by carboxypeptidases and amidating enzymes (Eskeland et al. 1996; Kimura et al. 2000). CgA-derived peptides, circulating or in tissue extracts, have been reported, strongly supporting the latter suggestion (Stridsberg et al. 1995; cf. Helle et al. 2001).
In conclusion, this study shows that different cell types at various regions of the GI tract demonstrate to various extents epitopes of the 12 CgA region-specific antibodies, which may indicate processing of the CgA molecule, giving rise to several peptides of possible functional significance.
Footnotes
Acknowledgements
Supported by a grant from the Swedish Cancer Foundation and the Ihres Fund.
We thank Professor Lars Grimelius, Uppsala, for fruitful discussions and laboratory facilities.