
Abstract
The status of the Golgi complex in normal vs osteoarthrotic (OA) cartilage has not yet been studied. A monoclonal antibody, MAb 58-K-9, allowed scoring of Golgi labeling intensity. In addition, ultrastructural assessment enabled us to focus on the distribution and relation between the endoplasmic reticulum (ER) and Golgi membranes. The study was performed in both normal and partially menisectomized OA-induced rat cartilage 20 and 45 days after surgery. Comparing Golgi immunolabeling intensities (mean ± SEM) revealed a highly significant difference between normal (9.98 ± 1.25), 20-day (2.49 ± 0.34), and 45-day (0.82 ± 0.22) cartilage. Moreover, chondrocytes from normal cartilage displayed 71.18% of labeling intensity in contrast to OA cartilage, in which chondrocyte labeling intensities were 24.95% (20 days) and 8.11% (45 days). OA chondrocytes appeared to display an overall reduction in Golgi labeling intensity, suggesting disruption of this organelle as the OA damage progressed. Interestingly, many 20-day OA-induced chondrocytes exhibited bubble-like Golgi immunolabeling compartmentalizing the cytoplasm, concomitant with putative apoptotic nuclear changes. At the same time, OA chondrocytes with a typical ultrastructural apoptotic pattern revealed a prominent ER gathered together with Golgi vesicles and saccules, also appearing to compartmentalize chondrocyte cytoplasm. We speculate about the role of Golgi modifications and apoptosis in OA pathogenesis.
T
Changes in Golgi articular cartilage have been reported in connection with the secretion of extracellular matrix components (Martinez et al. 1977; Wong Palms and Plaas 1995), drug effects (Moskalewski et al. 1975; Annefeld 1985; Stevens et al. 1985), during development (Segawa et al. 1988), and in clustered chondrocytes from a papain-induced cartilage defect in an experimental model (Scheck et al. 1975). However, Golgi modifications during the progression of rat surgically OA-induced cartilage damage has not been assessed. It has also been reported that OA chondrocytes substantially increase the synthesis of matrix degradative enzymes over that of their inhibitors, such as metalloproteases (Martel-Pelletier et al. 1994; Abbud and Kouri 2000) and alkaline phosphatase, during subchondral bone remodeling (Kouri et al. 2000). Therefore, it is reasonable to presume that the Golgi might play an important role in this process.
In this study we assessed the distribution of Golgi components in chondrocytes from normal cartilage and in an OA-induced rat model (Abbud and Kouri 2000), using immunofluorescence and electron microscopic procedures. OA induction was accomplished by partial menisectomy, and the study was performed on cartilage at 20 and 45 days after surgery. We found that labeling intensity, carried out with the anti-Golgi monoclonal antibody MAb58-K-9, decreased as cartilage damage progressed. Golgi labeling showed an irregular distribution in cartilage from different anatomic locations, and displayed a distinctive arrangement in certain chondrocytes. These changes were concomitant with nuclear condensation and fragmentation. Our results suggest that Golgi modifications observed in the experimental model might be linked to OA pathogenesis. We speculate that these changes may be related to apoptotic chondrocyte death.
Materials and Methods
Tissue Sampling
Knee condyles from three normal Wistar rats (approximately 150 g) and six rats with OA induced by partially menisectomy (20 and 45 days after surgery) were included in this study. The surgical procedure for inducing OA cartilage changes has been described elsewhere (Abbud and Kouri 2000). Animal experimental procedures followed the National Research Guidelines.
Full-thickness cartilages were fixed with 4% PBS-paraformaldehyde at 4C from 4 to 12 hr, cryosectioned (Leica cryostat CM 1100; Heerbrugg, Switzerland), and mounted on gelatin-coated slides. Then they were hydrated for 10 min in PBS and treated with 0.2% Triton X-100 in PBS (PBS-T) for 10 more min. Pre-incubation was achieved with 0.2% IgG-free bovine albumin serum (Sigma Chemical; St Louis, MO) for 20 min at room temperature (RT). Sections were then incubated overnight at 4C with an anti-Golgi MAb 58-K-9 (1:200; Sigma Chemical), followed by FITC-tagged anti-mouse IgG (1:250; Vector Laboratories, Burlingame, CA) for 1 hr at RT. Two negative controls were performed, one consisting of the omission of the primary MAb and the other by the use of an anti-Tau MAb 423 (1:60; provided by C.M. Wischk, Brain's Bank, Cambridge, UK). This marker is found only in the nervous system. No labels were observed in the two negative controls. Positive controls were performed on rat pancreatic acinar tissue. To avoid propidium iodide cytoplasmic RNA staining, 1-hr 4% paraformaldehyde-PBS-fixed tissues were pretreated with ammonium chloride (50 mM) for 10 min and hydrochloride acid (1 M) for 2 hr. Some samples did not receive any previous treatment. In all samples, nuclei were counterstained with propidium iodide for 5–10 min (1:1000; Vector Laboratories) and coverslipped in Vectashield mounting medium (Vector Laboratories). The double-labeled sections were viewed with a X60 (NA 1.4) oil immersion objective on a Nikon microscope with attached confocal system (Bio-Rad MRC-60; Watford, UK). Samples were excited with a kryton-argon laser in green (blue exciter filter, 418 nm) and red (green exciter filter, 514 nm). From each area, seven to 15 serial optical sections (0.5–1 μm thick) were collected using the dual-channel image system. Projected images were stored on a compact disk. For MRC/Cas statistical analysis, micrographs were observed with a X20 objective lens, always with the same setting.
Ultrastructural study of Golgi components was accomplished in at least three thin sections obtained from three 2.5% glutaraldehyde-cacodylate fixed samples of OA cartilage. The samples were processed, mounted on a formvar-coated one-hole grid, stained with uranyl acetate and lead citrate as described elsewhere (Kouri et al. 2000), and observed with a transmission electron microscope (JEM-2000 EX; Tokyo, Japan).
Statistics
Semi-quantitative analysis. To determine Golgi immunola-beling in the different zones of the cartilage, confocal micrographs were used to count the number of immunolabeled chondrocytes in each cartilage zone (superficial, middle, deep). The analysis was performed in cartilage from nine different animals (three normal, three OA 25 days, and three OA 45 days). Three sections from each animal were obtained and three different fields from each section were photographed. Golgi-labeled chondrocytes were scored on micrographs with the same magnification. The tissues were divided into three previously defined zones as follows: superficial (approximately 1–2 mm from the surface of the cartilage), deep zone (approximately 2–4 mm from the subchondral bone), and middle zone, located between the preceding ones. Two different staff members carried out the semiquantitative procedure and the results were then compared. The labeling ranking used to score the number of Golgi labeled chondrocytes is shown in Table 1.
Quantitative Score of Labeling Intensity. To quantify Golgi labeling (FITC) and nuclear staining (propidium iodide) intensities, we scanned, always using the same magnification, three randomly picked microscopic fields from three different sections from cartilage of three different normal rats and three OA-induced rats (20 and 45 days after surgery). A total of three sections and roughly nine microscopic fields were scored per animal. Immunofluorescence intensity scoring was possible by means of MRC/Cas software used with the confocal microscope. Only average nuclear red fluorescence intensity (R) and green Golgi immunofluorescence (G) were considered. The mean ± SEM from all the measurements was calculated.
Statistical Analysis
The statistical analysis was performed using the Tukey-Kramer multiple comparison test. The percentage of Golgi immunolabeling was also determined, considering the nuclear staining intensity as the total number of chondrocytes in each field and the green labeling intensity as Golgi. A simple equation was applied: G/R × 100 = %.
Semi-quantitative analysis of chondrocytes with Golgi-positive cells a
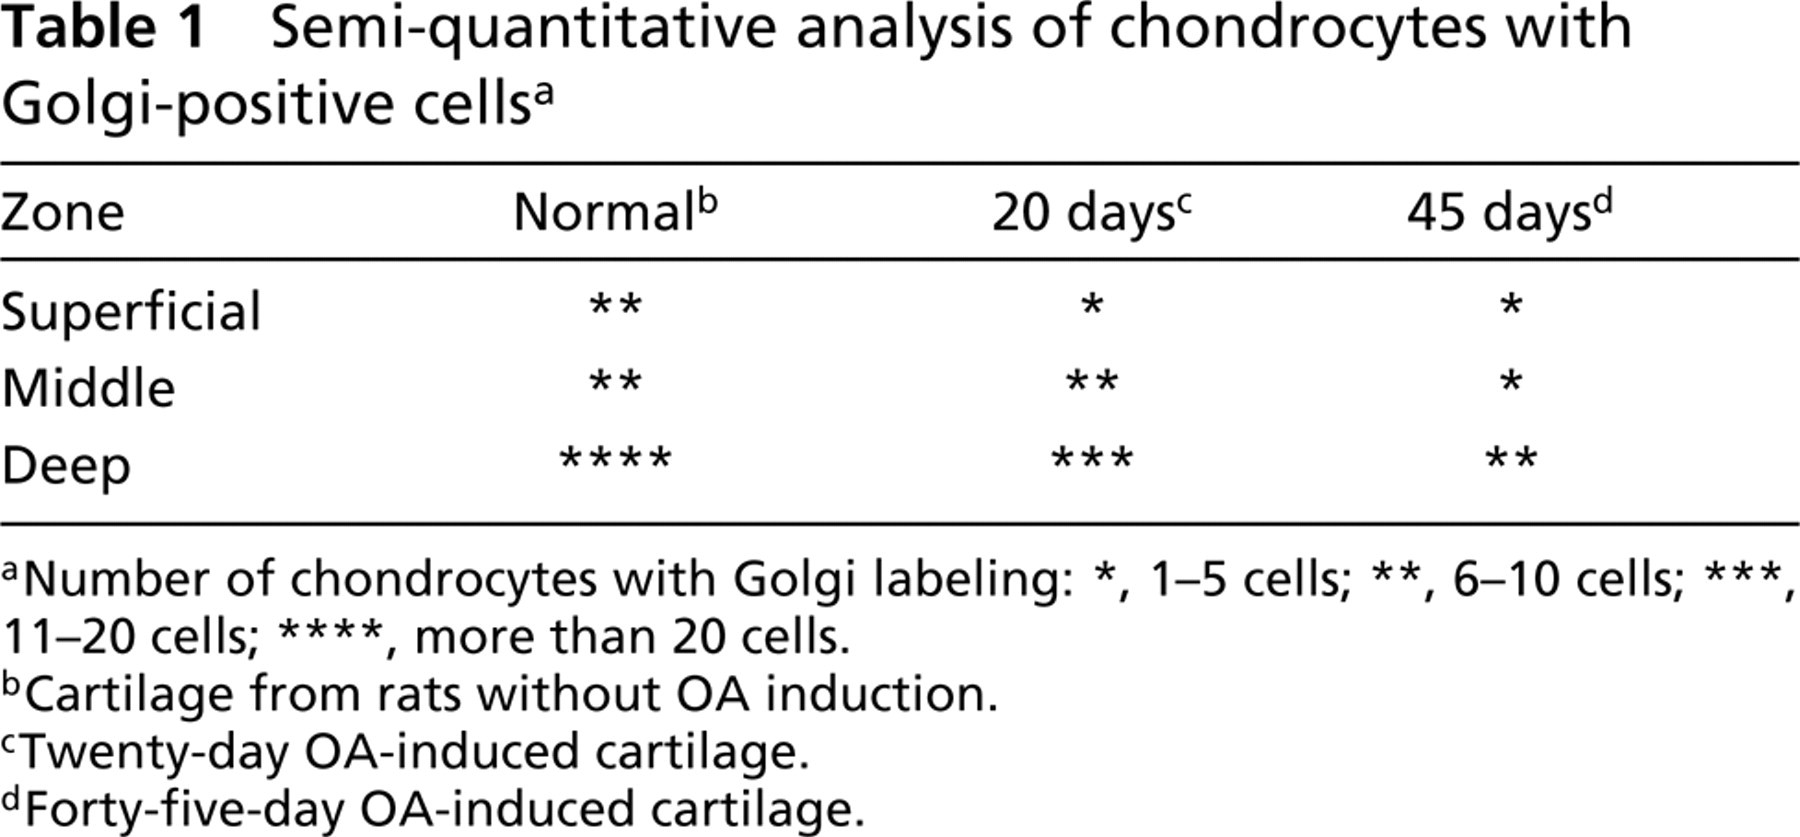
Number of chondrocytes with Golgi labeling: ∗, 1–5 cells; ∗∗, 6–10 cells; ∗∗∗, 11–20 cells; ∗∗∗∗, more than 20 cells.
Cartilage from rats without OA induction.
Twenty-day OA-induced cartilage.
Forty-five-day OA-induced cartilage.
Quantitative scoring of immunolabeling intensities
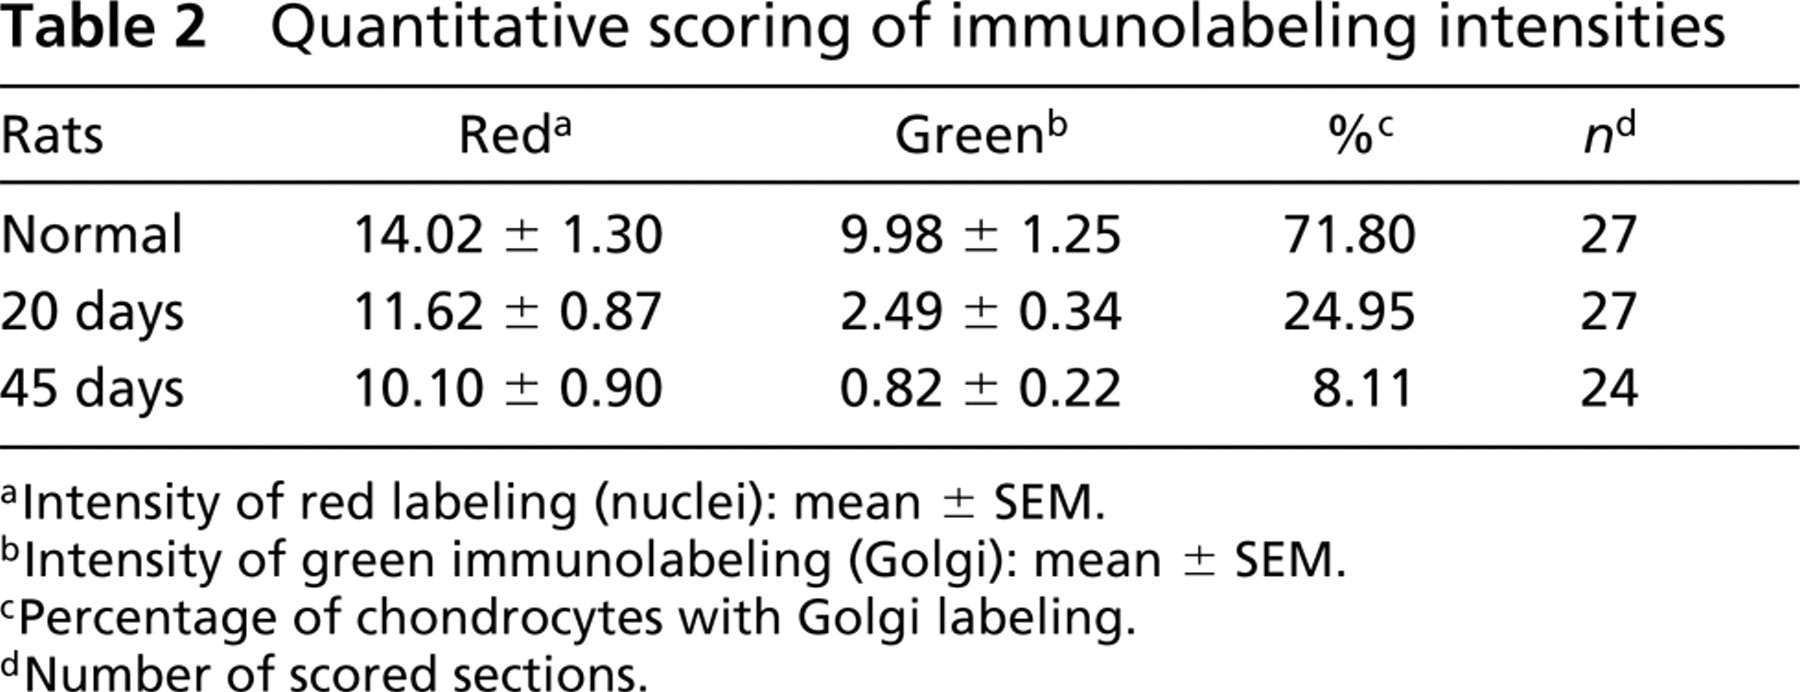
Intensity of red labeling (nuclei): mean ± SEM.
Intensity of green immunolabeling (Golgi): mean ± SEM.
Percentage of chondrocytes with Golgi labeling.
Number of scored sections.
In addition, we confirmed the possible nuclear changes using an alternative statistical analysis. For this purpose, long axes from 20 propidium-iodide stained nuclei from three different sections were measured. Only normal and 45-day OA-induced chondrocytes were included. The mean and SEM were calculated and statistical analysis was performed using an unpaired t-test.
Results
Immunohistochemistry
Throughout all experiments, Golgi labeling obtained from normal cartilage was homogeneous and was more abundant in the deep zone of the tissue (Table 1). In the OA cartilage, the reduction of Golgi labeling correlated with the progression of the induced damage (Tables 2 and 3). Statistical analysis showed an overall reduction in Golgi labeling of OA chondrocytes compared with normal cartilage (Table 3). The percentage of Golgi labeling intensity in normal chondrocytes was 71.18%, whereas in 20- and 45-day OA-induced cartilage it was 24.95% and 8.11%, respectively (Table 2). Furthermore, the assessment of Golgi labeling intensity between normal and OA-induced cartilage showed a highly significant statistical difference, whereas nuclear staining intensities showed significant statistical difference between normal and 45-day OA-induced cartilage (Table 3). In addition, statistical analysis of the nuclear diameter corroborated the previous test. A significant statistical difference was found between normal and 45-day OA-induced cartilage (not shown).
Positive Control
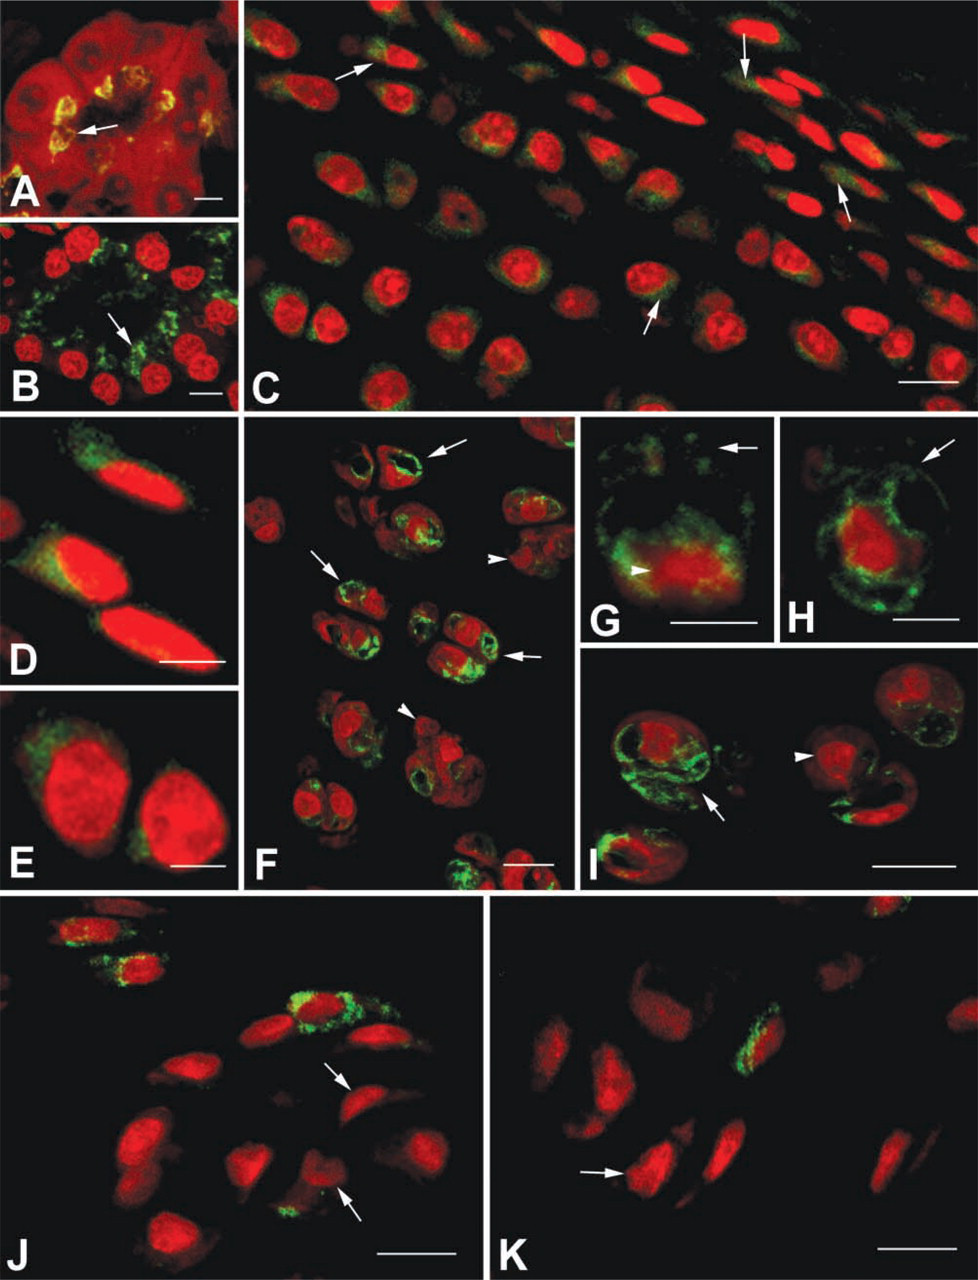
Pancreatic acinar cells showed a well-defined juxtanuclear apical labeling (Figures 1A and B).
Normal Cartilage
Faded juxtanuclear Golgi immunolabeling was observed in most of the chondrocyte cytoplasm. Normal chondrocyte nuclei showed typical morphology, elongated in the superficial zone and rounded in the middle zone of the cartilage (Figures 1C-1E).
Twenty-day OA-induced Cartilage
The immunolabeling distribution was completely different from that of normal cartilage (Figures 1F-1I). Chondrocytes from certain locations displayed intense immunolabeling, which concentrated in several cytoplasmic domains, frequently observed to form bubblelike structures. These structures compartmentalized the cytoplasm. Concomitantly, chondrocytes with bubblelike structures showed nuclei particularly irregular and sometimes fragmented.
Forty-five-day OA-induced Cartilage
Most chondrocytes did not display Golgi labeling. However, some showed sparse dotted labeling distributed within the cell cytoplasm, and very few exhibited intense perinuclear labeling. Most nuclei were irregular and contracted (Figures 1J–1K).
Ultrastructure
The ultrastructure of individual chondrocytes from 20-day OA-induced cartilage showed a remarkable Golgi development. The organelles' saccules and vesicles were located in several cytoplasmic domains. Some cells exhibited Golgi components running in several intracytoplasmic directions, flowing concomitantly with a prominent RER with large cisternae in succession and forming a kind of compartment. Another characteristic of these cells was their nuclei, which showed remarkable differences from normal chondrocytes, being pyknotic and frequently condensed and irregular (Figure 2).
Discussion
To the best of our knowledge, this is the first time that the Golgi complex from normal chondrocytes and chondrocytes from an OA experimental model has been described and statistically assessed. The MAb 58-K-9 has demonstrated good specificity as an immunohistochemical marker for Golgi membranes (Gao and Sztul 1999). It has been successfully used in cultured rat hepatoma Golgi membranes (Bloom and Brashear 1989). Frequently it has been used to efficiently co-localize Golgi with other proteins in rat pancreatic acinar cells (Shin et al. 2000), in C. elegans (Missiaen et al. 2001), and in plants (Li and Yen 2001), among other cell sources. In our case, the results of Golgi immunostaining with rat acinar cells as a positive control indicated the Golgi specificity of MAb 58-K-9 used in our experiments. Furthermore, the statistical procedure we used appears to be an adequate approach for determining the distribution and signaling intensity of this organelle in the cartilage and also in individual chondrocytes. We believe that this is a simple procedure that could be helpful in quantifying immunohistochemical assays.
Statistical analysis of Golgi and nuclear labeling intensity
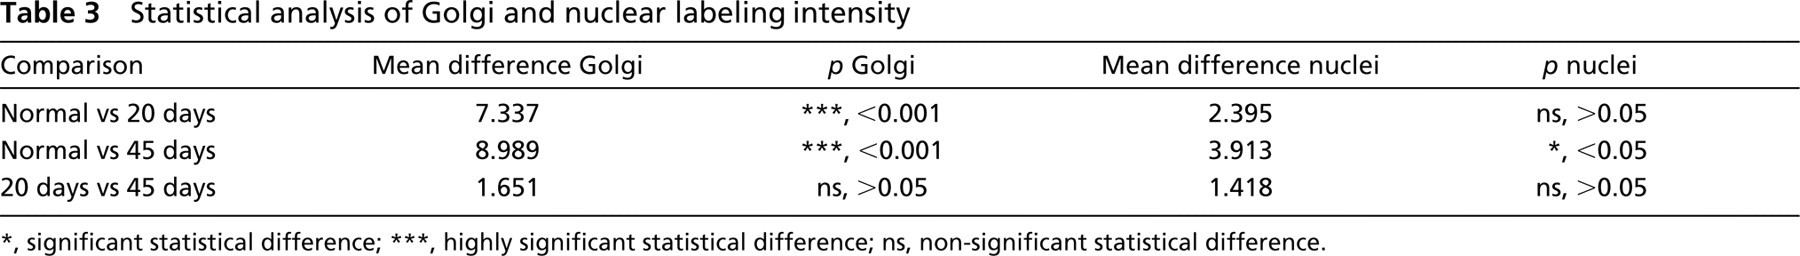
significant statistical difference
highly significant statistical difference; ns, non-significant statistical difference.
Our results showed that OA rat cartilage displayed an overall reduction of Golgi labeling intensity correlated with the progression of tissue damage. Comparison of percentages of Golgi labeling intensities from normal and OA-induced cartilage (20 and 45 days after surgery) showed a four- and 12-fold reduction, respectively. This reduction may well match with cartilage damage described 20 and 45 days after experimental OA induction documented in a previous report (Abbud and Kouri 2000).
In addition, we recently described the kinetics of chondrocyte ultrastructural changes in our OA model, 5, 20, 45, and 60 days after OA induction (Kouri et al. 2002). As reported previously, chondrocytes displayed a typical ultrastructural pattern that varied according to the time after OA induction. OA chondrocytes vary in their ultrastructure beginning 5 days after induction to cell death and cellular detritus 60 days after induction. Notably, 20 days after OA induction the prevailing chondrocytes displayed a remarkable development of Golgi membranes in close association with prominent RER. They also showed irregular nuclei, which eventually appeared to become condensed and fragmented. This type of cell, prevailing in 20-day OA-inducted cartilage, was the one examined closely in this study. Their ultrastructural characteristics have been associated with apoptotic chondrocyte death in human and OA experimental models by several authors (Hashimoto et al. 1998; Abbud and Kouri 2000; Kouri et al. 2000).
Here we demonstrated that Golgi immunolabeling and the ultrastructural pattern described above, may well correspond because, using two different approaches, membranes were observed in diverse cytoplasmic domains, appearing to compartmentalize the cytoplasm. These changes, which were observed in most but not all chondrocytes, might reflect an increase in Golgi activity in individual chondrocytes, followed by loss of cell function and subsequent death. These observations might explain the apparent contradiction that Golgi labeling diminished in the cartilage as damage progressed, although some chondrocytes displayed increased Golgi labeling. Cartilage damage evolution does not presume synchronic chondrocytes regarding a metabolic, functional, and pathological state. Therefore, it is possible to have an increase of Golgi activity in individual chondrocytes within an overall decrease of the organelle function in the cartilage.
It has been reported that OA chondrocytes, in contrast to normal chondrocytes, increase metalloproteinase synthesis over its inhibitors (Martel-Pelletier et al. 1994) and decrease synthesis of matrix components such as chondroitin sulfate (Abbud and Kouri 2000). In addition, we have described in human OA (Kouri et al. 2000) and rat OA-induced cartilage (not published) an increased synthesis of alkaline phosphatase in the deep zone of cartilage during formation of abnormal subchondral bone. However, it is rather difficult to correlate enzyme synthesis only to the abundance of Golgi complex. Therefore, the fact that Golgi modifications correlate with putative apoptotic nuclear and cytoplasmic changes leads us to believe that this organelle might be involved in apoptotic cell death. This assumption is in line with accumulating evidence suggesting that ER and Golgi, among other organelles, are also major points of integration of pro-apoptotic signaling or damage sensing (Ferri and Kroemer 2001). Along with this possibility, it has been demonstrated that stress in ER can induce apoptosis (Welihinda et al. 1999), at least through Ca2+ release and the activation of caspase-12 (Nakagawa et al. 2000). In addition, Golgi disruption has been described in apoptosis-induced HeLa cells through activation of caspase-2 (Mancini et al. 2000) and caspase-3, as recently reported (Lane et al. 2002). We conclude that Golgi modifications found in a rat OA-induced model matches cartilage damage progression and we speculate that they might be related to chondrocyte death by apoptosis, first increasing synthesis and finally implicated in chondrocytes fragmentation. However, it seems clear that the Golgi sequence of the events described and their relationship with chondrocytes apoptosis remain to be established, thus requiring further research.
(
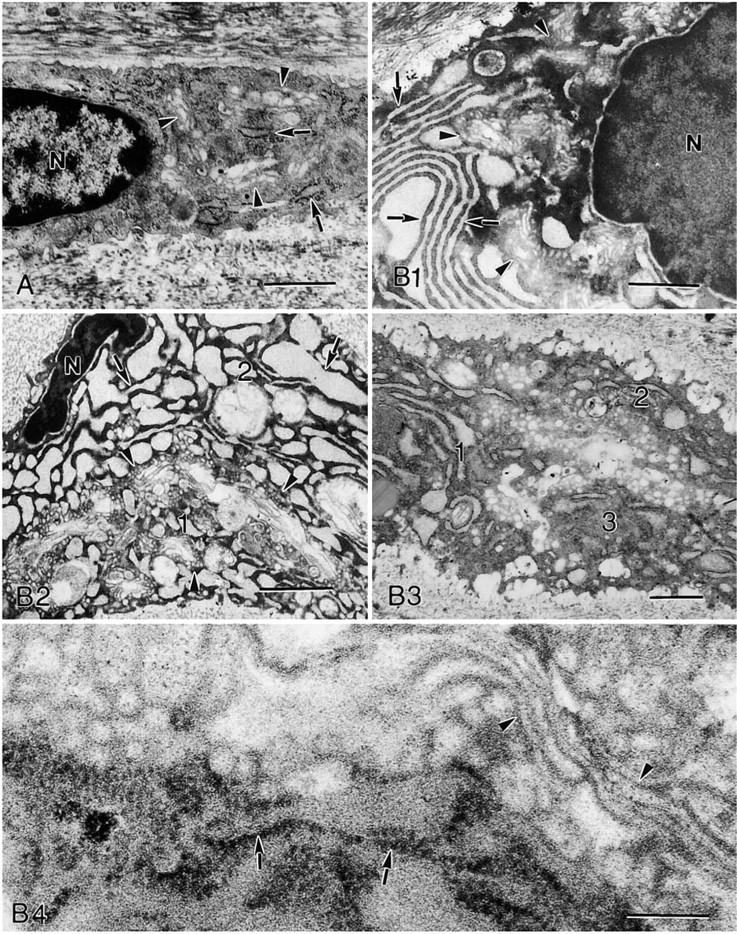
Electron micrographs. (
Footnotes
Acknowledgments
Supported in part by CONACYT grant #28100M.
We are grateful to Dr Leopoldo Flores and Dr Carlos Lavalle from our department for critical reading of the manuscript and to Ms Irma Miranda for assistance in preparing the manuscript.