
Abstract
To circumvent the problem of a sufficient number of cells for cartilage engineering, the authors previously developed a two-stage culture system to redifferentiate monolayer culture-expanded dedifferentiated human articular chondrocytes by co-culture with primary bovine chondrocytes (bP0). The aim of this study was to analyze the composition of the cartilage tissue formed in stage 1 and compare it with bP0 grown alone to determine the optimal length of the co-culture stage of the system. Biochemical data show that extracellular matrix accumulation was evident after 2 weeks of co-culture, which was 1 week behind the bP0 control culture. By 3 to 4 weeks, the amounts of accumulated proteoglycans and collagens were comparable. Expression of chondrogenic genes, Sox 9, aggrecan, and collagen type II, was also at similar levels by week 3 of culture. Immunohistochemical staining of both co-culture and control tissues showed accumulation of type II collagen, aggrecan, biglycan, decorin, and chondroitin sulfate in appropriate zonal distributions. These data indicate that co-cultured cells form cartilaginous tissue that starts to resemble that formed by bP0 after 3 weeks, suggesting that the optimal time to terminate the co-culture stage, isolate the now redifferentiated cells, and start stage 2 is just after 3 weeks.
Keywords
Articular cartilage is responsible for weight bearing and providing a low friction interface between articulating surfaces. Cartilage has little, if any, ability to self-repair. Tissue engineering is a promising approach to overcome this lack of repair and allow for joint regeneration. Major limitations for the clinical application of cell-based tissue engineering are twofold: first, procurement of a sufficient number of cells that have chondrogenic potential and, second, generation of functional hyaline cartilage tissue that does not show hypertrophic features. If in vitro regenerated cartilage is to be able to bear weight, it will be necessary for the cells to produce matrix molecules of proper composition and distribution that mimic normal articular cartilage, as we have shown in previous in vitro and in vivo studies. If this occurs, the cartilage has the ability to remodel and improve its compressive mechanical properties (Waldman et al. 2004; Kandel et al. 2006; Waldman et al. 2006).
Due to the low cell density, chondrocytes constitute only up to 10% of the volume of cartilage tissue, and articular cartilage is said to be a matrix-continuous structure where each cell is fully surrounded by extracellular matrix (ECM) molecules (Muir 1995; Kinner et al. 2005). The tissue’s ability to resist mechanical loading depends on its inherent structure and mechanical properties, which in turn are defined by precise type and distribution of the ECM macromolecules: collagens to provide tensile strength, proteoglycans to withstand compression, and interstitial fluid for fluid flow (Hall et al. 1996; Pearle et al. 2005). The most abundant collagen of articular cartilage is collagen type II, which is present throughout the full thickness of cartilage (Thomas et al. 1994; Becerra et al. 2010). Collagen type I can be present in the superficial aspect of cartilage as well as in the mineralized zone; its presence throughout the matrix is characteristic of fibrocartilage (Wardale and Duance 1993). The extensive cross-linking of the various collagen types provides material strength (Poole et al. 2001; Eyre 2002). Proteoglycans, the second largest constituent of the ECM, are a specific class of glycoproteins that consist of glycosaminoglycan (GAG) chains covalently bound to a central core protein. Large aggregating proteoglycans, such as aggrecan, consist of covalently bound keratan sulfate and chondroitin sulfate glycosaminoglycan chains and make up 50% to 85% of the proteoglycans present in cartilage. Other smaller proteoglycans, belonging to the family of leucine-rich proteoglycans (SLRPs), constitute less than 10% of the total amount of proteoglycans in the ECM. Despite their relative low abundance, knockout studies have indicated that SLRPs play a crucial role in providing matrix stability and in protecting collagen fibrils from cleavage by collagenases (Knudson and Knudson 2001; Poole et al. 2001; Geng et al. 2006; Roughley 2006). Studies in human and bovine articular cartilage have shown that the SLRPs, decorin and biglycan, are mainly localized in the mid and upper zones of articular cartilage (Heinegard et al. 1986; Poole et al. 1986; Bianco et al. 1990; Miosge et al. 1994). Biglycan has been shown to increase with age in human articular cartilage (Roughley et al. 1993), whereas decorin content increases steadily up to 25 years of age, after which it declines (Hardingham and Bayliss 1990). The intrinsic electrical charges of the proteoglycans provide a high fixed charge, and their hydrophilic nature entraps water, allowing the tissue to withstand compression, which is critical for cartilage functionality.
To overcome the problem of gaining a sufficient number of cells for in vitro cartilage tissue generation, many studies have attempted to identify conditions that favor either retention of the chondrocyte phenotype during culture expansion of cells or redifferentiation of the passaged cells with and without exogenous growth factors (Mandl et al. 2004; Takahashi et al. 2007; Francioli et al. 2010). Previously, we described a robust two-stage culture system in which culture-expanded dedifferentiated articular chondrocytes generate hyaline cartilage (Gan and Kandel 2007; Ahmed et al. 2009, Ahmed et al. 2010). In stage 1 of this redifferentiation culture system, the dedifferentiated cells (hP2) are induced to redifferentiate by co-culture with labeled primary bovine articular chondrocytes (bP0) in a ratio of 4:1. In stage 2, the now redifferentiated hP2 cells are separated from the bP0 by cell sorting. Upon subsequent independent culture, these cells demonstrate redifferentiation by reversal of their gene expression profile to high COL II and low COL I and by reacquisition of the ability to produce cartilage tissue in vitro (see Suppl. Fig. S1; Ahmed et al. 2010). Importantly, collagen type X expression is not upregulated, confirming that these cells do not progress to hypertrophic differentiation.
This study focuses only on the first stage of the system. The aim of this study was to determine the minimal duration of time the tissue should be maintained in co-culture. For this purpose, we have characterized the composition of the cartilage tissue formed by the co-culture of dedifferentiated human passaged cells and compared it with that generated by primary bovine chondrocytes. Standardizing and limiting the redifferentiation time period will facilitate the development of a system that will allow generation of human tissue suitable to use for joint repair.
Materials and Methods
Cell Isolation and Expansion
Bovine articular cartilage was isolated under aseptic conditions from metacarpophalangeal joints of 6- to 9-month-old cows within 24 hr of death. Normal human cartilage was harvested from specimens obtained during joint resection for completion of surgical removal of soft tissue malignancy. Three human specimens were obtained: one from the knee and two from the hip of female patients aged 25 to 47 years (mean, 30.25 years). No adjuvant chemotherapy had been administered, and the unaffected joint had been resected only to facilitate tumor removal. Use of these tissues was approved by the Mount Sinai Hospital Research Ethics Board.
Chondrocytes were isolated from the bovine and human cartilage using similar methodology. This consisted of sequential enzymatic digestion using 0.5% protease for 1 hr followed by 0.1% collagenase A (Roche Diagnostics GmbH, Mannheim, Germany) for 24 hr at 37C and 5% CO2. The cells were centrifuged, washed twice, and resuspended in Ham’s F12 (Wisent Bioproducts Inc., Montreal, Canada) supplemented with 25 mM HEPES and 5% fetal bovine serum (FBS; HyClone, Logan, UT). Freshly isolated chondrocytes were either seeded in monolayer culture or cryopreserved in liquid nitrogen. For monolayer culture, the cells were seeded at a density of 2000 cells/cm2 and grown under standard culture conditions. At approximately 90% confluence, the cells were harvested using 0.5% Trypsin-EDTA (Invitrogen Life Technologies, Burlington, Ontario, Canada) and reseeded in monolayer culture at the same seeding density (2000 cells/cm2). Two passages (P2) resulted in about 200-fold expansion in cell number (Gan and Kandel 2007). The cells were then harvested and cultured as described below.
Cell Culture
Human P2 (1.6 × 10⁶ cells/insert) and bovine chondrocytes immediately after isolation from articular cartilage (P0) (0.4 × 10⁶ cells/insert) were combined together and seeded onto type II collagen–coated Millicell culture plate inserts (60 mm2; Millipore, Bedford, MA) as previously described (Ahmed et al. 2010). After 1 week, the cells were placed in modified chondro-inductive media (MCIM) (1:1 F-12 and DMEM [high glucose] (Wisent Bioproducts Inc., Montreal, Canada) containing 20% FBS, 3 mM MgCl2, 10 mM NaHCO3 and 100 µg/ml ascorbic acid). The cells were grown for various times up to 4 weeks. As controls, P2 cells (1.6 × 10⁶ cells/insert) and bP0 cells (0.4 × 10⁶ cells/insert) were grown alone under the same conditions.
Biochemical Analysis
The tissues were harvested at 1, 2, 3, and 4 weeks and digested by papain (Sigma, St. Louis, MO; 40 µg/ml in 20 mM ammonium acetate, 1 mM EDTA, and 2 mM dithiothreitol [DTT]) for 48 hr at 65C, and aliquots of the digest were assayed separately for DNA, proteoglycan, and collagen contents, as previously described (Taylor et al. 2010). The proteoglycan content was estimated by quantifying the amount of sulfated glycosaminoglycans using the dimethylmethylene blue dye-binding assay (Polysciences, Washington, PA) and spectrophotometry (λ: 525 nm). Standard curves for the analysis were generated using bovine trachea chondroitin sulfate A (Sigma). Collagen content was estimated from the hydroxyproline content. Aliquots of the papain-digested tissue were hydrolyzed in 6 N HCl at 110C for 18 hr, and the hydroxyproline content was determined spectrophotometrically (λ: 560 nm) using chloramine-T/Ehrlich’s reagent. Standard curves were generated using L-hydroxyproline (Sigma). To determine the final collagen content, it was assumed that the hydroxyproline content represents approximately 10% of the total collagen weight (Berg 1982). DNA content was measured using Hoechst dye 33258 assay (Polysciences) and fluorometry (excitation λ: 365 nm and emission λ: 458 nm). Standard curves were generated using calf thymus DNA (Sigma Aldrich Ltd, Oakville, Ontario, Canada).
Histological and Immunohistochemical Evaluation
Tissue was harvested at 1, 2, 3, and 4 weeks and fixed in 10% neutral buffered formalin and embedded in paraffin. Then, 5-µm-thick sections were cut and stained with 1% (w/v) Alcian blue 8GX (pH 2.5) to demonstrate the presence of sulfated proteoglycans or Mayer’s hematoxylin and eosin (H&E) to visualize cells by light microscopy, as previously described (Hayes et al. 2007; Ahmed et al. 2010).
To evaluate collagen type and distribution in the tissue, 5-µm sections of the in vitro–formed tissues were cut and dewaxed. For type II collagen immunostaining, sections were digested with 0.4% pepsin (w/v) (Sigma Aldrich Ltd) in 0.01 M HCl (pH 2.0), blocked with 5% horse serum (v/v) (Sigma Aldrich Ltd), and then incubated with antibody reactive with type II collagen (1/100 in phosphate-buffered saline (PBS), mouse monoclonal, MS-306-P; Labvision, Fremont, CA) for 1 hr at room temperature. Immunoreactivity was detected using biotinylated horse anti-mouse secondary antibody (1/100 dilution; Vector Laboratories, Inc., Burlington, Ontario, Canada), Vectastain Elite ABC kit (Vector Laboratories, Inc., Burlingame, CA), and 3,3’-Diaminobenzidine (DAB). The tissues were counterstained with hematoxylin.
For type I collagen immunostaining, frozen sections were cut and digested using 2.5 mg/ml trypsin (Sigma Aldrich Ltd) in Tris-buffered saline (TBS) and 25 mg/ml hyaluronidase (Sigma Aldrich Ltd) in PBS, blocked with 20% goat serum (0.1% Triton X-100 in PBS), and then incubated with rabbit monoclonal antibody reactive with type I collagen (1/100; Meridian Life Science, Saco, ME) for 1 hr at room temperature. Immunoreactivity was detected using goat anti-rabbit IgG secondary antibody (1/500; Alexa Fluor 488; Invitrogen, Carlsbad, CA). The tissues were counterstained with 4′,6-diamidino-2-phenylindole (DAPI, 1/10,000; Thermo Scientific, Rockford, IL).
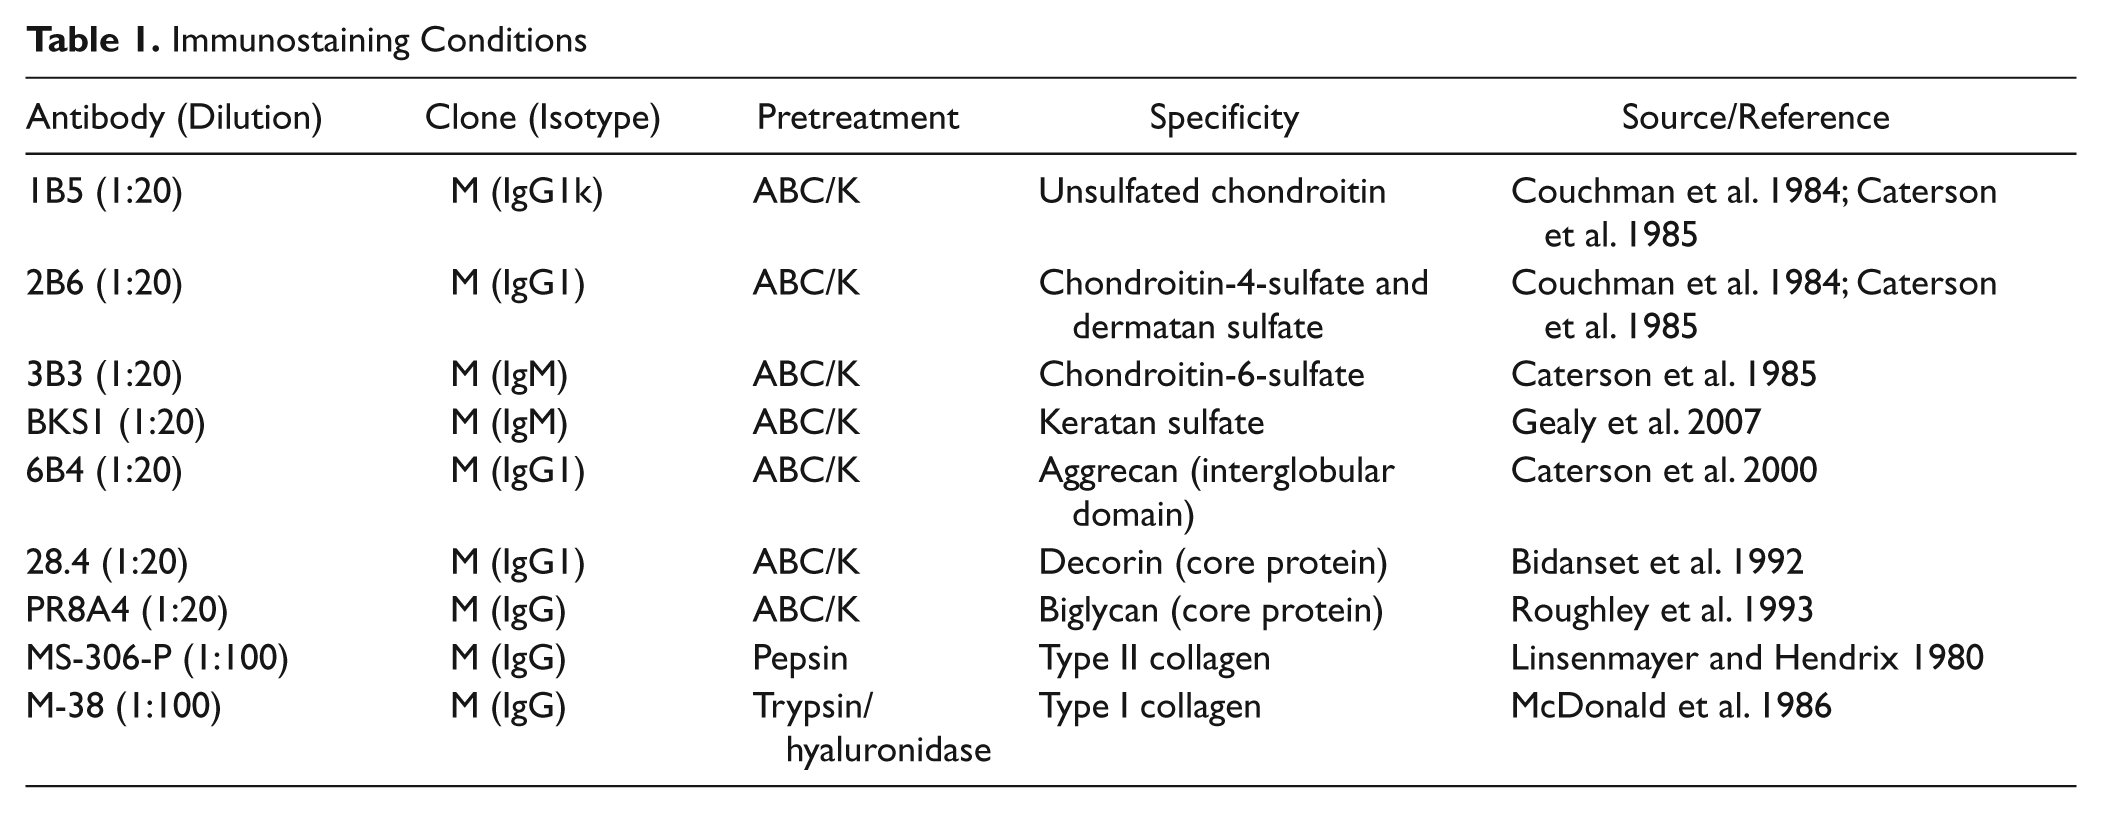
To evaluate the different types of proteoglycans present in the tissue, paraffin-embedded tissue sections were de-waxed and rehydrated, then stained with primary antibodies to various ECM components (see Table 1). Where necessary, either to generate a neo-epitope or to improve antibody penetration, sections were enzymatically deglycosylated by pretreatment with either 0.5 U/ml chondroitinase ABC (Sigma Aldrich Ltd) or 0.5 U/ml keratanase (AMS Biotechnology; Oxon, UK) in 100 mM Tris–acetate buffer (pH 7.4) for 1 hr at 37C. After washing, sections were treated with 0.03% H2O2 for 30 min at room temperature to block endogenous peroxidase, before overnight incubation at 4C with primary antibody (Table 1). All immunoreagents were diluted in 0.05 M PBS containing 0.001% Tween-20 (Sigma Aldrich Ltd), which was also used for each washing step. After a second wash, sections were immunostained with a panel of goat anti-mouse monoclonal antibodies using Vectastain Universal kit and Vector Red substrate (Vector Laboratories, Inc., Burlingame, CA) according to the manufacturer’s instructions for 30 min at room temperature. Sections were counterstained with Mayer’s H&E. Control sections were treated identically except they were incubated with PBS, 10 mg/ml mouse immunoglobulins (Sigma Aldrich Ltd), or non-immune rabbit serum (Sigma Aldrich Ltd) as appropriate, instead of primary antibody. Sections were dehydrated, cleared, and mounted under coverslips with DPX (distrene, plasticizer, xylene) and then viewed by light microscopy.
Immunostaining Conditions
Transmission Electron Microscopy (TEM)
For ultrastructural evaluation, 1 to 2 mm of tissue was fixed in 2% glutaraldehyde and processed for examination using a TecNai 20 transmission electron microscope (FEI, Eindhoven, the Netherlands).
RNA Expression
Tissues were harvested and snap frozen in liquid nitrogen at 24, 48, and 72 hr and 1, 2, 3, and 4 weeks, and total RNA was extracted using Trizol (Gibco BRL; Rockville, MD) following disruption of the frozen tissue by mortar and pestle. RNA concentration was measured at 260 nm. Then, 0.5 µg total RNA was reverse transcribed with the SuperScript II reverse transcription kit in 20 µl total reaction volume in FirstStrand buffer and 0.1 M DTT for 50 min at 42C followed by a 15-min extension period at 72C (Invitrogen). Each reaction contained 40 units/µl of recombinant ribonuclease inhibitor RNase OUT, 50 µg/ml of random hexamers, 10 mM dNTPs, and 200 units of SuperScript II enzyme.
Primers, designed with Primer3 software and manufactured at Qiagen (Montreal, Canada), are as follows: type II collagen, forward primer of 5′-GCA GAG GAC AGT CCC AGT GT-3′ and reverse primer of 3′-C TGT AGG ACC GGG ACT GTG-5′ (150 bp); type I collagen, forward primer of 5′-TGC TGG CCA ACT ATG CCT CT-3′ and reverse primer of 3′-CTA GTC TCG TAA CAG GTT-5′ (200 bp); Sox9, forward primer of 5′-ACG CCG AGC TCA GCA AGA-3′ and reverse primer of 3′-CAC GAA CGG CCG CTT CT-5′ (70 bp); and 18S rRNA, forward primer of 5′-GTA ACC CGT TGA ACC CCA TTC-3′ and reverse primer of 3′-CCA TCC AAT CGG TAG TAG CG-5′ (150 bp). Prior to relative quantitative polymerase chain reaction (qPCR) analysis, each primer pair was tested for efficiency and a Ct value standard curve generated using the formula 10(1/S) – 1, where S is the slope of the curve. Only primer pairs showing greater than 90% efficiency were used for the analysis.
qPCR was performed using SYBR green dye I on a realplex2 Master cycler (Eppendorf, Hamburg, Germany), and the data were analyzed with “Mastercycler ep realplex” according to the manufacturer’s instructions. Briefly, 1 µl cDNA was amplified in 20 µl final volume with 0.2 µM of each primer suspended in 1× QuantiFast SYBR Green master mix (Qiagen, Hilden, Germany). Amplification parameters were identical for each primer pair; after 10 min at 95C to activate the enzyme, 15 sec of denaturation at 95C was followed by 30 sec of annealing at 60C, and amplification data were collected for 40 cycles. Mean relative quantification (RQ) values were calculated using the ΔΔCt method using 18S rRNA as an endogenous control and hP2 chondrocytes as calibrator. RQ values were plotted on a logarithmic graph.
Statistical Analysis
At least three independent sets of experiments were performed, each in triplicate. Data are presented as mean ± standard error of the mean (SEM). Results were analyzed using a one-way analysis of variance (ANOVA), and all pairwise comparisons between groups were conducted using the Tukey post hoc test; p values ≤0.05 were considered statistically significant.
Results
Biochemical Assessment of Collagen and Proteoglycan Content
To compare the matrix accumulation by hP2bP0 co-culture with that of control cultures of bP0 and hP2, we cultured the cells for various times up to 4 weeks and quantified biochemically the newly formed tissue (Fig. 1). Proteoglycans were detected in all tissues formed by cells whether grown alone or in co-culture. The proteoglycan content of the co-culture generated tissue showed little increase between weeks 1 and 2. bP0 cells grown alone had a continual increase in proteoglycan content during the 4 weeks of culture (Fig. 1A). At 2 weeks, the GAG content was significantly higher in bP0 generated tissue when compared with tissues formed through co-culture or by hP2 alone. By week 3, there was no difference between bP0 and co-culture, and hP2 tissue did not accumulate any further GAG.
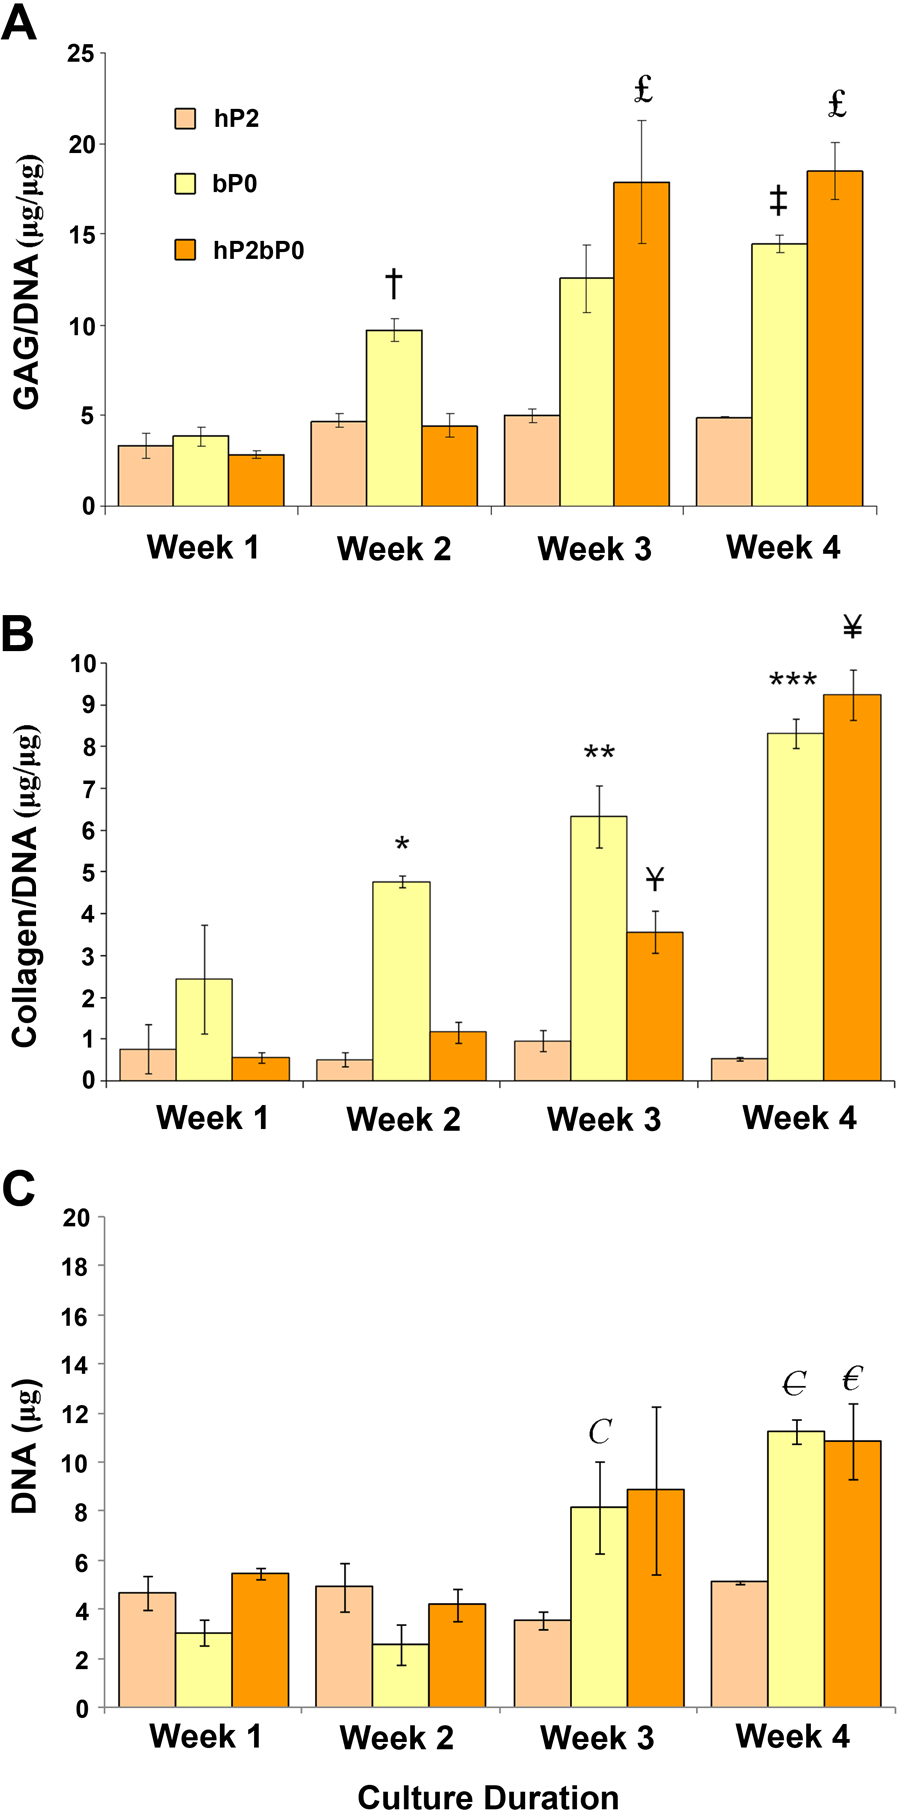
Glycosaminoglycan (GAG), collagen, and DNA contents of tissues formed by primary bovine P0 and human passaged P2 grown alone or in co-culture. GAG and collagen contents expressed relative to DNA in tissues formed up to 4 weeks of culture (n=9, three individual patients). The results from all experiments were pooled and expressed as mean ± SEM. Significance was assigned at p<0.05. (A) †bP0 at 2 weeks was significantly different from hP2 and hP2bP0 samples from the same time point (week 2); ‡bP0 at 4 weeks was significantly different from bP0 from the first week and hP2 from the same time point (week 4); and £hP2bP0 was significantly different from hP2bP0 from weeks 1 and 2 as well as hP2 from the same time point. (B) *bP0 at week 2 was significantly different from hP2 and hP2bP0 from the same time point (week 2); **bP0 at week 3 was significantly different from hP2 from the same time point (week 3); ***bP0 at week 3 was significantly different from hP2 from the same time point (week 4) and bP0 from weeks 1 and 2; ¥hP2bP0 at week 3 was significantly different from hP2bP0 at week 1; and ¥hP2bP0 at week 4 was significantly different from hP2 at same time point (week 4) and hP2bP0 from weeks 1 and 2. (C) C bP0 at 3 weeks was significantly different from hP2 samples from the same time point and bP0 samples from 1 and 2 weeks; €bP0 at 4 weeks was significantly different from hP2 samples at the same time point and bP0 samples from weeks 1 and 2; and €hP2bP0 at 4 weeks was significantly different from hP2 samples at the same time point and hP2bP0 samples from weeks 1 and 2.
The collagen content of bP0 cultures was significantly higher after 2 weeks when compared with tissues formed by hP2 or co-culture (Fig. 1B). By the fourth week, collagen content in the tissue formed by co-cultured cells had reached levels present in bP0 cultures, whereas in tissue formed by hP2 cells, it did not change over time. In bP0 cultures, the DNA content increased significantly by week 3, whereas in hP2bP0 cultures, a significant increase was not observed until week 4. The DNA content in hP2 cultures was unchanged throughout the 4 weeks (Fig. 1C).
Characterization of Tissue Formed by Co-culture of Bovine Primary Chondrocytes
To compare the tissues formed by hP2bP0 cells with that formed by bP0 or hP2 cells, the tissues were grown for various times up to 4 weeks and examined for morphological appearance, as well as composition and distribution of matrix molecules (Fig. 2). Histological examination showed that hP2 cells, when cultured on their own, failed to form cartilaginous tissue. However, when grown in co-culture with bP0, these cells formed tissue. Extracellular matrix accumulation was seen by 2 weeks of culture and increased over time. In bP0 cultures, tissue formation was evident as early as 1 week. After 4 weeks, the tissue formed by the hP2bP0 co-cultured cells appeared thicker than the tissue formed by bP0 alone. Both of these latter tissues were rich in proteoglycans.
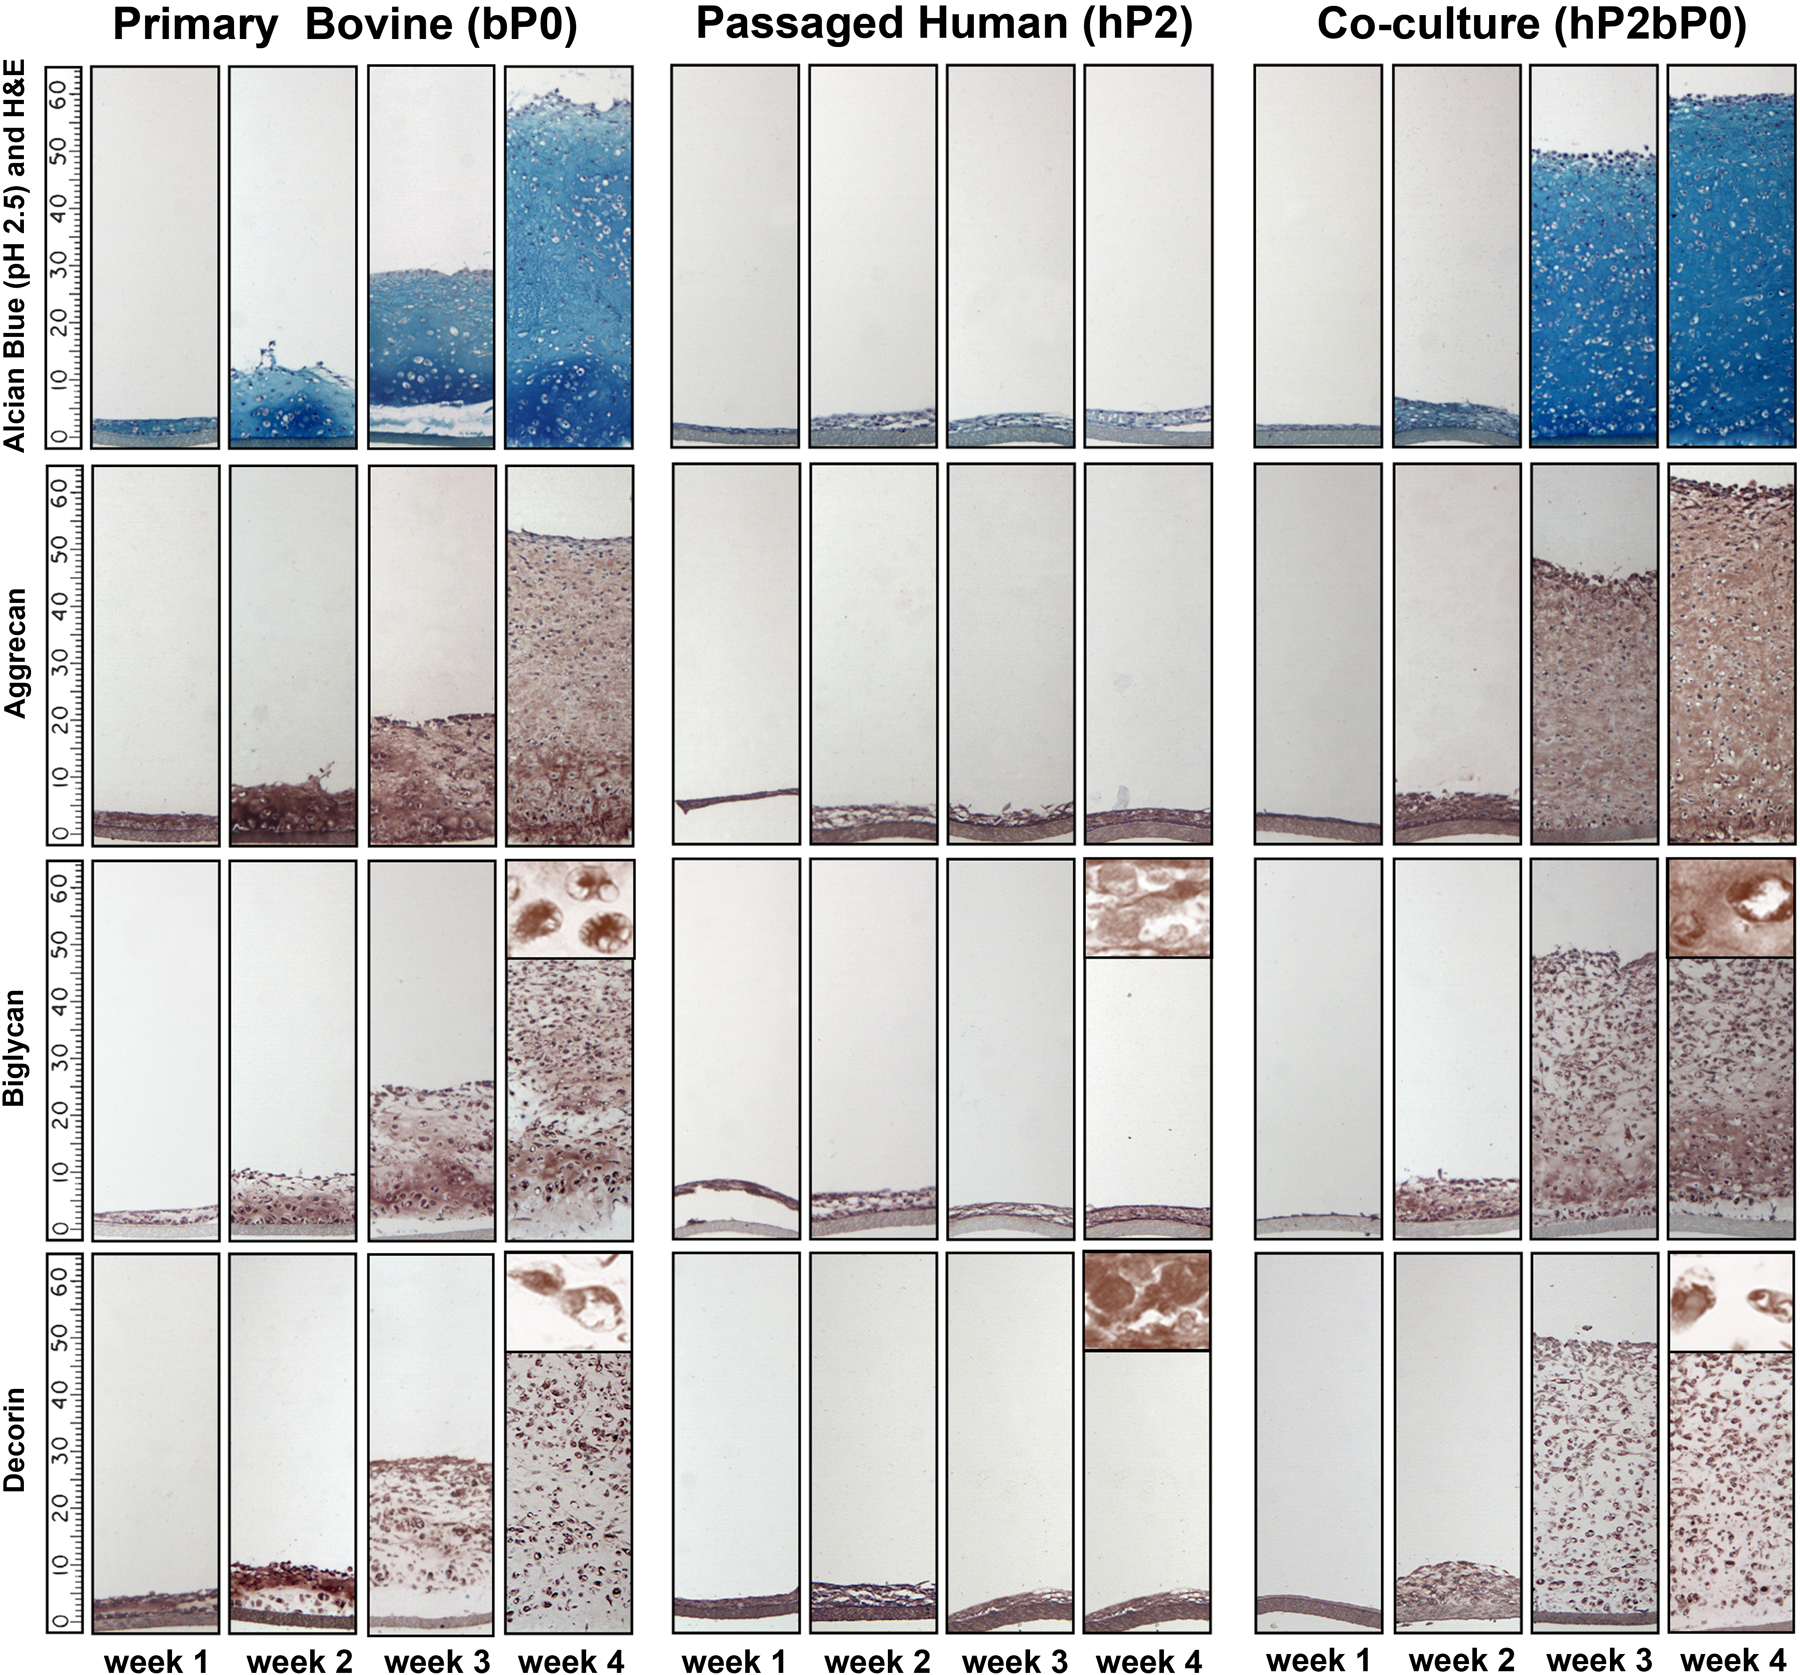
Proteoglycan analysis of the in vitro formed tissues. Photomicrographs of histological sections of the different tissues over time and stained with either Alcian blue or antibodies reactive with specific proteoglycans (aggrecan, biglycan, and decorin). Insets: Photomicrographs of histological sections taken after 4 weeks of culture of the different tissues and stained with antibodies reactive to either biglycan or decorin (width of inset is equal to 30 µm). Every 10 units on the scale bar represents 100 μm.
Aggrecan, biglycan, and decorin accumulated in cartilage tissues formed by either bP0 chondrocytes or hP2bP0 cultures (Fig. 2). Aggrecan was present as early as 1 week of culture in the tissue formed by bP0 cells but was not observed until week 2 in the tissue formed by hP2bP0. Although present diffusely throughout the tissue, by week 3 there was more aggrecan observed in the deep aspect of the tissue. Tissues formed by hP2 contained minimal amounts of aggrecan. Biglycan was detected by 1 week in all three tissues. With time, a diffuse distribution was seen throughout the tissue with greater accumulation in the deep zone of the cartilage tissues formed by both P0 and hP2bP0 cells. Decorin was present pericellularly in the cartilage tissue with some accentuation in the mid and upper zones of the cartilage formed by hP2bP0 cells, a feature observed only in the cartilage formed from bP0 cells at earlier time points (Fig. 2).
Both bP0 and hP2bP0 cultures showed diffuse tissue staining for unsulfated chondroitin (chondroitin-0-sulfate), chondroitin-4-sulfate, and chondroitin-6-sulfate stubs. These were not detected in tissues formed by hP2 cells (Fig. 3). Keratan sulfate staining was seen in a pericellular distribution in the bP0 and hP2bP0 generated cartilage.
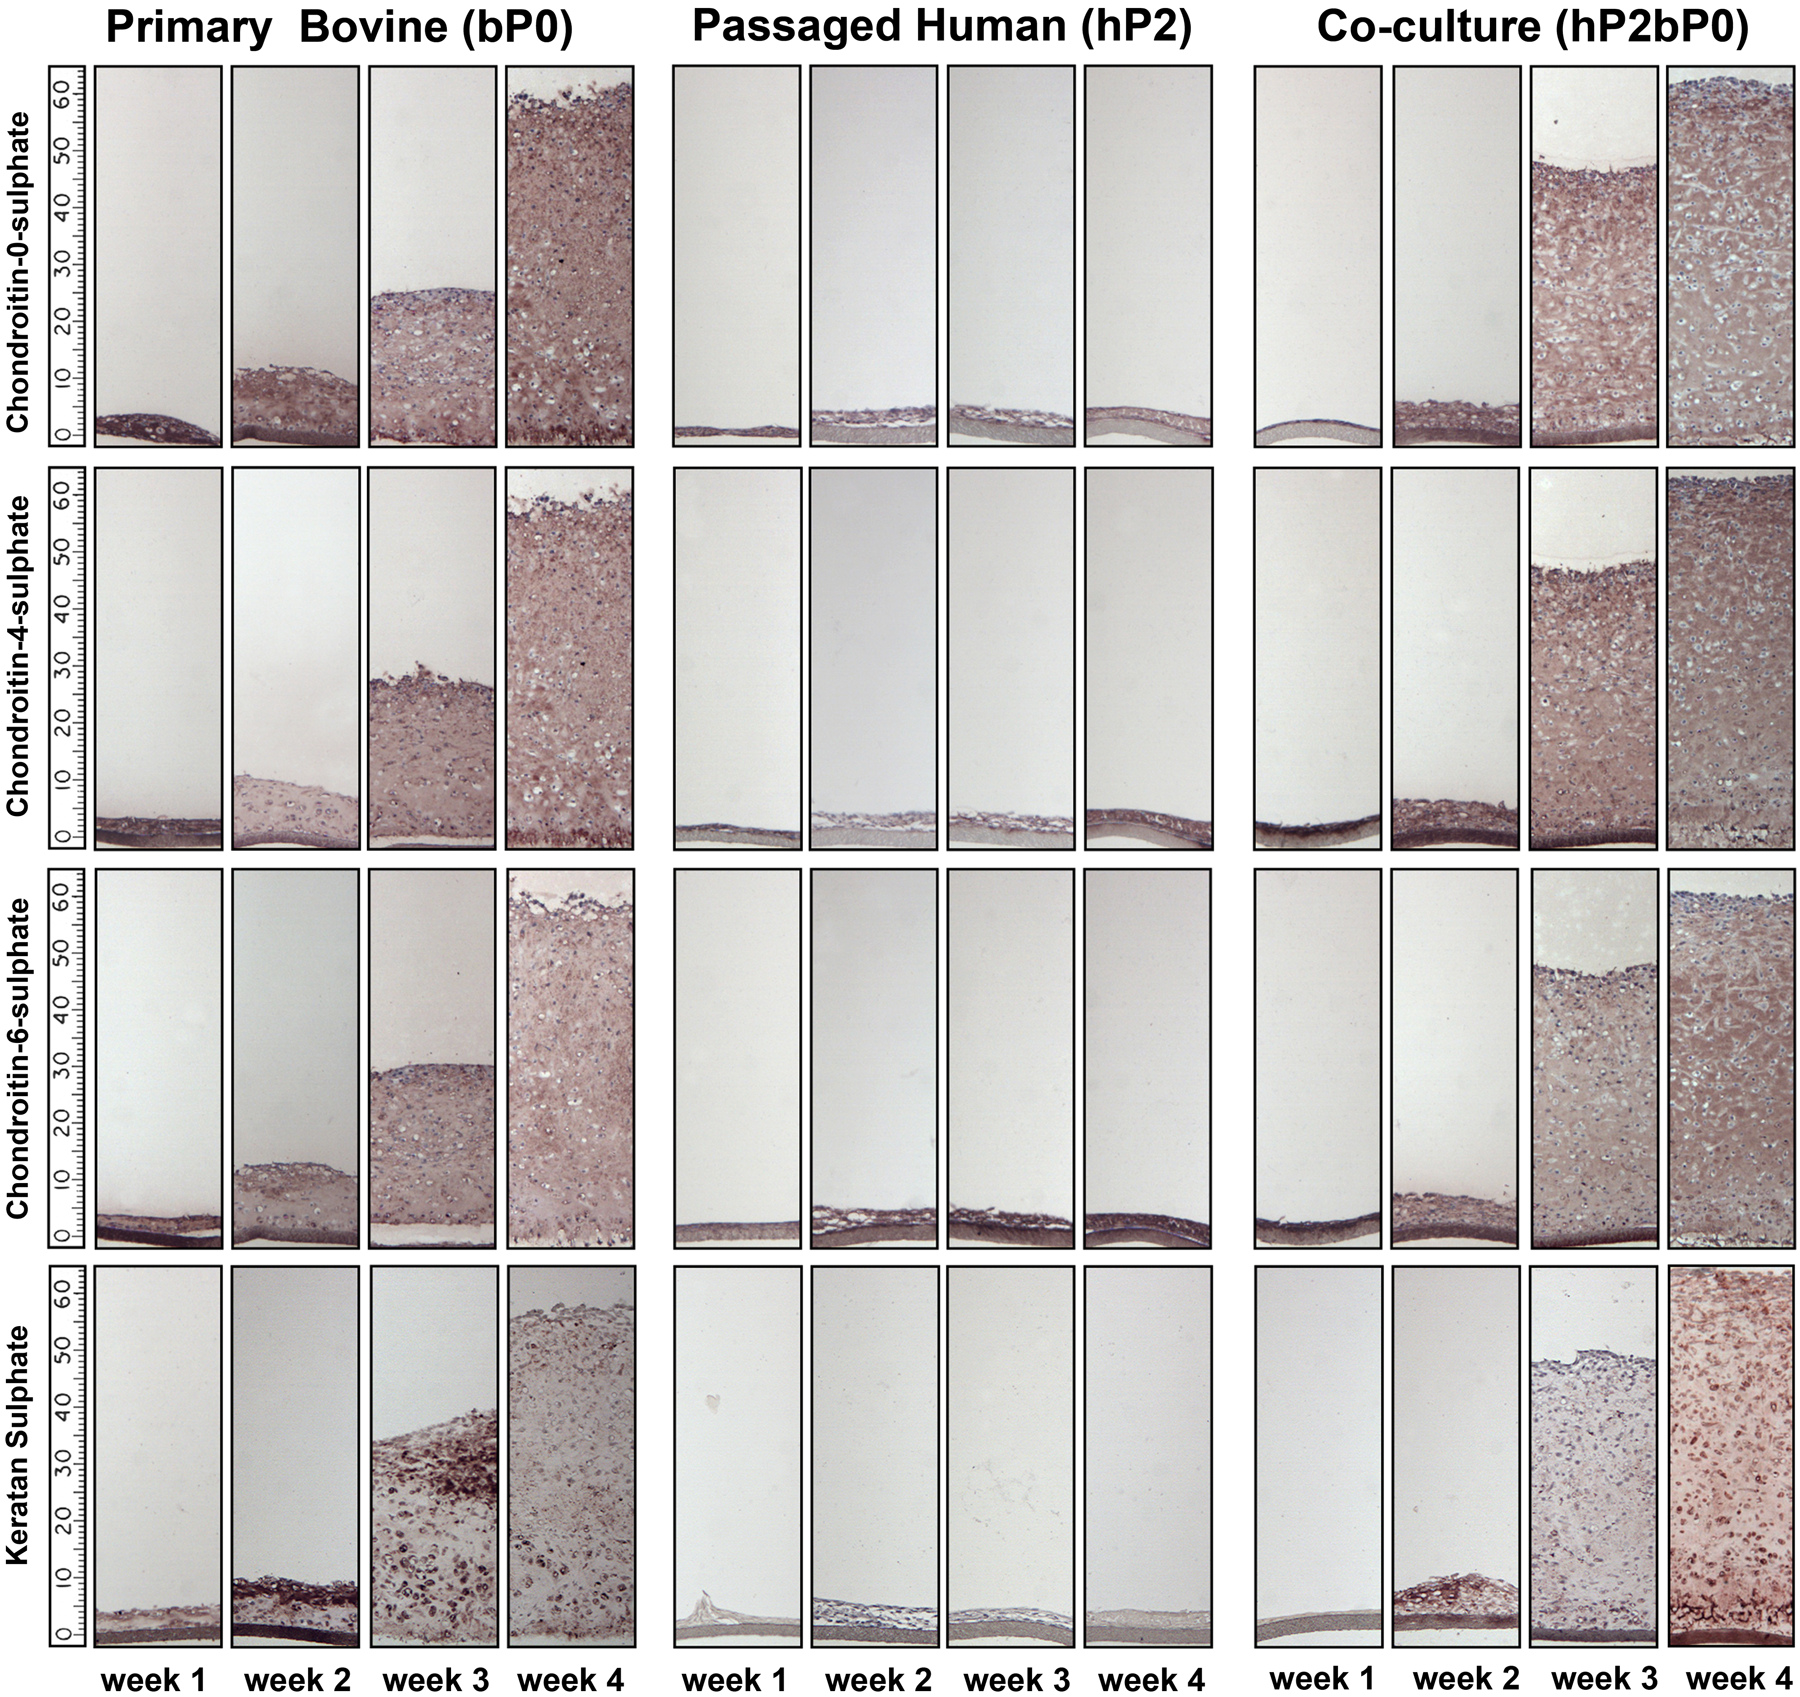
Sulfated keratan and chondroitin distribution in the in vitro formed tissues. Photomicrographs of histological sections of the different tissues over time and stained with antibodies reactive with specific chondroitins (chondroitin-0-sulfate, chondroitin-4-sulfate, and chondroitin-6-sulfate) and keratan sulfate. Every 10 units on the scale bar represents 100 μm.
In hP2 cultures alone, there was little if any type II collagen accumulation, and no further increase was observed beyond the first week, as shown through type II collagen immunostaining (Fig. 4). However, when grown in co-culture, hP2bP0 cells formed tissue rich in type II collagen. Type II collagen could be seen by 2 weeks of culture and increased over time. In bP0 cultures, type II collagen-rich tissue was evident as early as week 1. Type I collagen was detected only in the tissue formed by hP2 cells cultured alone (Fig. 4).
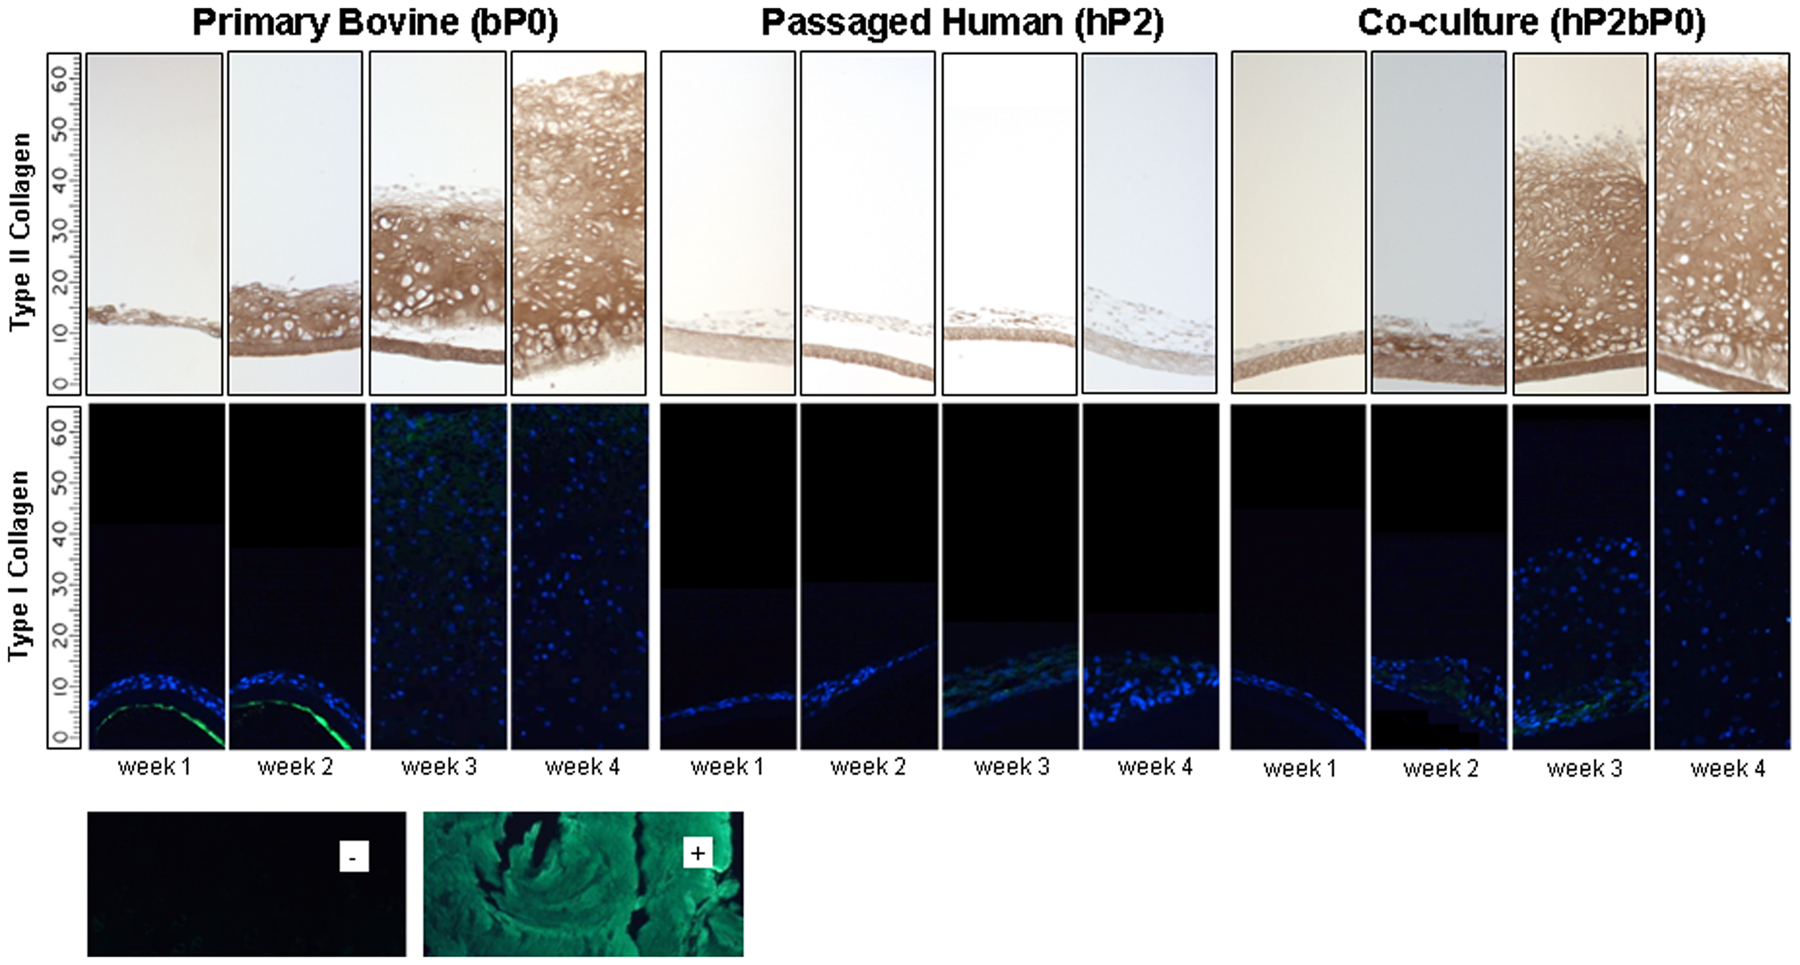
Type I and II collagens in the in vitro formed tissue. Photomicrographs of histological sections of the tissues formed from bP0, hP2, and hP2bP0 cultures over time and stained with antibodies reactive with type I or II collagen. Inserts: (–), type I collagen staining on bovine native cartilage as a negative control; (+), type I collagen staining on bovine native tendon as a positive control. Every 10 units on the scale bar represents 100 μm.
Ultrastructural Appearance of the In Vitro Formed Cartilage by Co-cultured Cells
The tissue formed by hP2bP0 cells was examined by TEM to assess cell-cell interactions and observe the accumulation of ECM (Fig. 5). Although chondrocytes could be seen side-by-side in some areas, no direct contact was observed. Extracellular matrix could be seen between cells. No gap junctions or junctions of any kind between cells were seen at any stage of the co-culture.
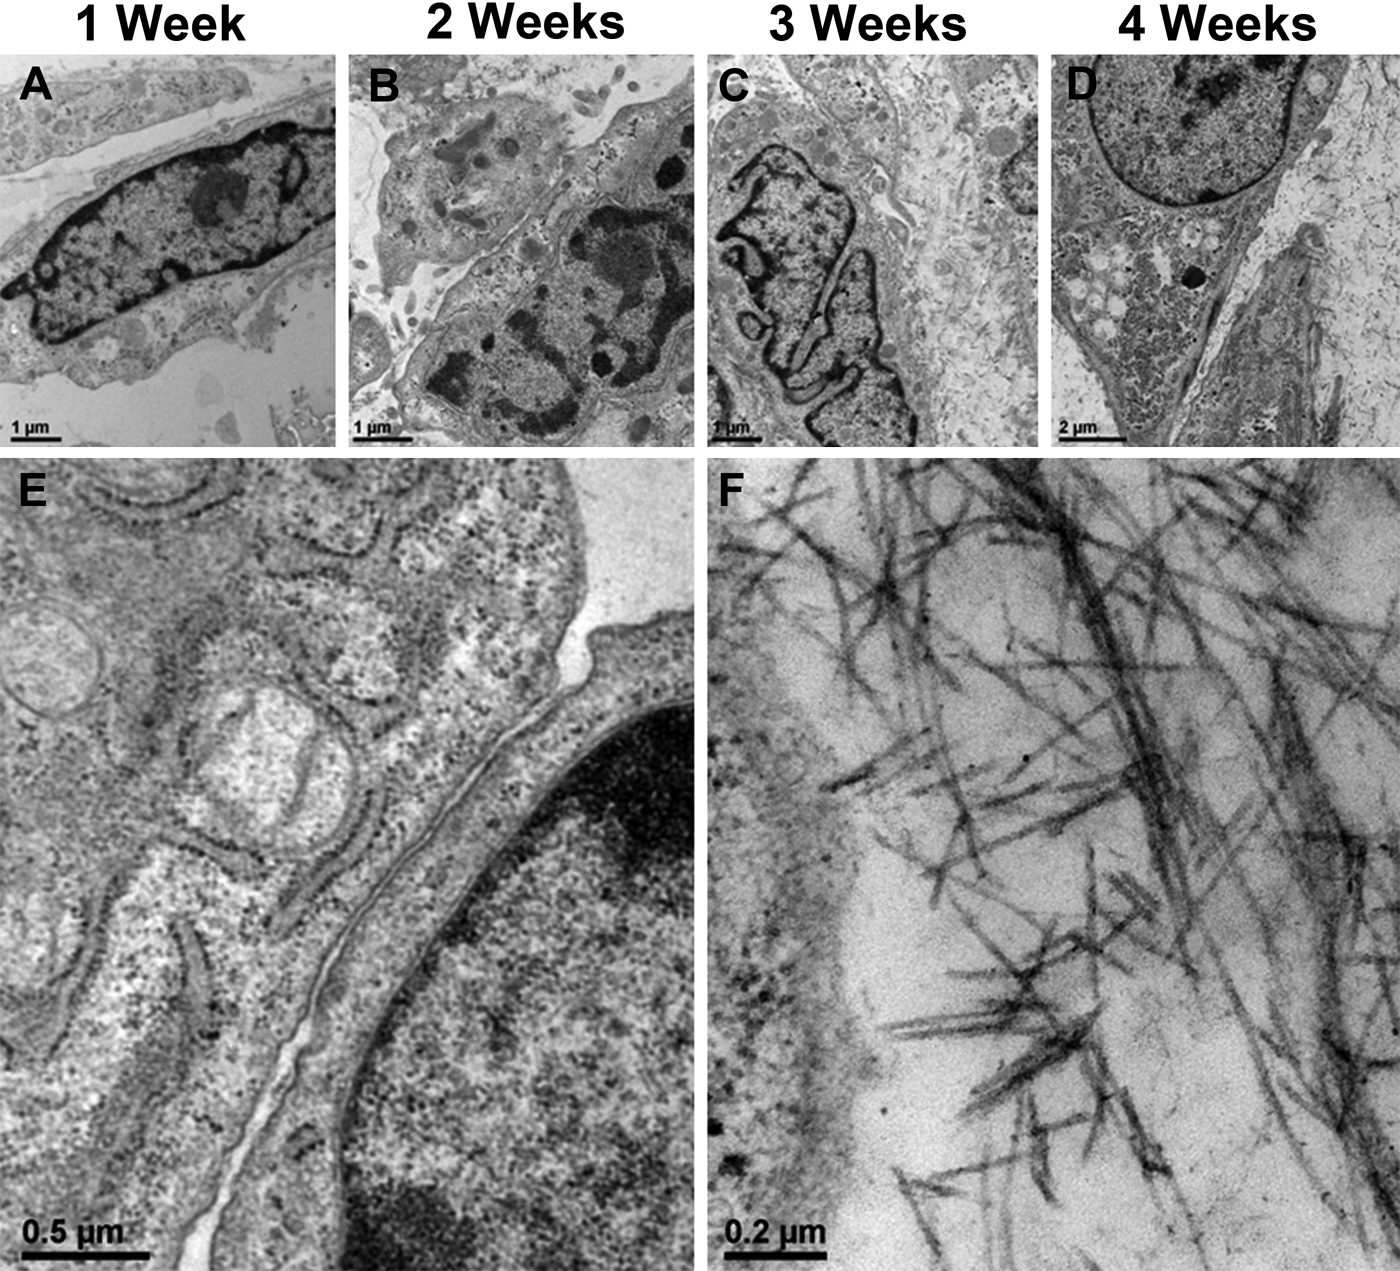
Transmission electron microscopy (TEM) of tissue formed by hP2bP0 co-culture. Transmission electron micrographs at 1 week (A), 2 weeks (B), 3 weeks (C), and 4 weeks (D) of culture. Four-week tissue showed a lack of direct cell-cell contact despite close proximity of two adjacent cells (E) and the presence of collagen fibers (F). Bars A-C = 1 µm; Bar D = 2 µm; Bar E = 0.5 µm; Bar F = 0.2 µm.
Cells in Co-culture Express Chondrogenic Genes
The expression of chondrogenic genes was analyzed over the 4-week time course (Fig. 6). bP0 showed an increase in type II collagen expression up to 72 hr of culture. Levels in bP0 and hP2bP0 fell by week 1 and then increased to 10,000-fold greater than hP2 cells alone by week 2; these levels were sustained until week 4. Type I collagen expression in co-cultured hP2bP0 and bP0 cells remained at levels comparable to hP2 cells grown alone throughout the 4-week culture. Sox 9 expression in bP0 and hP2bP0 increased about 10-fold by 48 hr. The expression further increased to 1000-fold by week 1 and was sustained for the rest of the duration of the culture. Aggrecan expression was increased in both bP0 and hP2bP0 cells relative to hP2 by 24 hr and then decreased. At 2 weeks, aggrecan levels rose, leveling off at 3 weeks in P0 cells but continuing to increase in co-cultured cells compared with hP2 cells alone after week 3 (Fig. 6).
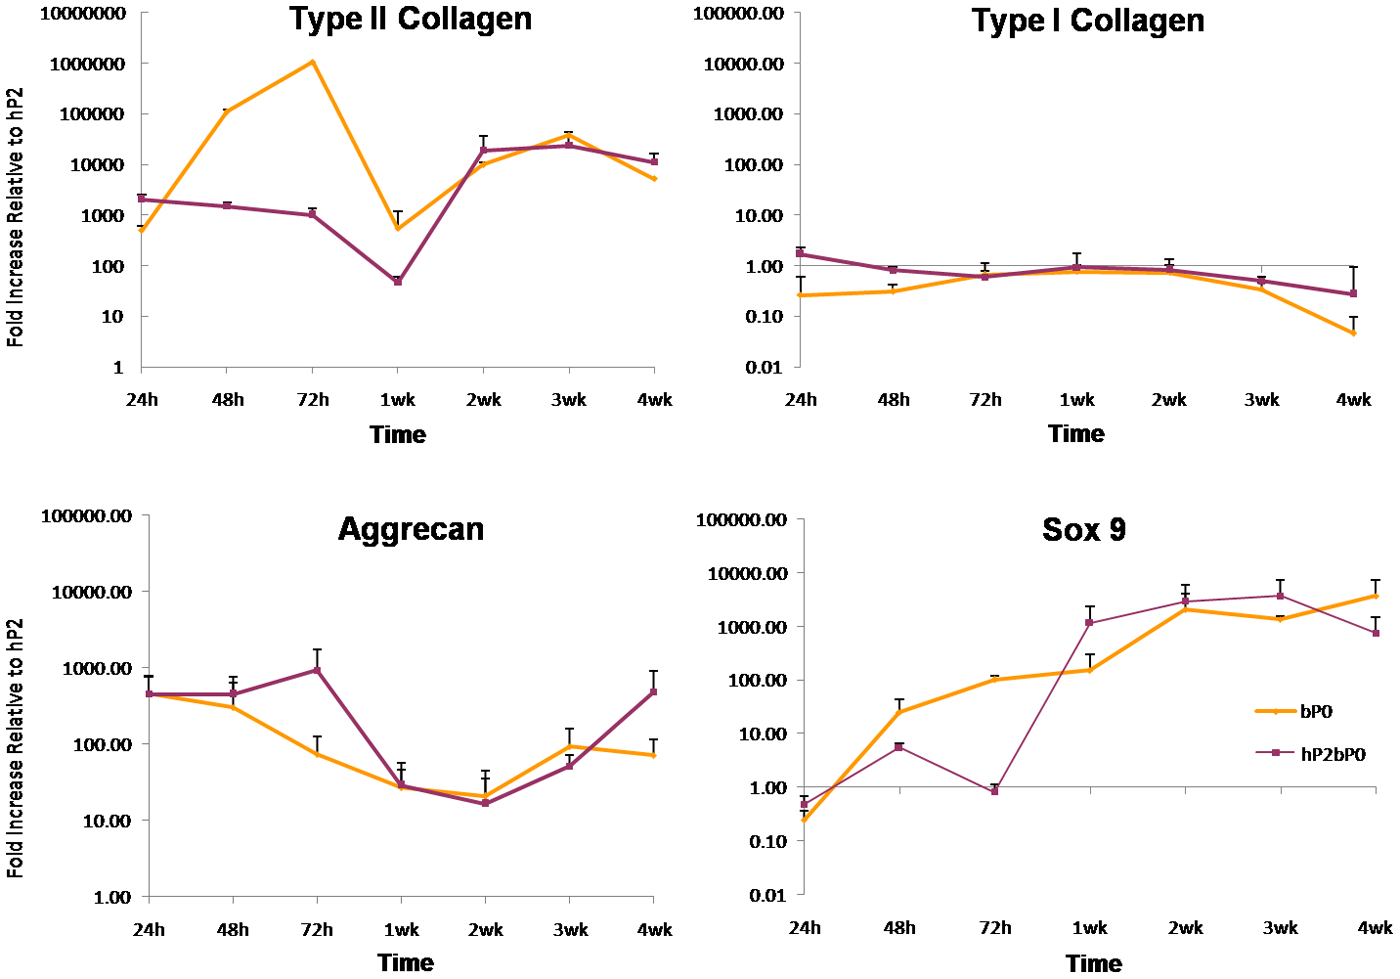
Gene expression over time. Samples were harvested at various time points from 24 hr (h) to 4 weeks (wk). Data are from one representative sample, repeated in triplicate, and are expressed as mean ± SEM on a logarithmic scale relative to human passaged cells grown alone (hP2). This experiment was repeated three times.
Discussion
This study demonstrates that co-culture of hP2 cells with bP0 chondrocytes generates hyaline cartilage that resembles that formed by bP0 chondrocytes alone between 3 and 4 weeks of culture. Biochemical studies revealed that there was no difference in proteoglycan content accumulated per cell in the tissues generated by hP2bP0 or bP0 cells by 3 weeks. By the fourth week, the collagen content of the co-cultures had reached levels present in bP0 cultures. Cells in both bP0 culture and co-culture expressed similar levels of the chondrogenic genes, Sox 9, aggrecan, and collagen type II, by 3 weeks. The tissues generated by hP2bP0 accumulated the matrix molecules aggrecan, biglycan, decorin, and type II collagen in similar distributions as that of bP0 chondrocytes cultured alone. This study provides vital information about the quality of the ECM produced by the co-cultured cells and shows that hP2 cells can be harvested as early as 3 weeks. As we have shown previously, when isolated at 4 weeks from co-cultured tissue, the redifferentiated human chondrocytes form hyaline cartilage when cultured on their own (Suppl. Fig. S1). Cartilage tissue did not form when human primary cells were cultured on their own or in co-culture with human passaged cells (Suppl. Fig. S2). Given the quality of the cartilage tissue formed by the bovine/human co-culture, it should now be possible to obtain sufficient human chondrocytes to form cartilage suitable for use as an implant for joint resurfacing.
The distribution of the matrix molecules in the cartilage formed by the hP2bP0 cells resembles that of hyaline cartilage. Aggrecan was present throughout the tissue with more accumulation in the deep zone, similar to that described for native cartilage (Hedlund et al. 1999). Immunostaining for decorin in bP0 and hP2bP0 tissues revealed higher amounts in the superficial and midzone areas of the tissue, a distribution that is similar to healthy native rabbit and human cartilage (Poole et al. 1996; Kavanagh and Ashhurst 1999). Biglycan was present throughout the tissue but was present in higher amounts in the deeper zone of both tissues. This distribution has been observed in the young (6-week postnatal) rabbit (Kavanagh and Ashhurst 1999). Type II collagen was distributed throughout the extracellular matrix when cartilage was formed, and type I collagen was detected only in the tissue formed by hP2 cells alone. This latter finding contrasts to that shown by Hayes et al. (2007), who demonstrated accumulation of a small amount of collagen type I protein in cartilage tissue formed by bP0 alone. This discrepancy may reflect the different cell seeding densities used in the two studies and/or the different detection systems used (Vectastain Elite ABC kit vs immunostaining with FITC-conjugated fluorescent labeling).
The neocartilage showed distribution of CS-4, CS-6, and CS-0 throughout the tissue. Chondroitin sulfate comprises approximately 80% of GAGs in articular cartilage (Sharma et al. 2007) and can exist in an unsulfated form or as sulphated esters at the 4- or 6-positions on the hexosamine unit. Studies have shown that CS-4 and CS-6 are distributed throughout the full thickness of immature human cartilage (Couchman et al. 1984), but with age, amounts of CS-6 stubs increase and CS-4 stubs decrease (Bayliss et al. 1999). Bayliss et al. (1995) also found that this change in the ratio of CS-6/CS-4 occurred during cartilage maturation, and no further change was detected after 25 years of age. The distribution of these molecules in the neocartilage formed by co-culture suggests that this tissue is immature. As the proportion of CS-0 remains unchanged from birth to 90 years of age (Bayliss et al. 1999), it was not unexpected to see no change in the CS-0 distribution over time in culture. In skeletally immature bovine cartilage from the humeral trochlea, the amount of unsulfated chondroitin was much lower than sulfated chondroitins (Wang et al. 2008), a feature observed in the tissues formed by co-cultured cells.
Interestingly, bP0 chondrocytes cultured alone formed cartilage tissue 1 week earlier than the co-cultured cells. It appears that the passaged cells in the co-culture were delaying the matrix accumulation by bP0 cells. This may reflect the time needed for the hP2 cells to undergo redifferentiation, similar to that described for mesenchymal stromal cells undergoing chondrogenic differentiation (Murdoch et al. 2007; Lee et al. 2011). The Sox 9 gene expression profile in these cells over time would support this. The levels of Sox 9 in the hP2bP0 cultures only approximate those of bP0 cultures by 1 week. This could also explain why collagen type II expression level was lower in these cells until 1 week. Transcription factor Sox 9 not only regulates chondrogenesis (Wright et al. 1995) but also regulates expression of type II collagen (Oh et al. 2010).
Maintenance of a similar level of type I collagen expression in the three groups was unexpected, especially as type I collagen protein was detected only in hP2 cultures. There are two possible explanations for this. It could be that despite the gene expression, type I collagen is not being synthesized by bP0 due to posttranscriptional regulation (Sumiyoshi et al. 2010; Whelan et al. 2011). Alternatively, the cells are synthesizing type I collagen, but it is not being accumulated in the matrix. It is possible that the cellular microenvironment may be regulating the translation and/or accumulation of Col I, but further study is required to confirm this.
In summary, cartilage tissue formed by co-culture is similar to that formed by bP0 chondrocytes grown alone, as demonstrated by the composition and distribution of both large (aggrecan) and small (biglycan and decorin) proteoglycans and type II collagen. These data suggest that the redifferentiated human cells are ready for isolation from this tissue between 3 and 4 weeks for use to bioengineer human cartilage. We propose that this co-culture redifferentiation culture system is an appropriate way to redifferentiate chondrocytes that have dedifferentiated during cell number expansion. In vivo studies are required to validate the functionality of the cartilage formed by the redifferentiated cells.
Footnotes
Acknowledgements
We thank Mt. Sinai Services for the collagen type II immunostaining and Mr. Harry Bojarski and Ryding-Regency Meat Packers for providing the bovine tissues.
Declaration of Conflicting Interests
The authors declared no potential conflicts of interest with respect to the research, authorship, and/or publication of this article.
Funding
The authors disclosed receipt of the following financial support for the research, authorship, and/or publication of this article: This work was supported by funding from the CIHR grant (RMF107033794). DT was supported by the Department of Orthopedic Surgery, Mt. Sinai Hospital.
References
Supplementary Material
Please find the following supplemental material available below.
For Open Access articles published under a Creative Commons License, all supplemental material carries the same license as the article it is associated with.
For non-Open Access articles published, all supplemental material carries a non-exclusive license, and permission requests for re-use of supplemental material or any part of supplemental material shall be sent directly to the copyright owner as specified in the copyright notice associated with the article.