
Abstract
To clarify the relationships between DNA damage and Cu-MT and between DNA damage and Cu in kidneys of rats injected with Au, we examined the histochemical localization of DNA damage, metallothionein (MT), and the accumulated Cu in the kidneys of rats injected with Au, Cu, or Cu-MT. The immunoreactivity of MT was observed predominantly in the outer stripe of the outer medulla and the inner cortex of the Au-injected rat, and the signals of terminal deoxynucleotidyl transferase (TdT)-mediated dUTP-biotin nick end labeling (TUNEL) were observed in the cortex. Cu detected by Timm's method was mainly distributed in the cortex of the Au-injected rat. These results indicated that DNA damage could be caused by free Cu in the cortex but not by the Cu bound to MT in the outer stripe of the outer medulla. This consideration was supported by the data from rats injected with Cu and Cu-MT. Furthermore, we determined the Cu contents in three fractions (cytosol, organelle, and precipitate-containing nuclei) of the kidneys. Interestingly, most of the Cu content in the kidney of the rat injected with Au or Cu-MT was detected in the cytosol, whereas most of the Cu content in the kidney of the rat injected with Cu was detected in the nuclei-containing precipitate. These findings suggest that the DNA damage in the kidneys of rats injected with Au may be associated with Cu-binding proteins but not with Cu-MT.
G
In a previous study (Saito et al. 1997), we reported that (a) the Cu content in the kidney of the Au-injected rat dramatically increased in comparison with the kidney of the control rat, (b) increased Cu in the kidneys was bound to MT, (c) the Cu-MT and MT mRNA were observed predominantly in the outer stripe of the outer medulla in the kidney of the Au-injected rat, and (d) in the renal cytosol of the Au-injected rat, the MT-binding molar ratios of Cu, Zn, and Au were calculated to be 10.4, 1.6, and 1, respectively, and most of the induced MT was bound to Cu. To clarify the relationships between DNA damage and Cu-MT and between DNA damage and Cu in kidneys of rats injected with Au, in the present study we examined the histochemical localization of DNA damage, Cu-MT, and accumulated Cu in the kidneys of rats injected with Au, Cu, or Cu-MT using Timm's method, immunohistochemical (IHC) techniques for MT, and TUNEL assay.
Materials and Methods
Chemicals
Biotin-16-2′-deoxyuridine-5′-triphosphate (biotin-16-dUTP), blocking reagent, and proteinase K were purchased from Boehringer Mannheim (Mannhein, Germany). Recombinant terminal deoxynucleotidyl transferase (rTdT) was from Life Technologies (Birmingham, AL). Propidium iodide, 4-chloro-1-naphthol, phosphate-citrate buffer with sodium perborate capsules, H2O2-diaminobenzidine, avidin-biotin-alkaline phosphatase, and avidin-peroxidase were from Sigma Chemical (St Louis, MO). Fluorescein isothiocyanate (FITC)-labeled streptavidin and species-specific biotinylated sheep anti-mouse IgG (second antibody) were obtained from Amersham International (Poole, UK). We prepared Cu12-MT from commercially available rabbit Cd5,Zn2-MT (Sigma) by the method described previously (Oikawa et al. 1995; Miura et al. 1996). Sephadex G-75 was obtained from Pharmacia Biotechnology (Uppsala, Sweden). All other chemicals were of analytical grade commercially available.
Animals
Male Sprague-Dawley rats (Japan SLC; Tokyo, Japan) weighing 120-145 g were housed at a constant temperature of 21.5 ± 1.5C on a 12-hr light/12-hr dark cycle for 1 week before starting the experiments. They were provided with a commercial diet (Clea Japan; Tokyo, Japan) and water ad libitum. Rats were injected daily for 5 days with an IP dose of 1 mg Au/kg as sodium tetrachloroaurate(III)dihydrate [Na(AuCl4)·2H2O] in 0.9% NaCl solution. Rats for control were injected with equal volumes of 0.9% NaCl solution. To compare with Au-injected rats, Cu or Cu-MT was administered to rats daily for 3 days by an IP dose of 1.5 mg of Cu/kg bw as CuCl2 in 0.9% NaCl or 6 mg Cu-MT/kg bw in 10 mM Tris-HCl, pH 8.1, containing 100 mM NaCl. All rats were injected with an overdose of pentobarbital (60 mg/kg bw, IP) 24 hr after the final injection and transcardially perfused with 40 mM Tris-HCl containing 152 mM NaCl, pH 8.1 (500 ml/kg). The kidneys were removed, frozen with liquid nitrogen, and immediately stored at −80C until use.
Immunohistochemistry of MT
All IHC procedures were carried out according to the method of Okabe et al. (1993), with some modifications. Tissue sections 15 μm thick were prepared and immersed in 70% methanol. The sections were processed with a blocking solution (2% blocking reagent in 40 mM Tris-HCl, pH 7.4, containing 152 mM NaCl) for 30 min, a primary antibody E9 (1:500 dilution) overnight, a biotin-tagged secondary antibody (1:200) for 4 hr, streptavidin-colloidal gold (1:200 dilution) for 1 hr, and silver enhancement for 30 min. Detection specificity of E9 against mammalian MT was confirmed by Jasani and Elemes (1991), and we also examined the detection specificity of this antibody by the primary antibody omission test and/or by E9 pretitrated with purified MT (data not shown). In this study, a silver enhancement kit (Boehringer-Mannheim) was used for visualization.
TdT-mediated dUTP-Biotin Nick End Labeling (TUNEL) Assay
DNA damage in the kidney was measured by the TUNEL assay described by Gavrieli et al. (1992) with minor modifications. Tissue sections 15 μm thick were prepared and immersed in 70% methanol. The sections were incubated for 15 min at room temperature (RT) in 10 mM Tris-HCl, pH 8.1, containing 5-20 μg/ml proteinase K. The TdT reaction was carried out in 100 mM potassium cacodylate, pH 7.2, containing 0.05 U of rTdT/μl, 2 mM CoCl2, and 4 μM biotinylated-d-UTP at 37C for 1.5 hr. Nonspecific binding sites were blocked with 2% bovine serum albumin for 30 min at RT. Then the sections were incubated for 2 hr with streptavidin-FITC diluted 1:100 in 40 mM Tris-HCl, pH 7.4, containing 152 mM NaCl and 0.3% Tween-20. The sections were treated with propidium iodide (5 μg/ml) in glycerol and were observed by confocal laser microscopy.
Confocal Laser Microscopy
The fluorescent signals of dUTP in the renal sections were imaged by a confocal laser microscopy (Biorad MRC-1024; Hercules, CA) with an upright compound microscope (Zeiss, numerical aperture 0.75). All fluorescent images were obtained by 488 nm 15 mW krypton-argon ion laser excitation with filter blocks T1 and T2A.
Cu Staining
Cu staining with the modified Timm's method, which includes trichloroacetic acid (TCA) treatment (Kozma et al. 1981; Szerdahelyi and Kasa 1986; Fujii et al. 1993) was performed for frozen sections of kidneys and livers. TCA pre-treatment was effective in removing zinc and iron, leaving copper as the major metal in the tissues. Cryostat sections (20 μm thick) were prepared and fixed in 95% alcohol for 15 min, rehydrated, and placed in 0.3% sodium sulfide solution (2.25 g of Na2S·9H2O, 3 g of NaH2PO4·H2O in 250 ml of distilled water, pH 7.3-7.4) for 2 hr and in 15% TCA for 15 min at RT. After TCA treatment, the specimens were stained with freshly made Timm's reagent (pH 3.9) for 10-20 min at 6-8C in a dark room. Timm's reagent consisted of 30 ml of 30% gum arabic, 5 ml citrate buffer, pH 3.9, 10 ml 10% hydroquinone, and 5 ml 1% silver nitrate. After staining the specimens were washed with distilled water, counterstained with hematoxylin, cleared in xylene, and mounted in Malinol (Muto Pure Chemicals; Tokyo, Japan).
Gel Filtration Chromatography
To examine the Cu concentrations of the MT in kidneys of rats injected with Au, Cu, or Cu-MT, 0.5 g of frozen kidney was thawed at 4C, cut into pieces, and homogenized (10:1 v:w) in ice-cold 50 mM Tris-HCl, pH 8.1, with a polytron model PT 10-35 (Kinematica; Basel, Switzerland) three times for 30-sec intervals. The homogenate was centrifugated at 10,000 × g for 30 min at 4C with a Kubota centrifuge, model KR/200B. An aliquot (4 ml) of the supernatant was applied to a Sephadex G-75 column (1.0 × 100 cm) equilibrated with 10 mM Tris-HCl, pH 8.1 and eluted with the same solution at 4C. The eluent was collected in 1.5-ml fractions and assayed for Au, Cu, and Zn with a Hitachi atomic absorption spectrophotometer, model 180-30.
Cu Content in Three Fractions of Kidneys
The kidneys were divided into three fractions (cytosol, organelle, and precipitate containing the nuclei). To prepare three fractions, 0.5 g of frozen kidneys from three rats was thawed at 4C, cut into pieces, and homogenized in 10 volumes (v/w) of ice-cold 50 mM Tris-HCl, pH 8.1, with the polytron three times for 30-sec intervals. The homogenate was centrifuged at 10,000 × g for 30 min at 4C. To prepare the cytosol fraction, the supernatant was recentrifuged at 110,000 × g for 60 min at 4C using a Hitachi ultracentrifuge, model 70P-72. After centrifugation, the precipitate was digested with mixed acids (2 ml concentrated HClO4 and 4 ml concentrated HNO3). The supernatant, cytosol, and digested precipitate were assayed for Cu with the Hitachi atomic absorption spectrophotometer.
Statistics
The data were statistically analyzed using the Statview II program on a Macintosh computer. The data were compared by an unpaired Student's t-test and a probability value of p<0.05 was accepted as significant.
Results
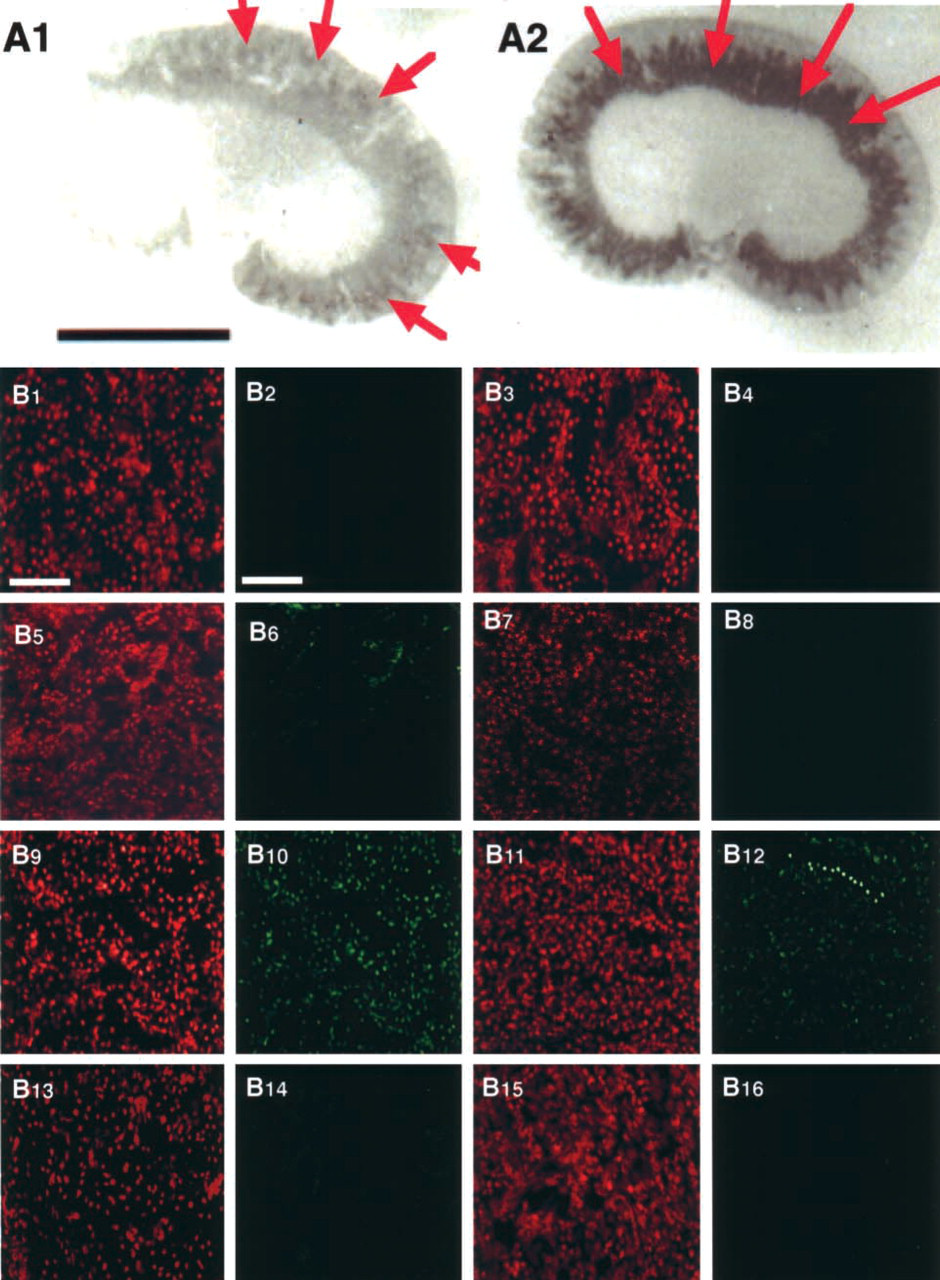
The immunoreactivity of MT was observed predominantly in the outer stripe of the outer medulla and the inner cortex in the kidneys of Au-injected rats (Figure 1A2). Faint immunoreactivity for MT was found in the inner cortex in the kidneys of control rats (Figure 1A1). To determine whether DNA damage was induced by Au, Cu, or Cu-MT injection, we examined the histochemical localization of DNA damage by the TUNEL assay (Figures 1B1–1B16). Figures 1B5 and 1B6 show that nuclei and TUNEL signals were co-localized in the renal cortex of the Au-injected rat, suggesting that DNA damage was observed in the nuclei of the renal cortex, whereas TUNEL-positive cells were not observed in the outer stripe of the outer medulla of the Au-injected rat (Figure 1B8) and the kidneys of the control rat (Figures 1B2 and 1B4). The results indicated that the DNA damage occurred in the cortex of the Au-injected rat. Figures 1B9-1B16 show the localization of nuclei and TUNEL signals in the kidneys of the rats injected with Cu and Cu-MT by confocal laser fluorescence microscopy, respectively. TUNEL-positive cells were observed in the cortex (Figure 1B10) and the outer stripe of the outer medulla (Figure 1B12) of rats injected with Cu, whereas they were scarcely detected in the renal cortex (Figure 1B14) and the outer stripe of the outer medulla (Figure 1B16) in rats injected with Cu-MT. To clarify why the DNA damage occurred in the kidney in rats injected with Au and Cu, we examined the localization of Cu staining in the kidney using Timm's method (Figure 2). Cu staining was not detected in the cortex (Figure 2a) and the outer stripe of the outer medulla (Figure 2b) of the control rat by Timm's method. Faint staining of Cu was mainly distributed in the cortex (Figure 2c) but not the outer stripe of the outer medulla (Figure 2d) of the Au-injected rat. In addition, intense staining of Cu was distributed in the cortex (Figure 2e) and in the outer stripe of the outer medulla (Figure 2f) in rats injected with Cu, whereas the staining was scarcely detected in the cortex (Figure 2g) and in the outer stripe of the outer medulla (Figure 2h) in rats injected with Cu-MT. The detailed localization of the Cu staining was observed predominantly in the nuclei of the kidneys of rats injected with Au and Cu (Figures 2c, 2e, and 2f), whereas faint staining of Cu was found in the cytoplasm. To determine the relationship between the Cu concentration in the MT fraction and DNA damage, we performed gel filtration of the cytosol obtained from the kidneys of the rats injected with Cu-MT, Au, and Cu. The distribution profiles of the renal cytosol of the control rat, and the rats injected with Au, Cu, and Cu-MT on a Sephadex G-75 column are shown in Figure 3. Peak I, with an elution volume of 33-42 ml, comprised high molecular weight proteins and peak II, with an elution volume of 54-70.5 ml, was identified as MT (Saito et al. 1999). In comparison with the control, Cu and Zn increments were attributable to the MT and high molecular weight protein fractions. The Cu concentrations of the MT fractions in kidneys of the Au-injected rats (Figure 3B) were similar to those in kidneys of the rats injected with Cu (Figure 3C), while the signals of DNA damage had a major difference among the kidneys of rats injected with Au and Cu. The Cu concentrations of the MT fractions in kidneys of rats injected with Cu-MT were lower than those of Cu- and Au-injected rats (Figure 3D). To examine the detailed localization of Cu in kidneys of rats injected with Au, Cu, and Cu-MT, we determined the Cu contents in three fractions (cytosol, organelle, and nuclei-containing precipitate) of kidneys (Table 1). The Cu contents in kidneys of rats injected with Au, Cu, and Cu-MT were five-, twelve-, and fourfold higher than the Cu content in kidneys of the control rat, respectively. After Au and Cu-MT injections, approximately 60% of the Cu content in the kidney was detected in the cytosol (Tables 1A and 1B). On the other hand, approximately 35% of the Cu content in the kidneys of rats injected with Cu was found in the cytosol (Table 1B).
(
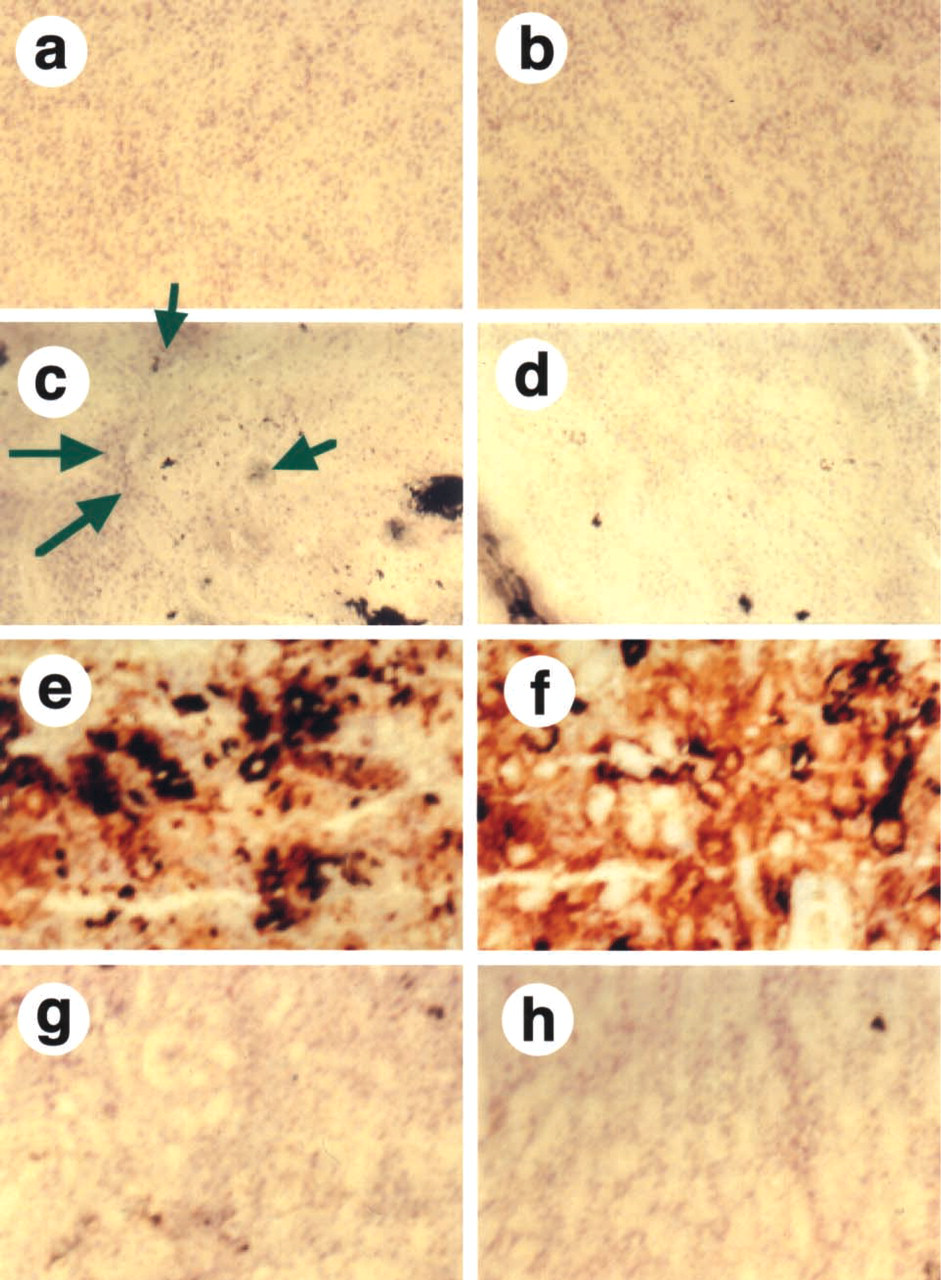
Modified Timm's method for frozen sections of the cortex (
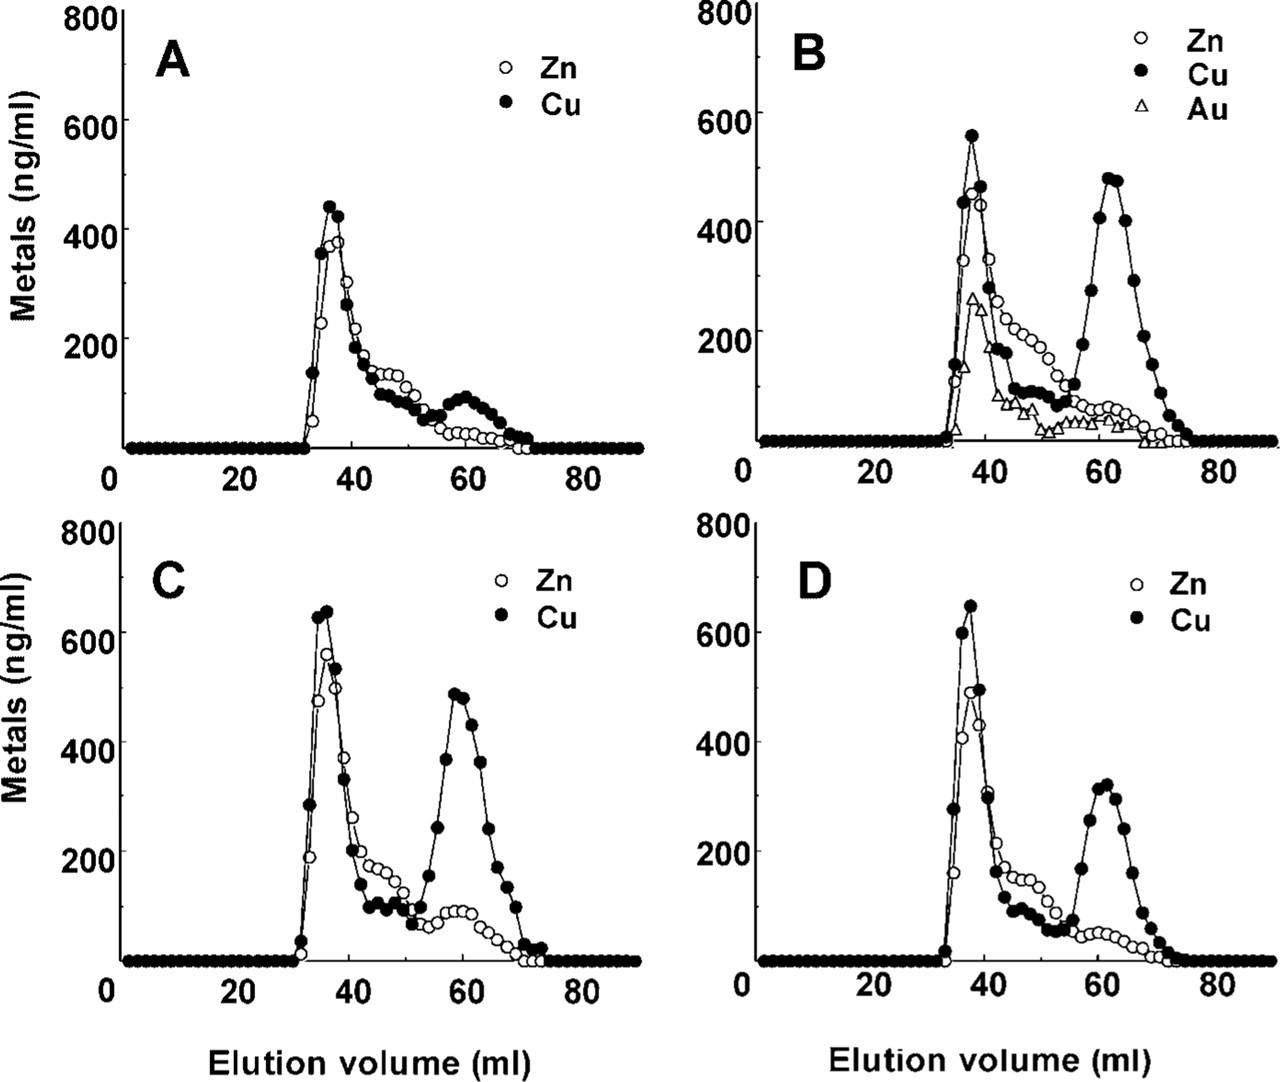
Representative elution patterns of gel filtration on Sephadex G-75 of the cytosol fractions obtained from the kidneys of the control rats (
Discussion
The present study investigated the relationships between induced Cu-MT and DNA damage and between accumulated Cu and DNA damage in the kidneys of rats injected with Au, Cu, and Cu-MT. The effects observed on each renal section of rats injected with Au, Cu and Cu-MT are summarized in Table 2. Immunoreactivity for MT was observed in the outer stripe of the outer medulla and the inner cortex in the kidneys of Au-injected rats. However, unlike the immunoreactivity for MT, the autofluorescent signals of the Cu-MT and the staining of MT mRNA were detected predominantly in the outer stripe of the outer medulla in the rat kidneys (Saito et al. 1997). The reason for these discrepancies remains unclear. However, it might be attributable to the nonspecific affinity of the MT antibody for high molecular weight proteins previously reported (Saito et al. 1999). We demonstrated the histochemical localization of Cu-MT in the kidneys of Long-Evans Cinnamon (LEC) rats as a model animal for Wilson's disease using autofluorescent emissions of Cu (I)-thiolate in Cu-MT (Okabe et al. 1996). The Cu-MT in the LEC rat kidney was also observed predominantly in the outer stripe of the outer medulla, whereas Cu-MT, as demonstrated by its autofluorescent emission properties, was predominant in the proximal convoluted tubule cells of the cortex in the kidneys of rats injected with Cu or Cu-MT (Kurasaki et al. 1998) and macular mice as a model animal for Menkes disease (Suzuki-Kurasaki et al. 1997). The reason for these discrepancies remains unclear. However, from the results it was thought that Cu metabolic disorders similar to those in LEC rats were caused by Au injection. The localization of DNA damage in the kidney of the Au-injected rat (Figure 1B6) did not coincide with that of the Cu-MT revealed by our previous study (Saito et al. 1997). On the basis of these facts, Cu-MT was believed not to be involved with DNA damage. Recently, pretreatment with TCA has been shown to be effective in removing Fe and Zn from organs, leaving only Cu to be stained by Timm's silver sulfide procedure, unlike the usual methods employed for demonstrating Cu such as orcein, rhodamine, and rubeanic acid staining (Kozma et al. 1981). Using this modified procedure, the detailed localization of Cu in the CNS of the rat (Szerdahelyi and Kasa 1986) and in the LEC rat liver (Fujii et al. 1993) has been demonstrated successfully.
Distribution of Cu in the supernatant, cytosol, precipitate, and kidney of the control rat (A) and the rats injected with Au (A), Cu (B), and Cu-MT (B) (mean ± SD from three rats)
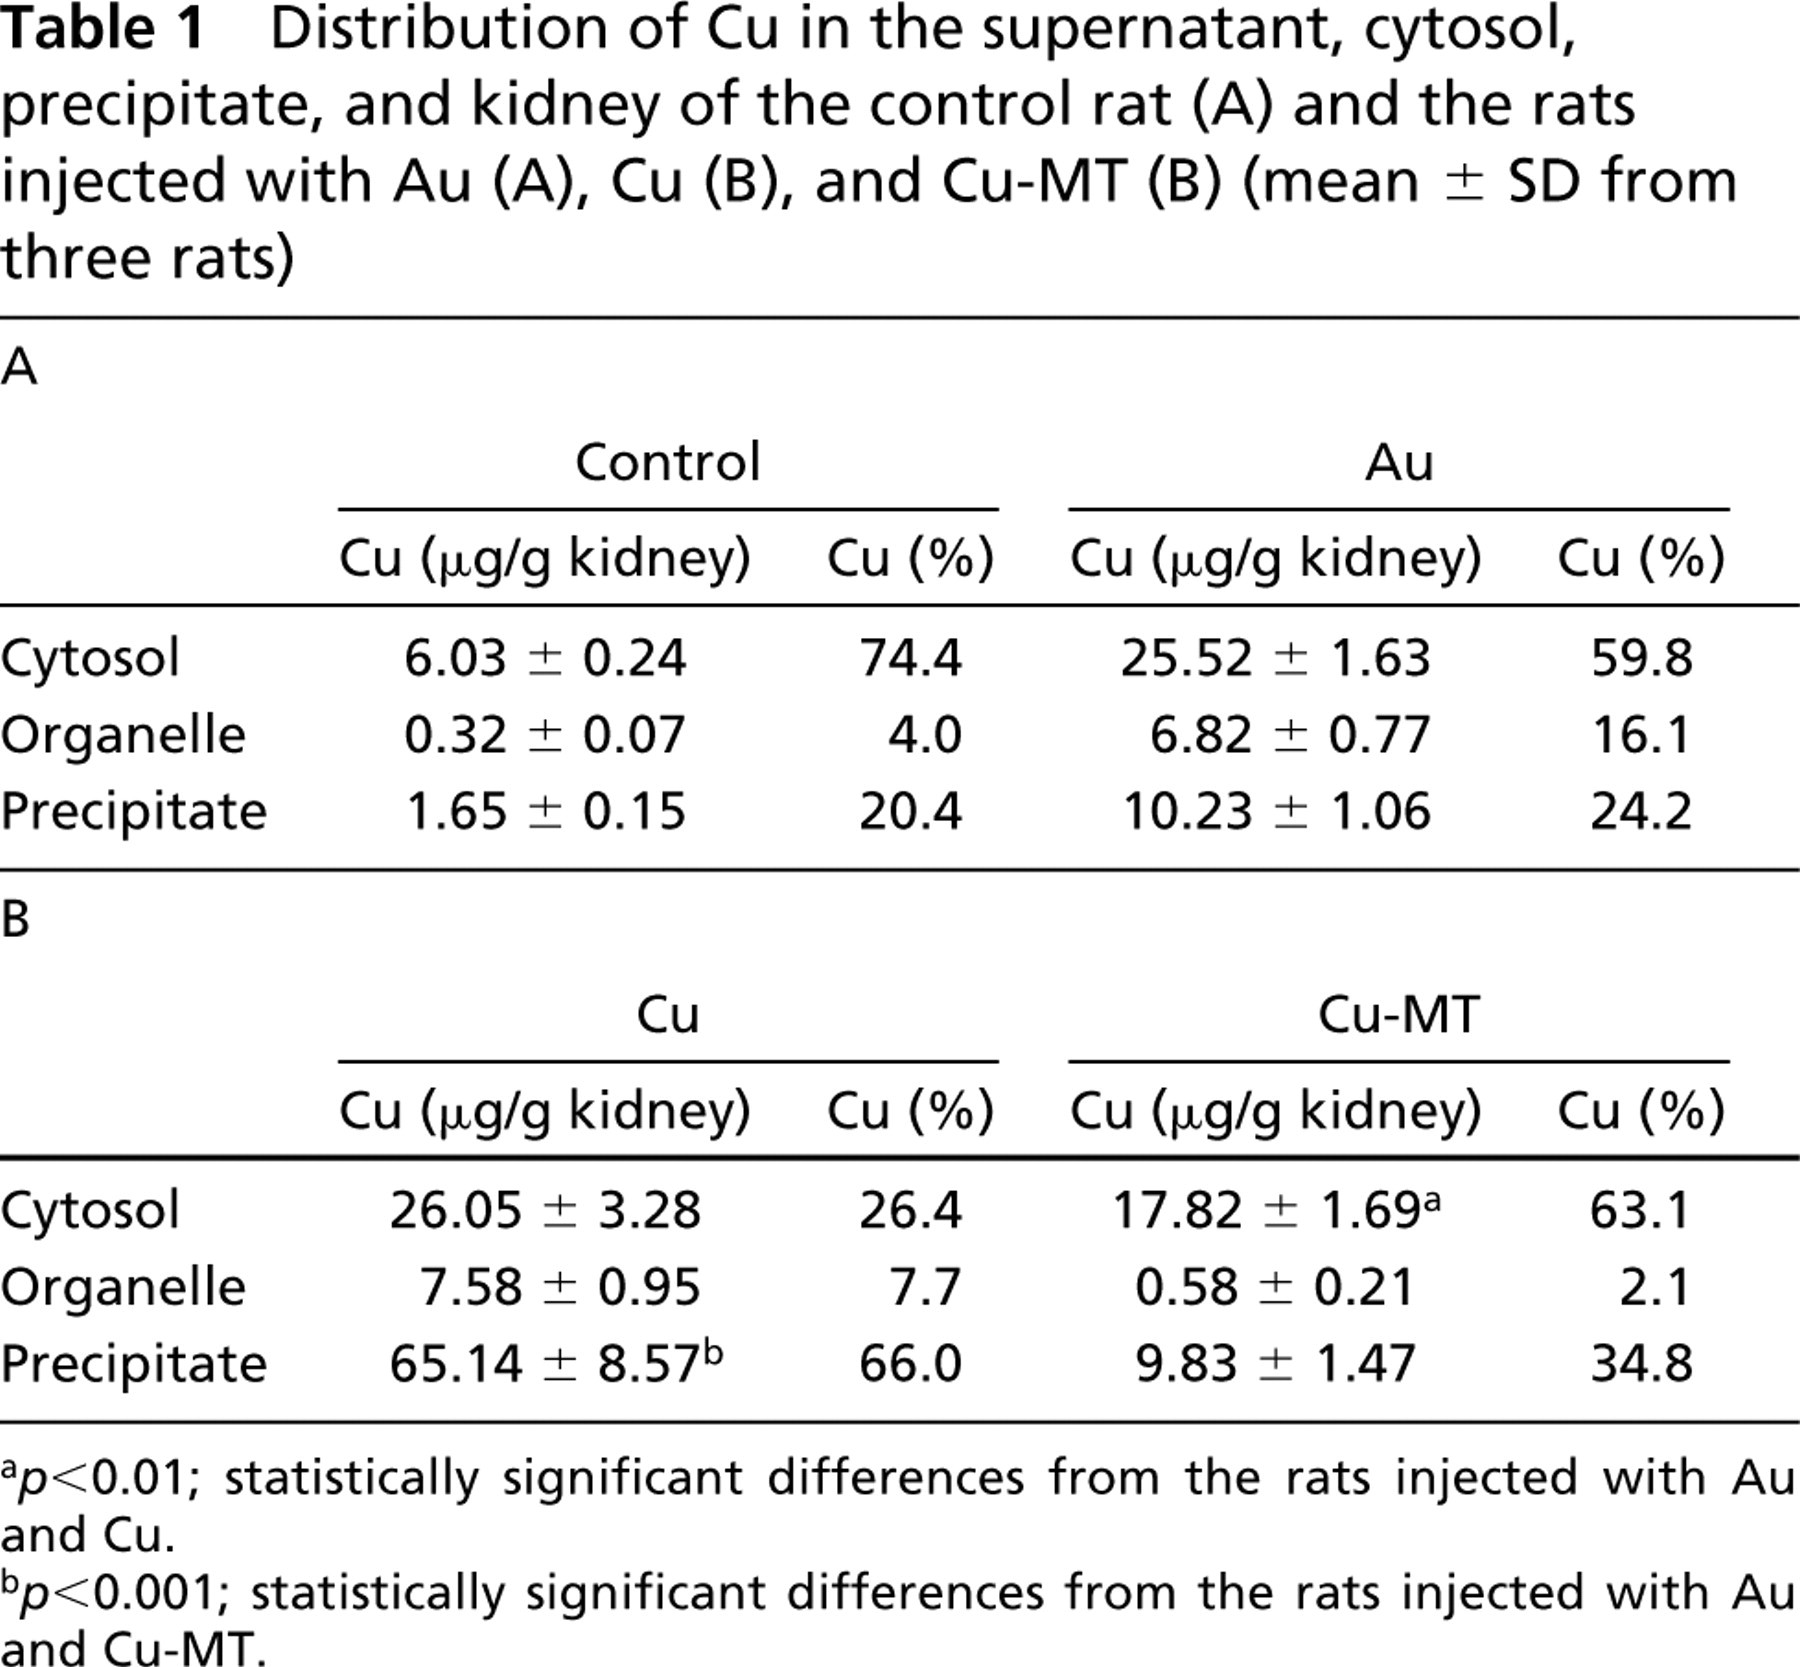
p<0.01; statistically significant differences from the rats injected with Au and Cu.
p<0.001; statistically significant differences from the rats injected with Au and Cu-MT.
In this study, it was interesting that the Cu was distributed in the renal cortex of the Au-injected rat (Figure 2c), whereas the autofluorescent signals of the Cu-MT and the staining of the MT mRNA were detected predominantly in the outer stripe of the outer medulla in the kidneys of Au-injected rats (Saito et al. 1997). Our previous study indicated that most of the increased Cu after Au injection was attributable to MT, while the Cu concentration in high molecular weight fractions from gel filtration of the renal cytosol of the Au-injected rat increased in comparison with the control rat (Saito et al. 1997). The increase of Cu in the cortex of the kidney was believed to be associated with substances such as high molecular weight proteins in cytosol or nuclei.
The localization of the MT from the Au-injected rats was not identical to that of the MT of kidneys in rats injected with Cu or Cu-MT revealed by our previous study (Kurasaki et al. 1998). We reported that localization of immunoreactive MT was observed in the renal cortex in rats injected with Cu-MT or Cu. In this study, DNA damage was caused by Cu injection but not by Cu-MT injection (Figures 1B9-1B16), suggesting that Cu-MT may protect DNA from Cu-induced cleavage.
Interestingly, the intense staining of Cu was distributed in the cortex and the outer stripe of the outer medulla of rats injected with Cu (Figures 2e and 2f). The localization of Cu staining in kidneys of rats injected with Cu-MT or Cu was not identical to that of Cu-MT in kidneys of rats injected with Cu-MT or Cu (Kurasaki et al. 1998). Although Cu-MT was observed in the renal cortex of the rat injected with Cu-MT (Kurasaki et al. 1998), staining of Cu was scarcely detected in the cortex (Figure 2g) and the outer stripe of the outer medulla (Figure 2h). Cu staining was observed in the renal cortex of the Au-injected rat (Figure 2c) but not in the outer stripe of the outer medulla of the Au-injected rat (Figure 2d). From these results, it was thought that Cu bound to MT could not be detected using Timm's method. Ideally, parts of metals in the tissue are loosely bound to proteins or other constituents or exist as free ions and can be detected in tissues using Timm's method (Brunk et al. 1968). All heavy metals should be transformed into their sulfides without any diffusion, maintaining a morphologically intact tissue. On the other hand, it is known that MT has a high affinity for heavy metals such as Cu, Zn, and Cd (Kägi 1993). Therefore, it was believed that only free Cu or Cu that was weakly bound to proteins or constituents other than MT could be found using Timm's method.
Summary of the effects observed on the renal sections of the control rat and the rats injected with Au, Cu, and Cu-MT: (A) strength of TUNEL; (B) strength of Cu staining; (C) strength of MT staining
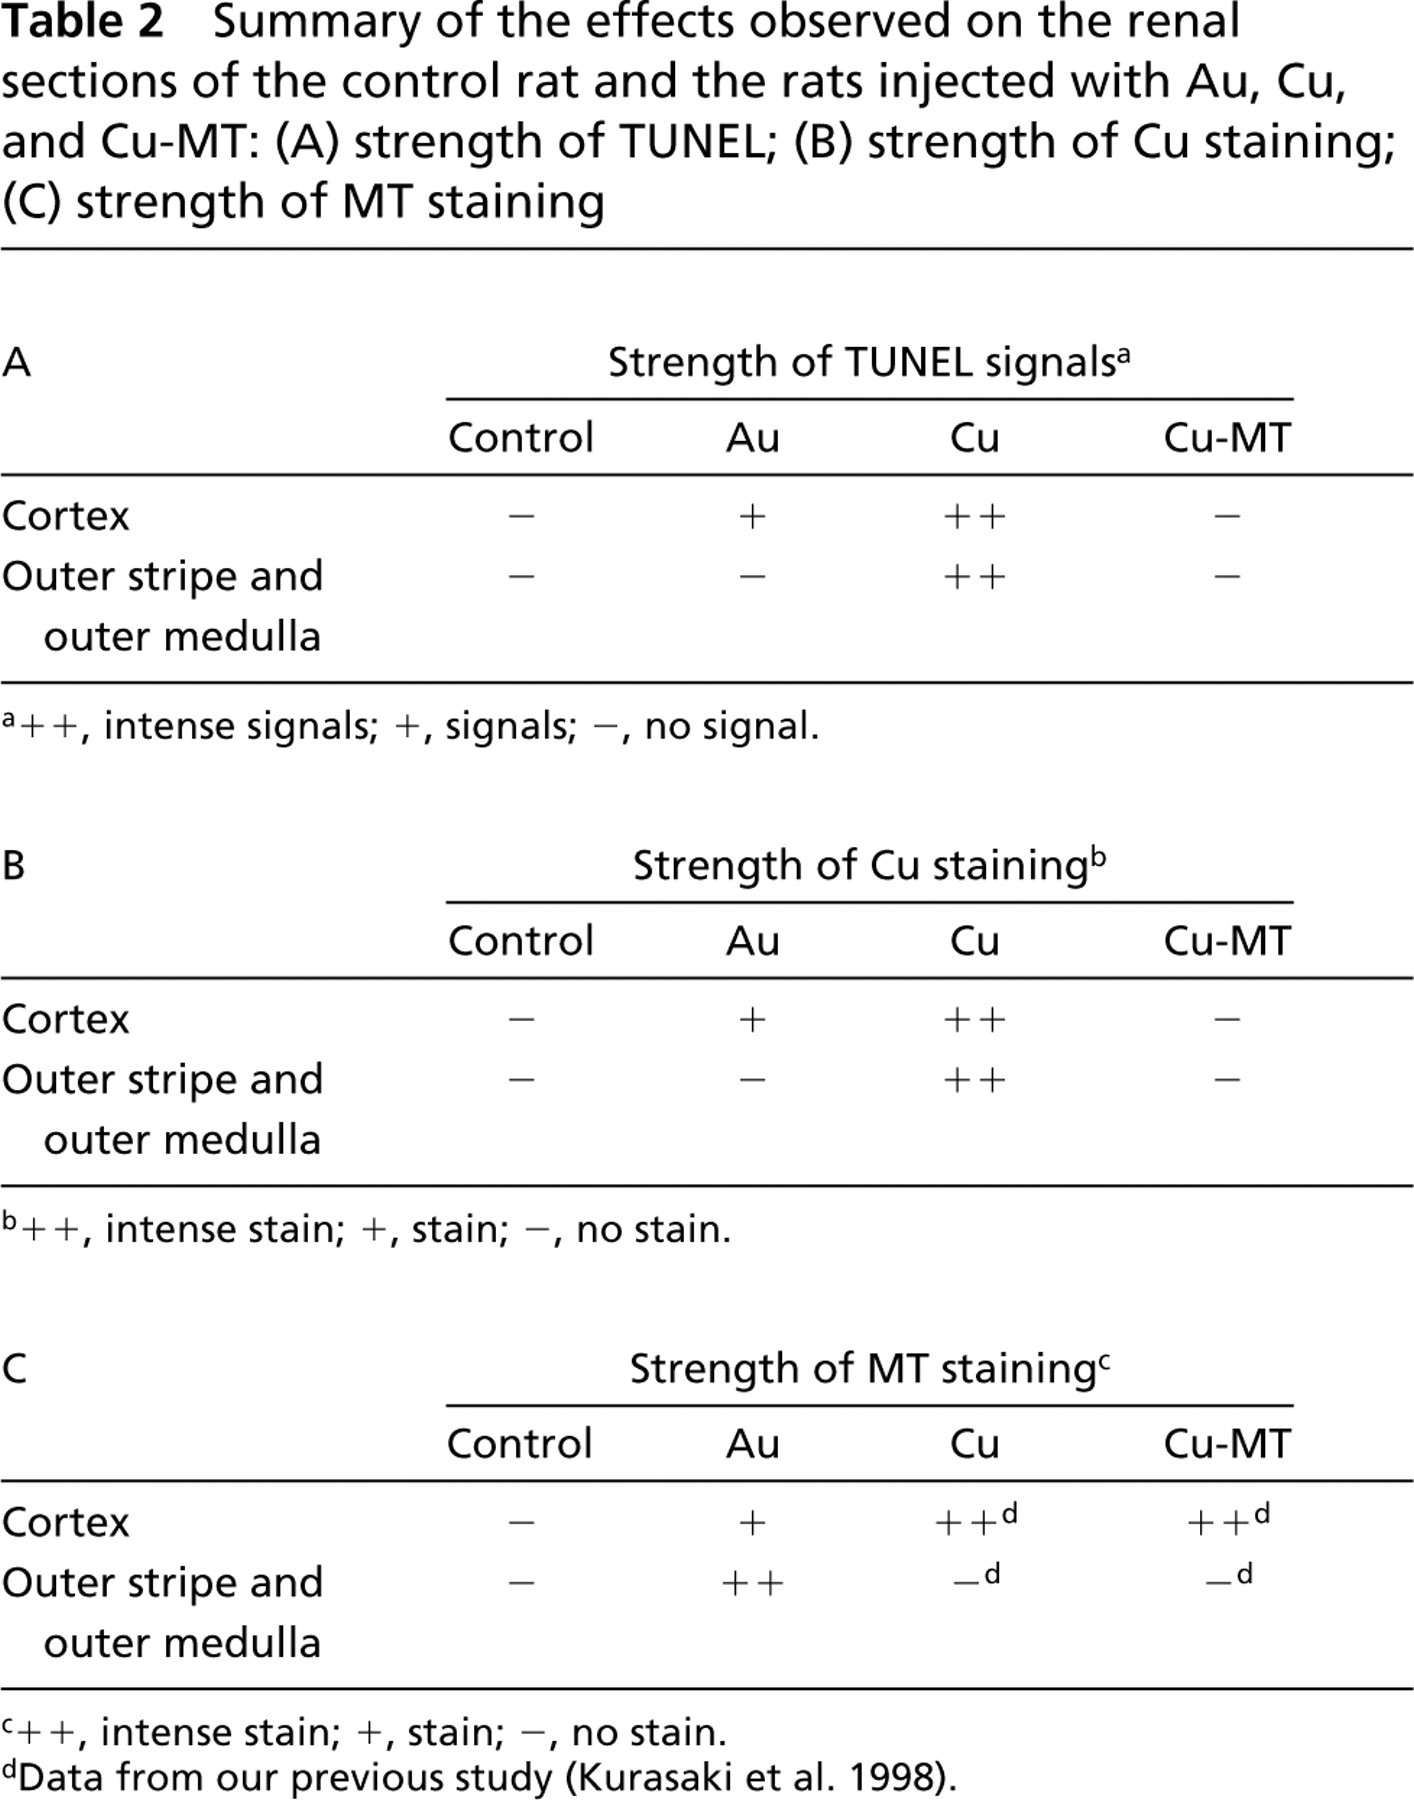
++, intense signals; +, signals; -, no signal.
++, intense stain; +, stain; -, no stain.
++, intense stain; +, stain; -, no stain.
Data from our previous study (Kurasaki et al. 1998).
In this study, the localization of DNA damage in the kidneys of the rats injected with Cu and Cu-MT was identical to that of Cu staining but not of Cu-MT. DNA damage was caused by Cu injection but not by Cu-MT injection. In rats injected with Au, the Cu staining was located in the cortex. On the basis of these results it was thought that DNA damage in the kidneys was associated with free Cu but not with Cu-MT.
The amount of Cu-MT (Figure 3) was believed not to correlate with the strength of DNA damage (Figure 1B). These results were contrary to those of the study by Deng et al. (1998), who reported that the correlation of hepatic Cu-MT, but not Cu alone, of toxic milk mutant mice with increased apoptosis provided further evidence that Cu-MT might play an important role in the toxicity of Cu. Haywood et al. (1996) reported that Cu was sequestered in the nucleus with increased apoptosis in the Bedlington terrier (which accumulates Cu) and that nuclear Cu localization was correlated with apoptotic cell death.
In this study approximately 65% of the Cu content in the kidney of rats injected with Cu was detected in the nuclei-containing precipitate (Table 1B), while approximately 30% of the Cu content in the rats injected with Cu-MT and Au was observed in the nuclei-containing precipitate (Tables 1A and 1B). The DNA damage in the kidney after Cu injection was stronger than that after Cu-MT and Au injection (Figures 1B5–1B16 ). These results suggested that DNA damage might be caused by the accumulated Cu from Cu-binding proteins except for Cu-MT in the nuclei-containing fractions.
In conclusion, our results indicate that the degree of DNA damage in kidneys of rats injected with Au, Cu, or Cu-MT correlated with the strength of Cu staining but not with the amount or the location of Cu-MT. These findings suggest that the DNA damage in the kidneys of rats injected with Au may associate with Cu-binding proteins except Cu-MT, but not with Cu-MT.
The reasons for the high Cu accumulation in the kidney induced by Au injection and the discrepancy in the localization of the induced MT in the kidneys of Au, Cu, or Cu-MT are still unclear. However, in a previous study (Kurasaki et al. 2000) we hypothesized two possible reasons for the high Cu accumulation in the kidneys of rats injected with Au. Recently, two types of genes encoding P-type cation-transporting ATPase (ATP7A and ATP7B) have been shown to be responsible for Cu transport (Bull et al. 1993; Mercer et al. 1993; Vulpe et al. 1993; Camakaris et al. 1995). ATP7A and ATP7B are believed to be the genes responsible for Menkes disease and Wilson's disease, respectively. In LEC rats, an animal model for Wilson's disease (dysfunctional ATP7B and functional ATP7A), Cu is accumulated in the liver and kidney (Li et al. 1991), and Cu-MT is predominantly observed in the outer stripe of the outer medulla in the kidney (Okabe et al. 1996). On the other hand, in macular mice, an animal model for Menkes disease (functional ATP7B and dysfunctional ATP7A), Cu is scarely detectable in the liver and Cu-MT is located only in the cortex of the kidney in which Cu has accumulated (Kurasaki et al. 1998). In normal rats (functional ATP7A and ATP7B) injected with Cu or Cu-MT (Evering et al. 1990; Schmid et al. 1993; Kurasaki et al. 1998), Cu accumulates in the liver and kidney and Cu-MT is located in the cortex of the kidney. On the basis of these reports, the high Cu accumulation in the kidneys of rats injected with Au was considered to be caused by dysfunctional ATP7B, because MT localization in the kidney showed the same pattern in the kidneys of LEC rats. However, further investigation of ATP7A and ATP7B will be needed to understand the mechanism of the Cu accumulated in the kidney after Au injection.