
Abstract
CD26/DPPIV is a cell surface glycoprotein that functions both in signal transduction and as a proteolytic enzyme, dipeptidyl peptidase IV (DPPIV). To investigate how two separate functions of one molecule are regulated, we analyzed CD26 protein expression and DPPIV enzyme activity on living human T-helper 1 (Th1) and Th2 cells that express different levels of CD26/DPPIV. DPPIV activity was specifically determined with the synthetic fluorogenic substrate ala-pro-cresyl violet and CD26 protein expression was demonstrated with an FITC-conjugated CD26-specific antibody. Fluorescence of liberated cresyl violet (red) and FITC (green) was detected simultaneously on living T-cells using flow cytometry and spectrofluorometry. Th1 cells expressed three- to sixfold more CD26 protein than Th2 cells. The signal transduction function of the CD26/DPPIV complex, tested by measuring its co-stimulatory potential for proliferation, was directly related to the amount of CD26 protein at the cell surface. However, DPPIV activity was similar in both cell populations at physiological substrate concentrations because of differences in Km and Vmax values of DPPIV on Th1 and Th2 cells. Western blotting and zymography of Th1 and Th2 whole-cell lysates demonstrated similar patterns. This study shows that two functions of one molecule can be controlled differentially.
CD26/DPPIV is a 110-kD cell surface glycoprotein that is mainly expressed on mature thymocytes, activated T-cells, B-cells, NK-cells, macrophages, and epithelial cells of the small intestine, kidney, and liver. It has at least two functions, a signal transduction function and a proteolytic function (Morimoto and Schlossman 1998). CD26 interactions with molecules such as adenosine deaminase (ADA) (Kameoka et al. 1993; Dong et al. 1996,1997) and CD45 (Koretzky et al. 1990; Torimoto et al. 1991) initiate signal transduction (Munoz et al. 1992) and modulate co-stimulation and proliferation of activated T-cells (Hegen et al. 1997). In addition, FcR-mediated crosslinking of CD26 by a CD26-specific antibody induces activation of human T-lymphocytes (Dang et al. 1990).
DPPIV proteolytic activity can modify proteins with the dipeptide sequences X-ala or X-pro at the N-terminal position. Examples of these proteins include cytokines, such as interferon-γ (IFN-γ) and interleukin-2 (IL-2), growth factors, and chemokines, such as granulocyte chemotactic protein-2 (GCP-2) and the C-C chemokine RANTES (Proost et al. 1998,1999; Schols et al. 1998; Iwata et al. 1999; Van Damme et al. 1999). Processing by DPPIV activity either leads to activation of the proforms or is a first step in proteolytic degradation. It has recently been demonstrated that glucagon also is cleaved by DPPIV activity, thereby lowering its affinity for the glucagon receptor (Hinke et al. 2000). Other natural substrates of DPPIV are the hormones glucagon-like peptide-1 (GLP-1) and glucose-dependent insulinotropic polypeptide (GIP). The intact forms enhance glucose-stimulated insulin secretion. DPPIV activity can abolish this effect in vitro (Marguet et al. 2000). It has been demonstrated that the chemokine eotaxin is an important mediator in allergic reactions because it attracts eosinophils, Th2-lymphocytes, and basophils. Human eotaxin has a penultimate proline residue and is effectively cleaved by CD26/DPPIV. NH2-terminal truncation reduces the chemotactic activity of eotaxin as it does for factor-1α (Proost et al. 1998) and the monocyte chemotactic proteins 1 and 2 (Proost et al. 1999). This physiological processing may be an important downregulatory mechanism, limiting the eotaxin-mediated inflammatory response (Struyf et al. 1999). CD26/DPPIV is involved in the pathology of a variety of diseases, such as AIDS (Blazquez et al. 1992; Vanham et al. 1993; Schols et al. 1998), Graves' disease (Eguchi et al. 1989; Nishikawa et al. 1995), and cancer (Stecca et al. 1997).
Protective immunity against different types of pathogens requires polarization of the immune response (Kapsenberg et al. 1991; Romagnani 1994). Th1 cells produce high levels of IFN-γ, which is instrumental in the cellular immune response to intracellular pathogens, whereas Th2 cells produce interleukin 4 (IL-4), which is needed for the humoral immune response to extracellular pathogens (O'Garra 1998). However, chronic activation of Th1 or Th2 effector cells may lead to autoimmune disorders or allergy, respectively (Kapsenberg et al. 1991; Romagnani 1994). Human Th1 cell lines are known to express higher levels of CD26 protein than Th2 cell lines (Willheim et al. 1997). Thus far, it is unknown how CD26 protein expression and DPPIV activity are regulated after T-cell activation and whether both functions of the molecule contribute to differences in Th1 and Th2 cell function. To investigate the coordinate regulation of the two functions of this molecule, we applied a model system of human in vitro polarized Th1 and Th2 cell lines generated from purified naive Th cells. We quantitatively compared CD26 expression and DPPIV activity on living Th1 and Th2 cell populations after TCR/CD3 stimulation. We report here a three- to sixfold increased CD26 expression on activated Th1 cell lines compared to Th2 cell lines, whereas both cell types have a similar capacity for proteolytic cleavage. The co-stimulatory function for proliferation is proportional to the level of CD26 surface expression, suggesting independent regulation of two functions of one and the same molecule.
Materials and Methods
Generation of Polarized Human Th1 and Th2 Cell Lines
Human peripheral blood mononuclear cells (PBMCs) were isolated from buffy coat (Central Laboratory of the Netherlands Red Cross Blood Transfusion Service (CLB); Amsterdam, The Netherlands) by density gradient centrifugation on Lymphoprep (Nycomed; Torshov, Norway). From this material, CD4+ CD45RA+ naive Th cells were isolated to high purity through one-step high-affinity negative selection columns (R&D Systems; Abingdon, UK) according to the manufacturer's instructions. These purified naive Th cells (normally >98%) were stimulated as described (Hilkens et al. 1997) in 96-well culture plates (Costar, Cambridge, MA; 105 cells/well) with immobilized CD3 MAb (CLB-T3/3; 1 μg/ml) and soluble CD28 MAb (CLB-28.1; 2 μg/ml), both obtained from CLB. Cells were cultured for 10 days in the presence of rIL-2 (10 U/ml; Chiron, Emeryville, CA) and either rIL-4 (1000 U/ml; Pharma Biotechnology, Hannover, Germany) for Th2-polarizing conditions, or rIL-12 (100 U/ml; gift of Dr. Gately, Hofman-La Roche, Nutley, NJ) for Th1-polarizing conditions. The resulting Th1 and Th2 cell lines were tested for IL-4 and IFN-γ production by intracellular staining and analysis by flow cytometry and fluorescence microscopy to confirm polarization. Aliquots of polarized cells were frozen and stored at −80C.
For each experiment, Th1 and Th2 cell lines were thawed and restimulated with phytohemagglutinin (10 μg/ml; Difco, Detroit, MI) as described previously (Wierenga et al. 1990) in the presence of rIL-2 (10 U/ml) and 3000-rad irradiated feeder cells (PBMCs from two different donors) and in the additional presence of either rIL-12 (100 U/ml) + neutralizing anti-IL-4 (gift from Dr. C.T.M. van de Pouw Kraan; CLB) to maintain Th1 polarizing conditions, or rIL-4 (1000 U/ml) + neutralizing anti-IL-12 (gift from Dr. P.H. van der Meide; U-cytech, Utrecht, The Netherlands) to maintain Th2 polarization conditions. All cell cultures were performed in Iscove's modified Dulbecco's medium (IMDM; Bio-Whittaker, Walkersville, MD) supplemented with 5% pooled C-inactivated normal human serum (Bio-Whittaker) and gentamicin (80 μg/ml; Duchefa, Haarlem, The Netherlands) and were incubated at 37C in a humidified atmosphere containing 5% CO2. For CD26/DPPIV analyses on living cells, activated Th cells were harvested at day 3 by density centrifugation (20 min at 800 × g) on Lymphoprep to separate them from dead feeder cells. Living T-cells were collected from the interface, washed, and diluted to 2 × 10⁵ cells/ml for all experiments. As a negative control, Jurkat cells (clone E6-1; American Type Culture Collection, Manassas, VA) were used, which lack CD26/DPPIV expression.
Polarization Studies
Changes in CD26/DPPIV expression during differentiation of T-cells were established during restimulation of Th1 and Th2 cells under different conditions. On day 3 of restimulation, CD26 expression and DPPIV activity were measured when differences in CD26/DPPIV expression between Th1 and Th2 cells are most profound (Kähne et al. 1996; Willheim et al. 1997)
Detection of Intracellular Cytokines by Flow Cytometry
Cytokine production was determined by intracellular staining using the method described by Jung et al. (1998). Briefly, Th1 and Th2 cells were cultured for 10 days as described above. After removal of dead feeder cells, Th cells were re-stimulated for 6 hr in 24-well culture plates (Costar; 106 cells/well) with phorbol 12-myristate 13-acetate (10 ng/ml; Sigma, St Louis, MO) and ionomycin (1 μg/ml; Sigma) and the last 5 hr in the presence of brefeldin A (10 μg/ml; Sigma). Cells were then washed in PBS. The supernatant was discarded and the pelleted cells resuspended, fixed in 4% cold paraformaldehyde (Merck; Darmstadt, Germany), and gently vortexed. Fixation was performed at RT for 15 min. The cells were washed for a second time in PBS, followed by a wash step in PBA [PBS + 0.5% (w/v) BSA + 0.05% (w/v) sodium azide; Roche, Mannheim, Germany]. The fixed cells were stained by addition of 50 μl of antibody solution in saponin buffer (PBA + 0.5% saponin; Sigma) to 105 cells and incubation for 30 min at 4C. Anti-human IL-4-phycoerythrine (PE) and anti-human IFN-γ-FITC, both from Becton-Dickinson (Mountain View, CA), were used according to the manufacturer's recommendations. The cells were washed in saponin buffer, followed by a second wash in PBA. The supernatant was discarded, and the pelleted cells were resuspended in 0.2 ml PBA and stored at 4C until analyzed. Flow cytometric analysis of IL-4 and IFN-γ production in living T-helper cells was performed on a FAC-star plus (Becton-Dickinson) using the software program CellQuest, version 3.2. Analyses were performed at a rate of 200 cells/sec. PE fluorescence was determined as a measure of IL-4 production (excitation at 543 nm and emission at 575 nm). FITC fluorescence was determined as a measure of IFN-γ production (excitation at 488 nm and emission at 530 nm). Cells were gated only on the basis of forward and side scatter.
Fluorescence Microscopy
A mixture of Th1, Th2, and Th0 cells was stained for intracellular IL-4 and IFN-γ production. Cells were then stained for CD26 expression as described below in detail. Triplestained cells were mounted on an object glass coated with poly-
T-cell Proliferation Assay
ELISA plates (Costar) were coated for 2 hr at 37C with a goat anti-mouse IgG antibody (Zymed, San Francisco, CA; 1:1000). Then the protein binding sites were saturated for 30 min with IMDM containing 10% FCS. After blocking, the plates were washed with IMDM + 5% human serum. The plates were then incubated for 60 min at 37C with a 1:3 serial dilution of anti-human CD3 antibody (CLB-T3/3; CLB) starting at 1:4000 (0.75 μg/ml), in the presence or absence of anti-human CD26 (Ta1; CLB) starting at a dilution of 1:200 (1 μg/ml). Finally, the plates were washed with IMDM + 5% human serum. Polarized Th1 and Th2 cells were seeded onto the coated plates (2 × 10⁵ cells/well) in a final volume of 200 μl. After 24 hr, 20 μl of [3H]-TdR (0.3 μCi; Amersham, Poole, UK) was added to each well for a 16-hr pulse, after which incorporation of radioactivity was determined in a scintillation spectrometer (Biorad; Hercules, CA) as a measure of proliferation.
Analysis of CD26 Expression and DPPIV Activity
Living T-cells were harvested at different time points after stimulation and analyzed for their CD26 expression and DPPIV activity by flow cytometry and fluorospectrometry, respectively. For CD26 detection, cells were incubated for 30 min at 4C with FITC-conjugated anti-human CD26 MAb Ta1 (1:80 diluted stock solution of 0.2 mg/ml) and washed twice in cold PBS. In some cases, CD26 was detected using a two-step incubation with unconjugated Ta1 mAb used in the first step and a Cy5-conjugated goat anti-mouse IgG (Amersham) in the second step (dilution 1:200). Cells were kept on ice before mixing with the enzyme incubation medium. Incubations were started at t=0 by suspending T-cells in PBS containing 20 μM of the DPPIV substrate ala-pro-cresyl violet, which becomes fluorescent after proteolysis (Enzyme Systems Products and Prototek; Livermore, CA; Van Noorden et al. 1997). Incubations were carried out at 20C. Fluorometric analysis was performed on an LS 50 fluorescence spectrometer (Perkin-Elmer; Gouda, The Netherlands) under continuous magnetic stirring. Cuvettes with a light path of 1 cm were used. Excitation was performed at 591 nm with a slit width of 15 nm and emission was detected at 628 nm with a slit width of 15 nm (Boonacker and Van Noorden 2001). The increase in fluorescence was measured over 4 min. Fluorescence values were plotted against substrate concentrations. A hyperbolic curve was fitted to the data with the use of a curve-fitting program (Mac Curve Fit; Apple, Cupertino, CA) and Vmax and Km values were calculated for living Th1 and Th2 cells. Statistics were performed where appropriate, using the one-tailed Student's t-test for paired observations (Graph Pad Instat version 3.00 for Windows 95; Graph Pad Software, San Diego, CA; www.graphpad.com). Differences were considered significant when p < 0.05.
Flow cytometric analysis of CD26 expression on living T-helper cells was performed on an FAC-star plus (Becton-Dickinson) using the software program CellQuest version 3.2. Analyses were performed at a rate of 200 cells/sec. FITC fluorescence was determined as a measure of CD26 expression (excitation at 488 nm and emission at 530 nm).
Confocal Microscopy
Th1 cells were stained for CD26 expression as described above. Cells were kept on ice to prevent internalization of CD26. Cells were kept in cold PBS using glass-bottomed poly-
Western Blotting and Zymography of DPPIV Activity
Cells were cultured and washed as described above. At day 3, equal numbers of washed cells were lysed by freezing in liquid nitrogen and membrane fractions were pelleted, resuspended in 25 mM Tris-HCl (pH 7.4) containing 50 mM NaCl and 1% Triton-X100, and kept for 1 hr at 0C. Both Th1 and Th2 samples were ultrasonically shaken three times for 15 sec and centrifuged a second time for 10 min at 4C. The pellet was discarded and the membrane proteins in the supernatants were mixed with (5 X) sample buffer free of β-mercaptoethanol and heated to 37C for 5 min. Equal amounts of protein were transferred onto 7.5% SDS gels. After electrophoresis, the gels were washed twice with 2.5% Triton-X100 (v/v) at RT for 30 min to remove SDS. Gels were then rinsed three times with PBS and incubated at 37C in PBS containing 20 μM ala-pro-cresyl violet for up to 12 hr. Zymograms were digitally recorded by analyzing fluorescence directly in the gels using a Storm 860 scanner (Molecular Dynamics; Sunnyville, CA). To correlate DPPIV activity and CD26 protein expression, samples were also subjected to Western blotting. To this aim, gels were transferred to nitrocellulose filters overnight at 30 mA. The blots were washed in PBS and blocked for 1 hr in 5% Protifar (Nutricia; Zoetermeer, The Netherlands) in PBS containing 0.05% Tween-20. Blots were stained for 1 hr with anti-CD26 antibody Ta1 (1:200 in blocking buffer) to label CD26 protein and washed twice for 15 min in 5% Protifar in PBS containing 0.05% Tween-20. As a secondary antibody, we used monoclonal horseradish peroxidase-conjugated goat anti-mouse IgG in a dilution of 1:2000 (Nordic; Tilburg, The Netherlands) using Lumi-Light Western blotting substrate (Boehringer; Mannheim, Germany). Chemiluminescence was analyzed in the Lumi-Imager (Boehringer).
Electron Microscopy
For electron microscopy, living T-cells were incubated to demonstrate DPPIV activity after washing in phosphate buffer (100 mM, pH 7.4). The incubation lasted for 30 min at 37C in 100 mM cadocylate buffer, pH 7.4, containing 6% polyvinyl alcohol and 2 mg ala-pro-methoxynaphthylamine (MNA; Enzyme Systems Products) as substrate, which was first dissolved in 20 μl dimethylformamide and as coupling reagent 60 μl/ml hexazotized pararosanilin as described by Van Noorden and Frederiks (1992). After incubation, cells were washed in phosphate buffer (100 mM, pH 7.4) and fixed in McDowell 1% (w/v) glutaraldehyde and 4% (w/v) paraformaldehyde in 100 mM cacodylate buffer, pH 7.4; fixation lasted for 60 min at 4C. Fixation was followed by centrifugation at 1000 × g at 4C. Cells were rinsed in 100 mM cacodylate buffer, pH 7.4, for 30 min, postfixed in 1% OsO4 (Drijfhout; Amsterdam, The Netherlands) in 100 mM cacodylate buffer, pH 7.4, for 60 min at 4C, dehydrated, and embedded in epoxy resin Lx-112 (Ladd; Burlington, VT) according to standard procedures. Semithin sections (1-2 μm thick) were cut on a Pyramitome (LKB; Uppsala, Sweden) parallel to the surface of the embedded cells and stained with methylene blue to check the quality of preservation of the morphology of cells. Ultrathin sections (50-70 nm thick) were cut on a Ultrotome III ultramicrotome (LKB) and studied with an EM-10C transmission electron microscope (Zeiss; Oberkochen, Germany).
Results
Cytokine production by Th1 and Th2 cell lines was analyzed by intracellular labeling and flow cytometry to test for polarization. Double labeling of the hallmark Th1 and Th2 cytokines IFN-γ and IL-4, respectively, confirmed almost complete polarization on neutral stimulation without exogenous IL-4 or IL-12 restimulation on day 11 as determined by FACS analysis (Figure 1) and fluorescence microscopy (Figure 2). Intact living T-helper cells expressed CD26/DPPIV on their plasma membrane, as shown in Figure 3. When intact living Th cells were incubated to localize DPPIV activity, final reaction product was present on the plasma membrane only (Figure 4). Flow cytometric analysis of IL-4- or IFN-γ-producing cells for expression of CD26/DPPIV showed that Th1 cells expressed sixfold more CD26/DPPIV at day 3 after restimulation than Th2 cells (Figure 5). At that stage, the difference in CD26/DPPIV expression between Th1 and Th2 cells is most pronounced (Kähne et al. 1996; Willheim et al. 1997).
When the reactions were analyzed fluorometrically in suspensions of living Th1 and Th2 cells, a linear increase in cresyl violet fluorescence was observed for up to 4 min (Figure 6A). Jurkat cells, which lack CD26/DPPIV expression, did not show any fluorescence formation due to DPPIV activity. Variation of the substrate concentration revealed Michaelis-Menten kinetics of DPPIV activity in both living Th1 and living Th2 cells (Figure 6B). Both Km and Vmax values were approximately twofold higher on Th1 cells than on Th2 cells (Th1 Vmax = 30.3 ± 10.8 FU/sec and Km = 10.8 ± 1.7 μM; Th2 Vmax = 13.3 ± 2.8 FU/sec and Km = 6.3 ± 2.1 μM; n=3; p<0.005). This means that the cells with the lowest number of proteolytically active CD26 molecules had the highest affinity for the synthetic substrate. Despite the sixfold difference in CD26 expression, the capacity of Th1 and Th2 cells to cleave the synthetic substrate was hardly different, as shown on the basis of the calculation of virtual fluxes (Figure 7) using the formula

A series of differently restimulated Th1 and Th2 cell lines all showed the same phenomenon at day 3 of restimulation. CD26/DPPIV expression on Th1 cells was threefold higher than on Th2 cells, whereas DPPIV activity per CD26/DPPIV molecule was twofold higher on Th2 than on Th1 cells (Table 1).
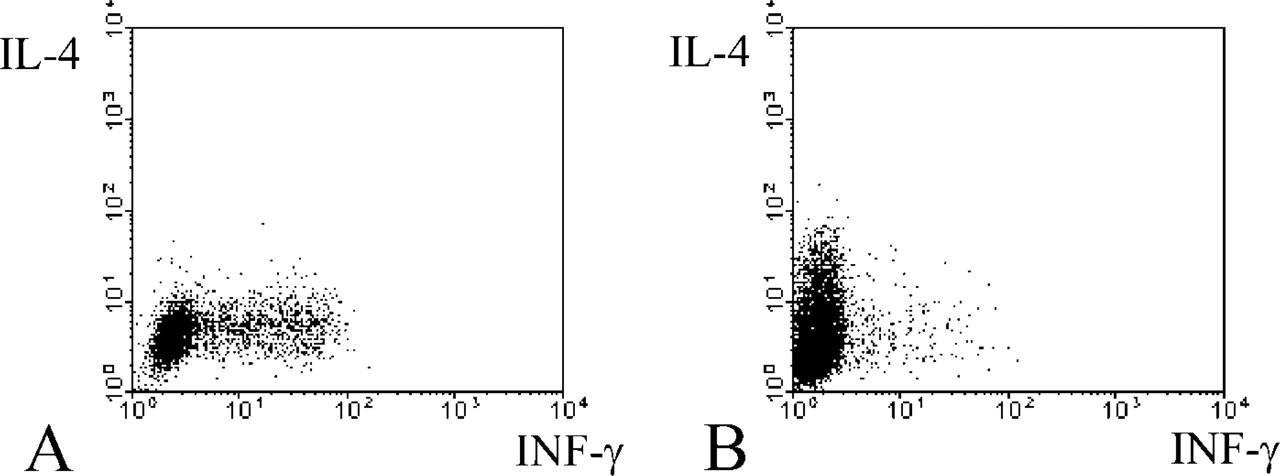
Flow cytometric analysis of cytokine production. Analysis of Th1 and Th2 cell lines polarized during 11 days was performed by immunofluorescence double labeling of intracellular IFN-γ, which was mainly produced by Th1 cells (
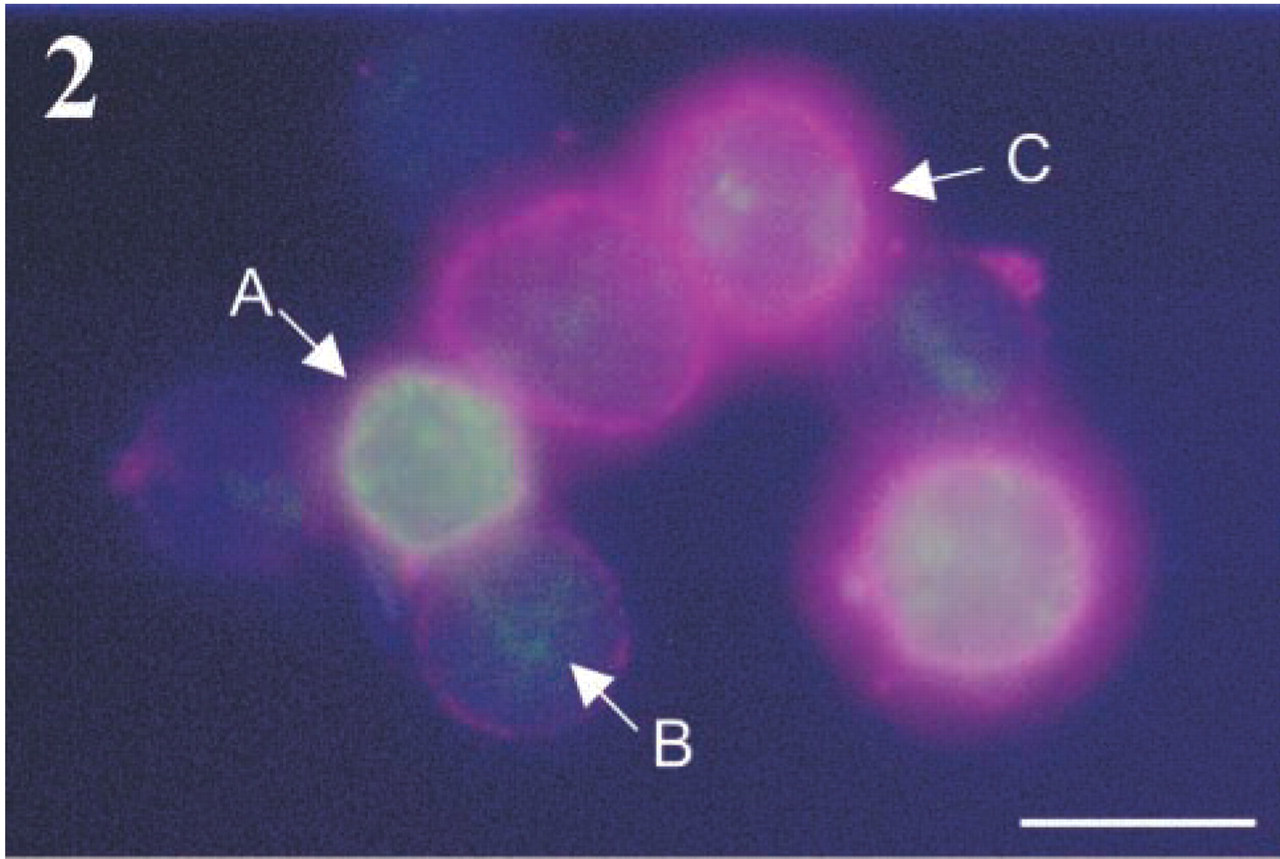
Triple labeling of a mixture of Th0, Th1, and Th2 cells. Green fluorescence (FITC) represents intracellular IFN-γ, blue fluorescence (PE) represents intracellular IL-4, and red fluorescence (Cy5) represents extracellular CD26/DPPIV. High CD26/DPPIV expression (Th1, A) is associated with IFN-γ production, whereas low CD26/DPPIV expression (Th2, B) is associated with IL-4 production. Th0 cells show intermediate CD26/DPPIV expression (C). Bar = 15 μm.
To demonstrate specificity of the synthetic substrate for DPPIV activity, native samples of total cell lysates were made and separated by gel electrophoresis. Western blotting (Figure 8A) confirmed the sixfold difference in CD26/DPPIV expression levels between Th1 and Th2 cell lines, which is in agreement with the flow cytometric data (Figure 5). Similarly, zymography with the use of 20 μM ala-pro-cresyl violet revealed a major band of active protein in both samples (Figure 8B), which corresponded with the molecular weight of the native CD26/DPPIV protein (140 kD), and a faint band of the dimerized protein. Th1 cells showed twofold higher activity against 20 μM substrate than Th2 cells, which is in agreement with the spectrofluorometric analysis shown in Figure 6B.
To test the signal transduction function of CD26/DPPIV, its co-stimulatory function in anti-CD3-induced proliferation was monitored by CD26 cross-linking and [3H]-TdR incorporation, applying a threefold serial dilution of anti-CD3 in the absence or presence of anti-CD26. Figure 9 shows a six- to ninefold higher sensitivity of Th1 cells than of Th2 cells for CD26 crosslinking, which is consistent with the sixfold difference in CD26 expression between Th1 and Th2 cells. This correlation between CD26 expression and co-stimulation of proliferation has been described previously (Ulmer et al. 1992).
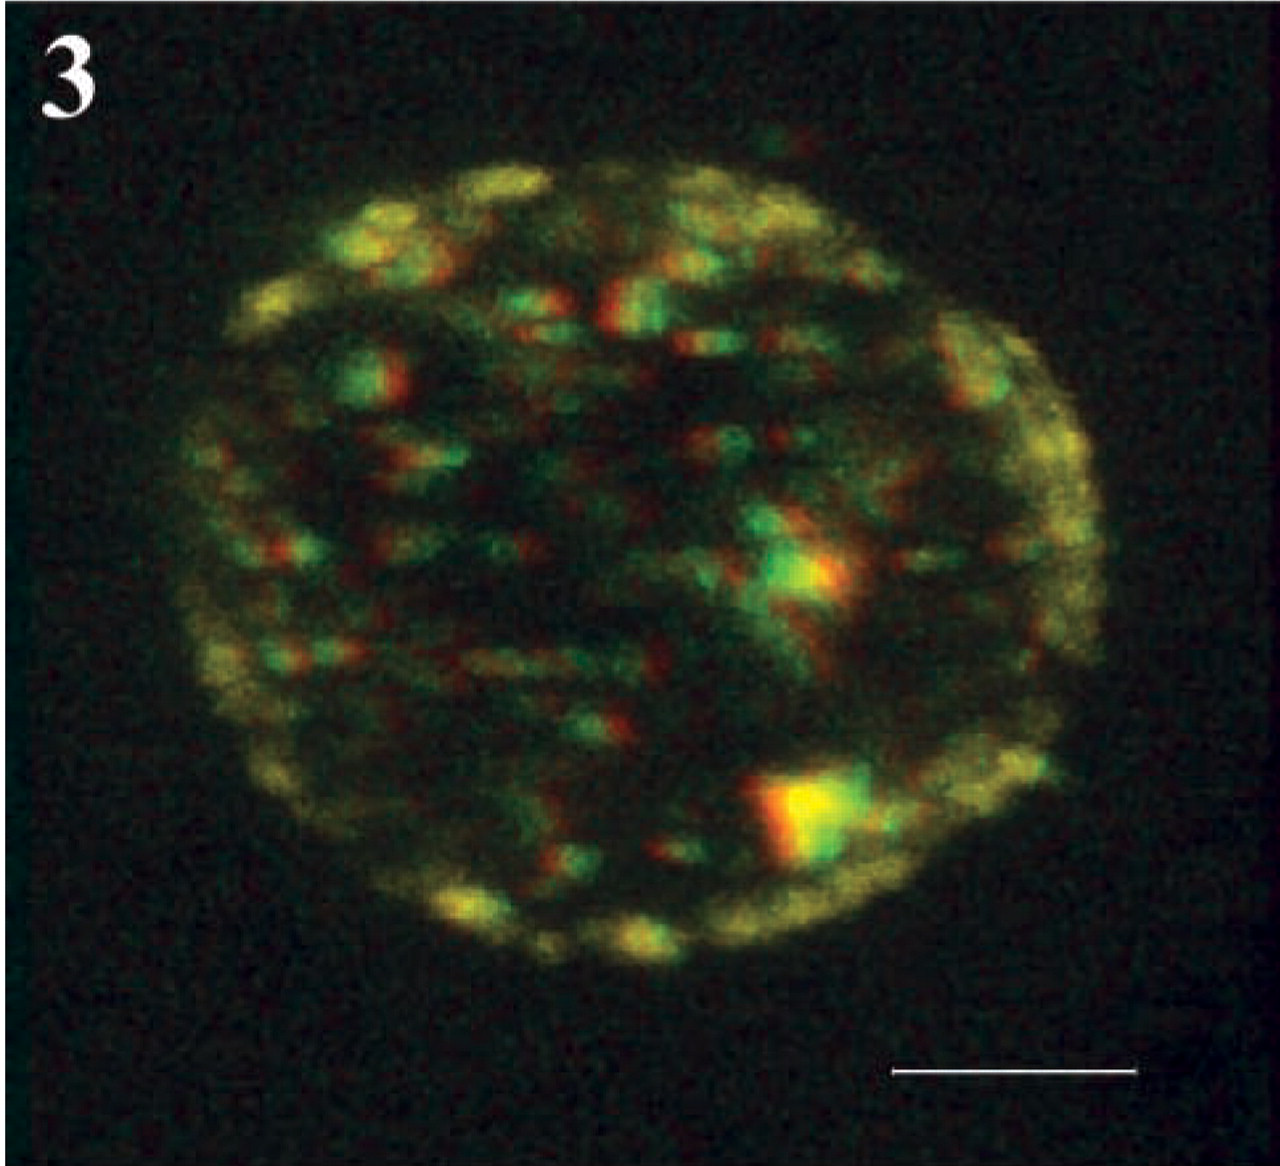
Red and green stereo pair of two maximal intensity projections of a confocal stack at an angle of 6° of a living Th1 cell after staining with an FITC-conjugated anti-human CD26/DPPIV MAb, resulting in a 3-D representation of CD26/DPPIV expression on a living Th1 cell when observed with anaglyph glasses. Bar = 4 μm.
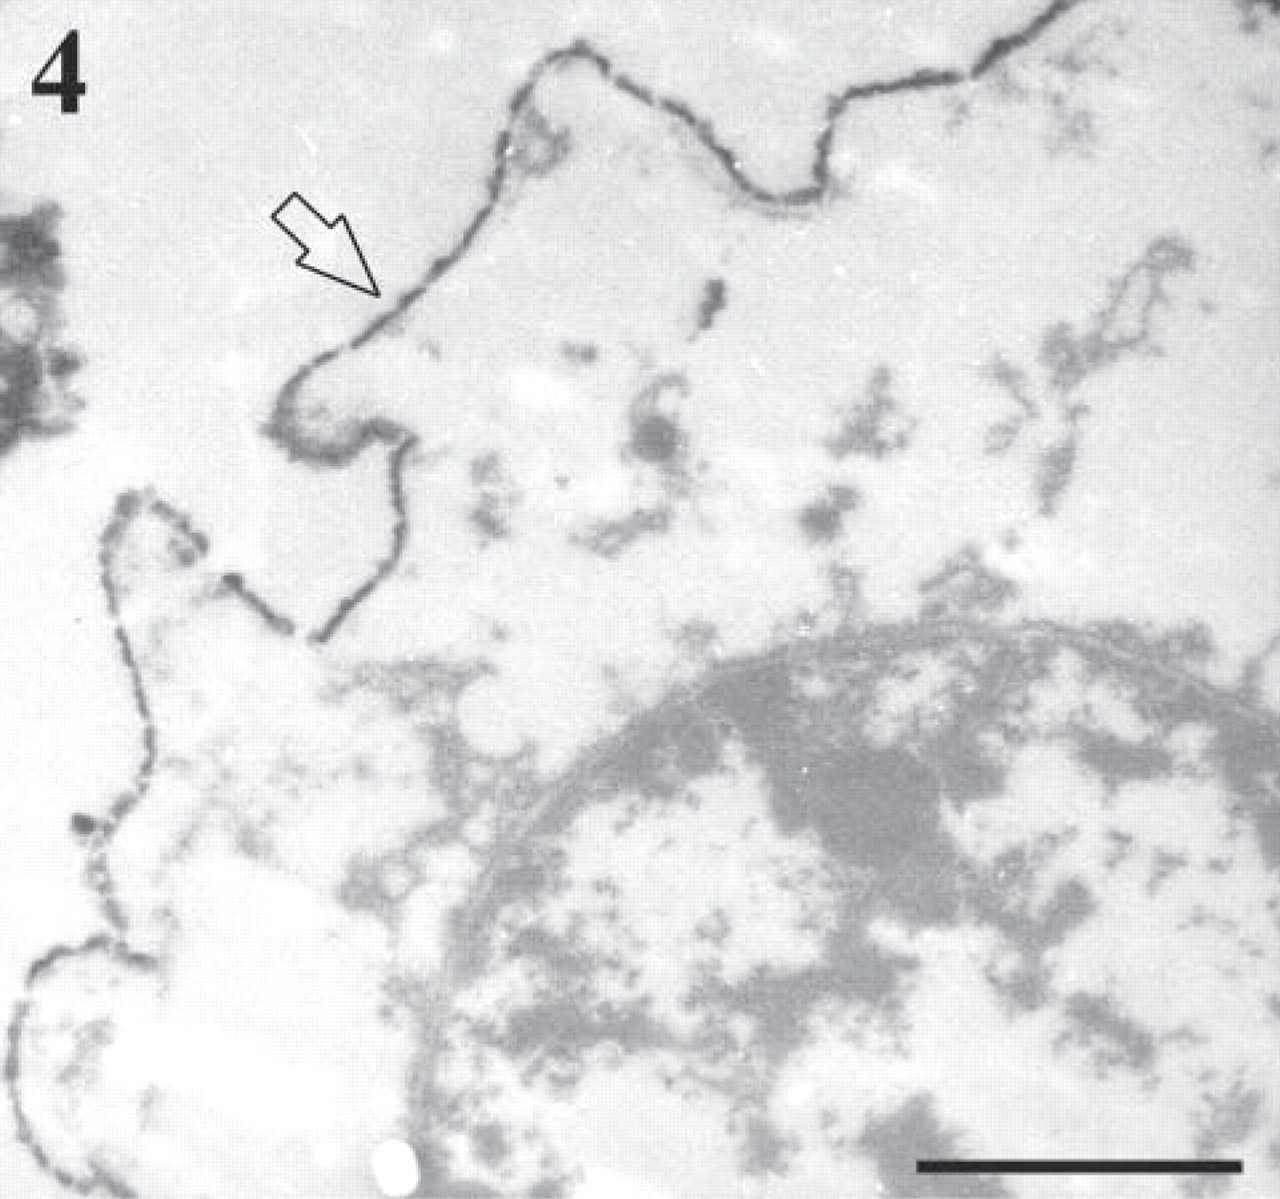
Electron micrograph of a Th1 cell that has been incubated with ala-pro-MNA and hexazotized pararosanilin as coupling reagents to detect DPPIV activity. Final reaction product is present only at the plasma membrane (arrow). Bar = 3 μm.
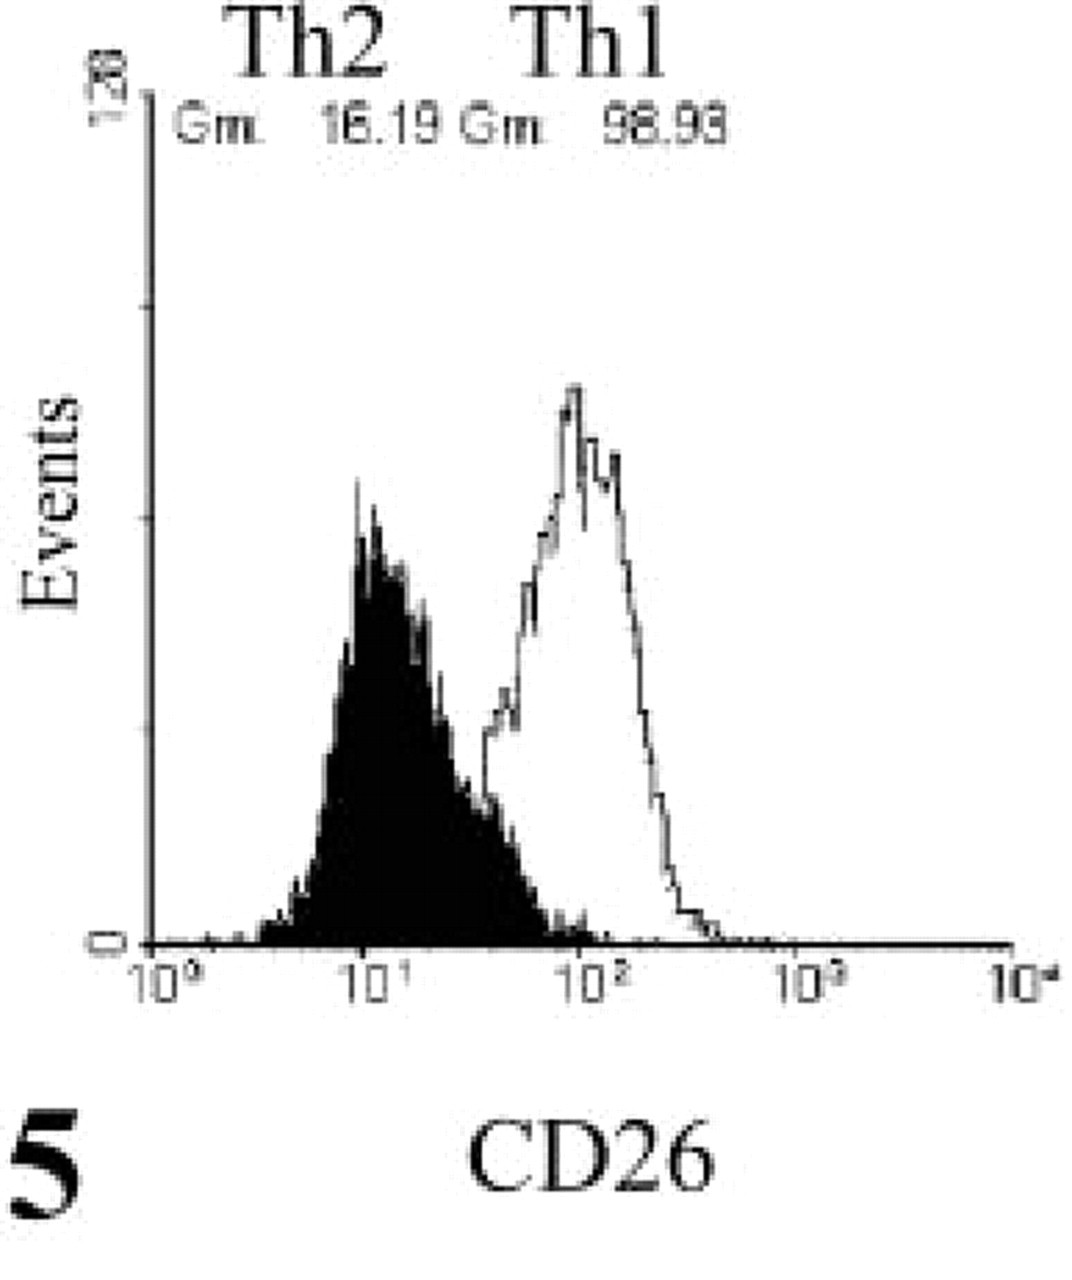
Flow cytometric analysis of CD26 expression. FACS analysis was performed with FITC-labeled mouse anti-CD26 antibody on Th1 cells and Th2 cells at day 3 after restimulation, showing a sixfold difference in CD26 expression (98.9 U vs 16.2 U).
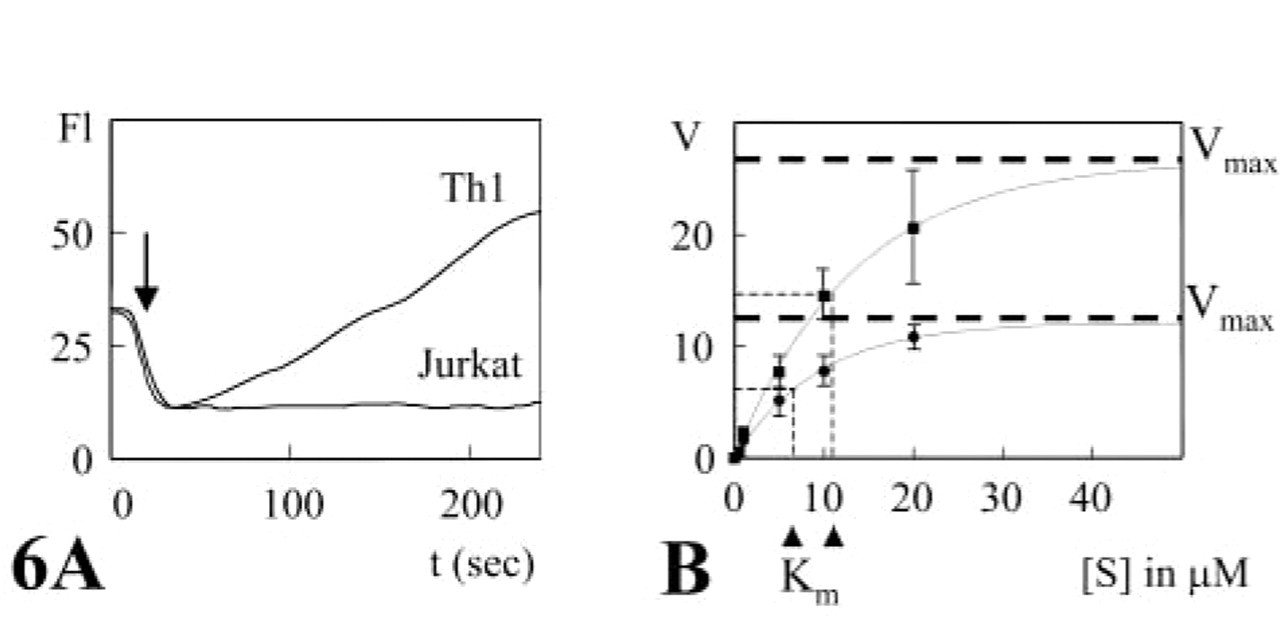
DPPIV activity in living Th1 and Th2 cells and in Jurkat cells lacking CD26/DPPIV expression. (
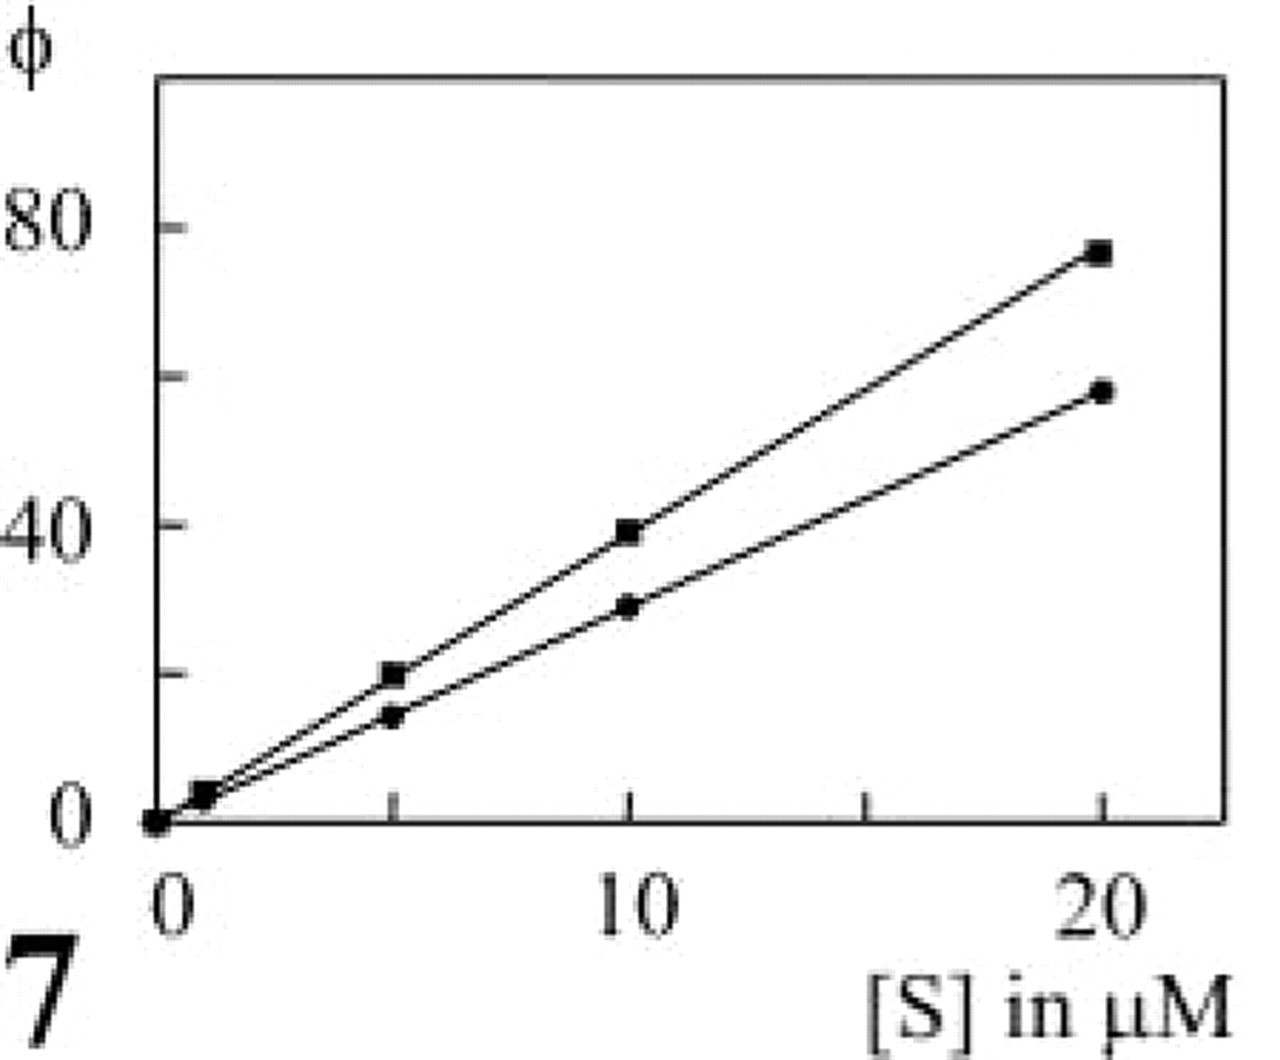
Virtual flux of DPPIV on living Th1 and Th2 cells. Flux, Vmax ([S]/Km + [S]), was calculated on the basis of the data in Figure 6. Differences in both Vmax and Km values of DPPIV on Th1 (▀) and Th2 (•) cells resulted in a similar capacity to process the synthetic substrate alapro-cresyl violet at physiological substrate concentrations.
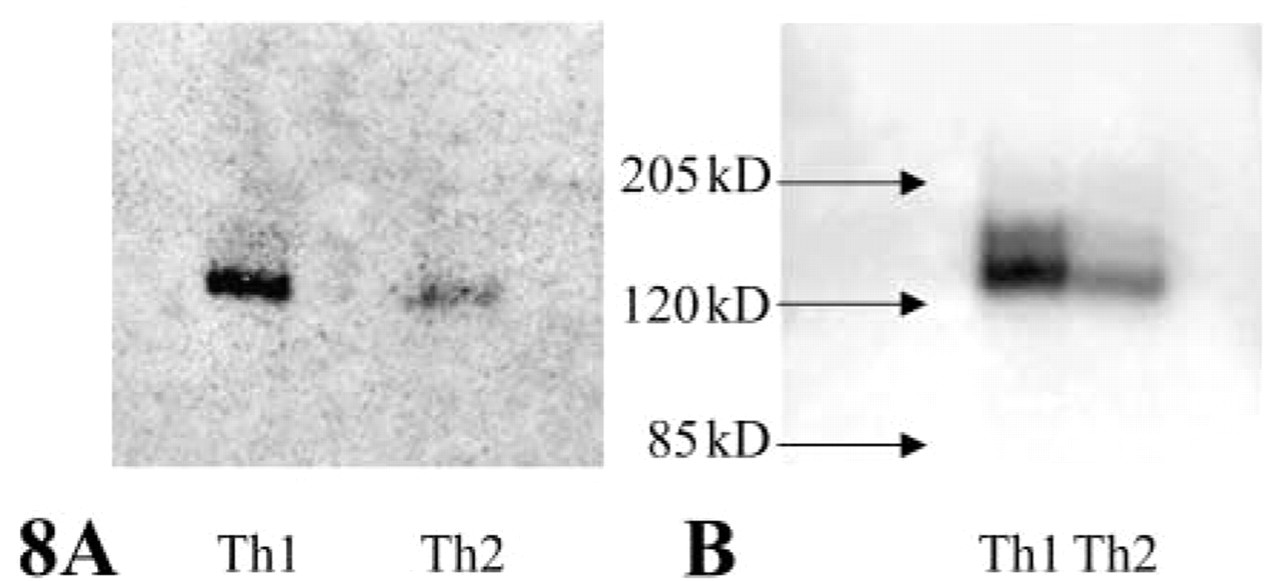
Western blot of CD26 and zymogram of DPPIV activity on Th1 and Th2 cells. (
Discussion
The signal transduction function and proteolytic activity of CD26/DPPIV were studied on activated living T-cells to investigate whether or not the regulation of enzymatic DPPIV activity depends on the regulation of CD26 protein expression. We studied simultaneously expression of the protein and activity of the proteolytic enzyme in the two different types of polarized Th cells that are involved in cellular (Th1) and humoral (Th2) immune responses and are known to express different levels of CD26 (Willheim et al. 1997). We found that the proteolytic activity of CD26/DPPIV is kept at a steady functional level despite a three- to six-fold difference in CD26 expression.
Relatively few enzymes have the ability to cleave proline-containing peptide bonds and might contribute to the proteolytic activity observed in the Th1 and Th2 cells. These include peptidases such as dipeptidyl peptidase II (DPPII), attractin (Duke-Cohan et al. 1995; Tang et al. 2000), prolylcarboxypeptidase (PCP) (Tan et al. 1993), and quiescent cell proline dipeptidase (QPP) (Underwood et al. 1999). Most of these peptidases are located intracellularly, and our EM study revealed no intracellular formation of final reaction product. Moreover, none of these peptidases contributed significantly to formation of cresyl violet fluorescence, because living Jurkat cells that lack CD26/DPPIV expression did not produce any fluorescence when incubated in the presence of ala-pro-cresyl violet. Therefore, the similar DPPIV activity in Th1 and Th2 cells has to be explained by differences in kinetic properties of DPPIV. The similarity in banding patterns on the Western blots and zymograms suggests that all DPPIV molecules on a single Th cell were equally active and that inactive isoforms were not present. This was further indicated by fluorescence microscopy of individual living Th cells, simultaneously incubated with the fluorogenic substrate and labeled for CD26 (Boonacker and Van Noorden 2001).
Effects of culture conditions on CD26/DPPIV expression and activity on Th1 and Th2 cell lines a
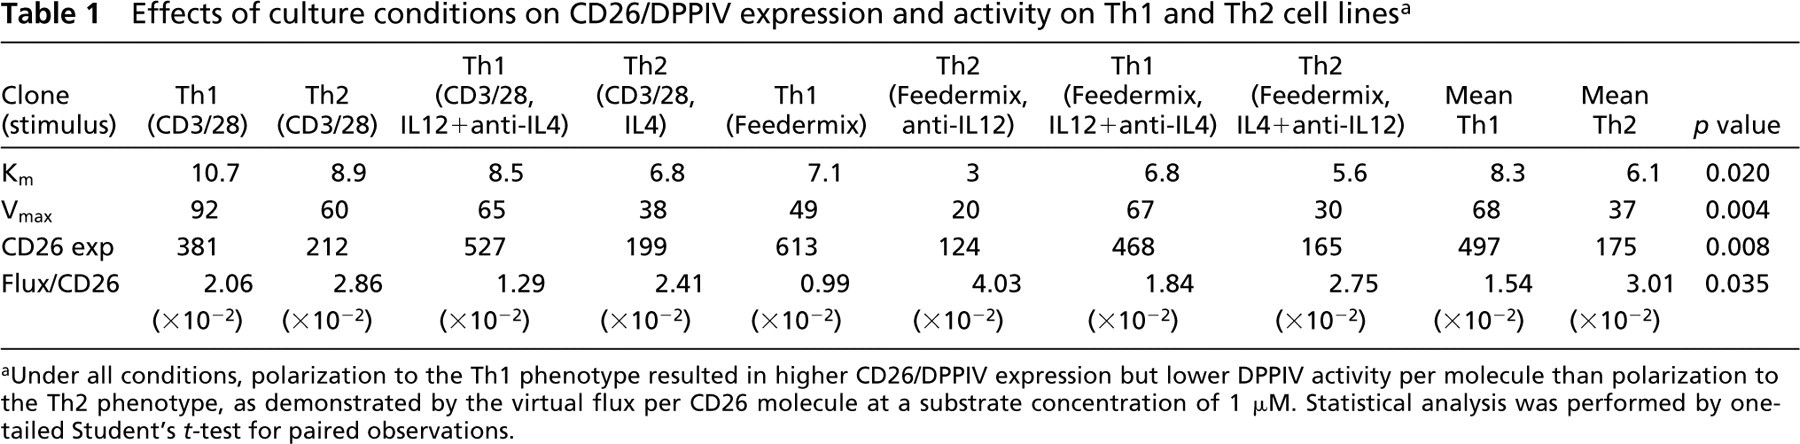
Under all conditions, polarization to the Th1 phenotype resulted in higher CD26/DPPIV expression but lower DPPIV activity per molecule than polarization to the Th2 phenotype, as demonstrated by the virtual flux per CD26 molecule at a substrate concentration of 1 μM. Statistical analysis was performed by one-tailed Student's t-test for paired observations.
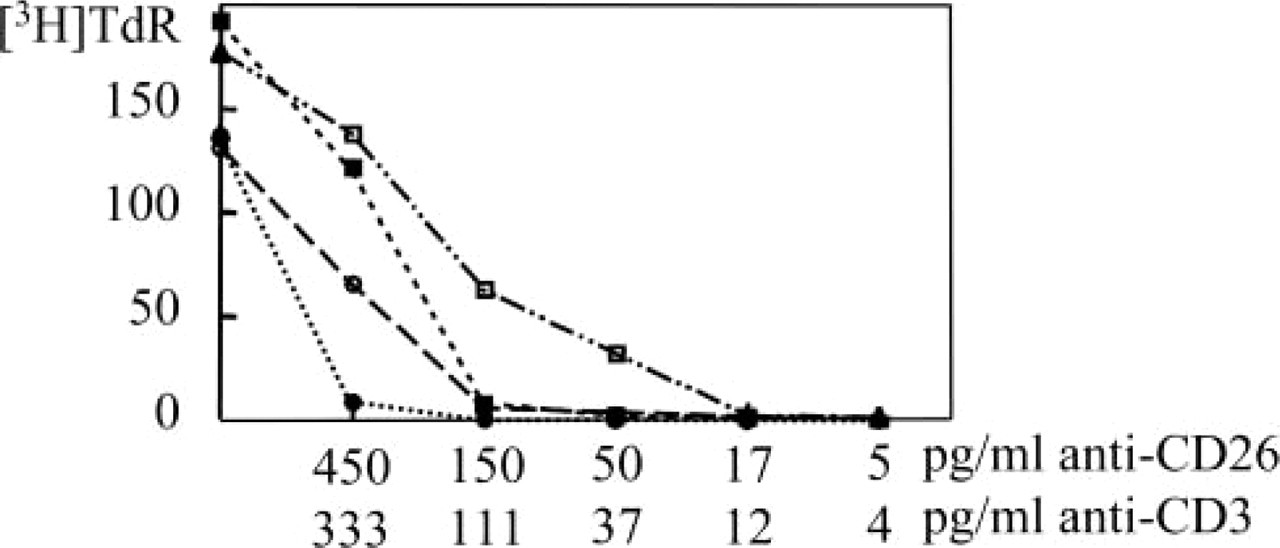
Proliferation assay using [3H]-TdR incorporation. Crosslinking of CD3 only (▀ Th1, • Th2 cells) or of both CD3 and CD26 (□ Th1, ○ Th2) in a serial dilution (each step is a threefold dilution) demonstrating the co-stimulatory effect of CD26 ligation on T-cell proliferation. Additional CD26 crosslinking to CD3 resulted in a six- to ninefold stronger proliferative response in Th1 cells than in Th2 cells.
Our data indicate that differences in signal transduction activity of CD26 do not lead to differences in activation or inactivation of bioactive peptides. Apparently DPPIV activity is kept constant, possibly by regulation at the post-translational level. Therefore, variation of kinetic properties of DPPIV is an adaptional mechanism that keeps DPPIV activity constant, whereas CD26 protein expression is regulated transcriptionally. Post-translational regulation of enzyme activity by variation of kinetic parameters as an adaptational mechanism has been described previously for other enzymes, such as glucose-6-phosphate dehydrogenase and glucose-6-phosphatase (for review see Van Noorden and Jonges 1995). How DPPIV activity is modulated post-translationally is not yet understood and subject to further study. One explanation may be variation in sialylation or glycosylation of the molecule. For example, it is known that HIV infection causes hypersialylation of CD26 (Smith et al. 1998). Sialic acids, by virtue of their negative charge, can bind non-covalently to exposed cationic sites of a peptide. This phenomenon not only may play a role in the binding of positively-charged substrates but also may influence the affinity of DPPIV for its substrates and thereby regulate enzymatic activity (Gutheil et al. 1994).
DPPIV is also necessary for T-cells to proliferate because its activity is involved in the transition from G1- to S-phase, as was demonstrated with Jurkat cells transfected with CD26 without DPPIV activity. CD26+/DPPIV−-transfected Jurkat cells proliferated poorly unless soluble active CD26/DPPIV was added (Tanaka et al. 1994). Normally, DPPIV activity enhances T-cell responses to external stimuli via CD26 and the TCR/CD3 complex (Tanaka et al. 1993). Therefore, it appears that DPPIV activity also has a role in T-cell activation, although it was demonstrated that most of the extracellular part of CD26 can be deleted without affecting its co-stimulatory function, implying that the proximal glycosylation-rich region is sufficient to transduce co-stimulatory signals (Huhn et al. 2000).
In conclusion, our findings indicate that the signal transduction function, but not the proteolytic function of CD26/DPPIV, depends on the expression level of CD26, suggesting that different functions of one and the same molecule can be regulated differentially. This implies separate post-translational regulation of DPPIV activity on top of transcriptional and/or translational regulation of CD26 expression during T-helper cell activation. As far as we know, this is the first report on two functions of one and the same protein that are differentially expressed.
Footnotes
Acknowledgments
We are grateful to Dr Wilma Frederiks for the EM micrograph, Dr Jan van Marle for the confocal micrograph, Ms Dorothea Pronk, MSc, for the triple labeling, Mr Jan Peeterse for the preparation of the microscopic images, and Ms Trees Pierik for preparation of the manuscript.